


Características


¿Tienes alguna pregunta?
Recomendar


5 diapositivas
Benefits of Yoga Infographics
Yoga offers a wide range of benefits for the mind, body, and overall well-being, these also tend to deepen with regular practice. These infographic templates highlight the numerous advantages of practicing yoga. Whether you're a yoga instructor, wellness coach, or health enthusiast, this template provides a comprehensive overview of the physical, mental, and emotional benefits of yoga. The infographics include text boxes, illustrations, and graphs that can be used to promote the advantages of incorporating yoga into one's lifestyle. Compatible with Powerpoint, Keynote, and Google Slides, these are easily customizable.


5 diapositivas
Minimal Watercolor Aesthetic Presentation
Bring a soft artistic touch to your ideas with this clean, watercolor-inspired layout designed for simple, modern storytelling. The slide helps you highlight key points with gentle color accents that feel elegant yet professional, making complex insights easier to follow. Fully compatible with PowerPoint, Keynote, and Google Slides.


6 diapositivas
Dynamic Chart Visual Toolkit Presentation
Visualize data at a glance with the Dynamic Chart Visual Toolkit Presentation. This modern slide set combines revenue boxes, line trends, and circular progress charts to showcase performance metrics or KPIs effectively. Clean, minimal, and fully editable in Canva, PowerPoint, Keynote, or Google Slides—perfect for reports, dashboards, and marketing updates.


5 diapositivas
Energy Sources in The United States Infographics
Energy Sources in The United States Infographics is a bold, colorful, and modern presentation


7 diapositivas
Concentric Circles for Data Representation Infographic
Visualize the hierarchy and relationship of your data with our Concentric Circles Infographic, an invaluable tool for data analysts, strategic planners, and educators. This infographic is designed to represent complex data in an organized, easily interpretable format. Our Concentric Circles Infographic offers a multi-layered approach to data presentation, showcasing the interconnection between different levels of information. It's perfect for displaying structures such as organizational hierarchies, market segmentation, or product feature breakdowns. Customize this infographic to highlight core elements and their dependencies or to showcase the ripple effect of central policies on various organizational branches. This SEO-friendly infographic is crafted to make your data stand out and to facilitate a quick understanding of intricate systems. Employ our Concentric Circles Infographic to bring clarity to your data, making it an insightful resource for reports, presentations, and educational materials.


6 diapositivas
Creative Hexagon Process Flow Presentation
Bring order and creativity together with a sleek, geometric layout that turns complex processes into clear visual stories. This presentation helps you map workflows, stages, or milestones with a modern, connected hexagon flow. Fully editable and compatible with PowerPoint, Keynote, and Google Slides for effortless customization and presentation.


7 diapositivas
Strategy Wheel Infographics Presentation Template
The Strategy Wheel is a tool you can use for your personal life and work life to get clarity on how you create unique value for the world. This strategy seeks to generate consistent value while limiting risk. Use the strategy wheel as a tool to help your company develop unique strategies. Your Strategy Wheel should be a reflection of your purpose and your approach for unique value creation. This template is perfect if you want to center your purpose and evaluate why you and your business exist. This template comes with a variety of different strategy wheels you can customize and make your own.


26 diapositivas
Poseidon Sales Pitch Deck Template Presentation
Unleash your persuasive power with the Poseidon Sales Pitch Deck template! This sleek and modern deck is designed to elevate your pitch, making your business the undeniable choice for potential clients or investors. With a compelling company overview and a clear problem statement, this template sets the stage for presenting your solution as the ultimate answer to your market’s challenges. The deck includes essential slides like competitive landscape analysis, revenue models, and marketing strategies to give your pitch a comprehensive edge. The visually appealing design combined with well-organized sections ensures your message is clear, concise, and impactful. Customize it to fit your brand identity and make your unique selling proposition stand out. Perfect for startups, established businesses, or anyone looking to make a powerful impression, this template is compatible with PowerPoint, Keynote, and Google Slides. Take your pitch to the next level and close those deals with confidence!


20 diapositivas
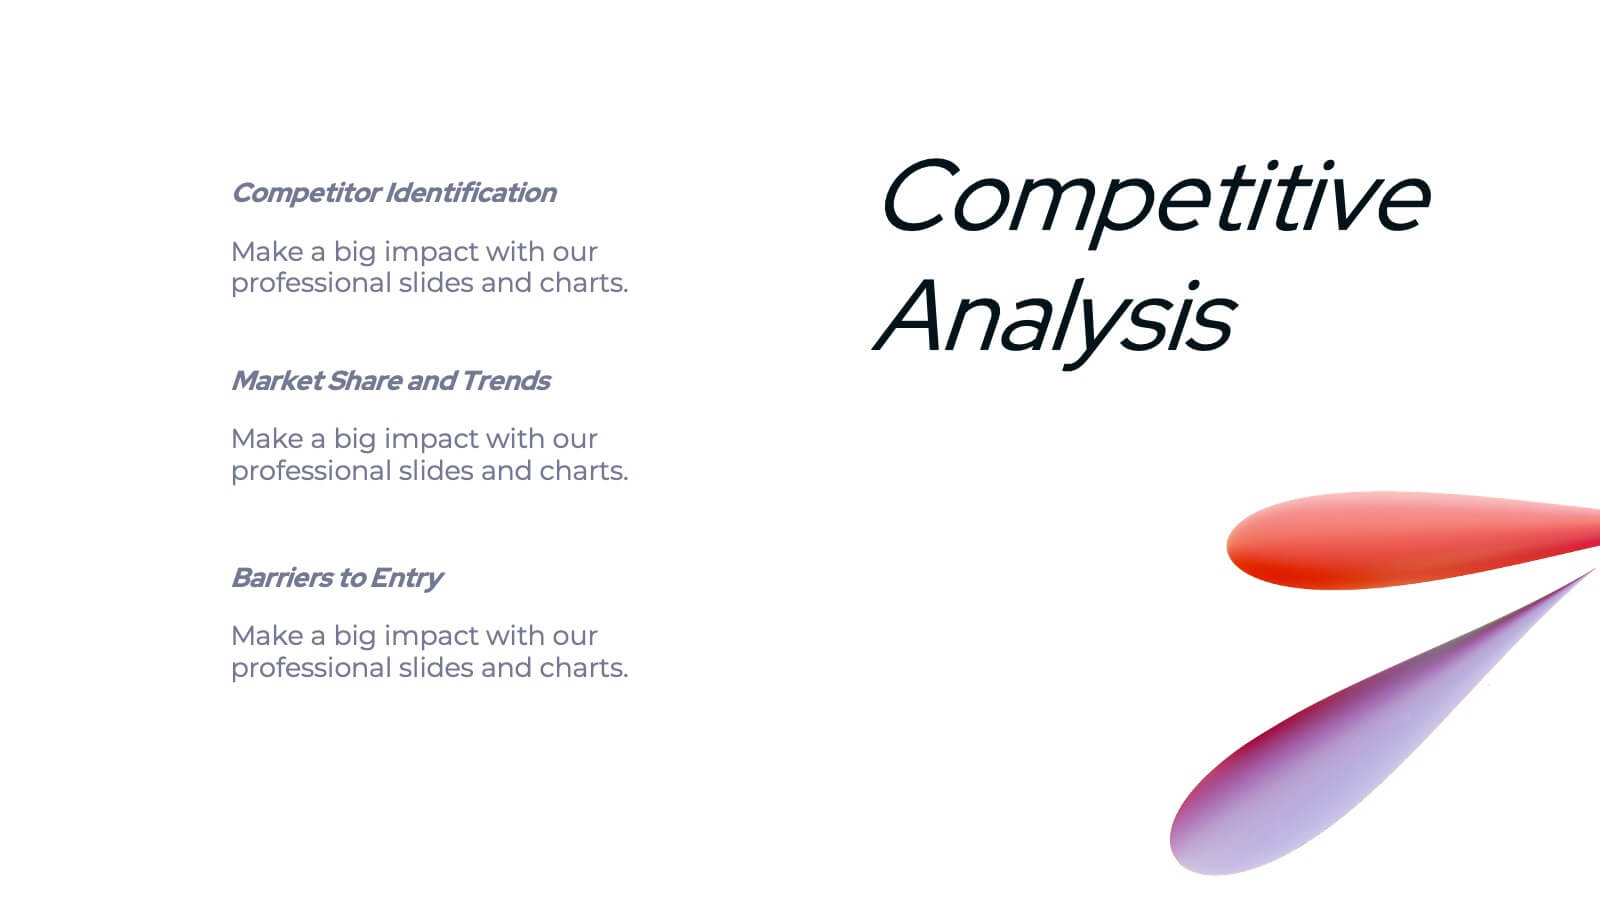
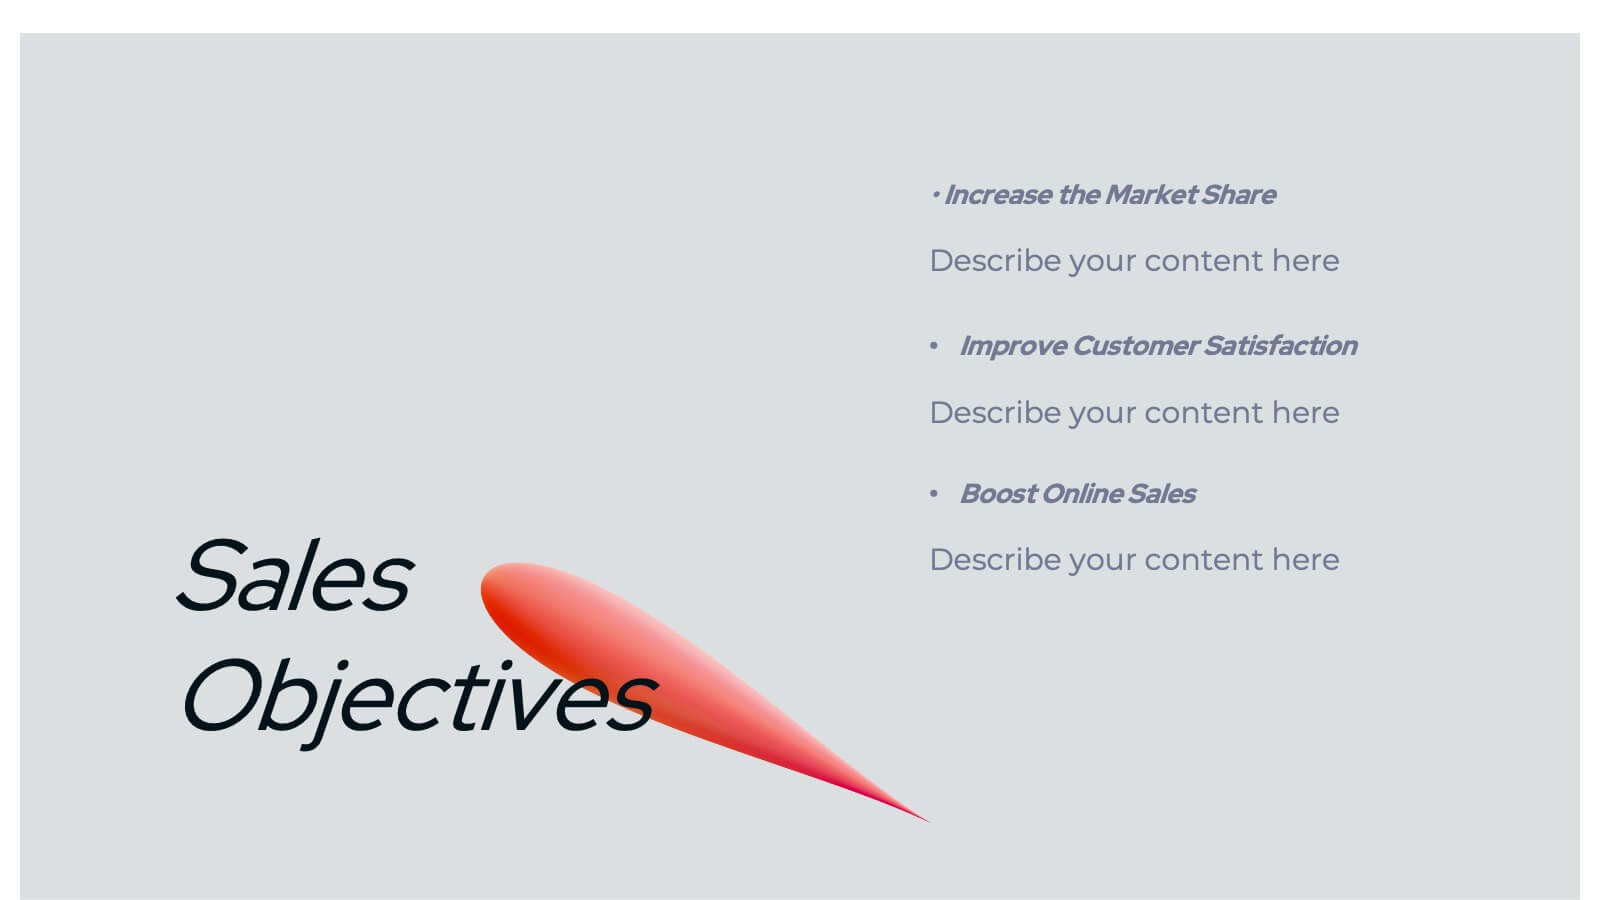
Spark Sales Performance Report Presentation
Deliver insights and strategies with this dynamic sales performance report presentation template. Featuring an elegant and modern design, it provides dedicated sections for agenda setting, company overview, service highlights, and customer value propositions. Present competitive analysis, sales objectives, and performance metrics with ease using clean, structured layouts. Visualize sales processes, team introductions, and pricing strategies through engaging, editable infographics and data slides. The template also includes areas for showcasing promotions, customer testimonials, future opportunities, and actionable next steps. Tailored for sales teams and managers, it offers a professional framework to review and strategize effectively. Fully customizable and compatible with PowerPoint, Google Slides, and Keynote, this template ensures seamless adaptation to your branding and needs. Impress your audience while highlighting achievements and paving the way for future growth!


5 diapositivas
Risk Mitigation Strategies
Visualize your risk response plan with this layered diagram that highlights five strategic levels of mitigation. Each tier features bold directional arrows guiding the viewer from risk source to solution, perfect for decision-makers, auditors, or risk managers. Fully editable and easy to adapt to any industry. Compatible with PowerPoint, Keynote, and Google Slides.


7 diapositivas
RAPID Traceability Matrix Infographic
The RAPID Traceability Matrix infographic template provides a visual tool for mapping out decision-making roles within project management. Compatible with PowerPoint, Google Slides, and Keynote, this template array features various layouts to assign and display the roles of Recommend, Agree, Perform, Input, and Decide across multiple team members and project tasks. Utilizing a clean and organized design, each slide incorporates colored icons and matrix tables to clearly delineate responsibilities. This approach helps in clarifying the decision-making process and ensuring accountability within project teams.


6 diapositivas
5-Level Risk Assessment Diagram Presentation
Simplify complex risk analysis with a clean, layered design that walks your audience through five key levels of impact and probability. Perfect for corporate reports, project management, or strategic planning, this presentation ensures clarity and engagement. Fully compatible with PowerPoint, Keynote, and Google Slides for easy customization.


12 diapositivas
Leadership Development and Growth
Highlight leadership skills with this dynamic radar chart template, ideal for tracking individual or team competencies across six core areas. Use this layout to visualize progress in communication, strategy, vision, influence, adaptability, and accountability. Great for HR reviews, training evaluations, or performance dashboards. Fully editable in PowerPoint, Keynote, and Google Slides.


6 diapositivas
Target Audience Demographics Presentation
The "Target Audience Demographics" presentation employs an innovative spiral chart design to display key demographic data in an engaging and easy-to-understand format. Each segment of the spiral represents a different demographic characteristic with percentages clearly marked, enabling quick insights into audience composition. This design is well-suited for marketing presentations or any scenario where understanding audience segments is crucial. The placeholders are conveniently set up to add specific details or insights, making the template not only visually appealing but also highly functional for strategic planning and audience analysis.


10 diapositivas
Financial Investment Strategy Presentation
Bring your financial ideas together with a clean, puzzle-style layout that instantly makes complex strategies feel organized and actionable. This presentation helps you explain key components, compare performance drivers, and present investment plans with clarity and confidence. Easy to edit and fully compatible with PowerPoint, Keynote, and Google Slides.


5 diapositivas
Empathy to Ideation Process Framework Presentation
Visualize the journey from understanding user needs to generating innovative ideas with the Empathy to Ideation Process Framework Presentation. This slide features a side-profile silhouette and five clear, horizontal stages, each representing a key step in design thinking. Ideal for innovation workshops, UX strategy sessions, or educational use. Fully editable in Canva, PowerPoint, Google Slides, and Keynote.


5 diapositivas
RACI Matrix Responsibility Breakdown Presentation
Visualize roles and responsibilities with this RACI Matrix slide. Clearly assign who is Responsible, Accountable, Consulted, or Informed across key tasks. Ideal for project planning and team alignment, this editable layout helps avoid confusion and ensures accountability. Perfect for PowerPoint, Keynote, or Google Slides in any business context.