


Características


¿Tienes alguna pregunta?
Recomendar


6 diapositivas
Strategic Planning with PESTEL Presentation
Dive into comprehensive environmental scanning with our "Strategic Planning with PESTEL" presentation template. This layout meticulously breaks down Political, Economic, Social, Technological, Environmental, and Legal factors, enabling thorough market analysis and strategy formulation. Perfect for strategists and analysts, the template supports PowerPoint, Keynote, and Google Slides, facilitating a dynamic and engaging planning session.


7 diapositivas
Growth Challenges Infographic
Navigating the path to success often involves understanding both growth and challenges. The growth challenge infographic, adorned in refreshing shades of green, white, and blue, provides an intuitive representation of these dual trajectories. Whether you're a startup striving for market traction or an established entity mapping out expansion strategies, this template crystallizes your journey. Business analysts, strategy consultants, and team leads will find this tool invaluable for driving insights and fostering discussions. Enhanced for compatibility with PowerPoint, Keynote, and Google Slides, this infographic is your visual ally in narrating business tales.


6 diapositivas
Amortization Schedule Infographic
An amortization schedule is a detailed table that outlines the repayment of a loan over time. This infographic can be a helpful way to visually explain the repayment schedule of a loan or mortgage. Divide it into sections, including an introduction, explanation of terms, example calculations, and key takeaways. Compatible with Powerpoint, Keynote, and Google Slides. Use icons or visuals to represent loan-related concepts, such as a house for mortgages, a money bag for payments, or a graph for interest rates. The line graphs included can show the decreasing principal balance over time, with interest and principal portions highlighted.


21 diapositivas
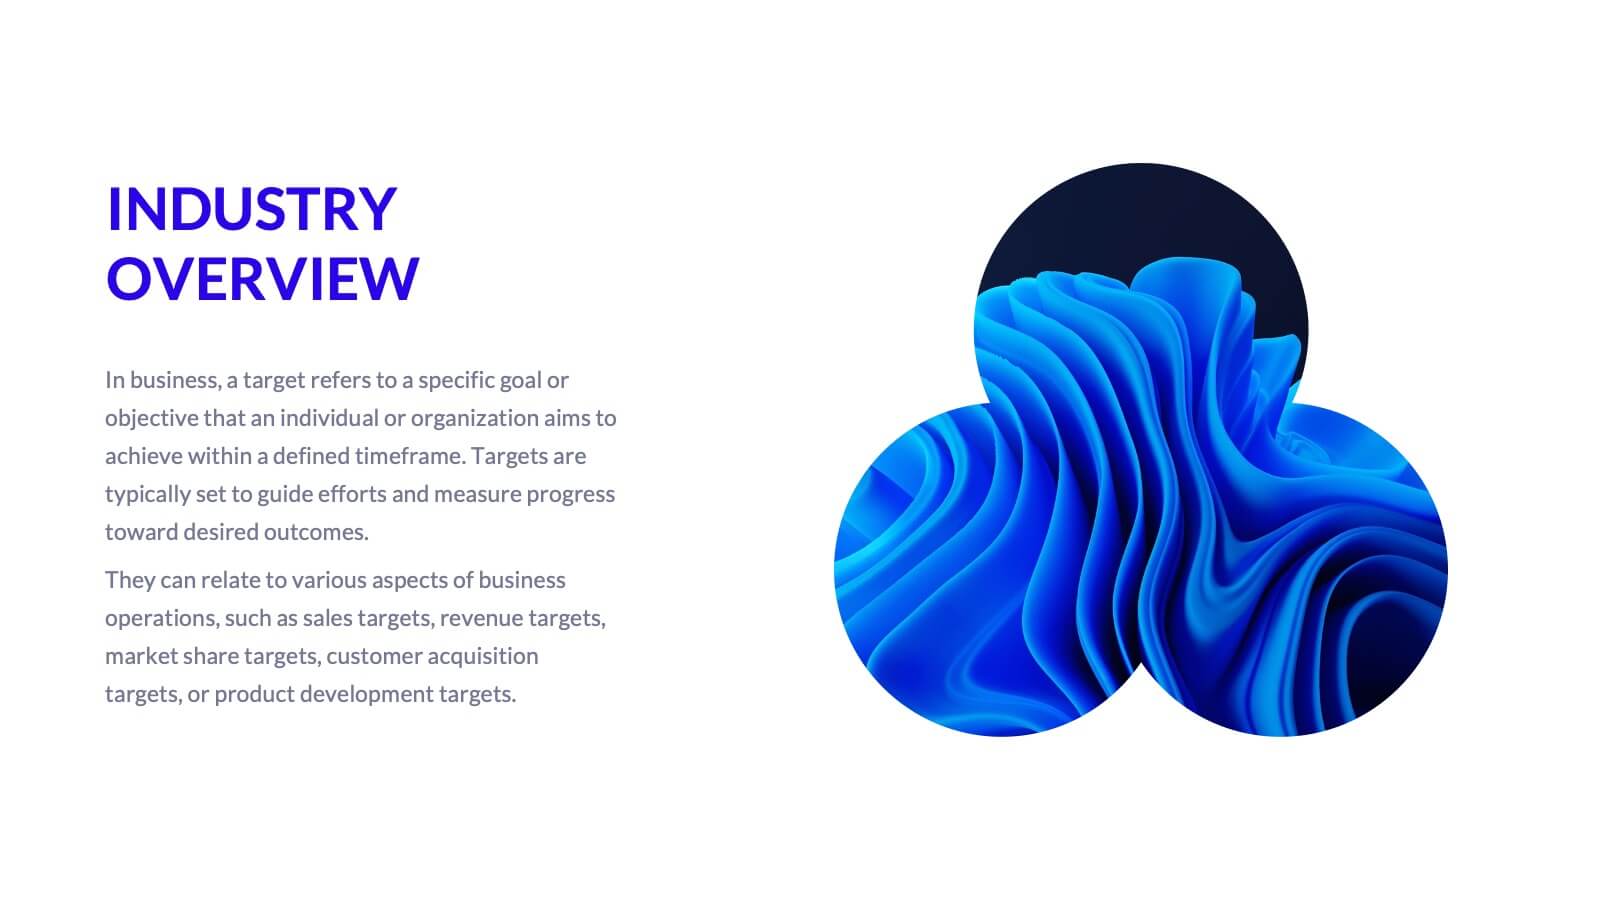
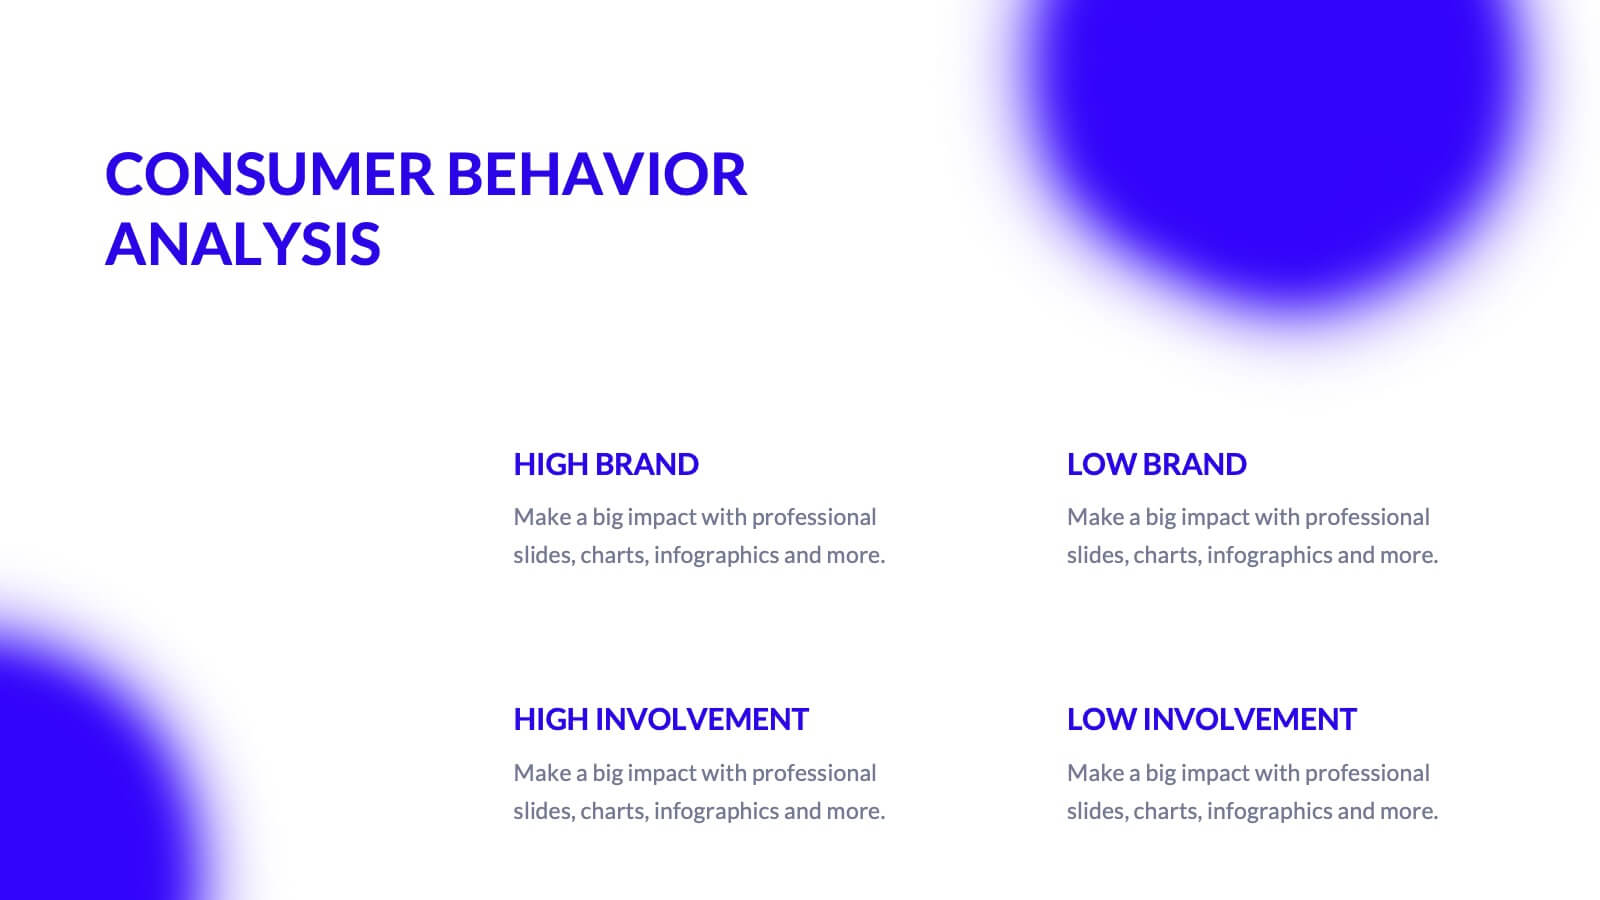
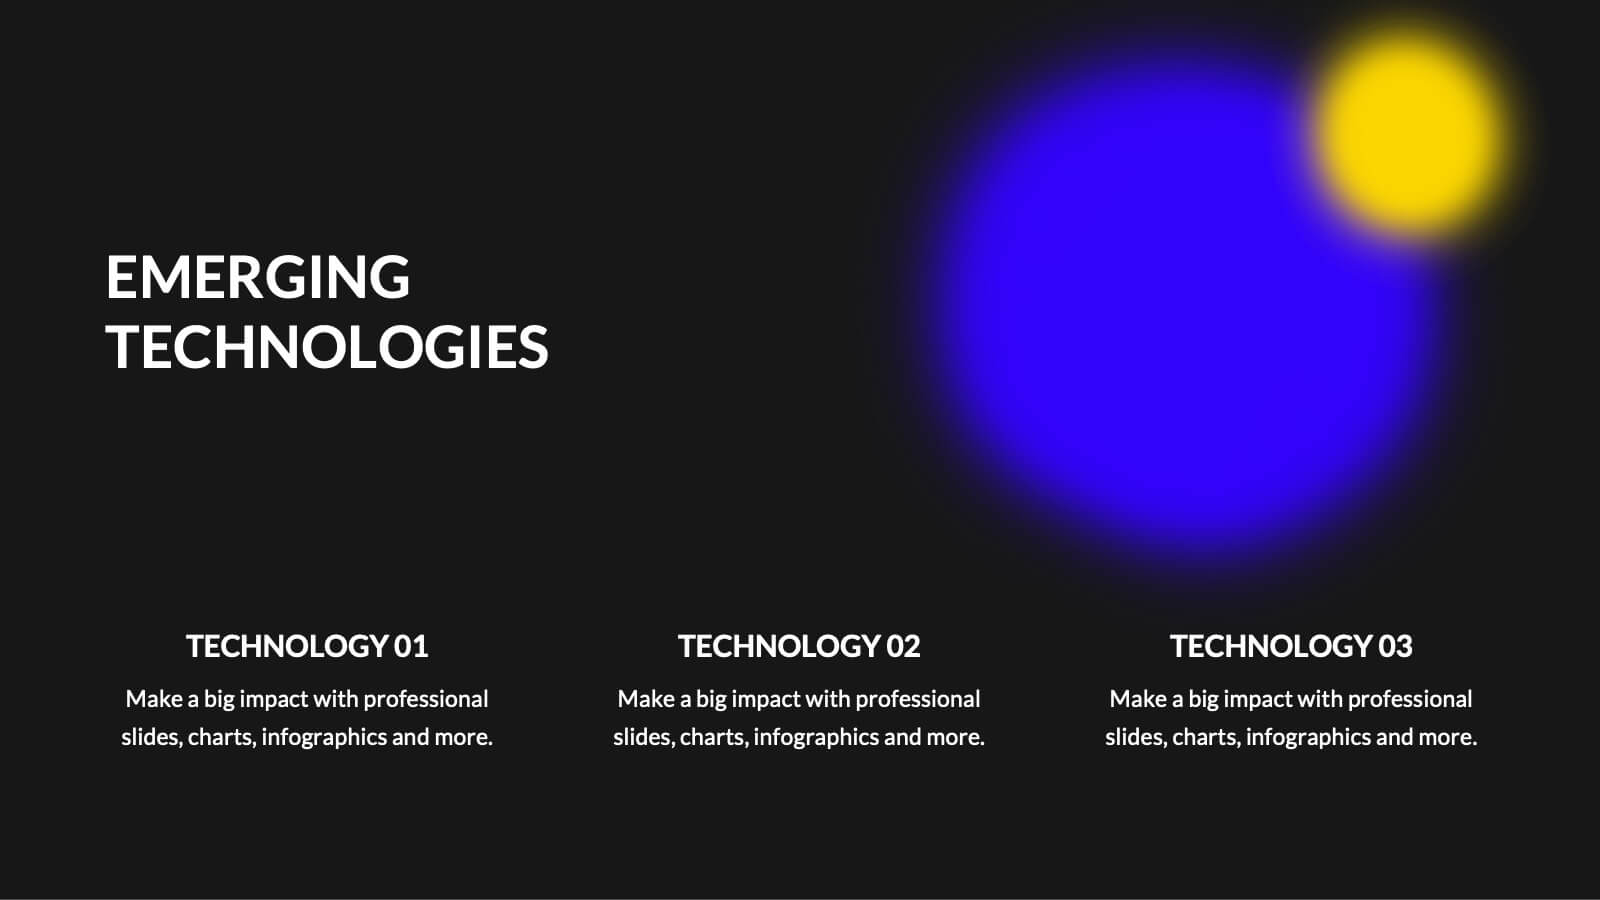
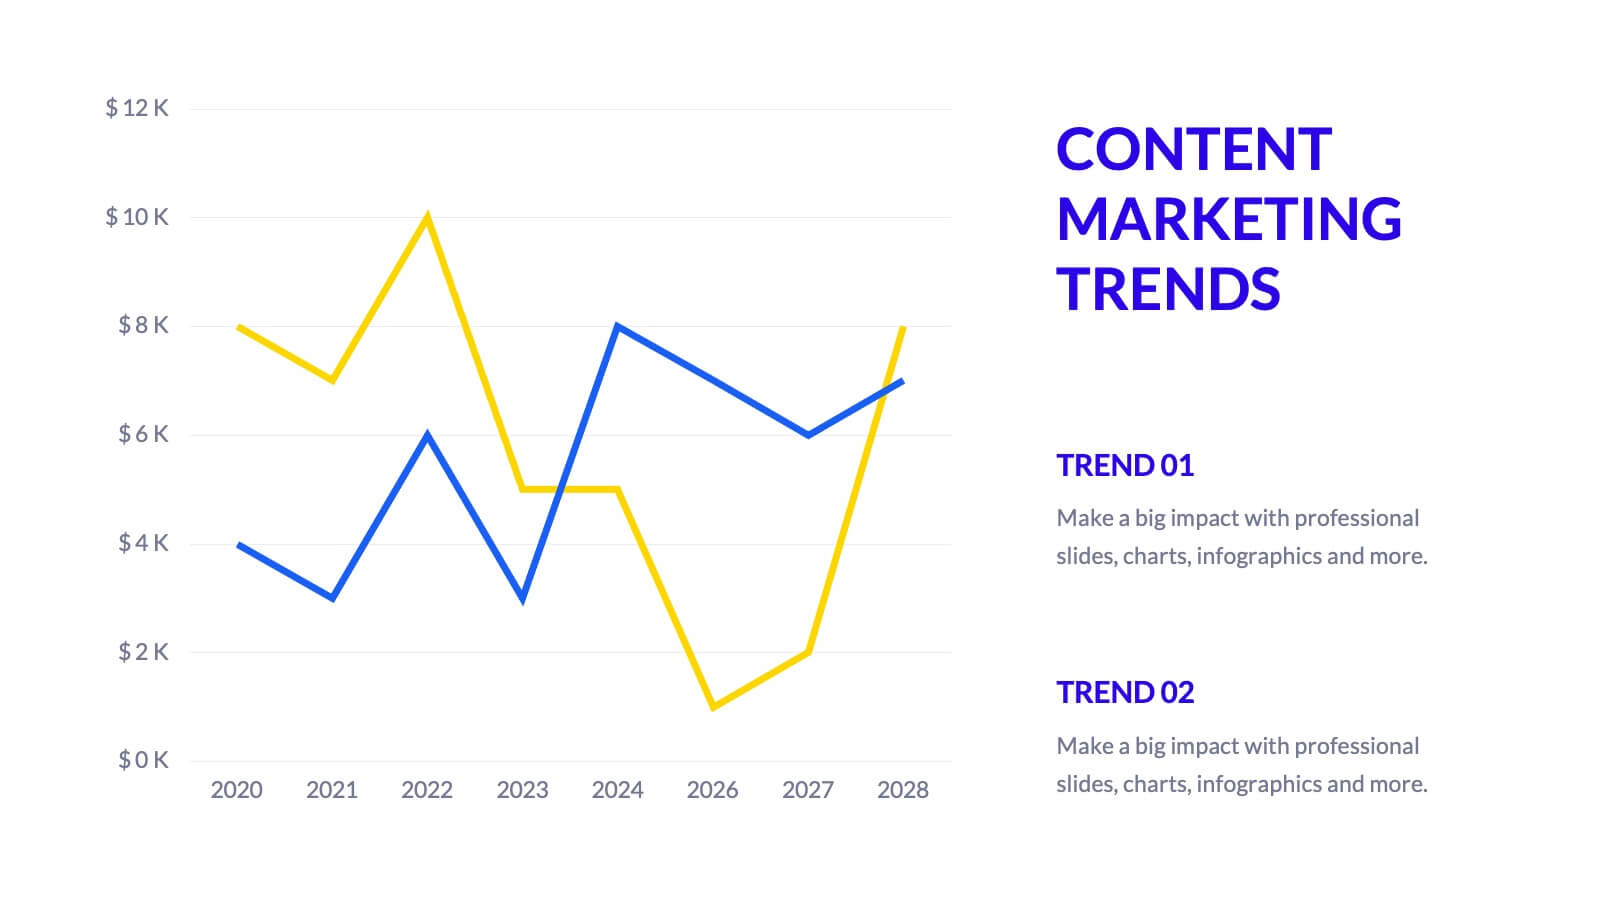
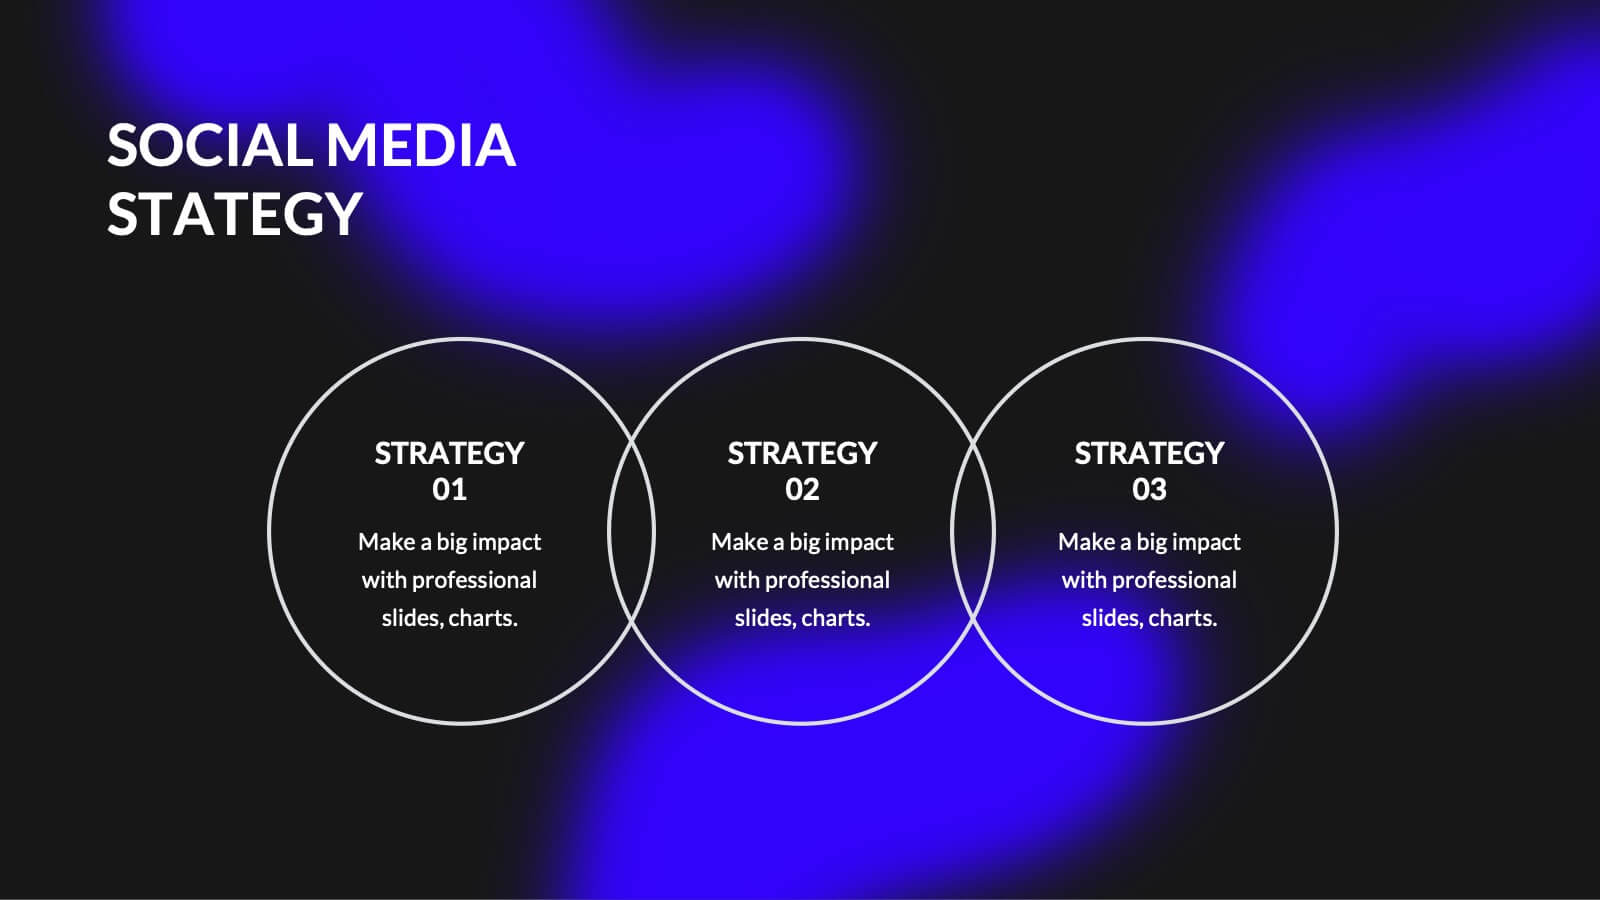
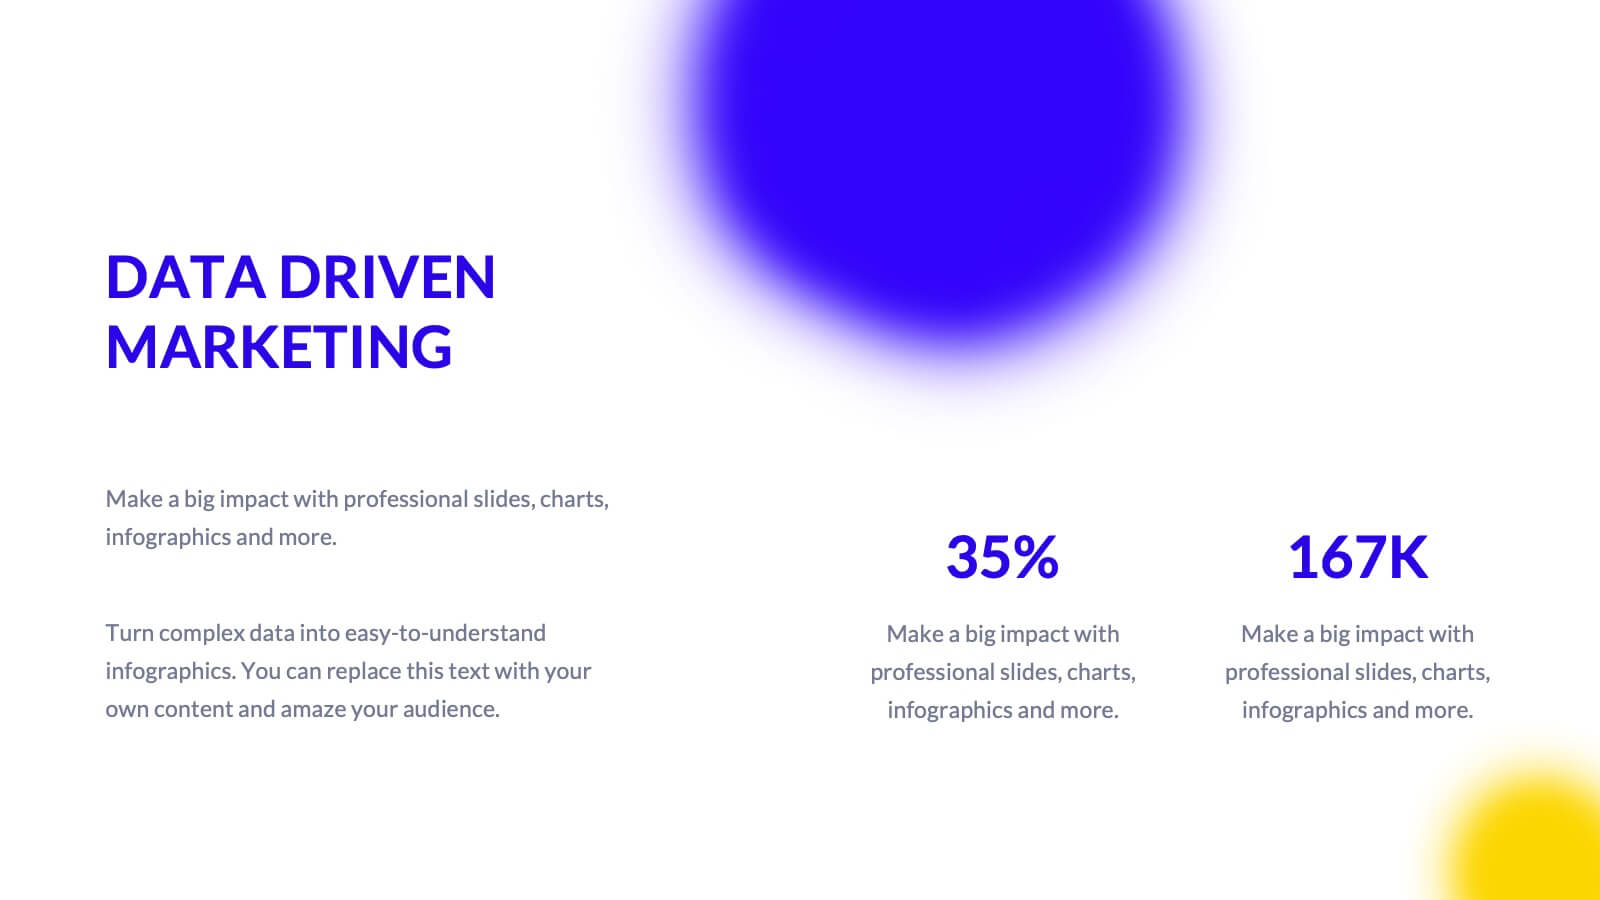
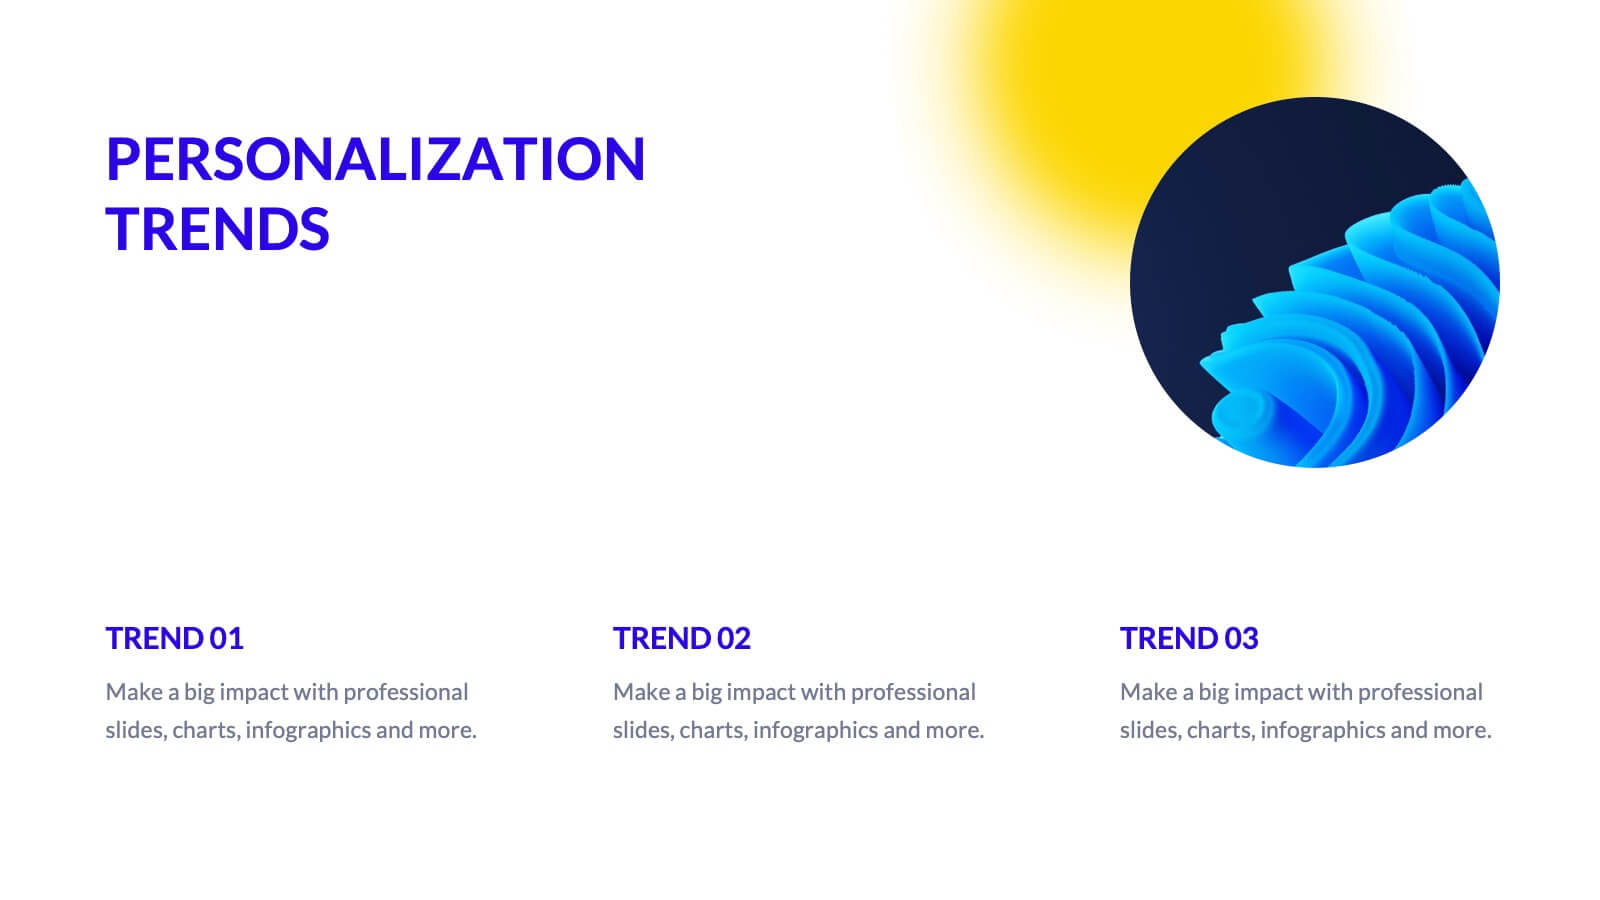
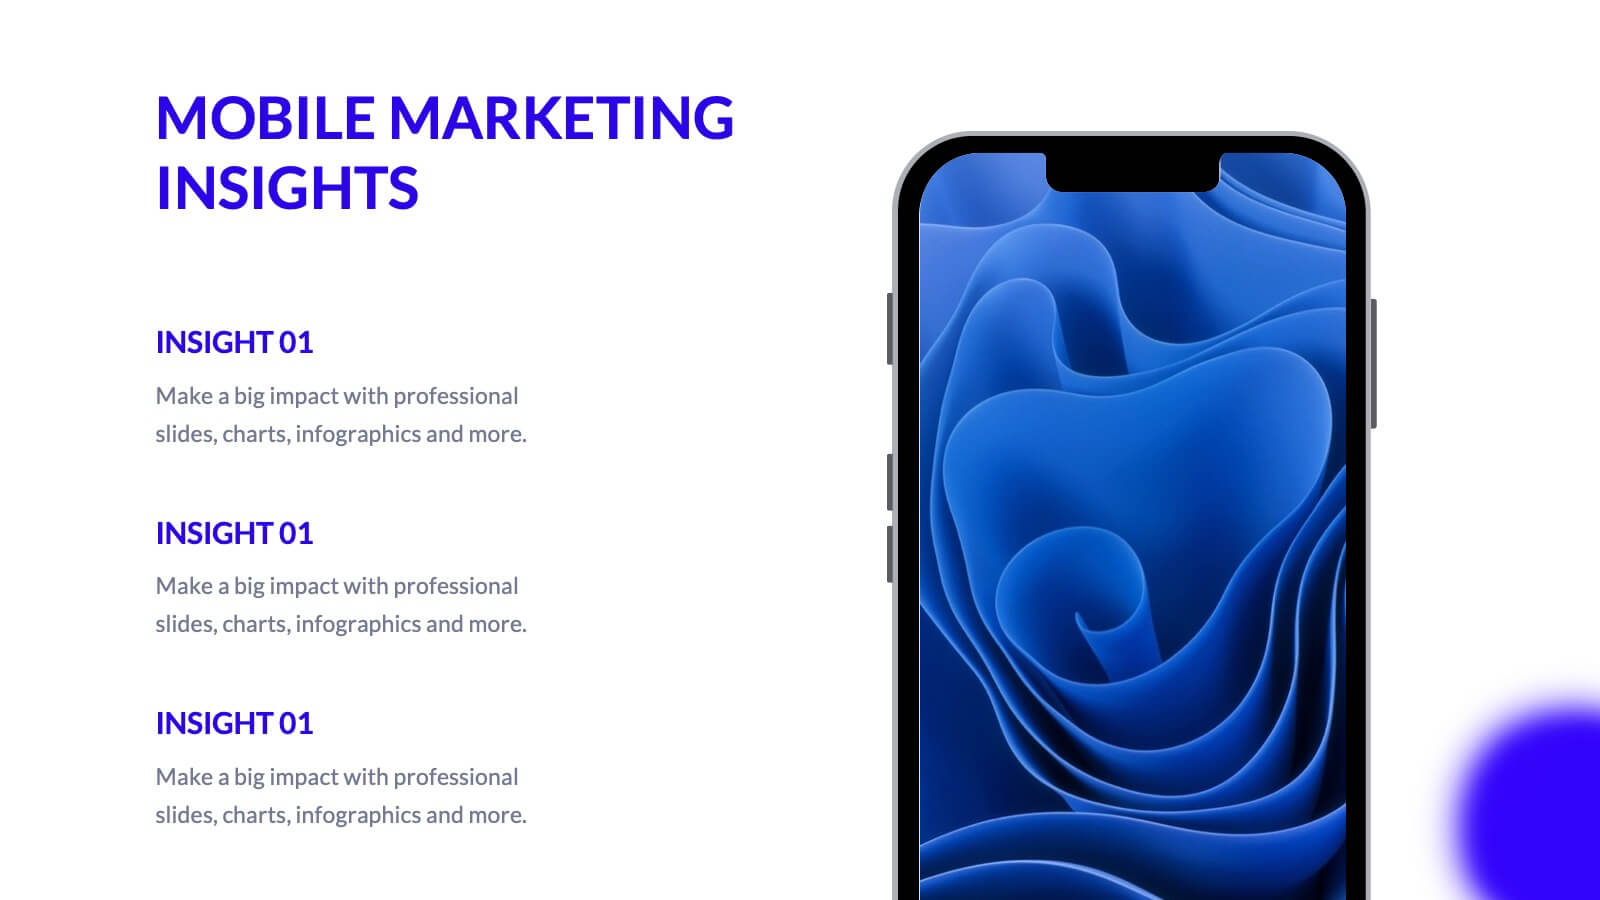
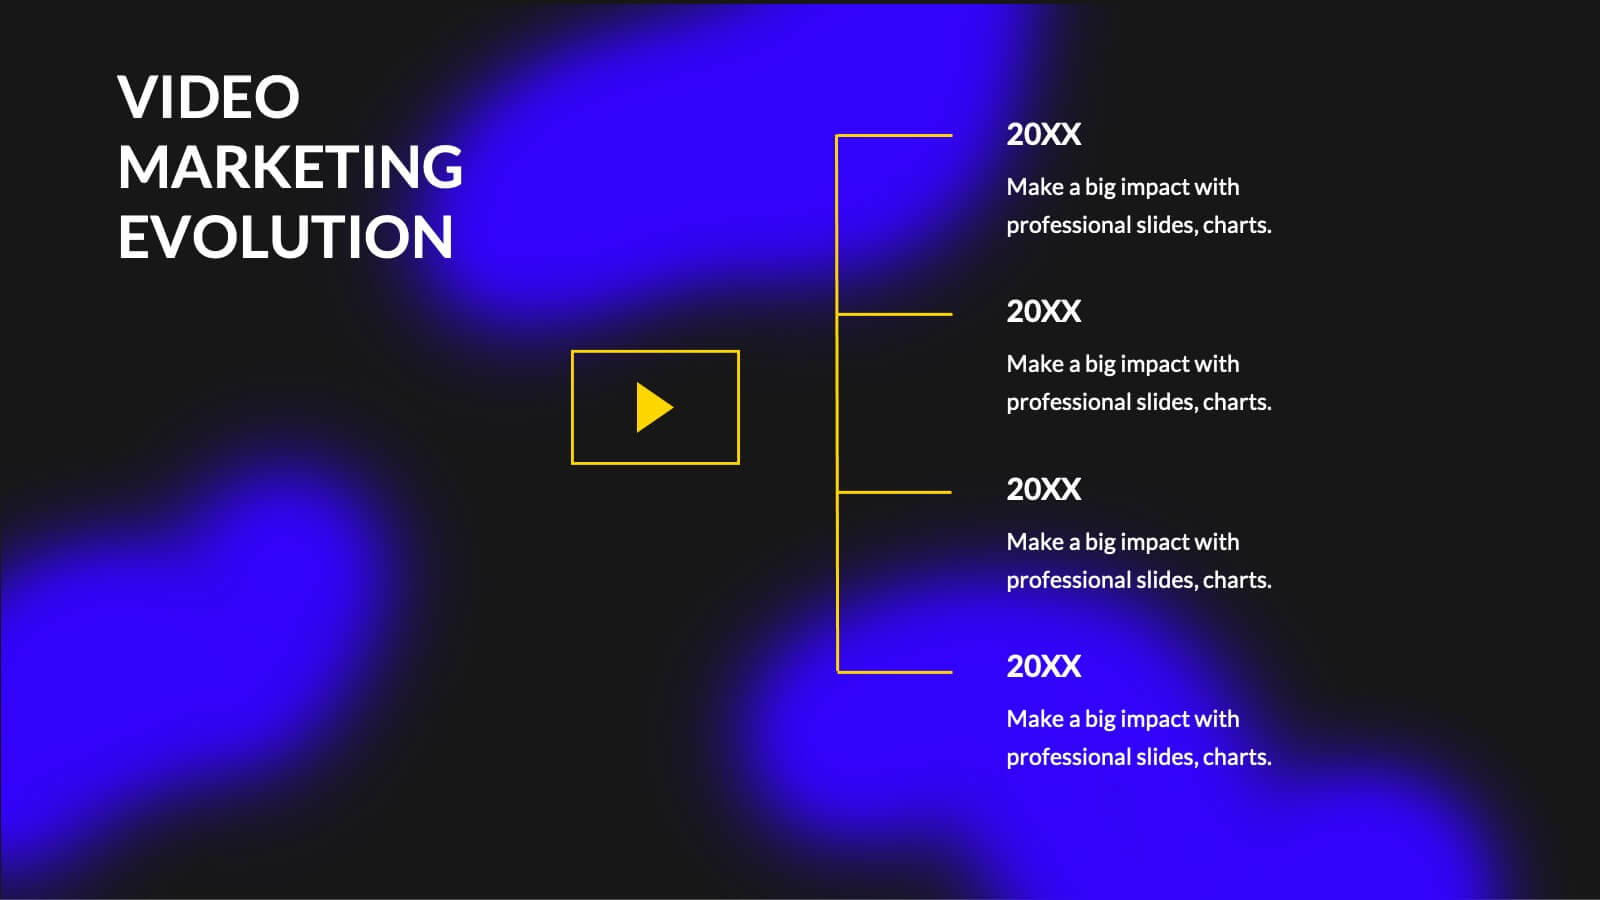
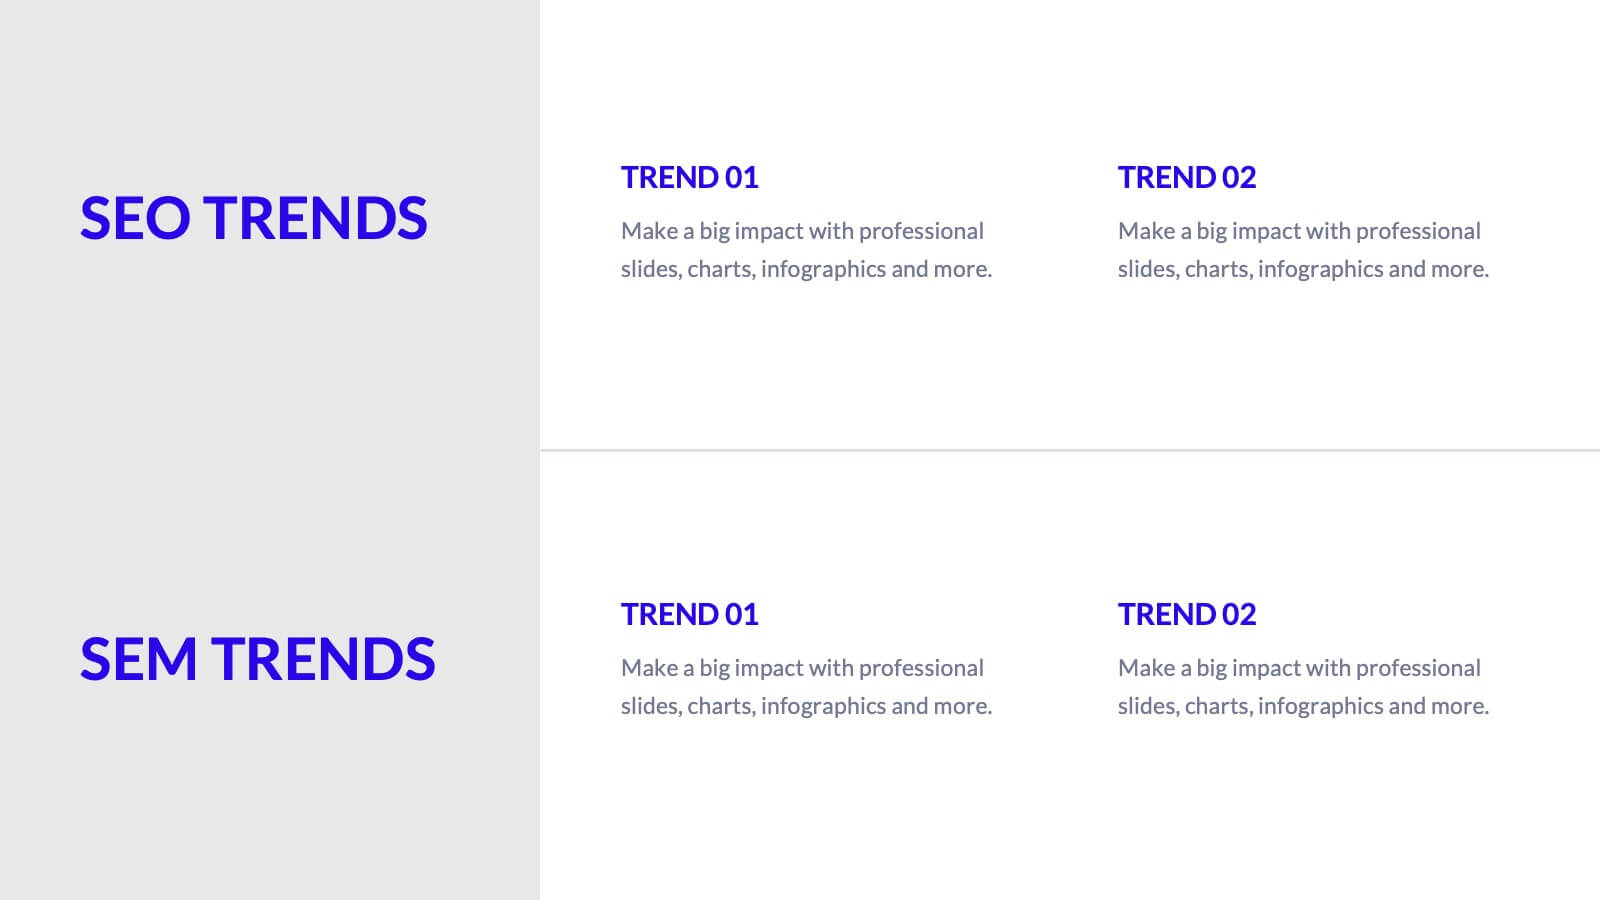
Catalyst Digital Marketing Strategy Plan Presentation
Supercharge your digital marketing strategy with this vibrant, modern presentation template. Perfect for detailing industry overviews, consumer behavior analysis, and social media strategies, it features a dynamic design that captures attention. Highlight key trends like SEO, influencer marketing, and e-commerce to engage your audience. Compatible with PowerPoint, Keynote, and Google Slides, it ensures seamless presentations on any platform.


4 diapositivas
Financial Overview Slide Presentation
Kick off your presentation with a clean, modern visual that makes financial insights easy to grasp at a glance. This slide helps you summarize key metrics, compare performance areas, and highlight important business trends in a simple, structured layout. Fully compatible with PowerPoint, Keynote, and Google Slides.


6 diapositivas
Creative Interior Design Portfolio Showcase Presentation
Showcase your creativity with the Creative Design Portfolio Showcase presentation. This template is perfect for graphic designers, architects, and creative professionals looking to display their work in a visually compelling format. Featuring modern layouts, high-quality image placeholders, and structured text sections, it allows for easy customization to highlight key insights. Fully compatible with PowerPoint, Keynote, and Google Slides.


7 diapositivas
Remote Work Guidelines and Setup Presentation
Bring clarity to your remote work setup with this sleek visual guide—designed to communicate processes, tools, and best practices in one easy-to-follow layout. Whether you're onboarding a team or streamlining operations, this slide helps break it all down step by step. Fully compatible with PowerPoint, Keynote, and Google Slides.


6 diapositivas
Cloud IT Infrastructure Design Presentation
Transform the way you explain cloud systems with this modern, data-driven presentation. Ideal for outlining infrastructure layers, deployment strategies, or network operations, it uses a clean, cloud-inspired layout for clarity and impact. Fully customizable and compatible with PowerPoint, Keynote, and Google Slides for a smooth, professional presentation experience.


7 diapositivas
Team Collaboration Strategy Presentation
Enhance teamwork and synergy with the Team Collaboration Strategy presentation template. Designed to visualize key collaboration efforts, this template helps businesses, project managers, and HR teams define roles, optimize workflow, and foster communication. Featuring a puzzle-piece structure, this fully customizable design is compatible with PowerPoint, Keynote, and Google Slides.


4 diapositivas
Business Growth Strategy Presentation
Visualize strategic priorities with this Business Growth Strategy Presentation. Designed as a 2x2 matrix, this slide showcases market and product positioning across four quadrants: present vs. future and market fit vs. innovation. Each section is color-coded and icon-supported, making it easy to highlight initiatives and growth paths. Fully editable in PowerPoint, Keynote, and Google Slides.


4 diapositivas
Organizational Hierarchy Chart Presentation
A clear, engaging way to map out team structure, this presentation highlights how roles connect and flow across an organization. It visually simplifies reporting lines, helping audiences quickly understand leadership levels and team responsibilities. Perfect for planning, onboarding, or strategy discussions, and fully compatible with PowerPoint, Keynote, and Google Slides.


4 diapositivas
Brain Function Breakdown Chart Presentation
Bring clarity to complex thinking with a visual layout that highlights key mental processes in a clean, engaging way. This presentation helps you explain cognitive functions, organize insights, and break down information into easy-to-follow sections. Perfect for education, training, or research. Fully compatible with PowerPoint, Keynote, and Google Slides.


7 diapositivas
Basic Tables Of Content Infographic
Our basic tables of content infographic provides a streamlined and visually engaging way to present a list of topics or sections in a document, presentation, or any content piece. With a foundational white background contrasted by vivid touches of red and multicolored highlights, this template brings both simplicity and vibrancy to the often-standard table of contents. Perfect for authors, researchers, educators, and students, this infographic offers an efficient way to present a roadmap of what lies ahead. Whether you're working on PowerPoint, Keynote, or Google Slides, this template ensures that your table of contents stands out, guiding your audience effortlessly.


4 diapositivas
Business Gap Analysis Framework
Visually bridge the gap between current and desired performance with this impactful Business Gap Analysis slide. Featuring a creative cliff and bridge design with editable text sections, it's ideal for strategic planning, performance improvement, and operational reviews. Fully compatible with PowerPoint, Keynote, and Google Slides.


3 diapositivas
Workflow Optimization Flow Chart Presentation
Streamline your processes with this Workflow Optimization Flow Chart presentation. Designed to help teams identify inefficiencies, visualize task flows, and improve decision-making. Featuring clearly labeled paths and decision points, it's ideal for process audits, operations planning, or training sessions. Fully editable in PowerPoint, Canva, and Google Slides.


10 diapositivas
SWOT and Competitor Comparison Presentation
Turn insights into strategy with a clean, visual layout designed to compare strengths, weaknesses, opportunities, and threats side by side. This professional presentation helps teams evaluate competitors and identify growth opportunities clearly. Compatible with PowerPoint, Keynote, and Google Slides for easy editing and seamless presentation delivery.


6 diapositivas
Ideal Customer Profile Infographic
A customer profile, also known as a buyer persona, is a detailed and semi-fictional representation of your ideal customer. This infographic template can help businesses visualize and communicate their target audience characteristics and preferences. This template is a valuable tool for educating your team and clients about your ideal customer profile. This customer profile infographic can help your team align their efforts towards effectively targeting and engaging the right audience for your products or services. Compatible with Powerpoint, Keynote, and Google Slides. Incorporate your brand's logo and color scheme to maintain consistency.