


Características


¿Tienes alguna pregunta?
Recomendar


8 diapositivas
Economic Impact on Stock Market Presentation
Illuminate your financial presentation with the "Economic Impact on Stock Market" template, ideal for displaying the interconnected influences of economic variables on market performance. These slides feature clear, visual representations through pie charts and percentage indicators, allowing for an engaging analysis of trends and impacts. This template is fully compatible with PowerPoint, Keynote, and Google Slides, ensuring versatility across different presentation platforms.


6 diapositivas
Brain Development Infographic
Brain Development refers to the growth, maturation, and organization of the brain throughout an individual's life, starting from early prenatal stages and continuing into adulthood. This infographic template serves as a valuable educational resource for educators, parents, healthcare professionals, and anyone interested in understanding the fascinating process of brain development. This infographic highlights the stages and factors that shape brain growth, to help promote awareness and emphasize the importance of creating supportive environments for brain development. Compatible with Powerpoint, Keynote, and Google Slides.


4 diapositivas
4-Quadrant SWOT Matrix Presentation
Spark strategic clarity with a bold, visual layout designed to organize strengths, weaknesses, opportunities, and threats in a clean, engaging way. This presentation helps teams analyze key factors, compare insights, and plan smarter with structured guidance. Ideal for business strategy and decision-making. Fully compatible with PowerPoint, Keynote, and Google Slides.


5 diapositivas
Operational Process Logic Map
Visualize how every function interconnects with the Operational Process Logic Map Presentation. This template uses a radial node structure to break down workflows, responsibilities, or systems into logical clusters, showing how different units or steps interact within an operational framework. Each node is color-coded and icon-marked for clarity, ideal for explaining process flows, department roles, or system dependencies. Fully editable in PowerPoint, Keynote, and Google Slides.


6 diapositivas
Simple Workflow Process Presentation
Streamline your workflow presentations with this Simple Workflow Process template. Featuring a clean, step-by-step layout with intuitive lightbulb icons, it effectively visualizes processes. Fully customizable with editable colors, icons, and text to match your branding. Compatible with PowerPoint, Keynote, and Google Slides for effortless integration into your presentations.


19 diapositivas
Zenith Sales Proposal Presentation
Get ready to blow your clients away with this electrifying sales proposal template! Packed with sections on project scope, bold objectives, timelines, and jaw-dropping pricing, it’s designed to make a powerful impact. The sleek, cutting-edge design ensures you’ll leave a lasting impression. Fully compatible with PowerPoint, Keynote, and Google Slides!


6 diapositivas
Cryptocurrency Analysis Infographics
Analyze cryptocurrency effectively with our Cryptocurrency Analysis infographic template. This template is fully compatible with popular presentation software like PowerPoint, Keynote, and Google Slides, allowing you to easily customize it to illustrate and communicate various aspects of cryptocurrency analysis. The Cryptocurrency Analysis infographic template offers a visually engaging platform to explore and explain the key elements of analyzing cryptocurrencies, including market trends, technical analysis, fundamental analysis, and investment strategies. Whether you're a cryptocurrency enthusiast, trader, or investor, this template provides a user-friendly canvas to create informative presentations and educational materials. Enhance your cryptocurrency knowledge and analysis skills with this SEO-optimized Cryptocurrency Analysis infographic template, thoughtfully designed for clarity and ease of use. Customize it to showcase cryptocurrency charts, indicators, risk management techniques, and insights into the volatile world of digital assets, ensuring that your audience gains valuable insights into this evolving field. Start crafting your personalized infographic today to become a more proficient cryptocurrency analyst.


5 diapositivas
Enterprise Risk Management Framework Presentation
Visualize your organization’s risk strategy with the Enterprise Risk Management Framework Presentation. This slide outlines four core steps—Set Objective, Identify Risks, Assess Risks, and Risk Response—using a clear, directional design. Perfect for risk assessments, board updates, or audit reviews. Fully editable in PowerPoint, Google Slides, and Canva.


4 diapositivas
Machine Learning Overviews Presentation
Bring your audience into the world of intelligent automation with a bold, visual layout that makes complex concepts feel simple and engaging. This presentation breaks down key processes, workflows, and insights using clear graphics that support your message. Fully customizable and compatible with PowerPoint, Keynote, and Google Slides.


5 diapositivas
Compliance and Legal Affairs Presentation
Enforce clarity with the Compliance and Legal Affairs Presentation. Featuring a segmented gavel icon, this layout is ideal for outlining legal processes, compliance stages, and regulatory strategies. Each section is clearly labeled for structured storytelling. Fully editable in PowerPoint, Keynote, and Google Slides.


7 diapositivas
Smile Rating Importance Infographic Presentation
Smile Rating is a metric used in customer service to measure the level of customer satisfaction or happiness with a particular experience, interaction or service. This template will help you make a vibrant, friendly and original presentation. This smile rating infographic is easy to use and customize. It is fully editable and the layout allows you to personalize it. This template can be edited in PowerPoint, Keynote, and Google Slides. This is perfect for business presentations, strategic planning, idea-sharing sessions or just a fun way to share your thoughts on this design topic.


26 diapositivas
HIIT Workout Pink Presentation
Unleash the energy with our vibrant HIIT gym workout presentation template, a dynamic blend of pink, red, orange, and yellow, designed to bring your fitness regime to life. This energetic palette is perfect for gym owners, fitness influencers, and personal trainers aiming to showcase the high-intensity intervals that promise fast results. The template offers various graphics, icons, and image placeholders that add a visual punch to your information. Dive into creating an engaging, motivational fitness journey that highlights the benefits, routines, and transformative power of HIIT workouts, ensuring your audience is pumped and ready to go!


6 diapositivas
Event and Meeting Schedule Calendar Presentation
Simplify your weekly planning with this modern and visually intuitive event calendar template. Featuring a clean grid layout, this presentation allows you to organize key meetings, deadlines, or project highlights across six weeks. Each week is color-coded for quick reference, and each event box is fully editable to include titles and custom notes. Ideal for team leaders, educators, corporate planners, and event organizers. Compatible with PowerPoint, Keynote, and Google Slides for effortless use.


21 diapositivas
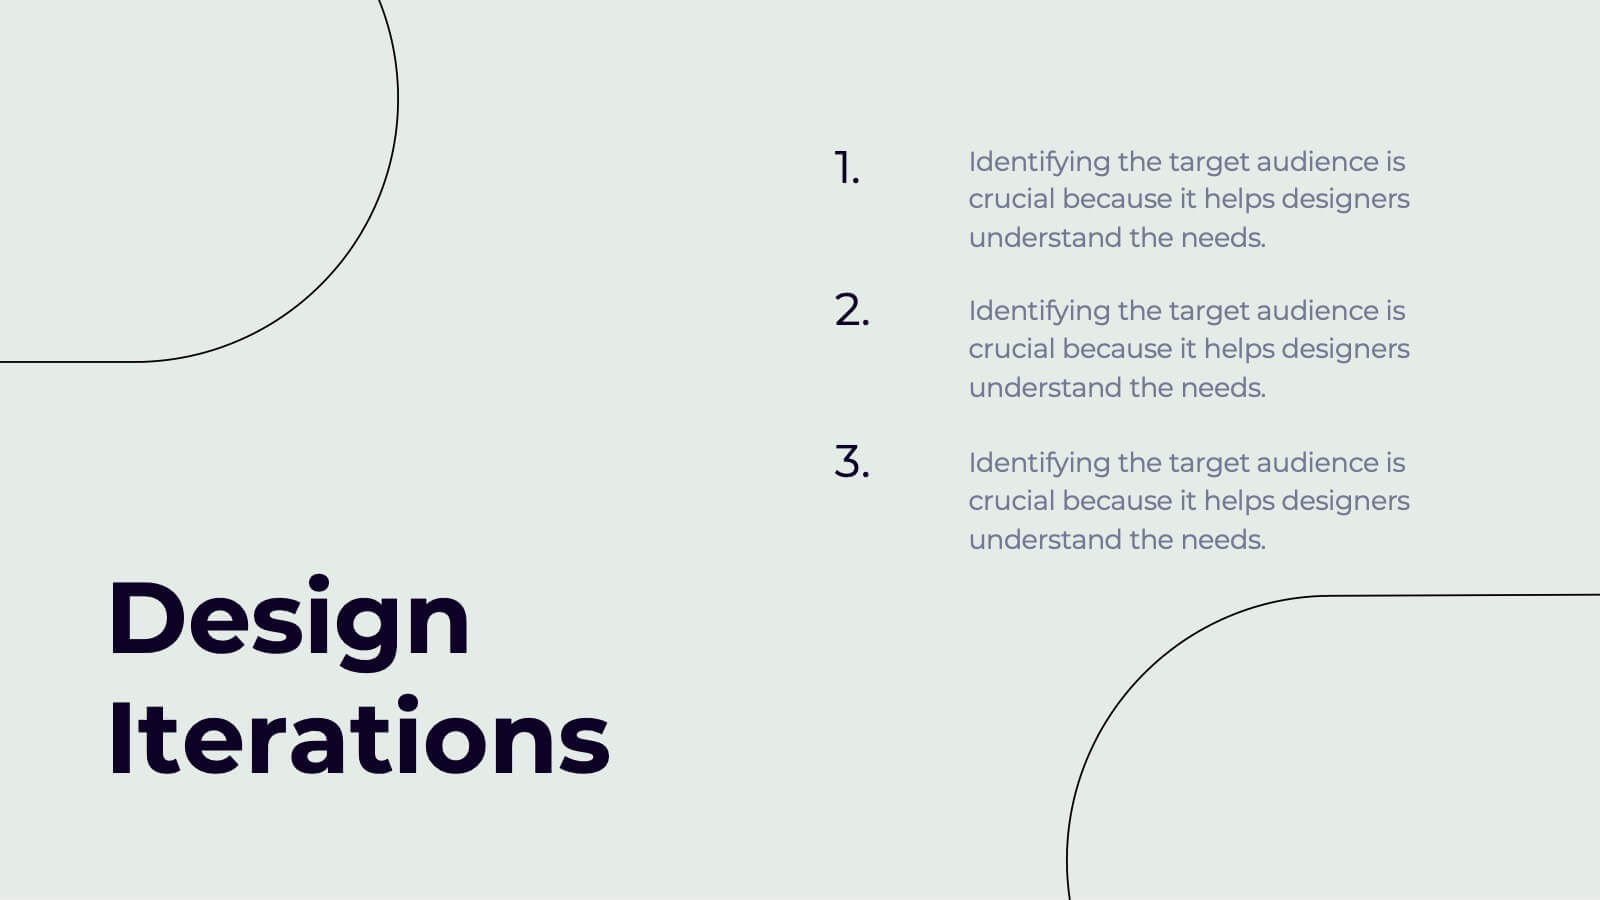
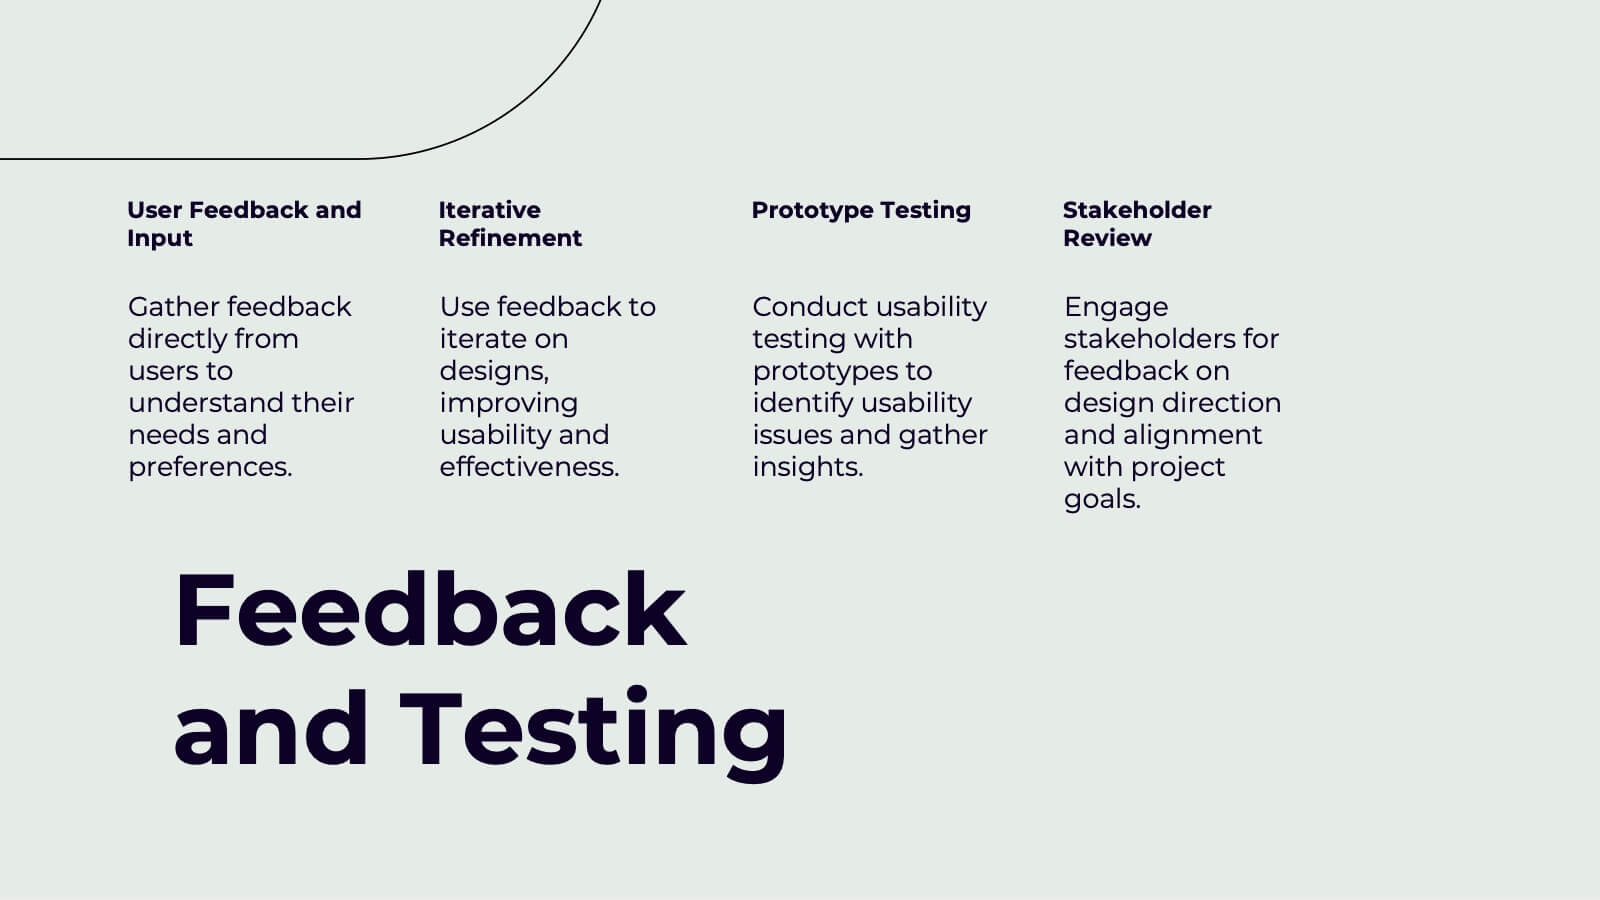
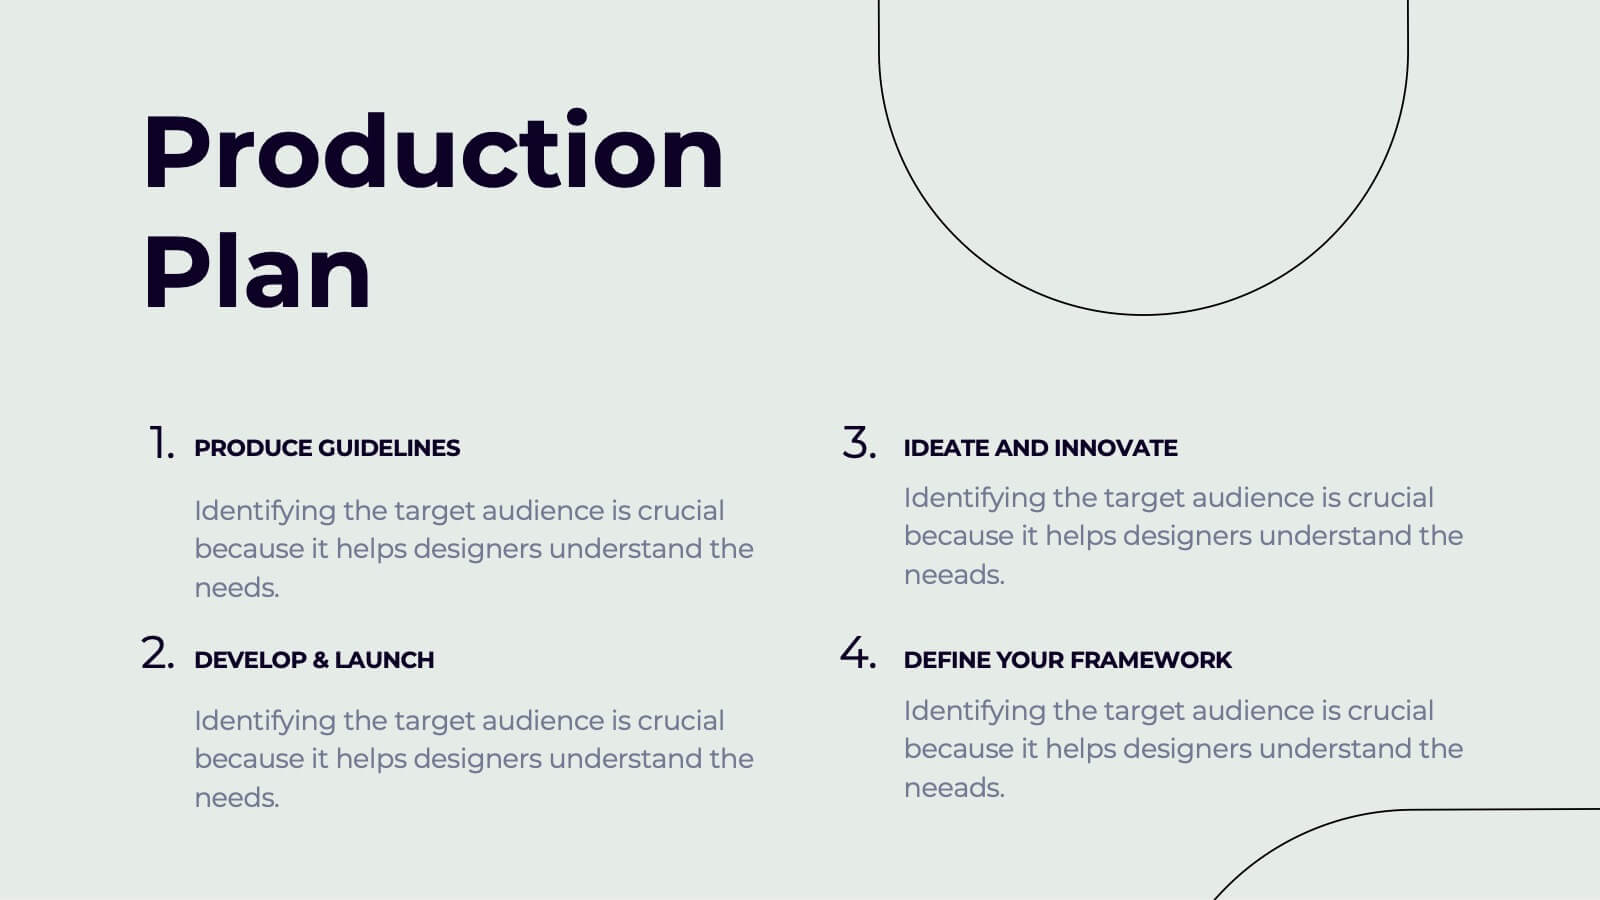
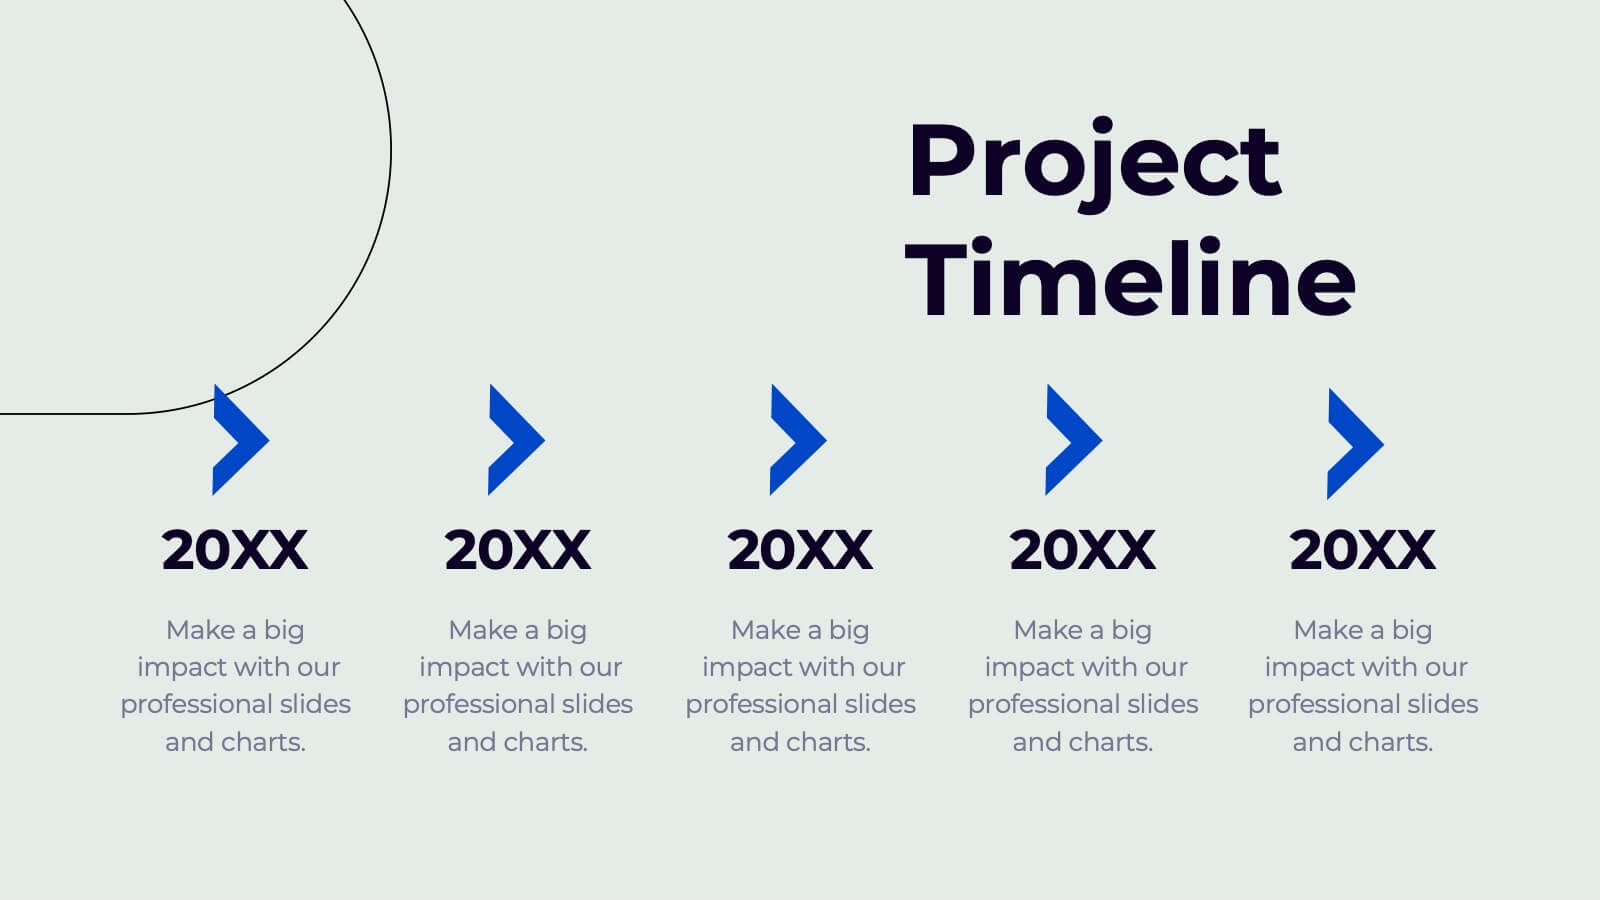
Yeti Creative Design Report Presentation
This modern design report template covers everything from concept development to design iterations and feedback testing. It’s visually striking, with sections for color schemes, typography, textures, and production plans. Ideal for showcasing creative projects and delivering professional presentations. Compatible with PowerPoint, Keynote, and Google Slides for ease of use.


6 diapositivas
Insurance Comparison Infographic
Insurance comparison is the process of evaluating and comparing different insurance policies offered by various insurance companies to find the one that best meets your needs and requirements. This infographic template is a visual representation of different types of insurance policies and their key features, designed to help consumers compare and make informed decisions about their insurance needs. This infographic aims to simplify complex insurance information. This can be used on insurance websites, marketing materials, and educational resources to assist consumers in making well-informed insurance choices based on their unique needs and preferences.


3 diapositivas
Governance and Compliance Framework Presentation
Strengthen your organization's structure with our Governance and Compliance Framework template. This visually compelling template is crafted to effectively communicate the integration of governance, compliance, and risk management. It is ideal for demonstrating how these elements collaborate to uphold regulatory standards and manage business risks. Fully compatible with PowerPoint, Keynote, and Google Slides, it's an essential tool for any corporate governance presentation aimed at promoting effective, compliant business practices.


5 diapositivas
Workforce Alignment Strategy Presentation
Energize your strategy conversations with a clean, modern layout that makes team alignment feel clear, structured, and actionable. This presentation helps you break down goals, track priorities, and visualize key initiatives in a simple, intuitive flow. Ideal for planning sessions and leadership updates. Fully compatible with PowerPoint, Keynote, and Google Slides.