


Características


¿Tienes alguna pregunta?
Recomendar


4 diapositivas
Comparative Assessment Using Harvey Ball Chart Presentation
Make your evaluations easier to understand with this Harvey Ball chart template. Designed for performance comparison, efficiency scoring, or feature benchmarking, this layout supports up to 4 items and 3 criteria. Each element is clearly visualized for quick decision-making. Fully editable in PowerPoint, Keynote, or Google Slides—ideal for business strategy, operations, or HR presentations.


4 diapositivas
Top Priorities and Checklist Format Presentation
Stay focused and aligned with the Top Priorities and Checklist Format Presentation. This clear, checklist-based design is ideal for highlighting action items, goals, or key project deliverables. Visually guide your team with structured sections and a checklist illustration that reinforces accountability. Fully editable in PowerPoint, Keynote, and Google Slides.


21 diapositivas
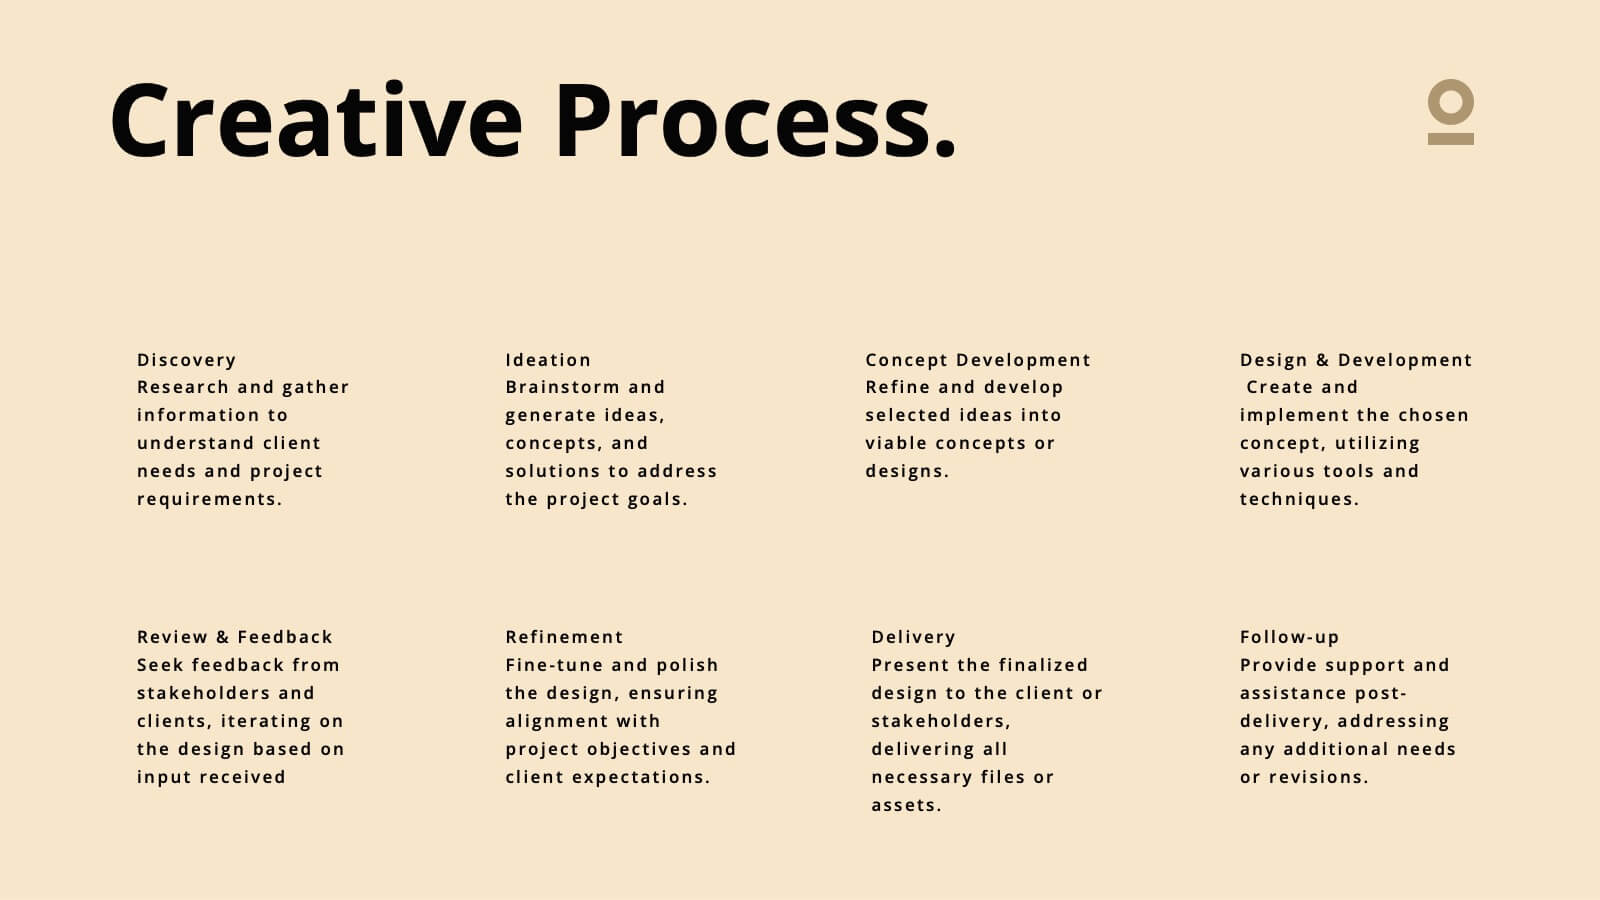
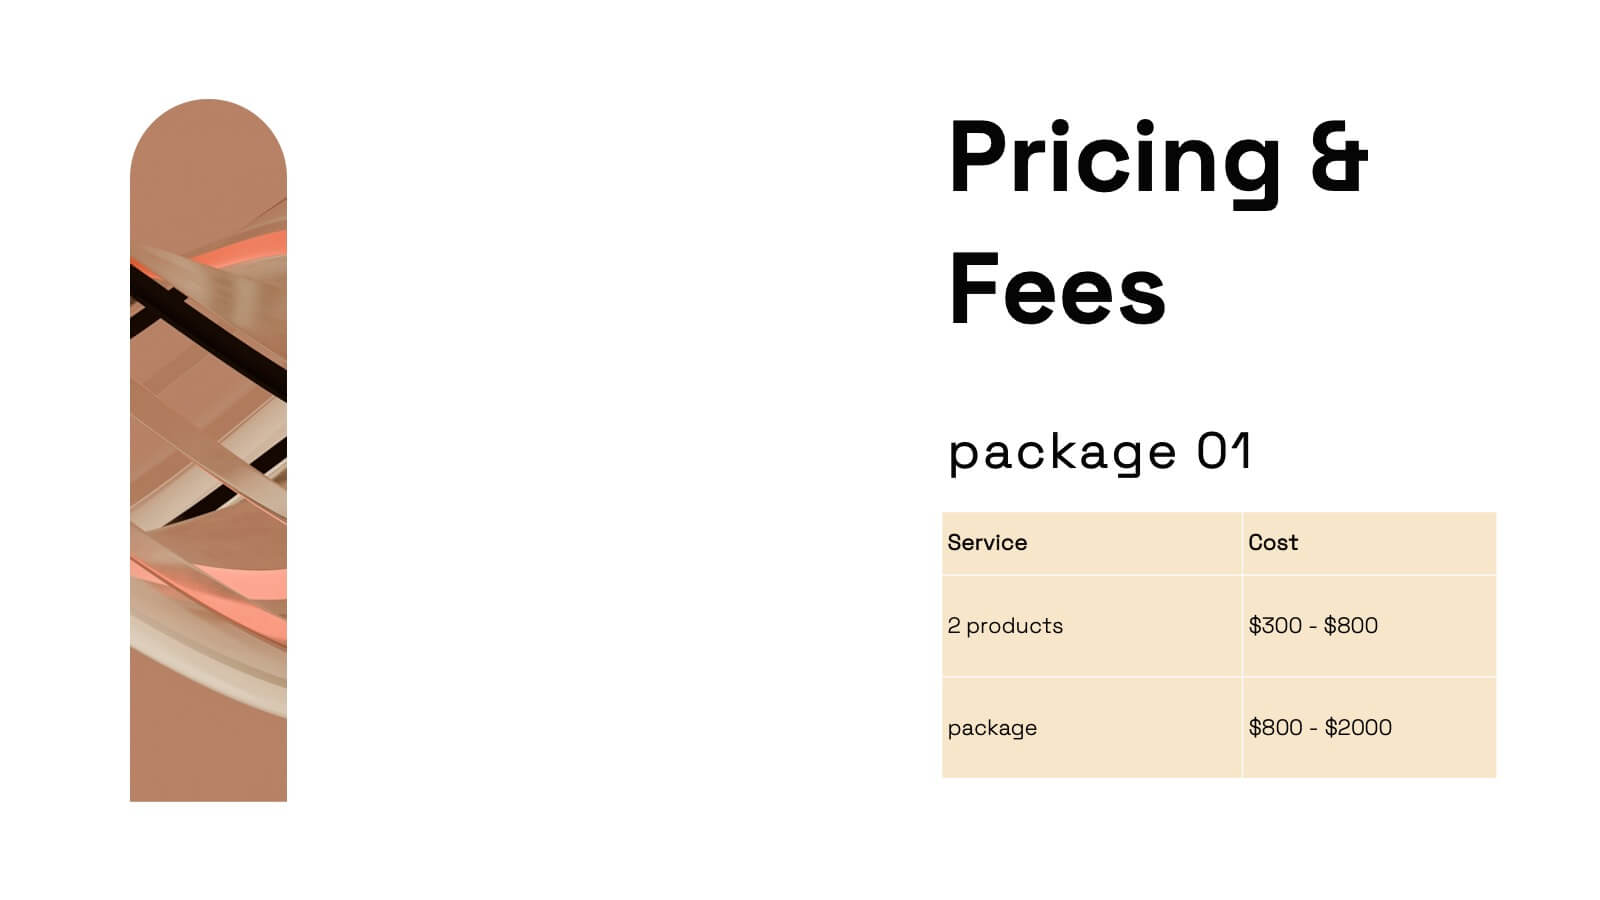
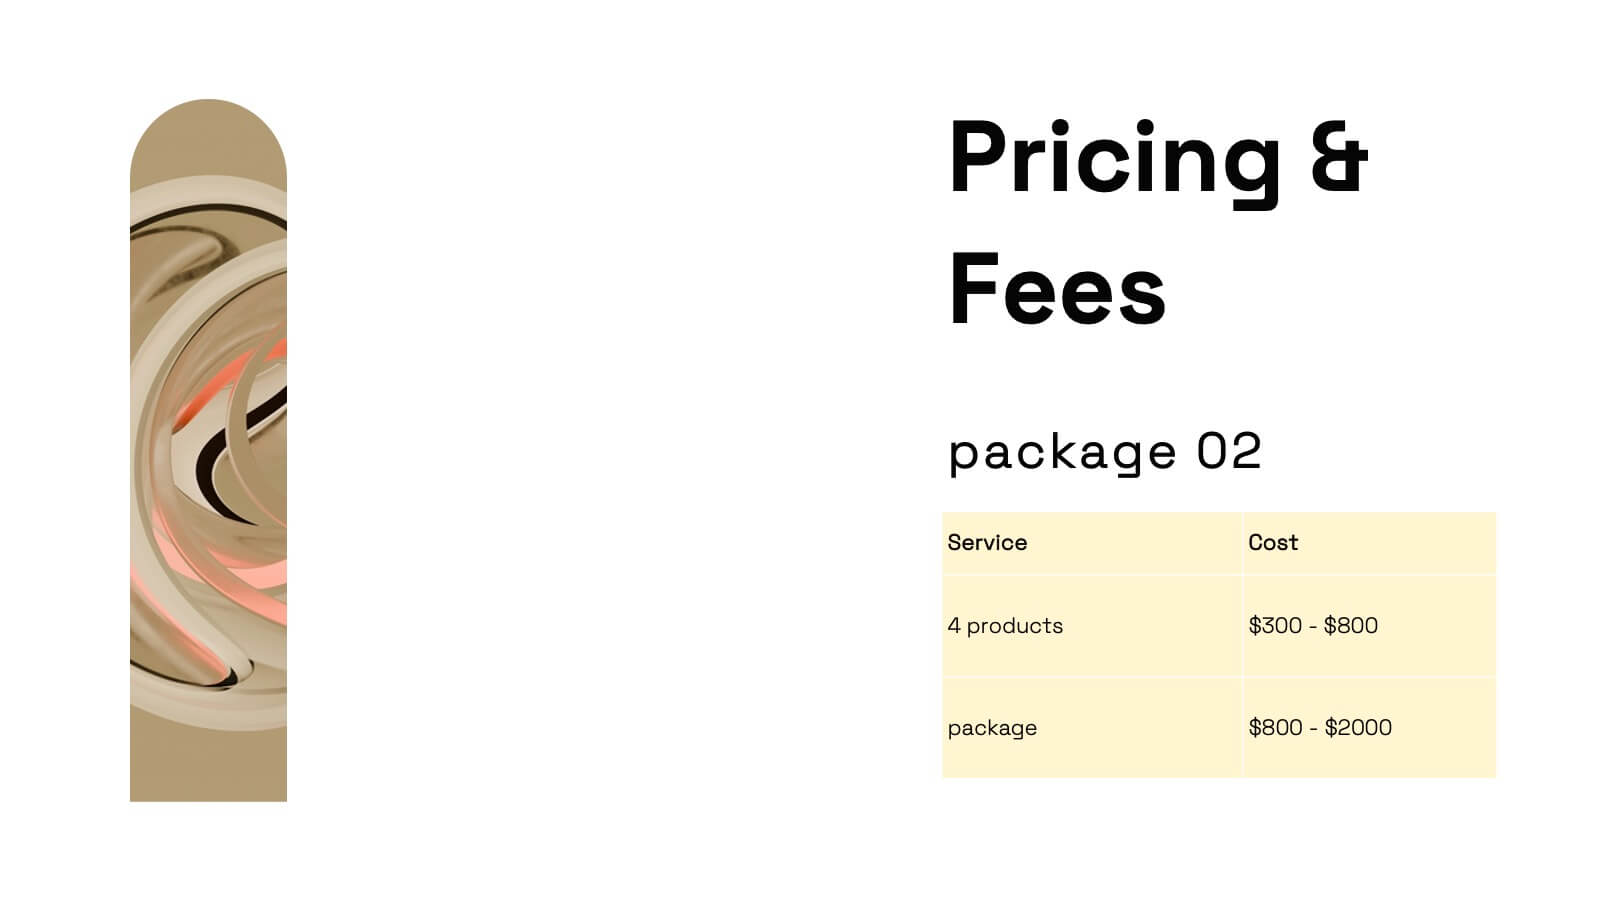
Haze Professional Portfolio Showcase Presentation
Elevate your professional presence with this stunning haze-inspired presentation template! Ideal for showcasing your portfolio, it beautifully highlights your skills, projects, and achievements with a clean and sophisticated design. This template ensures your work stands out, captivating potential clients and employers. Compatible with PowerPoint, Keynote, and Google Slides.


21 diapositivas
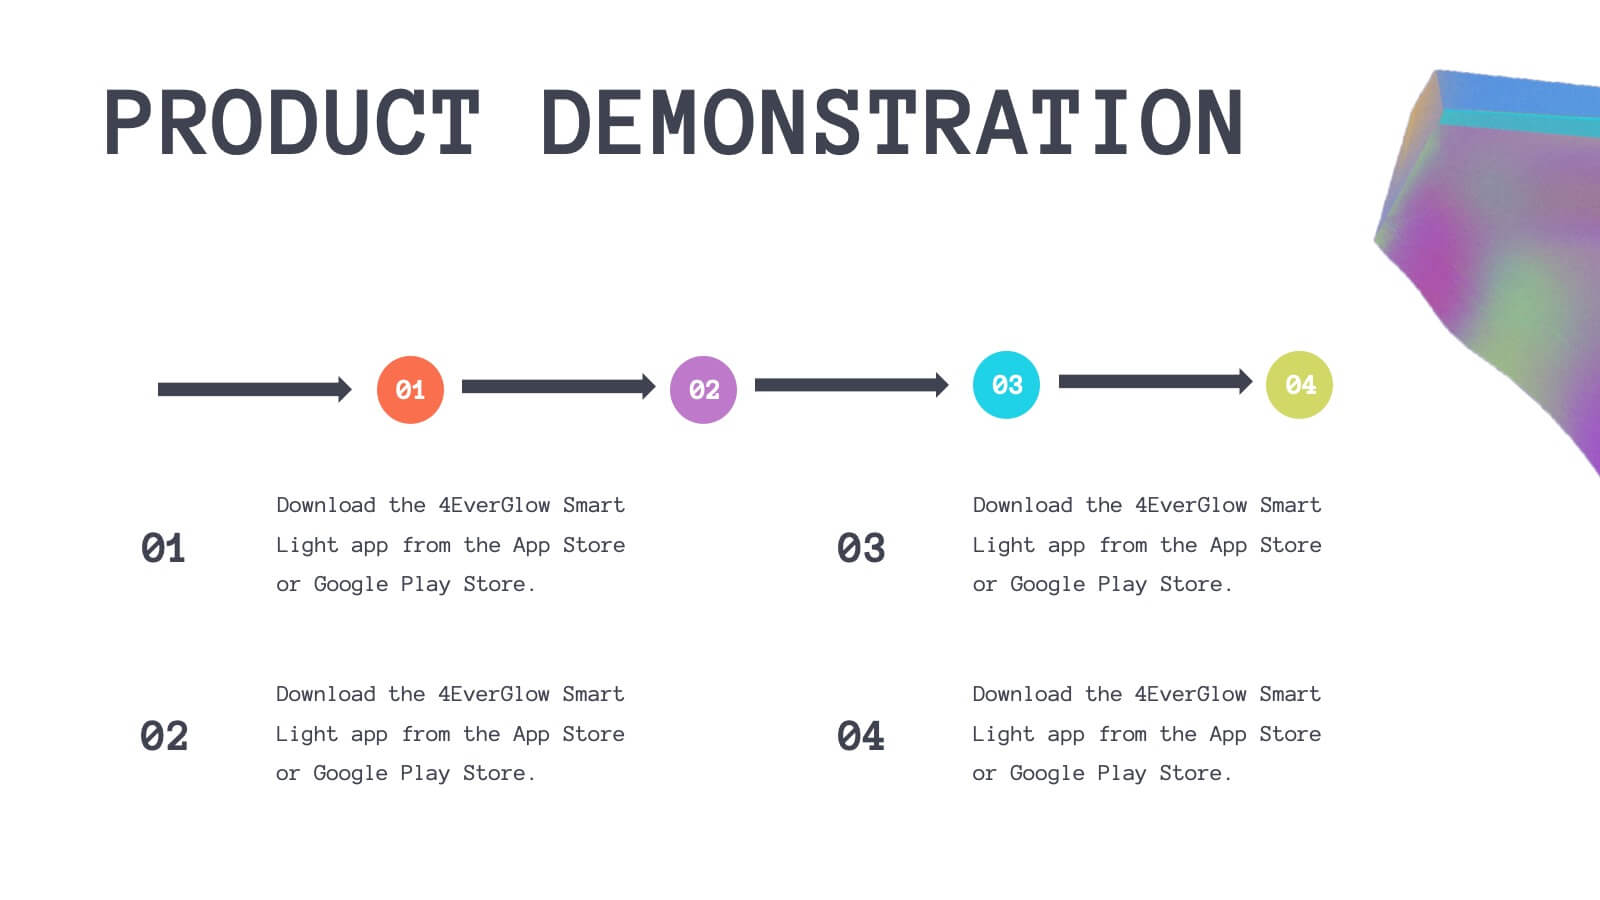
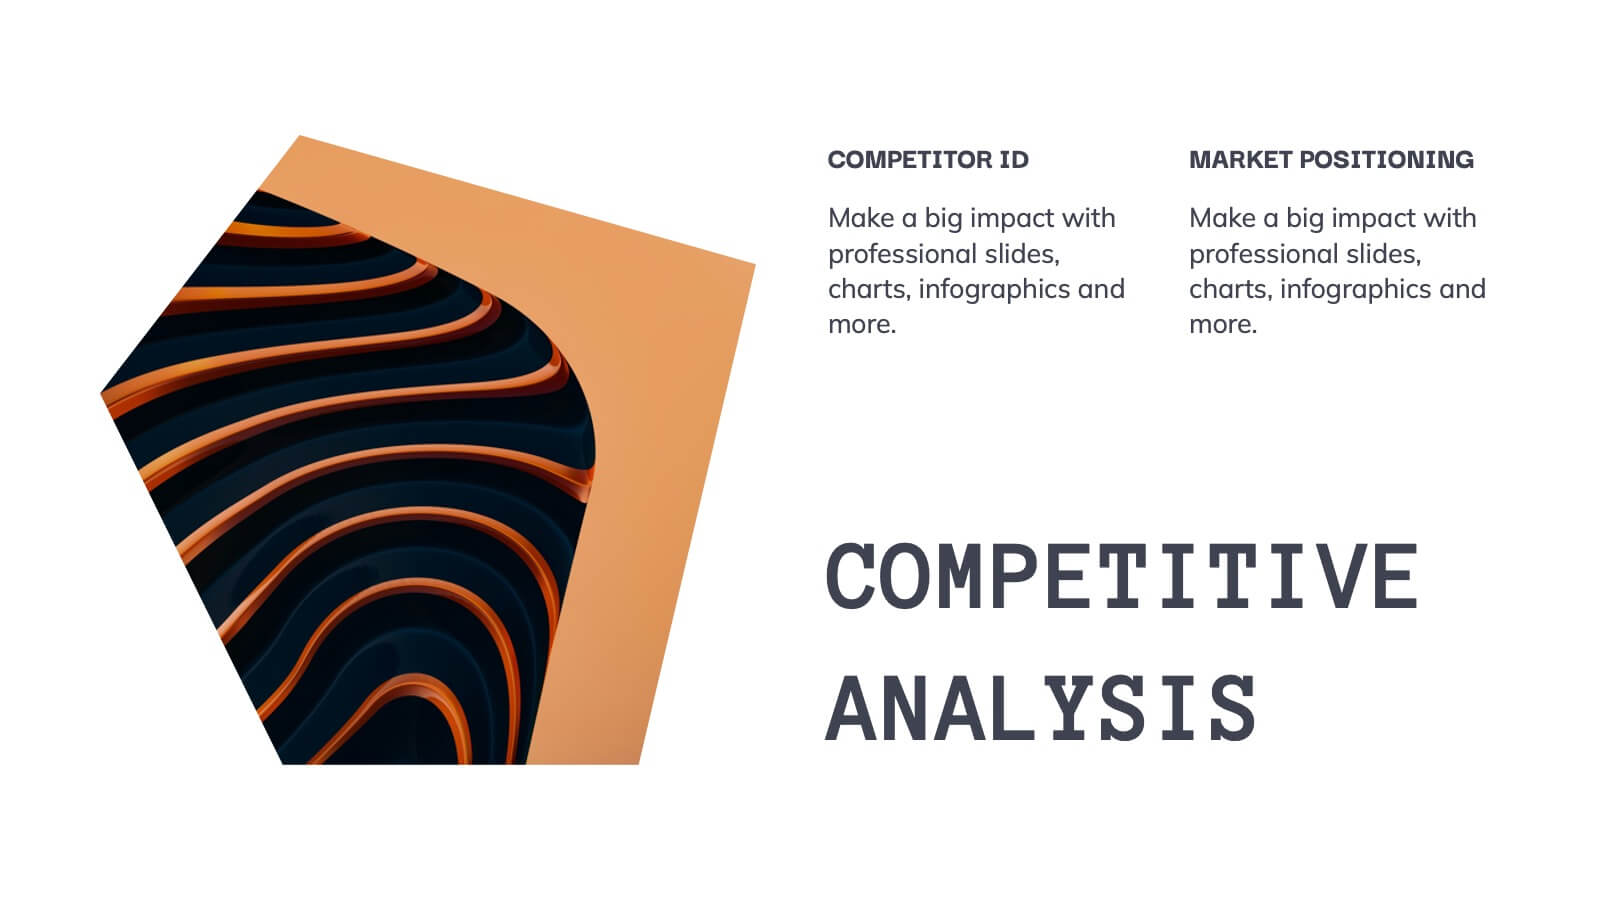
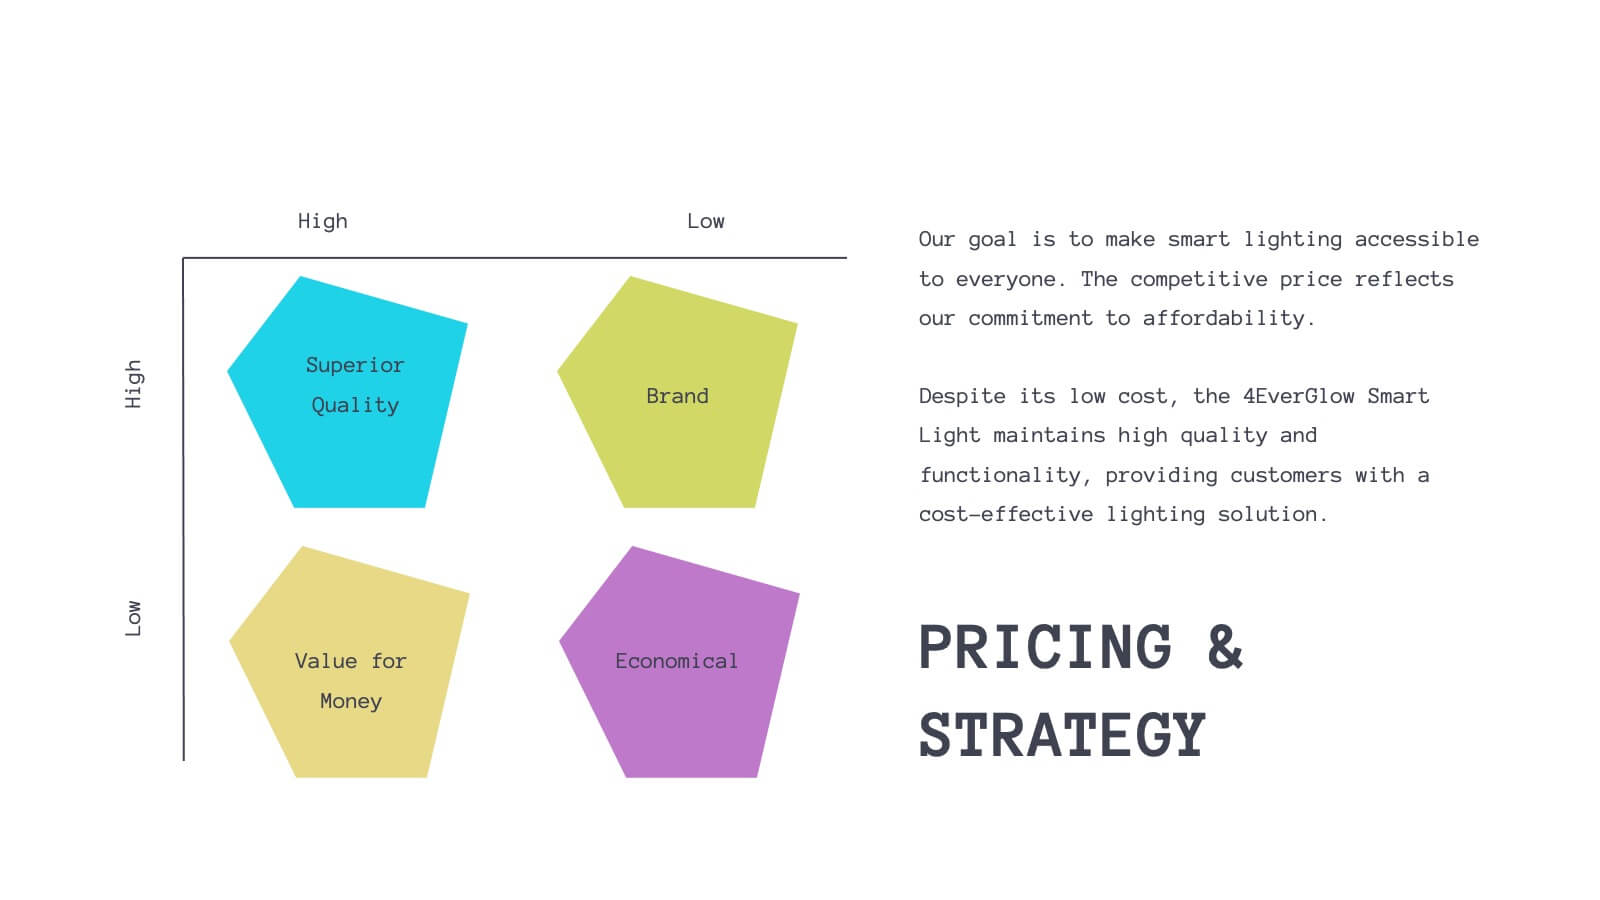
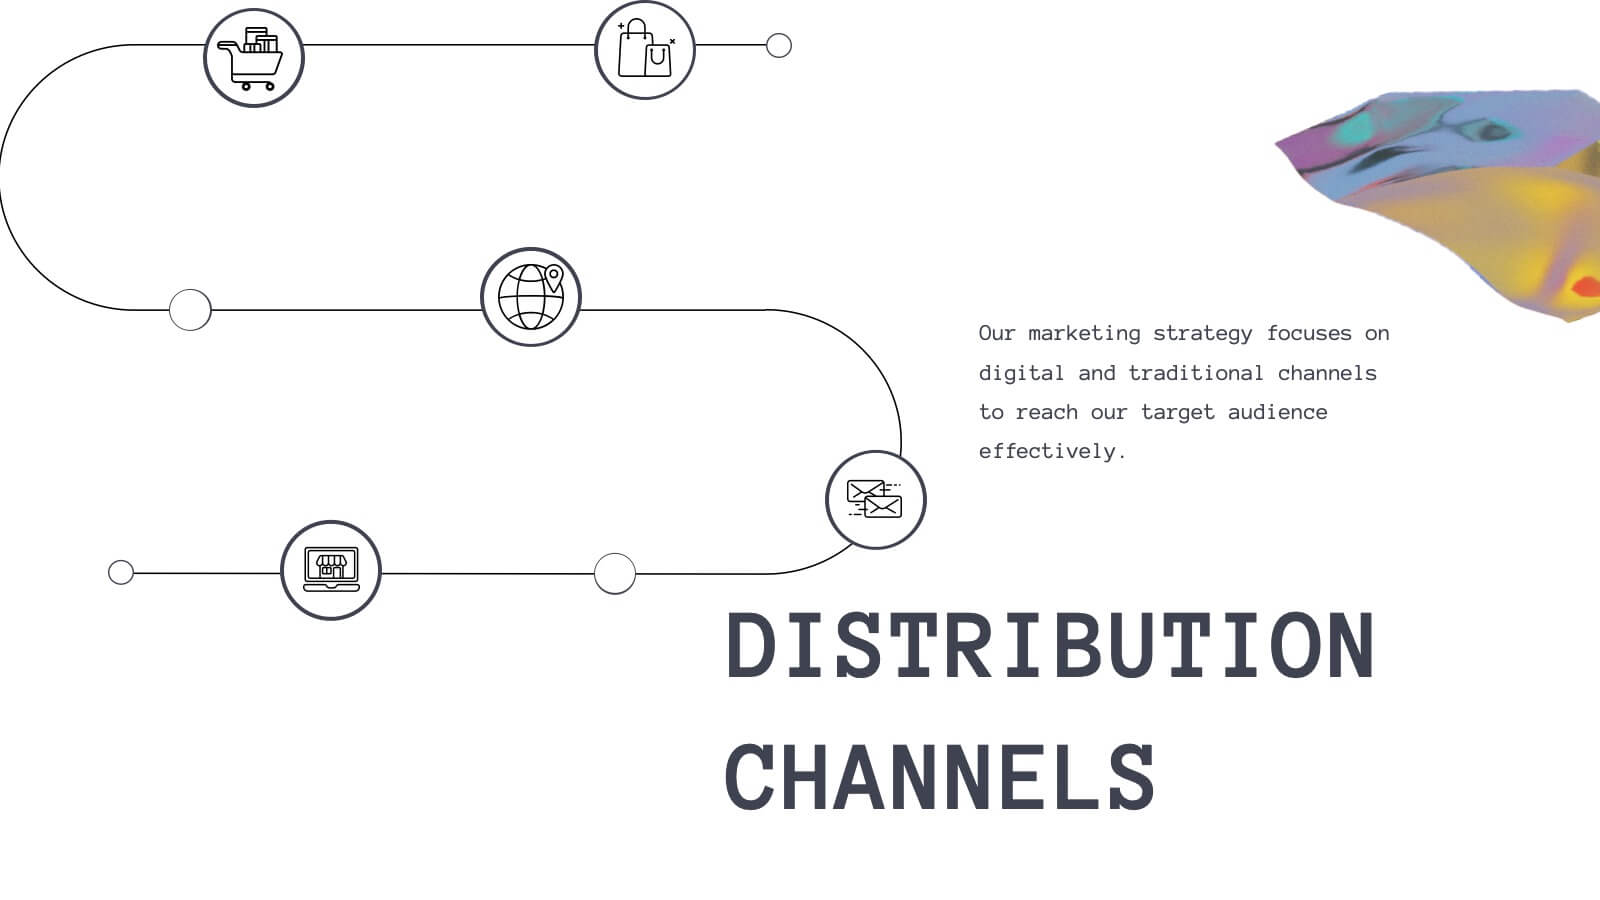
Luster Product Roadmap Presentation
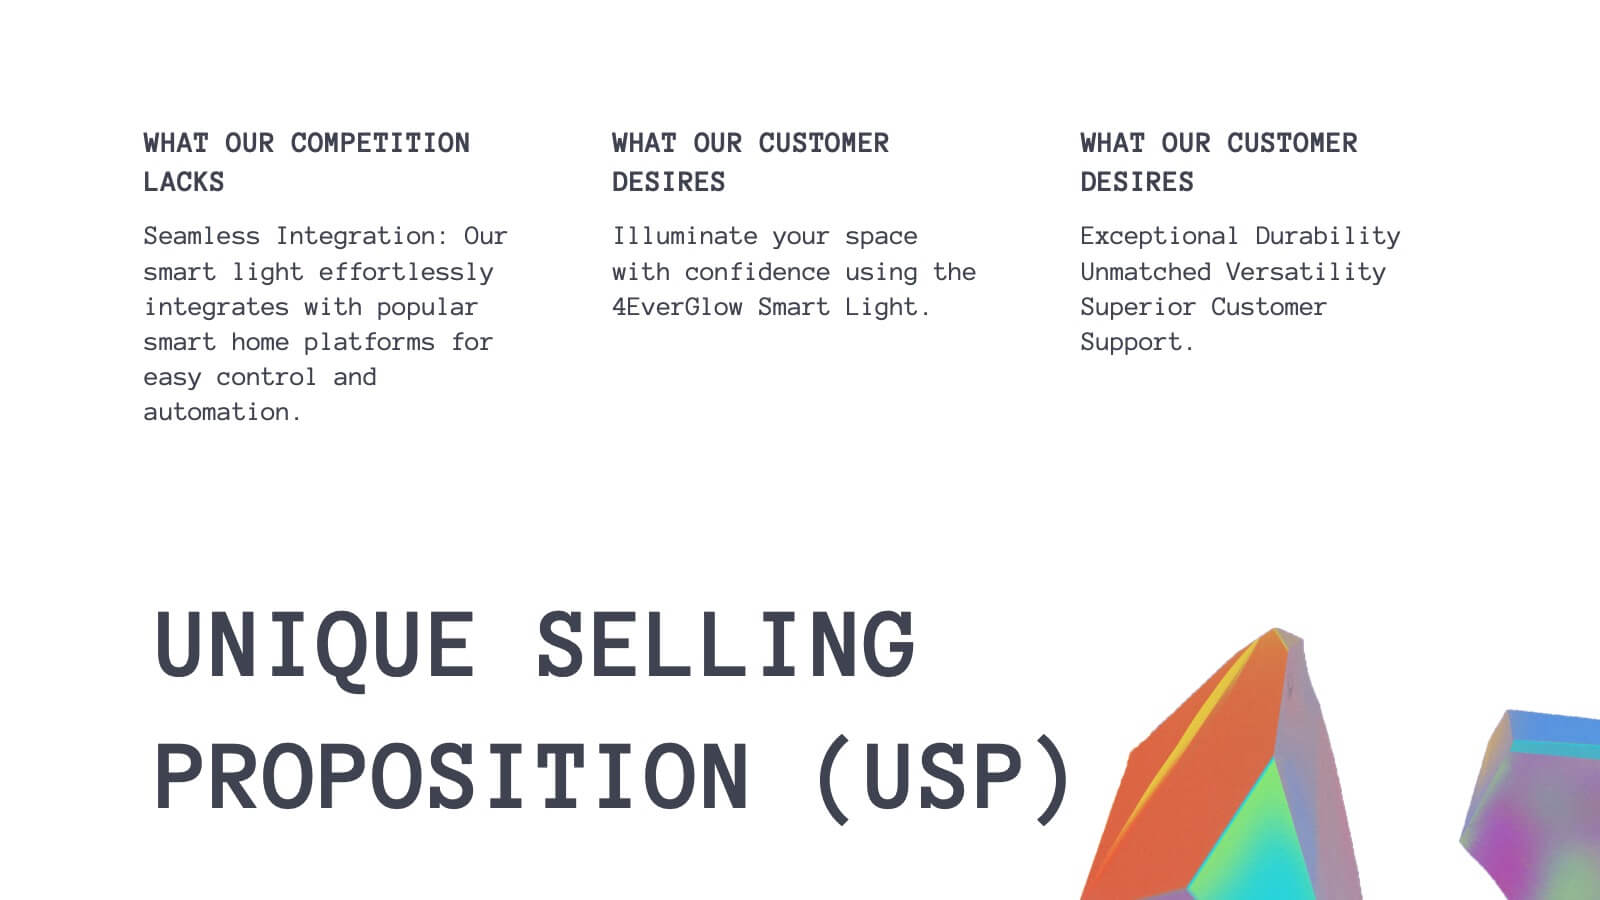
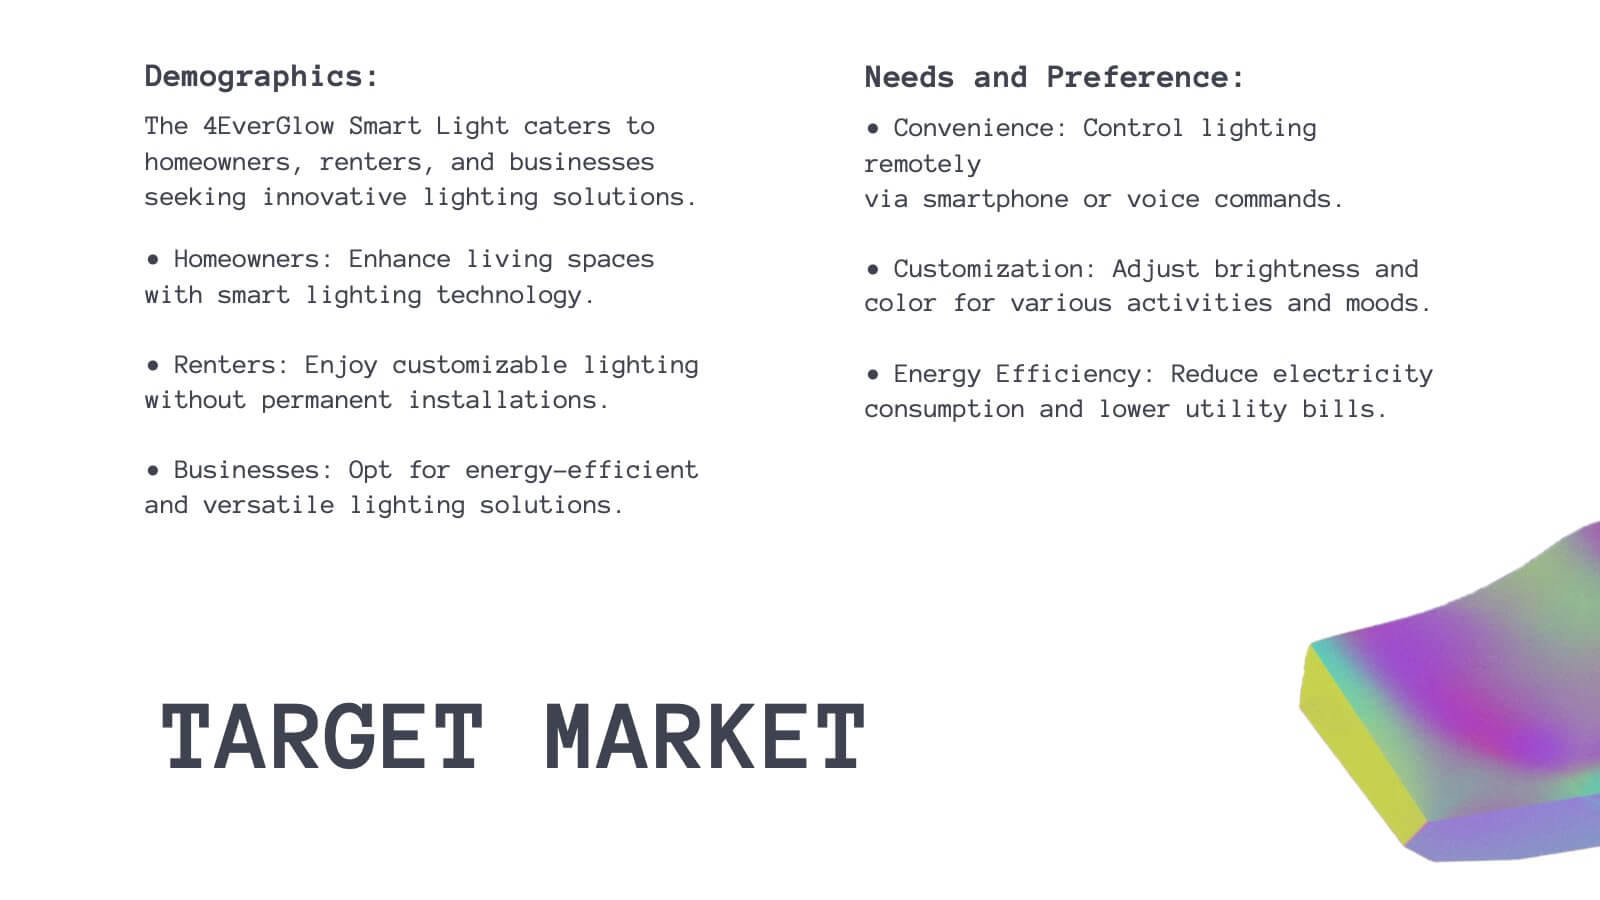
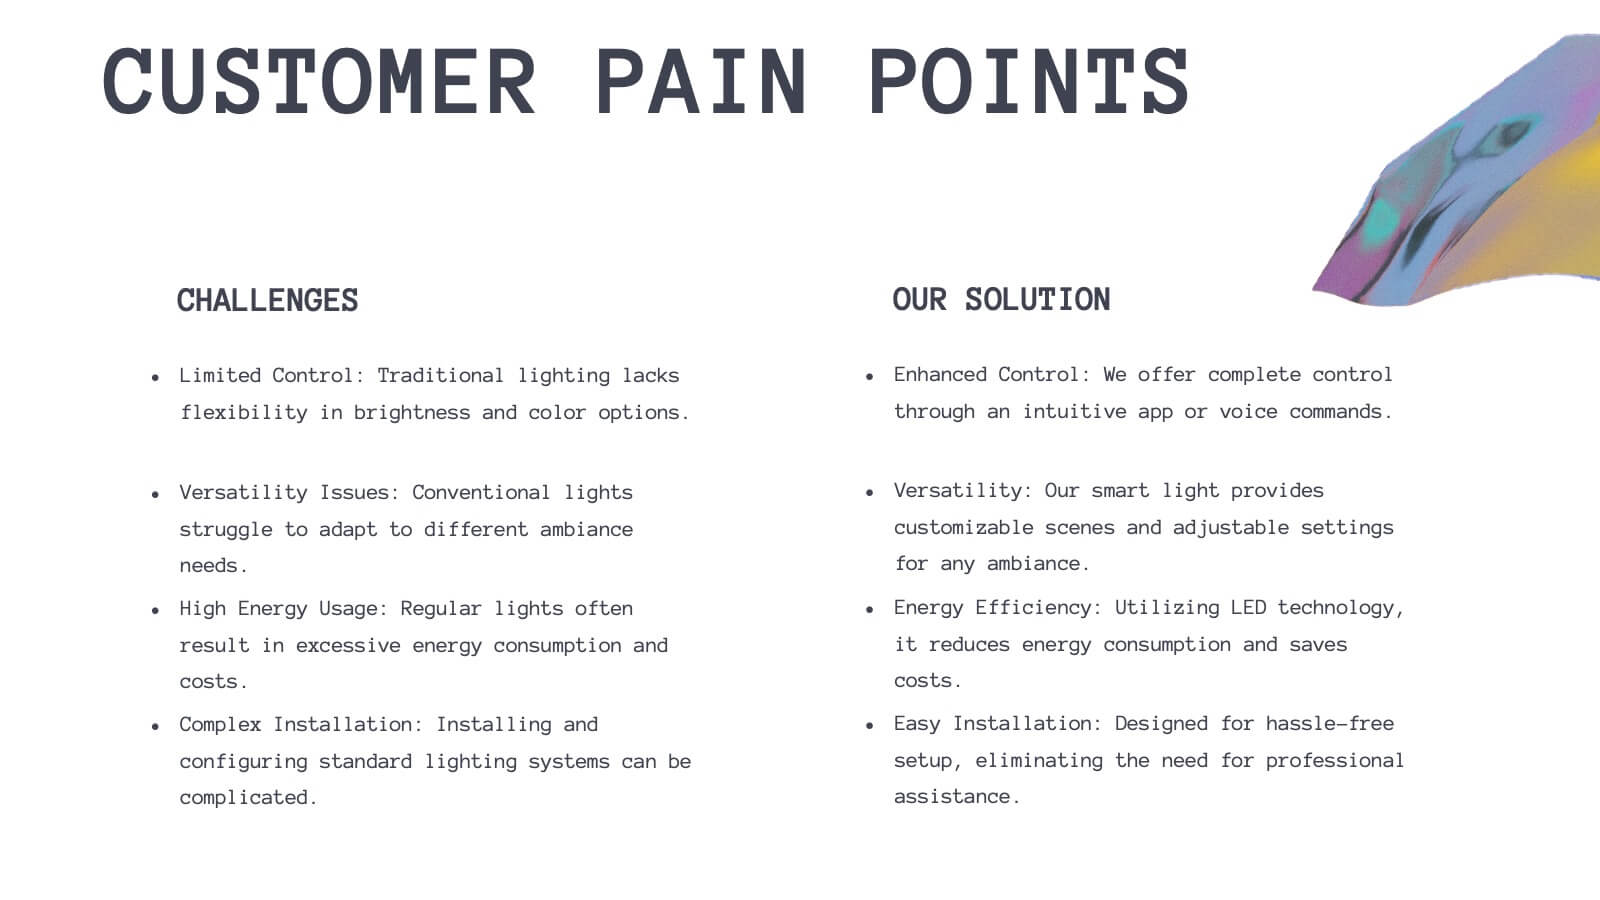
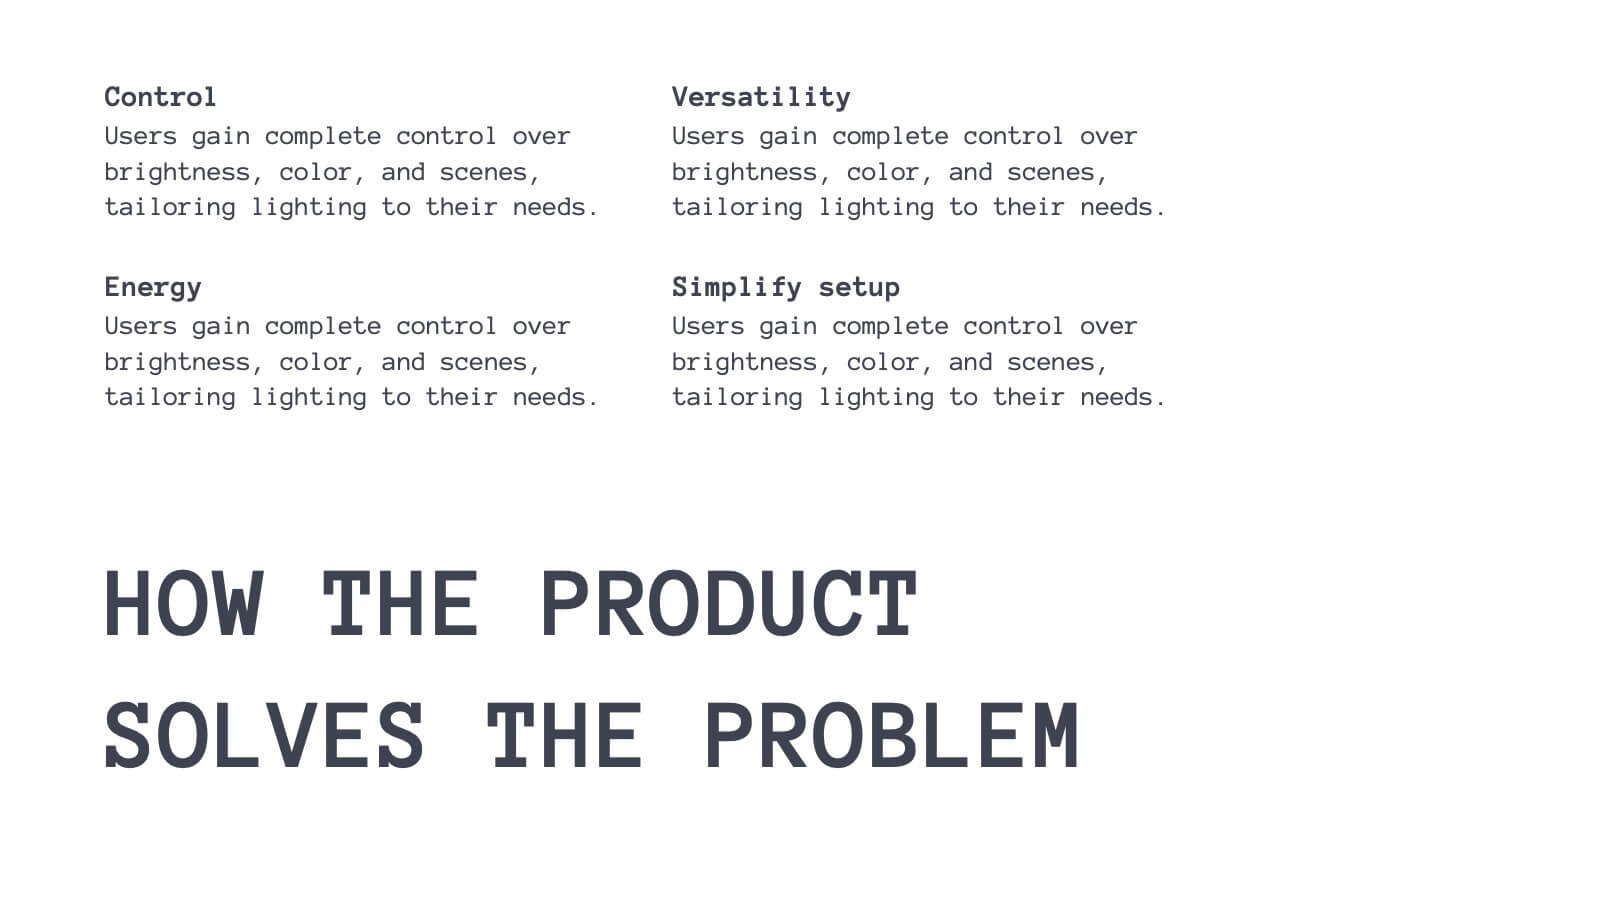
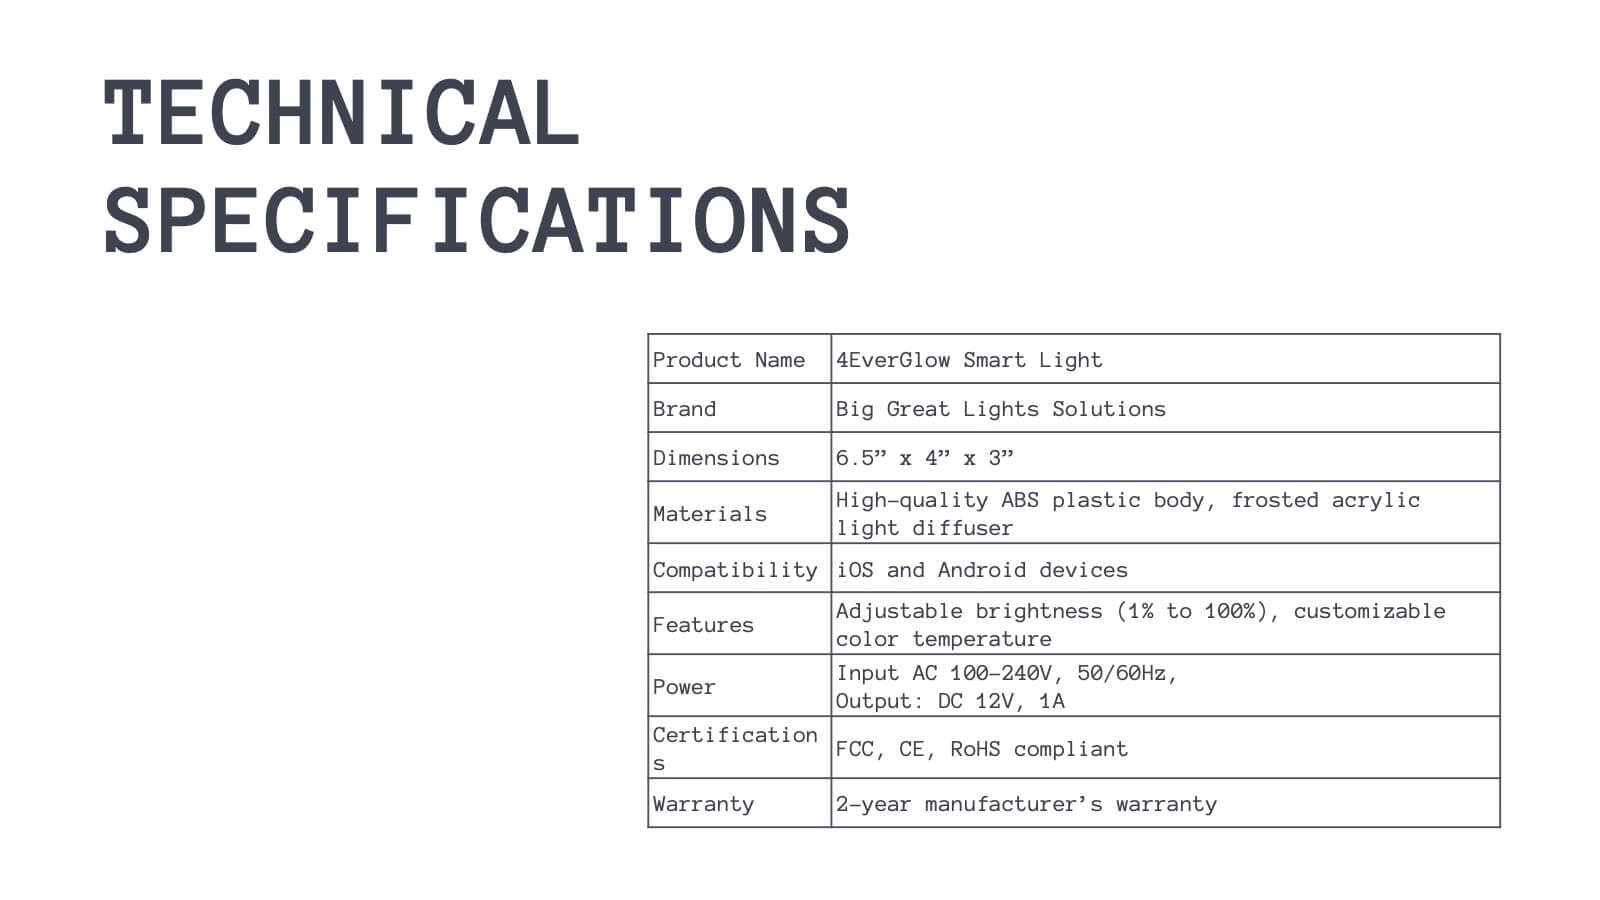
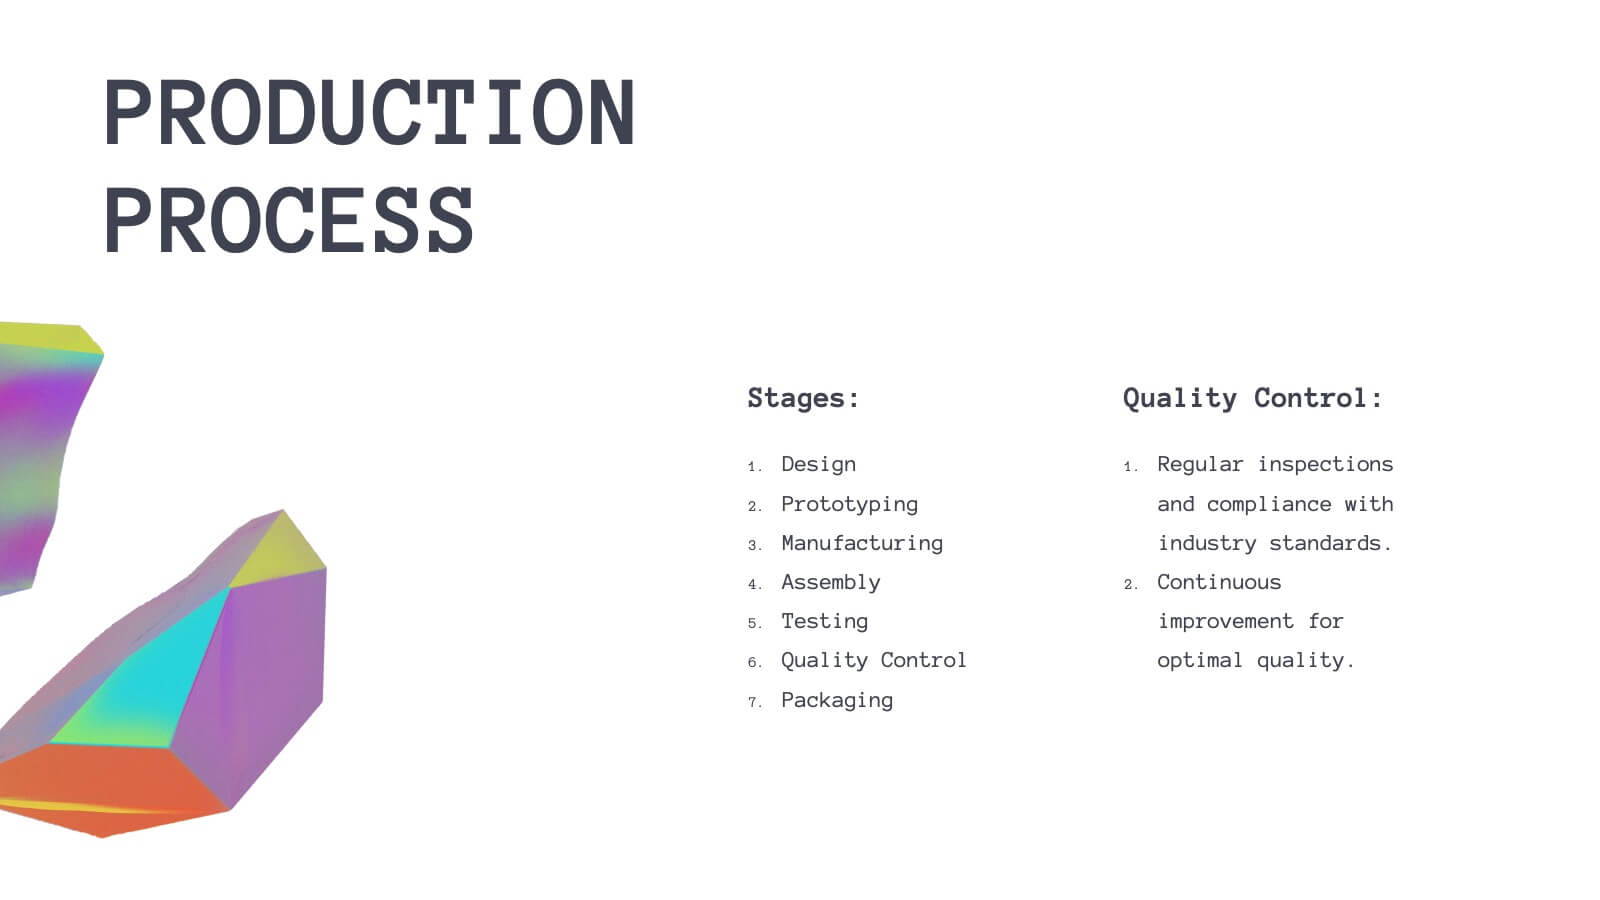
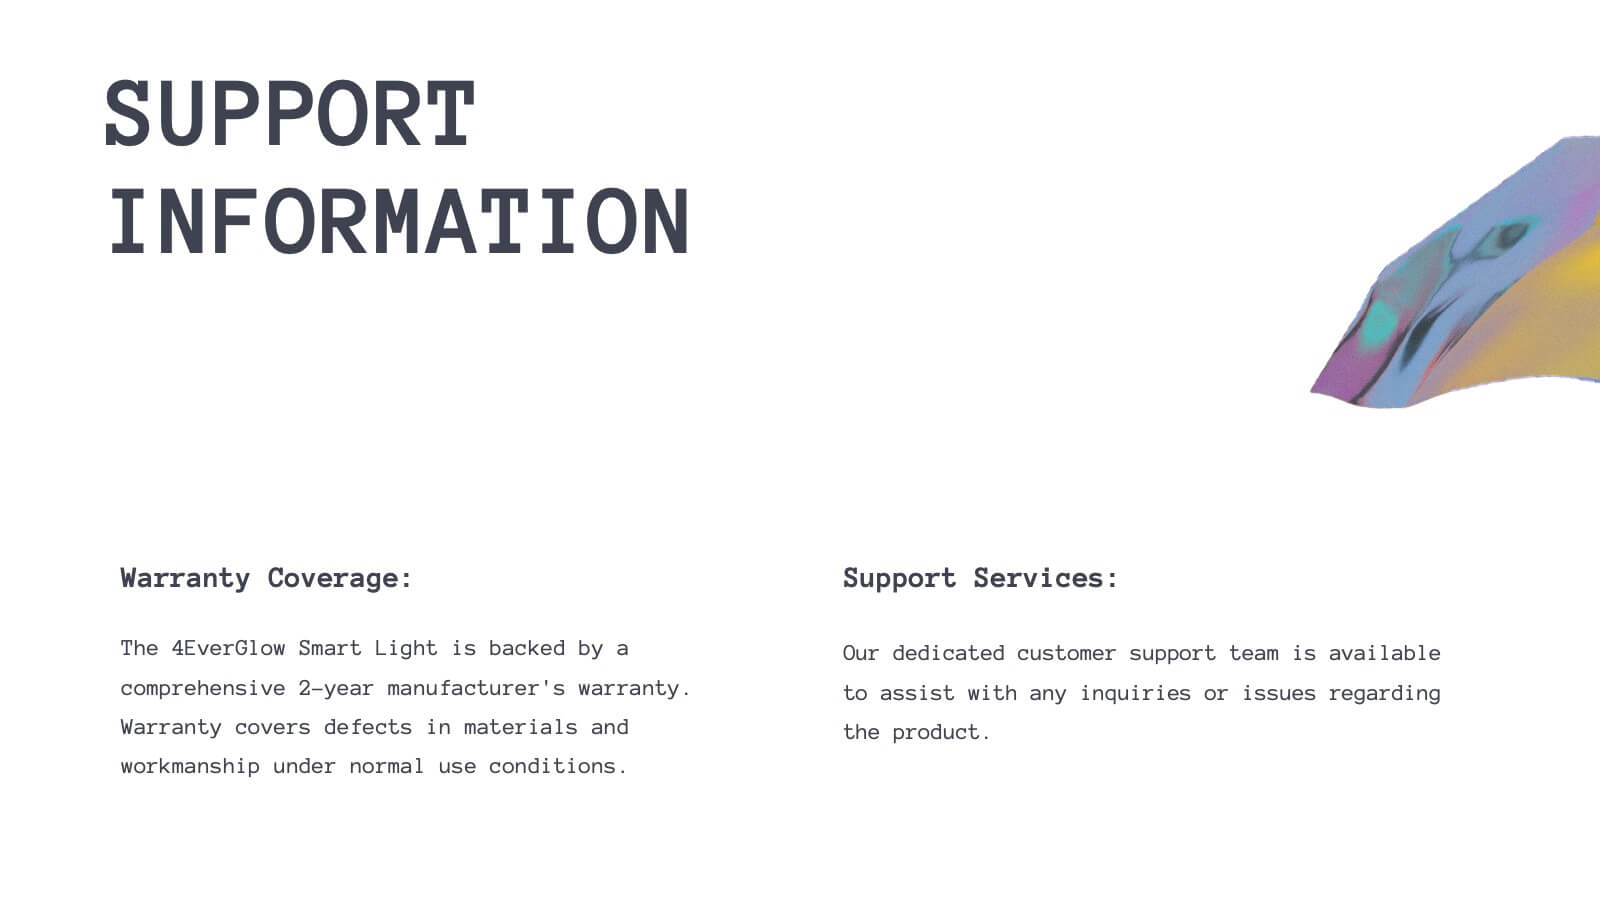
Bring your product journey to life with this vibrant, modern presentation template! Perfect for guiding your audience through product features, customer pain points, and competitive analysis, it’s designed for maximum clarity and engagement. Whether you’re showcasing technical specs or marketing strategies, this template fits all your needs. Compatible with PowerPoint, Keynote, and Google Slides.


3 diapositivas
Corporate Law and Regulation Guide Presentation
Clarify legal structures with the Corporate Law and Regulation Guide Presentation. This visually balanced design uses legal scale and book icons to symbolize authority, compliance, and fairness. Perfect for illustrating legal frameworks, policy breakdowns, or governance models. Fully editable for PowerPoint, Keynote, and Google Slides.


6 diapositivas
Business Performance Pie Chart
Visualize your key metrics clearly with this pie chart-style performance layout. Designed for business reviews and strategic updates, it breaks down five data categories into easy-to-read segments. Ideal for quarterly performance slides, team dashboards, and KPI tracking. Fully editable in PowerPoint, Keynote, and Google Slides.


4 diapositivas
Key Pillar Infographic Slide Presentation
Make your ideas stand tall with this modern pillar-themed infographic layout. Perfect for illustrating strategies, business foundations, or organizational principles, it transforms complex data into visually clear, structured visuals. Fully editable and compatible with PowerPoint, Keynote, and Google Slides for professional and easy-to-customize presentations.


3 diapositivas
Service and Product Benefits Overview Presentation
Clearly contrast key features with the Service and Product Benefits Overview Presentation. This modern split-layout design helps you showcase differences between service offerings and tangible products in a clean, side-by-side format. Use it to highlight value propositions, customer benefits, or decision-making factors. Fully editable and compatible with PowerPoint, Keynote, and Google Slides.


7 diapositivas
One-Page Startup Model Canvas
Launch and refine your business idea with clarity using the One-Page Startup Model Canvas Presentation. This slide presents all key startup elements—Partners, Activities, Value Propositions, Customer Segments, Revenue Streams, and more—in a smart puzzle-piece layout that simplifies complex planning. Perfect for founders and pitch decks. Fully customizable in PowerPoint, Keynote, and Google Slides.


3 diapositivas
Profitability and Cost Analysis Presentation
Evaluate financial efficiency with this profitability and cost analysis template. Designed for business strategists and financial planners, it helps compare costs against revenue to determine profit potential. The visual balance scale enhances clarity, making complex data easier to digest. Fully customizable and compatible with PowerPoint, Keynote, and Google Slides for seamless editing.


6 diapositivas
Project Scope and Deliverables Overview Presentation
Make your project presentations flow effortlessly with a clear, structured layout that highlights goals, milestones, and deliverables. Ideal for tracking progress and aligning teams, this professional design balances clarity and style. Fully compatible with PowerPoint, Keynote, and Google Slides for smooth editing and presentation flexibility.


4 diapositivas
Objectives and Key Results Overview Presentation
Set your goals, define success, and visualize progress with a sleek, easy-to-follow layout that connects objectives to measurable outcomes. Ideal for business strategy, team performance, or quarterly reviews, this presentation keeps your message clear and professional. Fully compatible with PowerPoint, Keynote, and Google Slides for effortless editing.


8 diapositivas
Identifying and Addressing Business Problems Presentation
Break down challenges with clarity using this structured 4-step business problem-solving slide. Highlight each issue with its own icon, number, and explanation, making it easy to communicate obstacles and outline solutions. Ideal for team strategy meetings, leadership briefings, or client reports. Fully customizable in PowerPoint, Keynote, and Google Slides.


23 diapositivas
Stormrider Business Plan Presentation
This Business Presentation Template is designed to help you deliver structured and professional content for conferences, meetings, and corporate events. Featuring key sections such as objectives, speaker introductions, panel discussions, and networking breaks, it ensures a smooth and engaging experience. Fully customizable and compatible with PowerPoint, Keynote, and Google Slides.


23 diapositivas
Rainshadow Digital Strategy Presentation
This Digital Strategy Presentation Template is designed to provide a structured approach to planning and implementing digital initiatives. Covering essential elements such as market trends, competitive analysis, value proposition, and risk management, it offers a professional framework to align goals with actionable steps. Fully customizable and compatible with PowerPoint, Keynote, and Google Slides.


6 diapositivas
Effective Team Structure Guide Presentation
Visualize your team's structure with clarity using this team guide presentation. Designed for highlighting roles, connections, and reporting lines, each slide helps communicate responsibilities and hierarchy efficiently. Ideal for HR, managers, and team leads. Fully editable in PowerPoint, Keynote, and Google Slides—customize colors, names, and positions with ease.


10 diapositivas
4-Quadrant Responsibility Chart Presentation
Bring your message to life with a slide that feels bold, modern, and instantly engaging. This presentation helps you outline four key responsibilities or categories in a clean quadrant layout, making complex information easy to follow and visually compelling. It’s perfect for strategy, workflow, or team-based insights. Fully compatible with PowerPoint, Keynote, and Google Slides.