


Características


¿Tienes alguna pregunta?
Recomendar


4 diapositivas
Digital Course Creation Flow Presentation
Guide your audience through the steps of building a digital course with this clear and modern flowchart layout. Designed to simplify complex processes, this visual template is ideal for educators, instructional designers, or online coaches. Fully compatible with PowerPoint, Keynote, and Google Slides for easy customization and seamless use.


5 diapositivas
Cyber Security Management Infographics
Cyber Security Management is important because it helps to protect organizations from cyber threats and attacks. These Infographics are visual representations of information related to the management of cyber security. This template can be used to provide summaries on the various aspects of cyber security management such as risk assessment, security policies, threat detection and response, and data protection. These infographics are designed to help individuals and organizations understand the importance of cyber security management and the steps that need to be taken to ensure the security of their systems and data.


34 diapositivas
Founder Startup
A Founder Startup, is a newly established business venture that is typically founded by one or more individuals or groups with an innovative idea, concept, or product. This template is designed to help you create a professional and compelling presentation that showcases your startup and its founders in a impactful way. Compatible with PowerPoint, Keynote, and Google Slides. Included in this template are a variety of pre-designed slides that will help cover different aspects of your startup, such as team introduction, overview, vision and mission, product or service description, market analysis, financials, and more.


4 diapositivas
90-Day Success Plan for New Hires Presentation
Set your team up for success with this 90-Day Success Plan for New Hires Presentation. This template is perfect for onboarding workflows, outlining key milestones at 30, 60, and 90 days. Help managers and HR professionals communicate expectations clearly and track new employee progress. Fully editable in PowerPoint, Keynote, and Google Slides.


5 diapositivas
Pandemic Spreading & Symptoms Infographics
Pandemic spreading refers to the rapid and widespread transmission of a contagious disease, affecting a large number of people across multiple regions or countries. These infographic templates are comprehensive visual tools designed to educate and inform viewers about the spreading patterns and symptoms of pandemics. These aims to raise awareness and promote understanding of how pandemics spread, their impact on public health, and the common symptoms associated with infectious diseases. Compatible with Powerpoint, Keynote, and Google Slides. These enable viewers to better understand the dynamics of pandemics and take measures to protect themselves and their communities.


21 diapositivas
Techne Strategic Planning Report Presentation
Streamline your strategic planning process with this meticulously crafted presentation template, designed for professionals seeking clarity and structure. Featuring slides dedicated to market trends, SWOT analysis, target audience profiling, and competitive insights, this template ensures your strategy is well-rounded and impactful. The clean and modern design accommodates sections for defining objectives, key challenges, and resource allocation, allowing your team to focus on actionable solutions. Performance metrics and risk management slides help you track progress and address uncertainties effectively. Whether presenting to stakeholders or internal teams, this tool simplifies complex data into easily digestible visuals. Fully editable and compatible with PowerPoint, Google Slides, and Keynote, this template provides the flexibility to adapt to various needs. Perfect for organizations aiming to communicate strategic initiatives and actionable plans with precision and professionalism. Take your strategic planning reports to the next level with this essential template.


5 diapositivas
Clear Strategy in Five Stages Presentation
Outline your strategic roadmap with this five-step cube staircase layout. Perfect for planning, growth tracking, or project milestones, each stage is color-coded with icons and numbered steps for clarity. Easy to edit in PowerPoint, Keynote, and Google Slides—ideal for business planning, strategy sessions, or performance reviews.


7 diapositivas
Numbers Infographic Presentation Template
This Numbers Infographic Presentation is a great resource for business and education. Designed to give you a quick and easy way to educate in an infographic presentation to use as an overview, or specific product description of what you are selling. This template features a smart object to insert text, images and logos which allow for easy customization. Each design is specially made and crafted in the highest quality possible to help bring your message to life in an exciting new way. This template is ideal for conveying statistical information in a visually stunning and engaging way.


5 diapositivas
History of Vaccine Infographics
The History of Vaccines is a fascinating journey that spans centuries and has significantly impacted human health and disease prevention. With these infographic templates, you can effectively communicate the importance of vaccines, highlight their role in disease prevention, and debunk common misconceptions. It serves as an educational tool to promote understanding and appreciation for the significant advancements in vaccine development that have saved countless lives throughout history. Use these to provide a comprehensive overview of the history of vaccine and help individuals understand the importance and impact of vaccines.


4 diapositivas
Project Planning in Four Steps Presentation
Streamline your workflow with the Project Planning in Four Steps presentation. This structured slide layout simplifies task organization, milestone tracking, and goal-setting into a clear, four-step process. Perfect for business strategies, project management, and team collaboration. Fully customizable and compatible with PowerPoint, Keynote, and Google Slides for effortless integration.


7 diapositivas
Artificial Intelligence Presentation Template
An Artificial Intelligence infographic is a visual representation of information related to AI. This high-definition infographic is completely customizable and will allow you to see advances in AI and other networks. Artificial Intelligence, is evolving rapidly. It's important that we understand what's going on so that we can ensure the future of this technology is beneficial to society. In this informative infographic, you will be able to learn and inform about everything from the difference between artificial intelligence and the differences between expert systems by adding you own data.


6 diapositivas
Creative 3D Elements Slide
Add visual depth and structure to your ideas with this unique 3D cube environment. Ideal for breaking down five components or phases, this layout helps your content stand out while maintaining a professional, modern aesthetic. Compatible with PowerPoint, Keynote, and Google Slides.
9 diapositivas
Arrow Security Infographic
Introducing our new "Arrow Security Infographic", this is a visually engaging and informative presentation template that focuses on various aspects of arrow infographics. This template can be used to provide an overview of different security measures, techniques, and technologies that can be implemented to enhance safety and protect against potential threats. This is designed with a variety of arrow infographics that can help help individuals and organizations understand the importance of security and make informed decisions to safeguard their assets and interests. Compatible with Powerpoint, Keynote, and Google Slides.


23 diapositivas
Pomona Business Plan Presentation
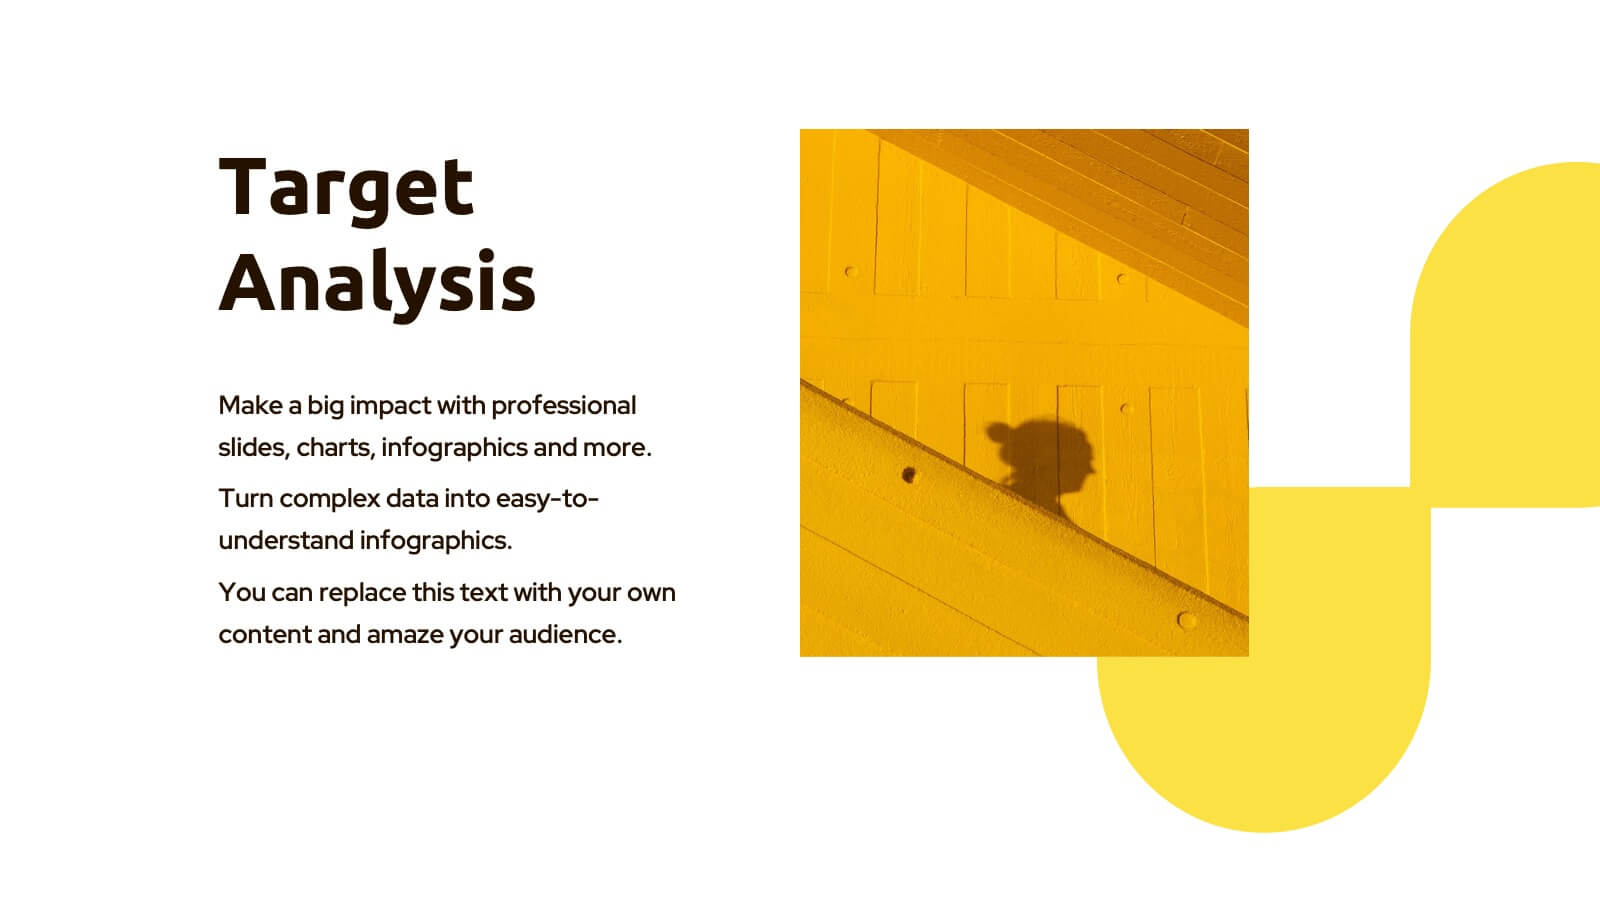
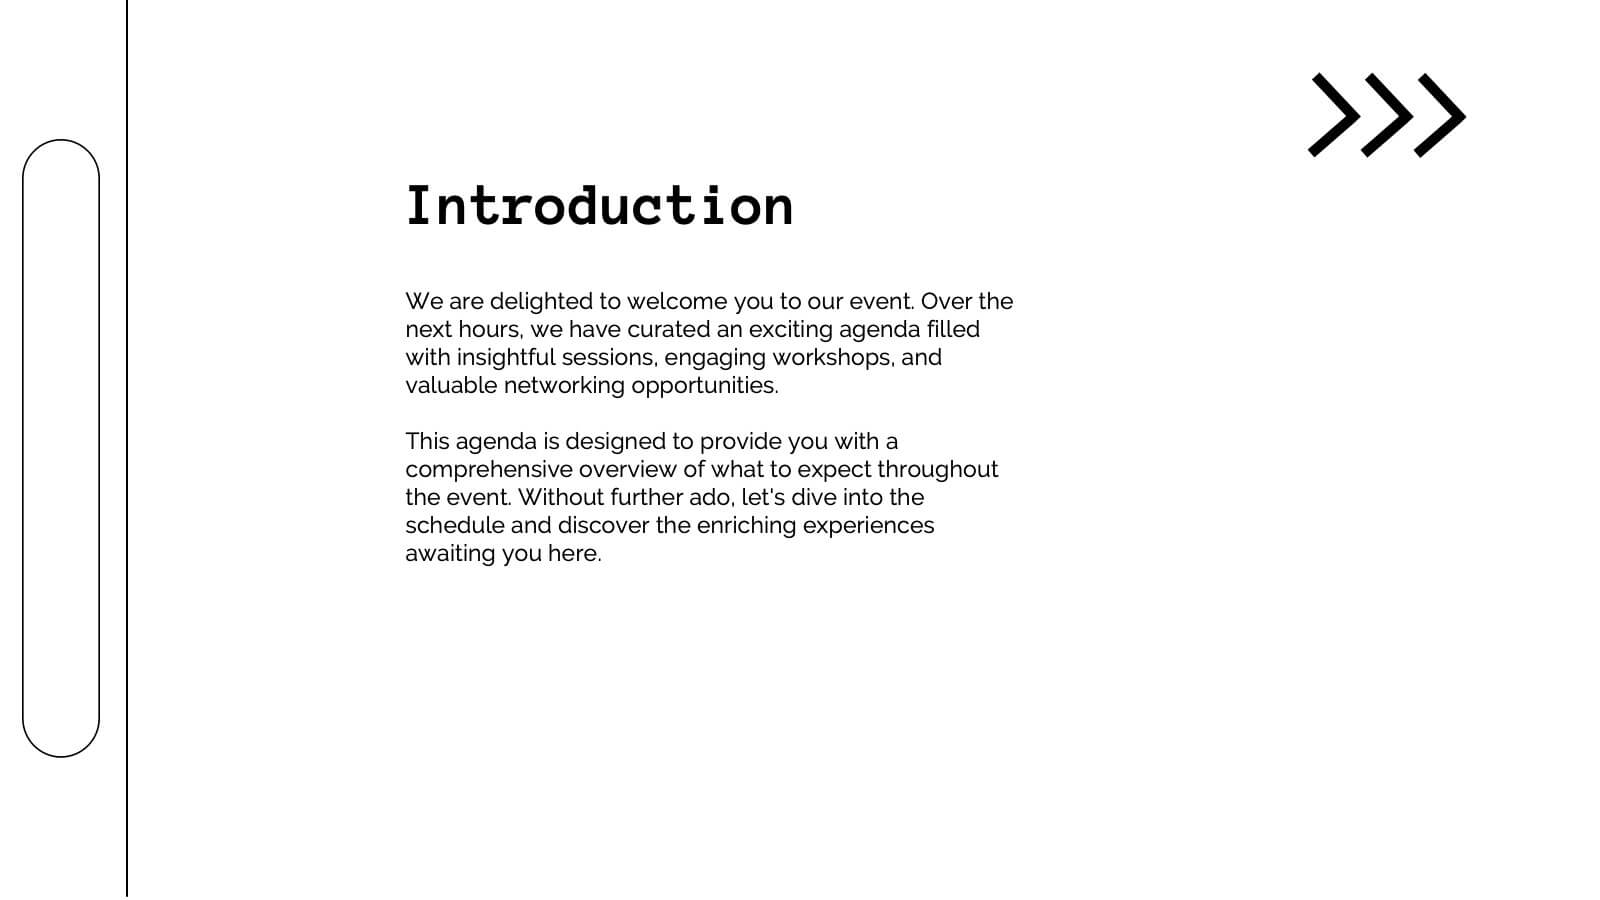
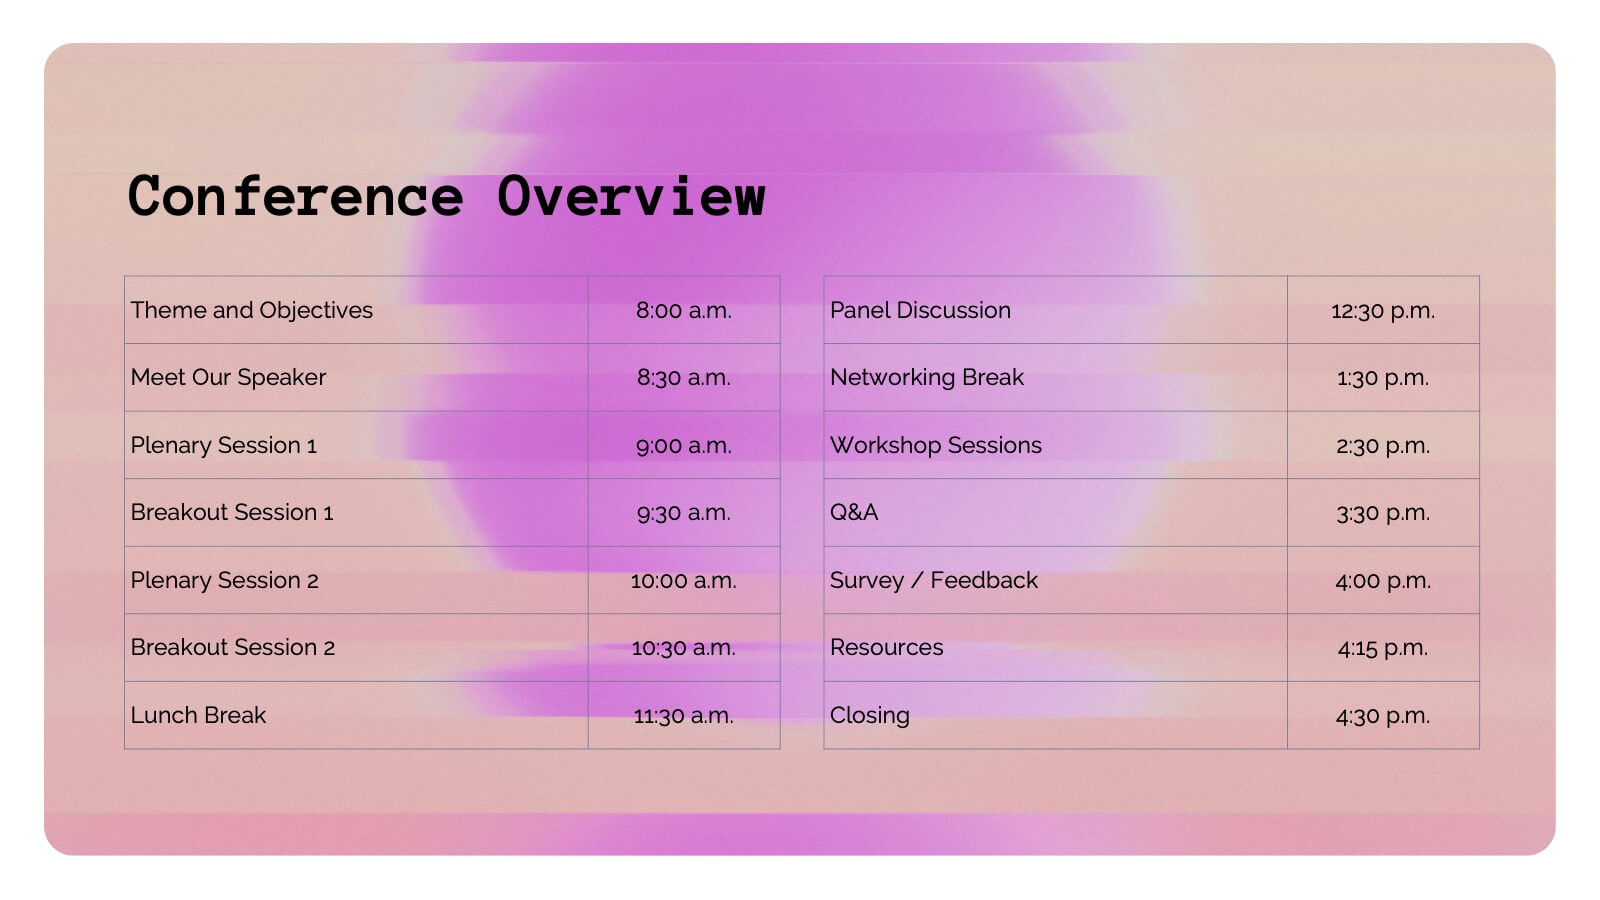
This vibrant and adaptable event agenda template is perfect for organizing your business conference or corporate event. It includes customizable sections for session details, speaker information, and key activities like networking breaks, workshops, and panel discussions. Compatible with PowerPoint, Keynote, and Google Slides, it ensures a smooth and engaging event presentation experience!


7 diapositivas
Supply Chain Process Mapping Presentation
Streamline your logistics and operations presentations with the Supply Chain Process Mapping Presentation. Featuring a linked-chain visual, this editable template is ideal for outlining each step in your supply flow—from sourcing to delivery. Highlight dependencies, bottlenecks, or key stages with customizable color coding. Fully compatible with PowerPoint, Keynote, and Google Slides.


6 diapositivas
Business Model Canvas Proposition Infographic
The Business Model Canvas is a strategic management tool that provides a visual framework for describing, analyzing, and developing a business model. This infographic template visually represents the key components of a business model using the Business Model Canvas framework. This framework provides an overview of how a business creates, delivers, and captures value. This template is designed to be a comprehensive way to map out all the key components of a business model. This infographic is a versatile tool perfect for startups, established companies, and entrepreneurs to visualize, communicate, and iterate on their business models.


4 diapositivas
Organizational Mission Strategy Presentation
Stand tall with this mountain-themed layout—perfect for showcasing the pillars of your organizational mission strategy. Each peak represents a strategic objective or core value, guiding your team toward a shared goal. Fully compatible with PowerPoint, Keynote, and Google Slides.