


Características


¿Tienes alguna pregunta?
Recomendar


6 diapositivas
Sales Strategy 30-60-90 Day Plan Presentation
Drive sales success with this structured 30-60-90 day strategy template! Designed to help sales teams and professionals set clear objectives, track progress, and optimize performance, this layout ensures a smooth transition from planning to execution. Fully customizable and compatible with PowerPoint, Keynote, and Google Slides for seamless presentations.


21 diapositivas
Ceres Financial Report Presentation
This financial report template is designed to showcase performance metrics, sales analysis, project progress, and strategic insights with clarity and professionalism. Featuring slides for operational updates, competitor insights, and recommendations for improvement, it ensures a comprehensive financial overview. Compatible with PowerPoint, Keynote, and Google Slides for flexible presentations.
23 diapositivas
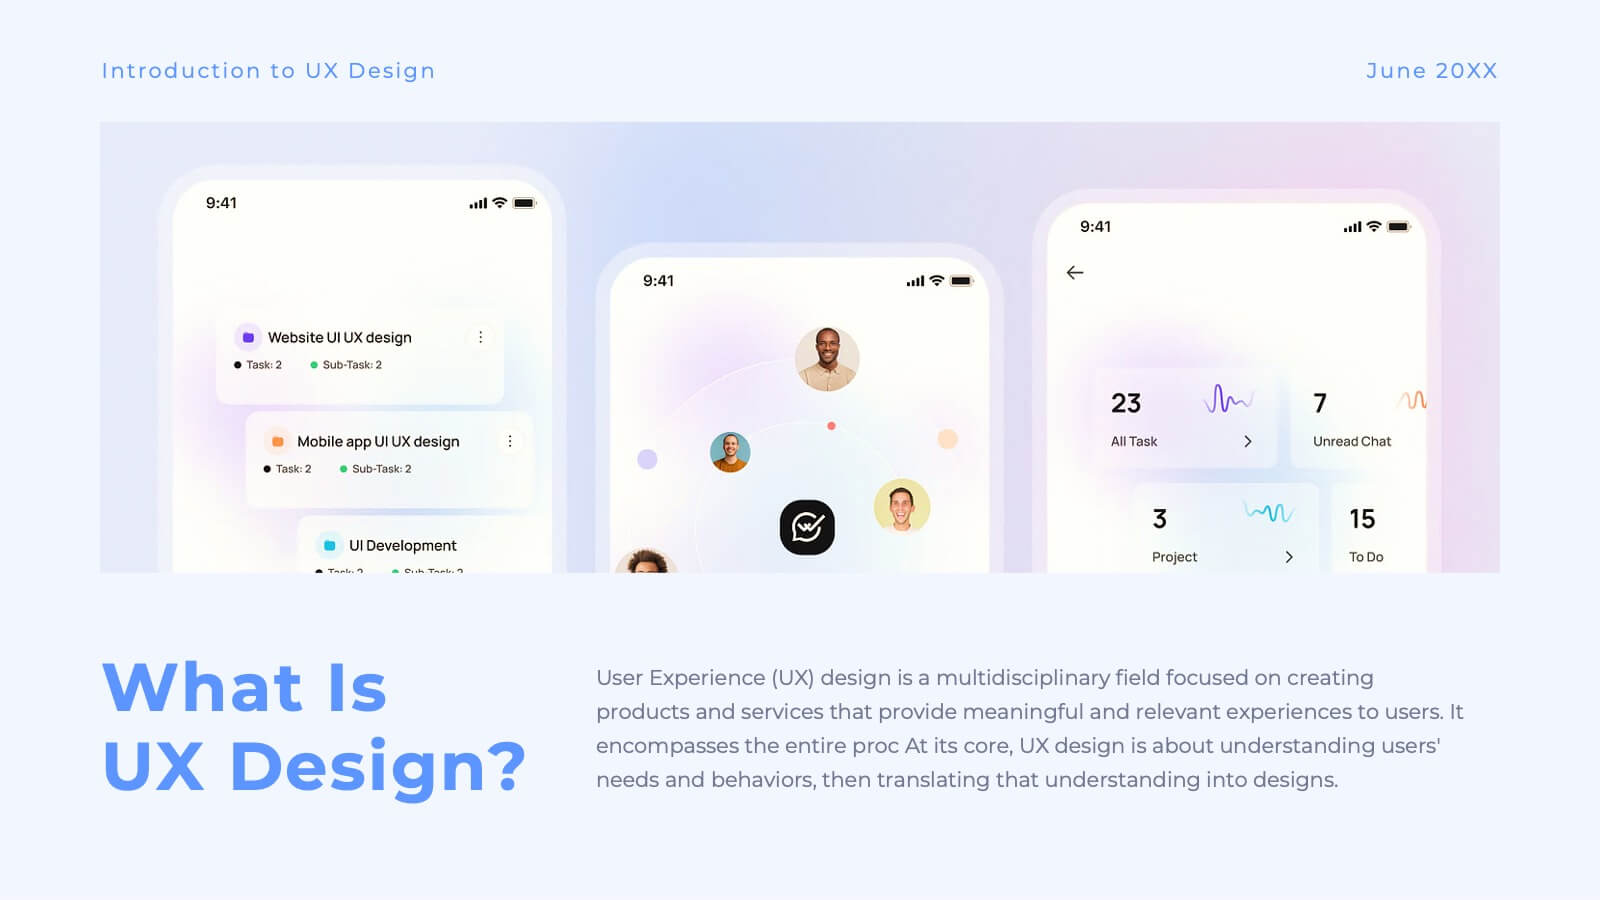
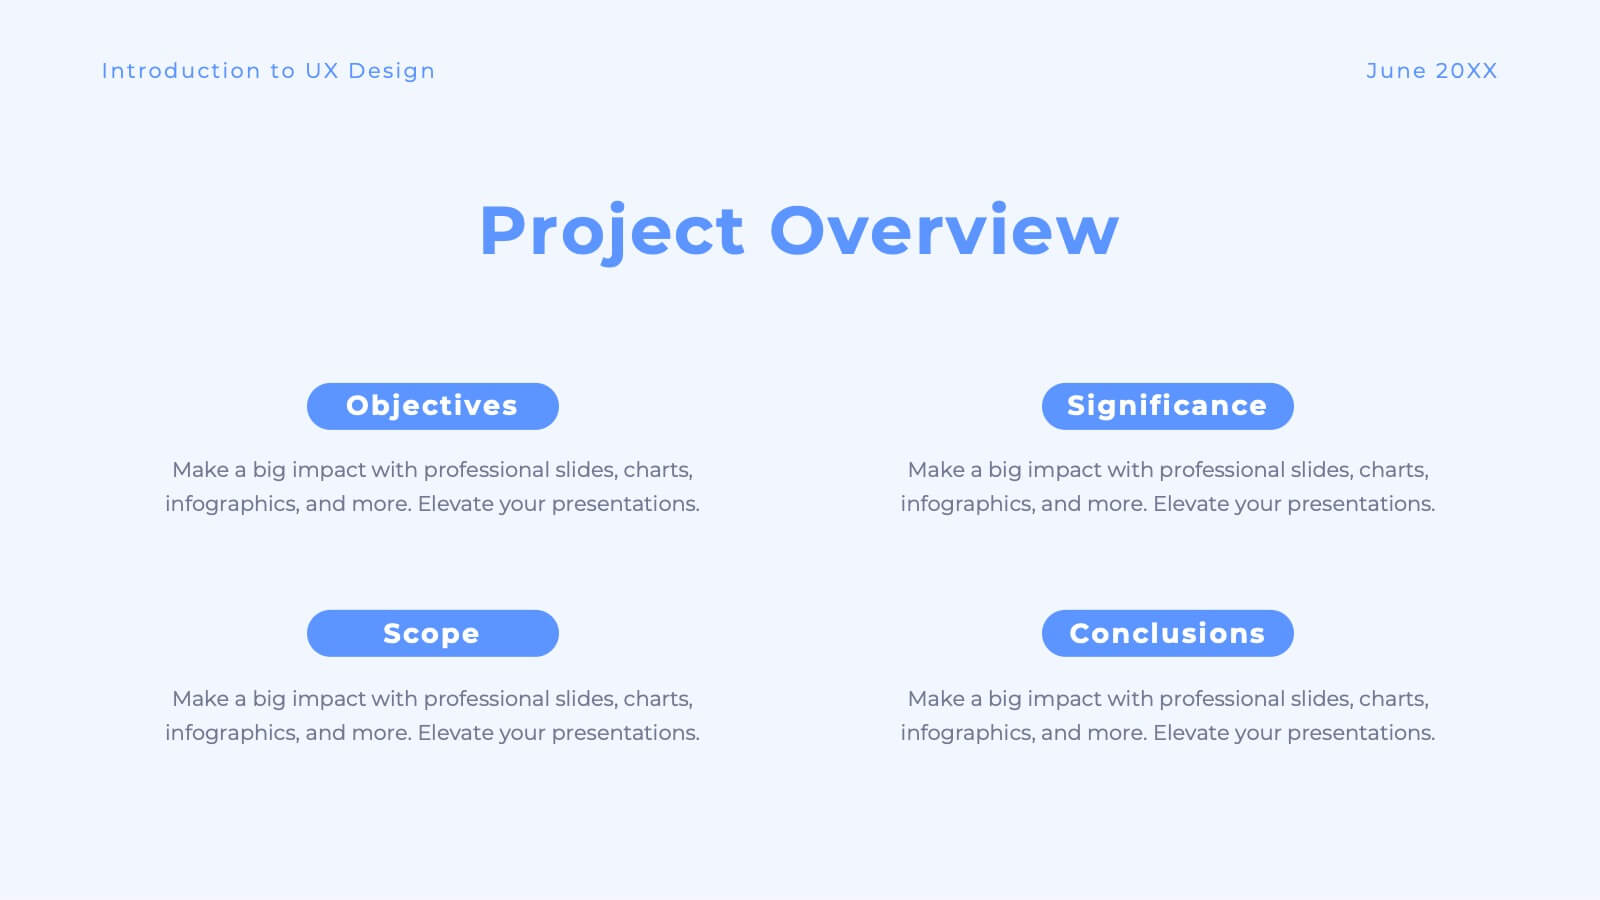
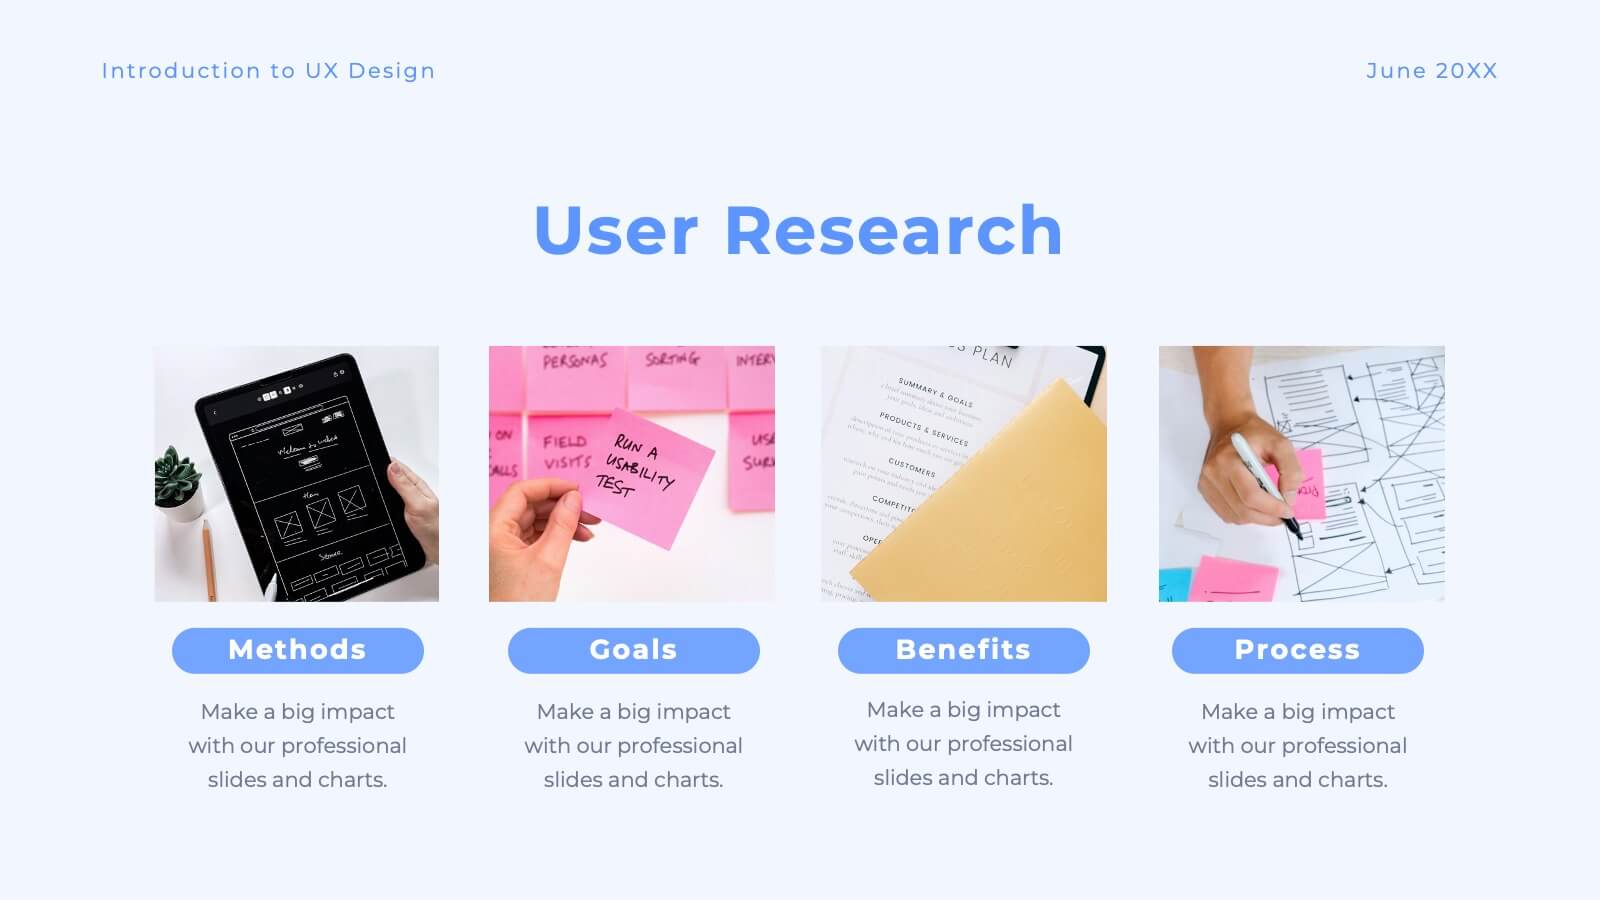
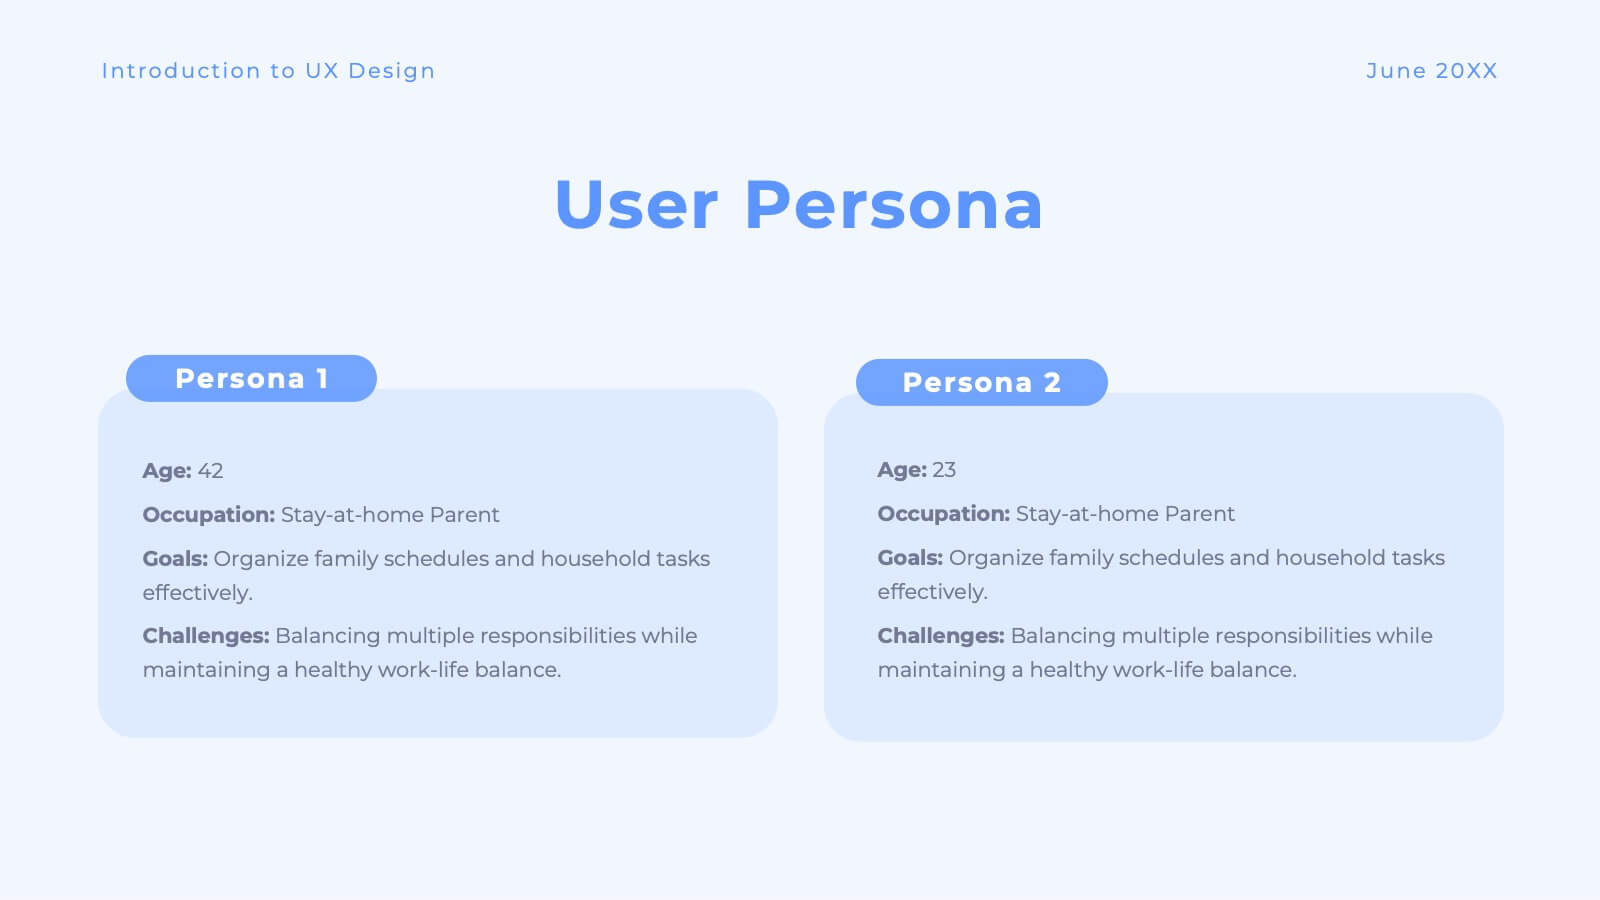
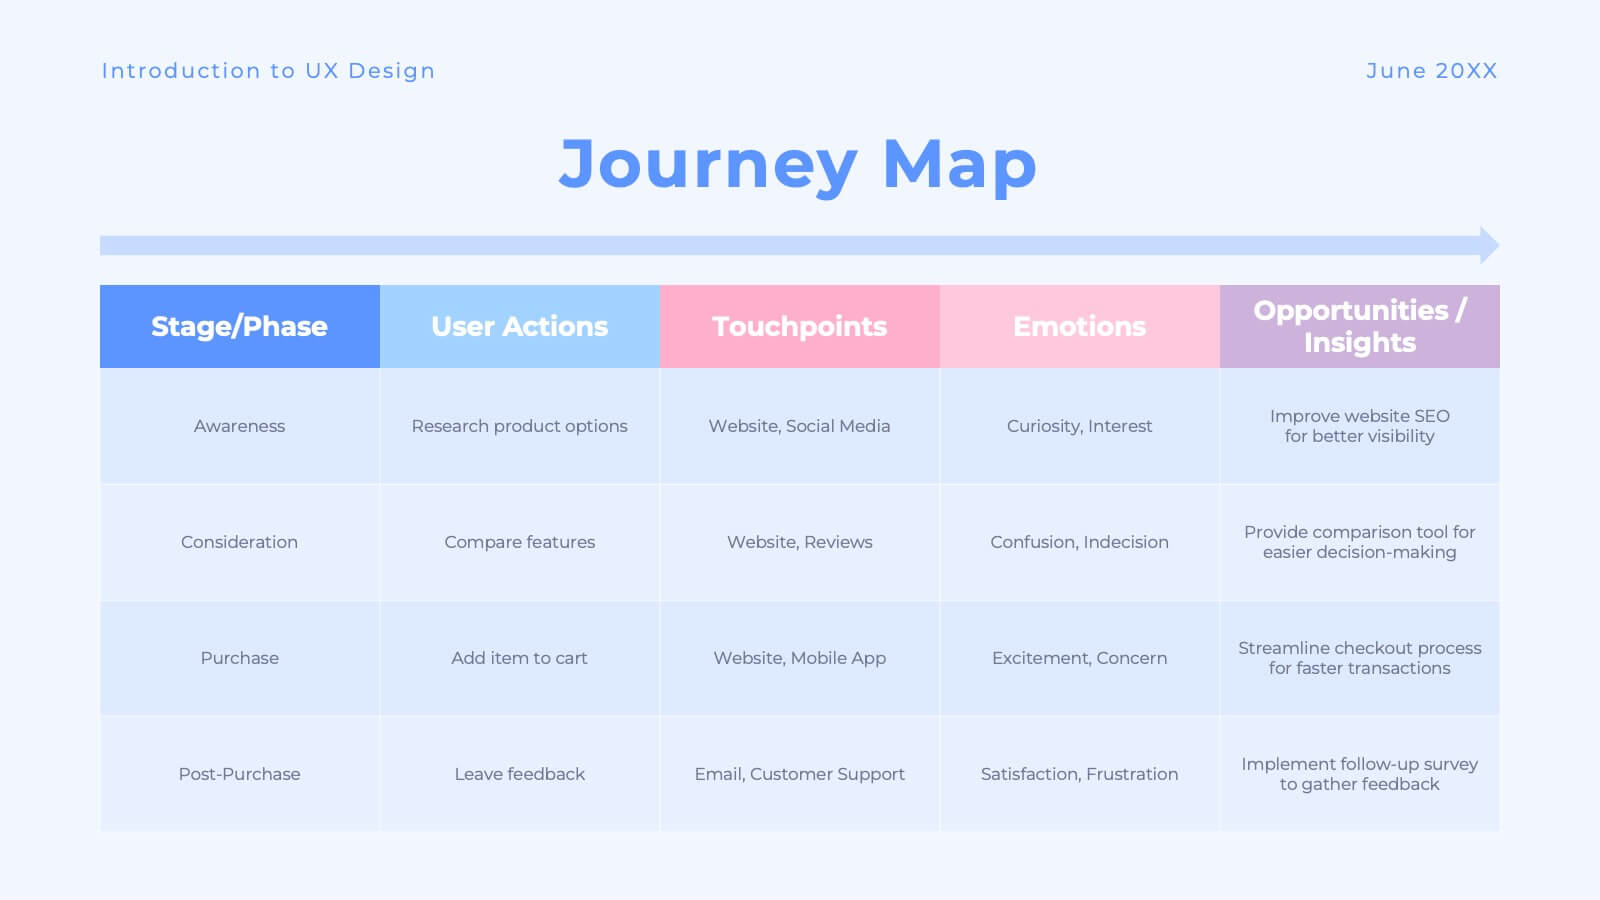
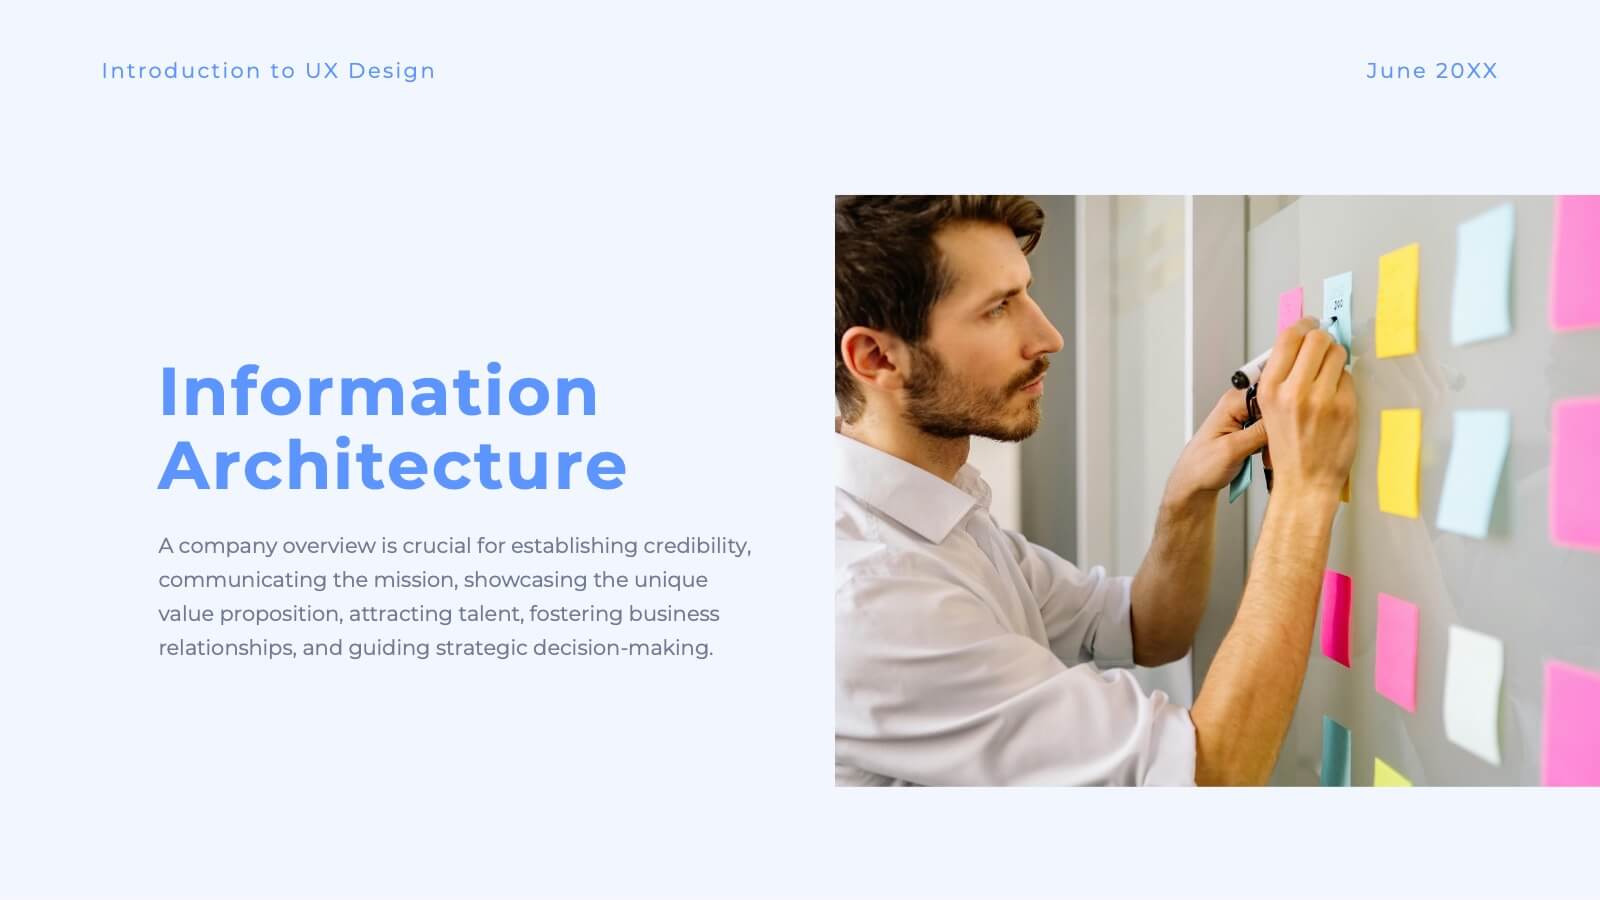
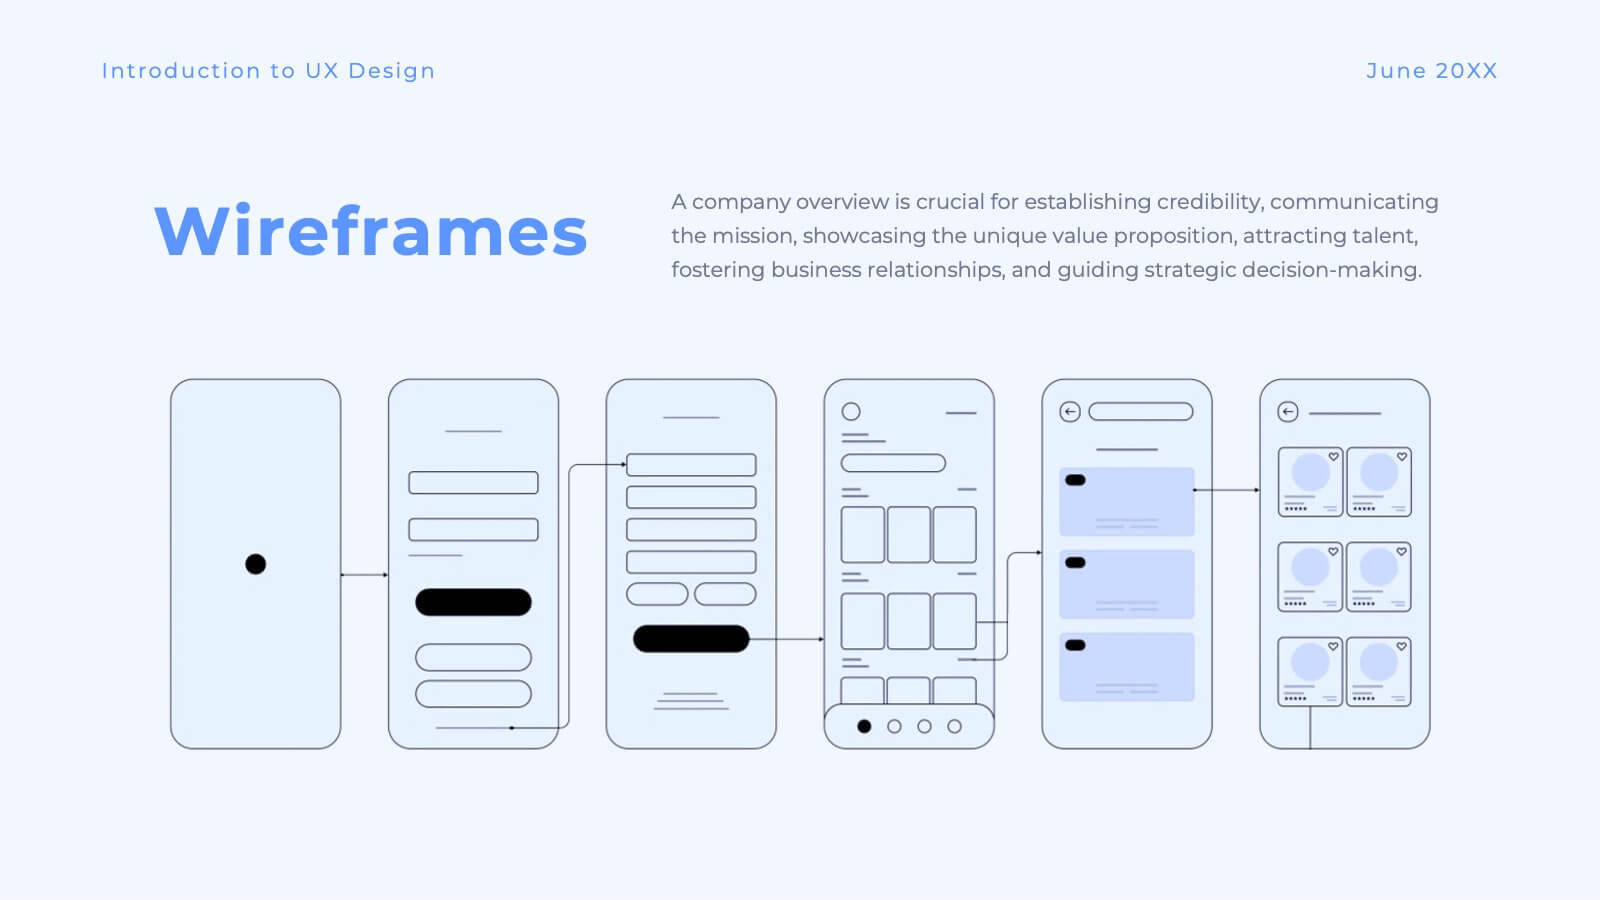
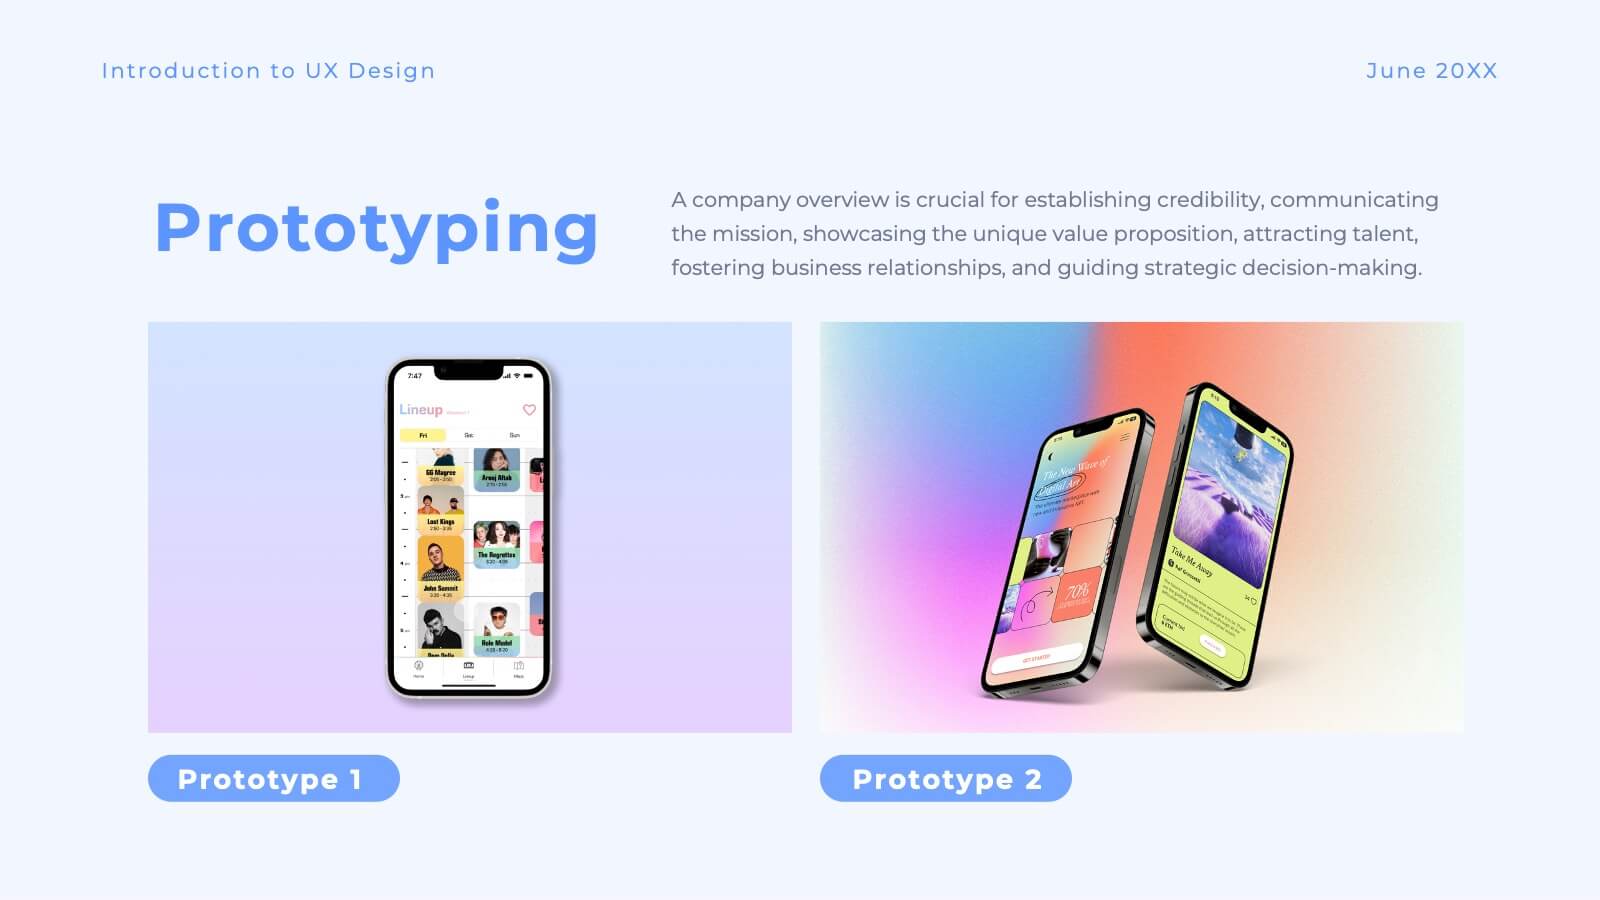
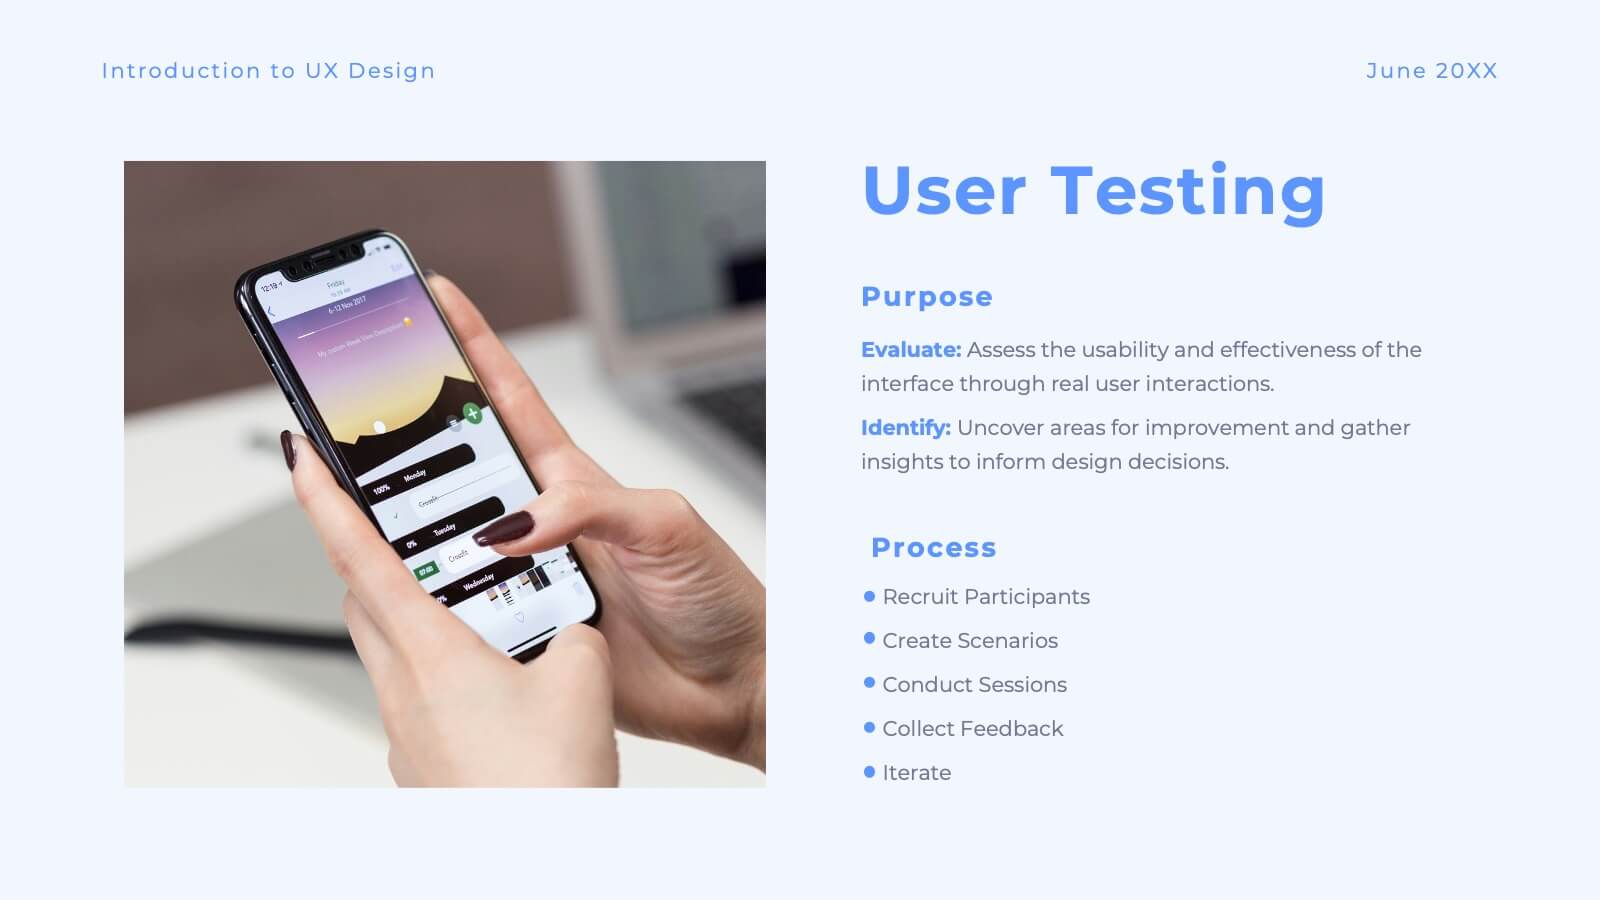
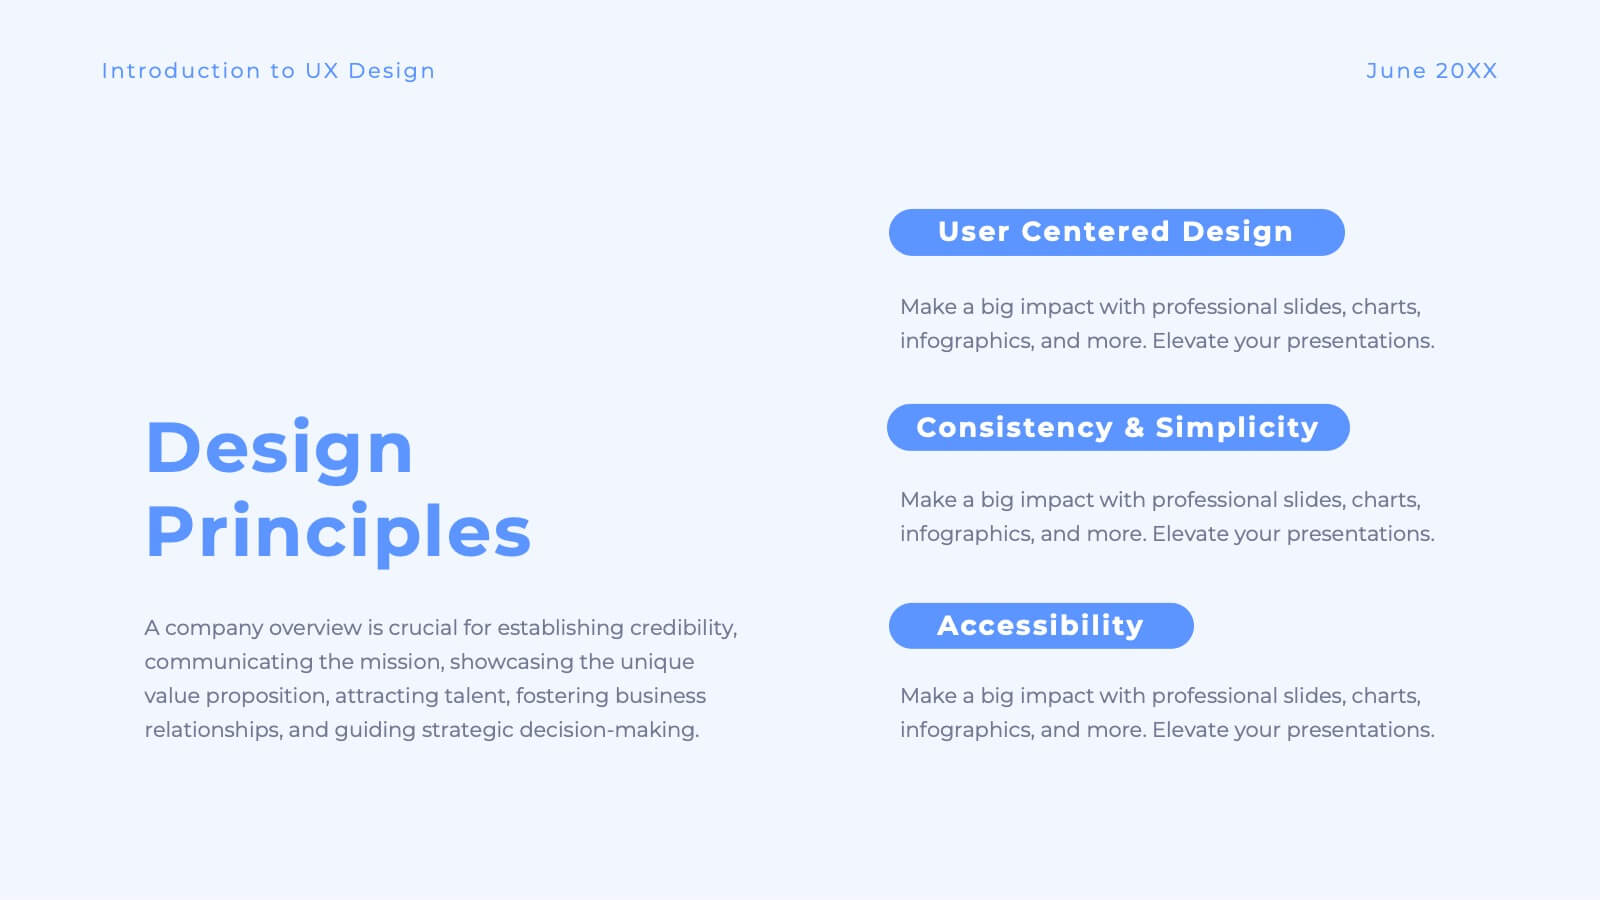
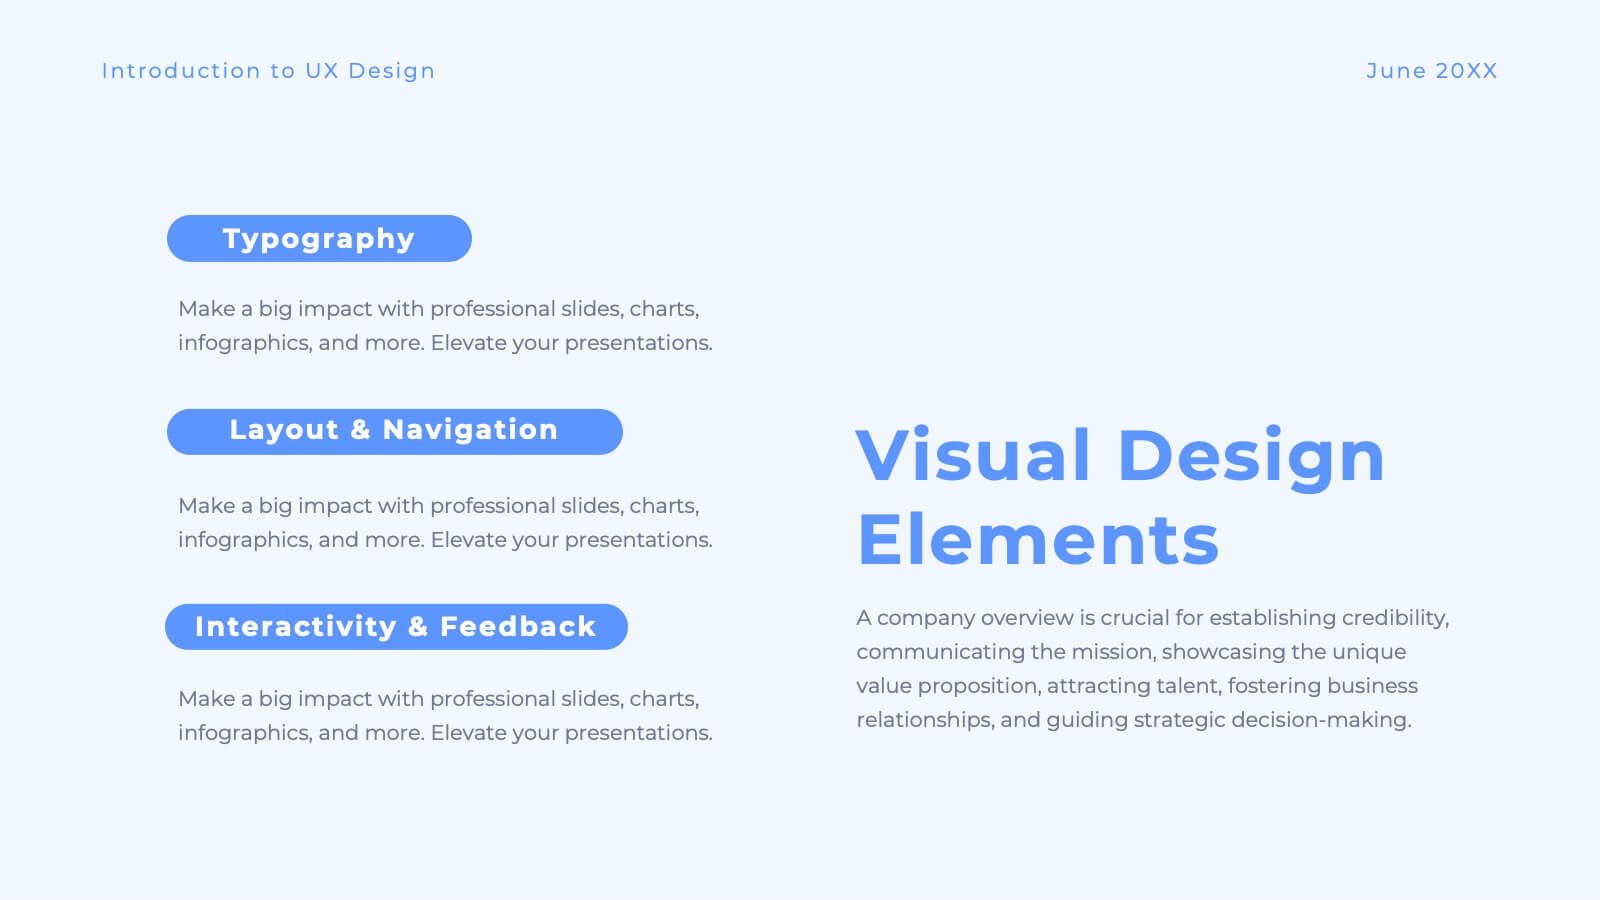
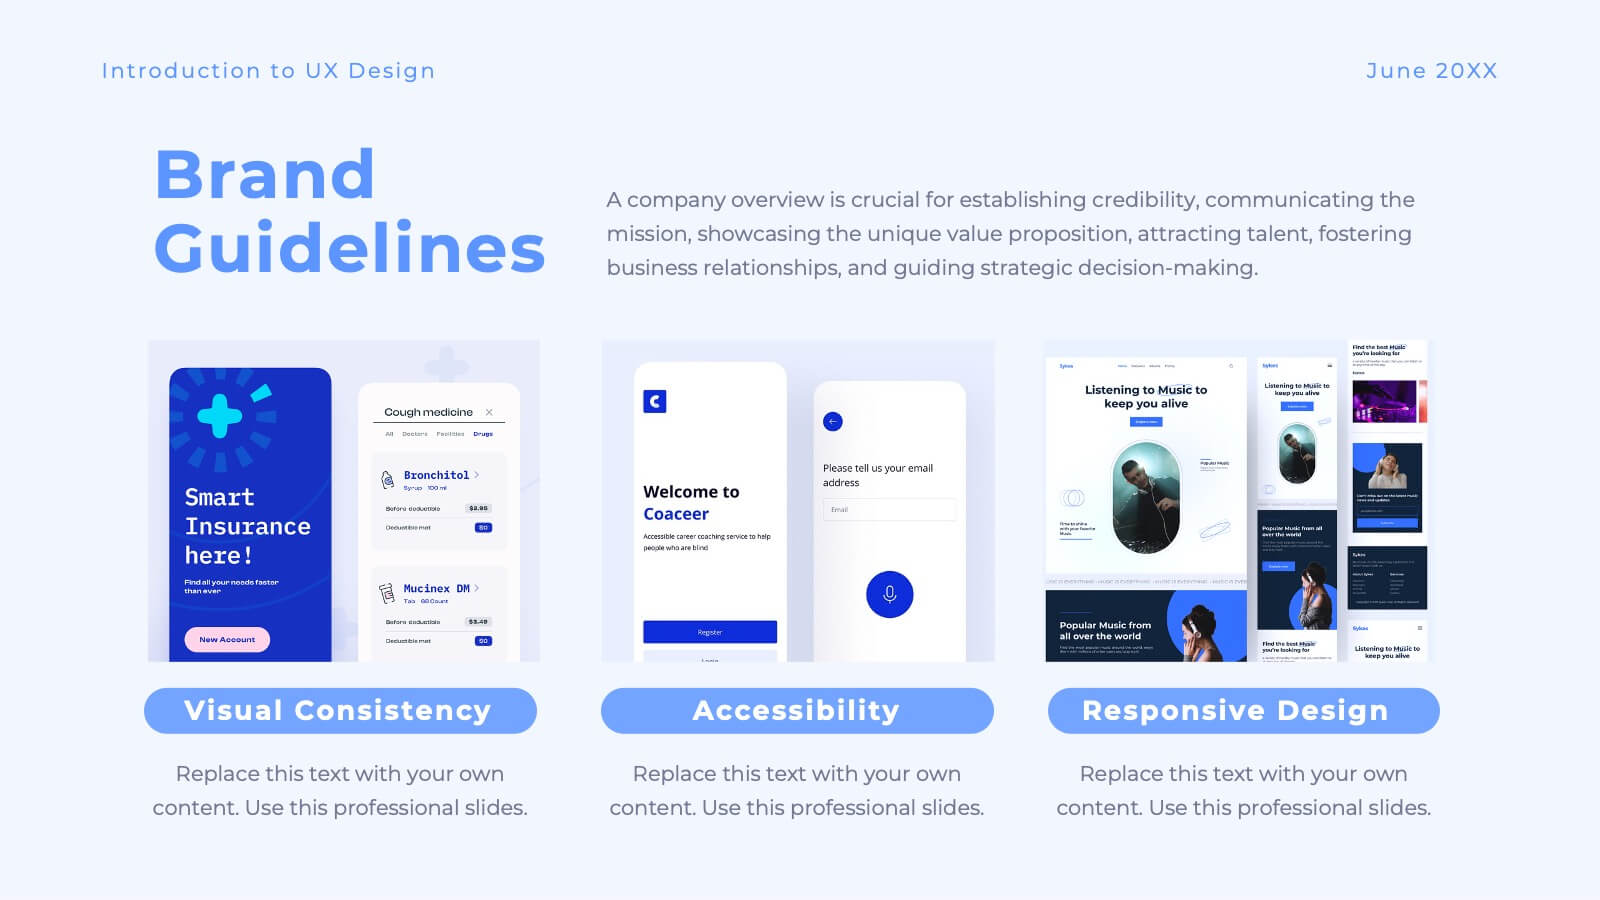
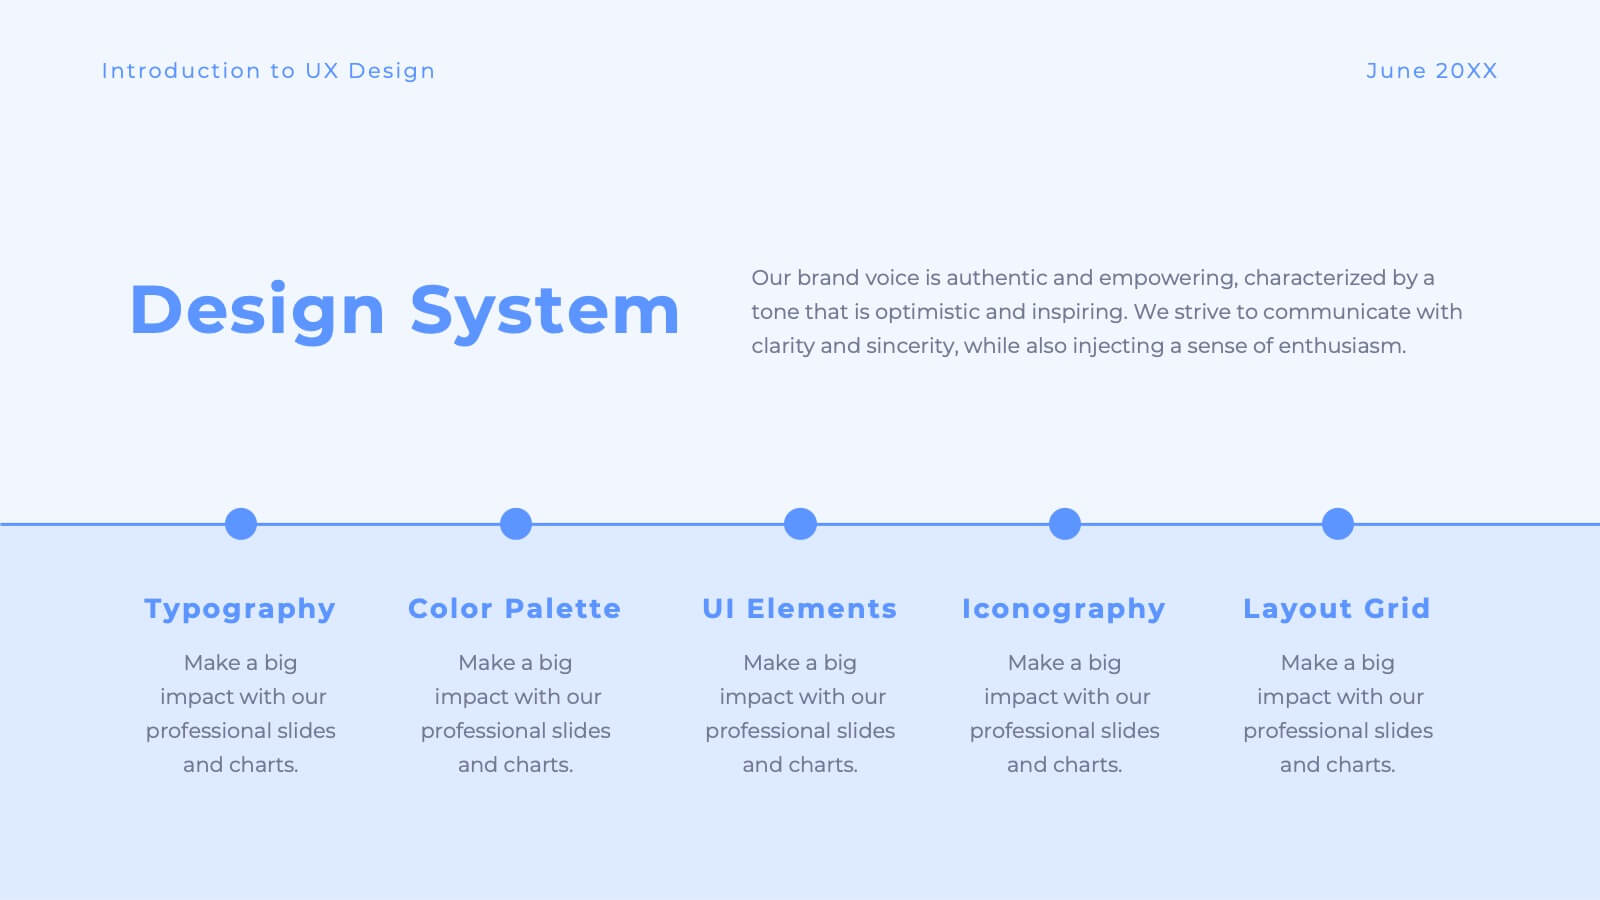
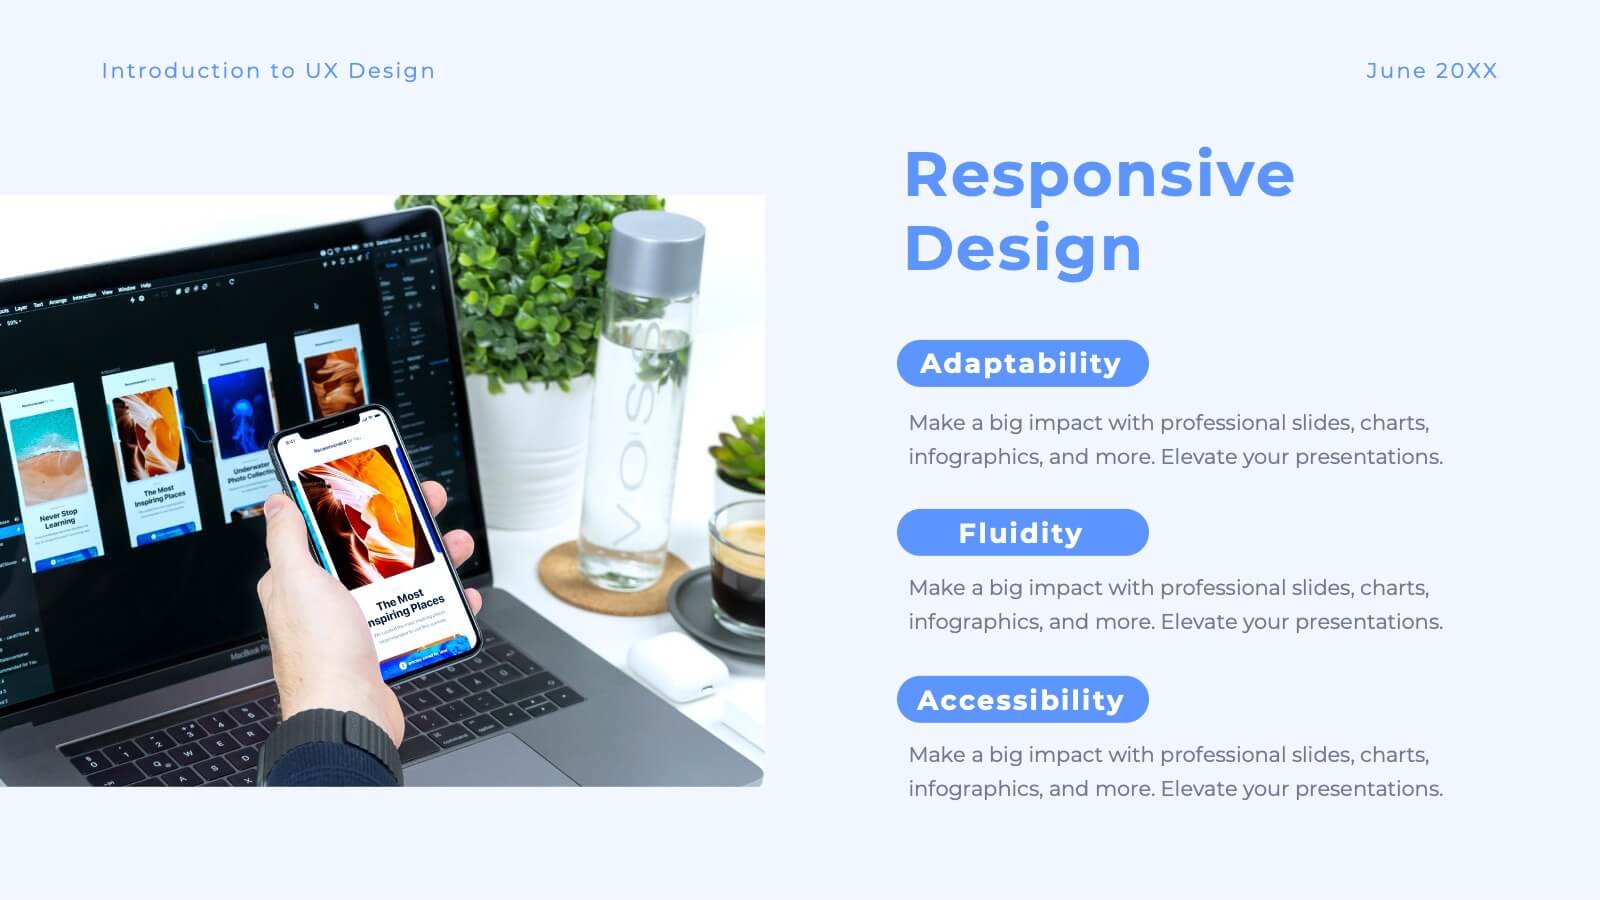
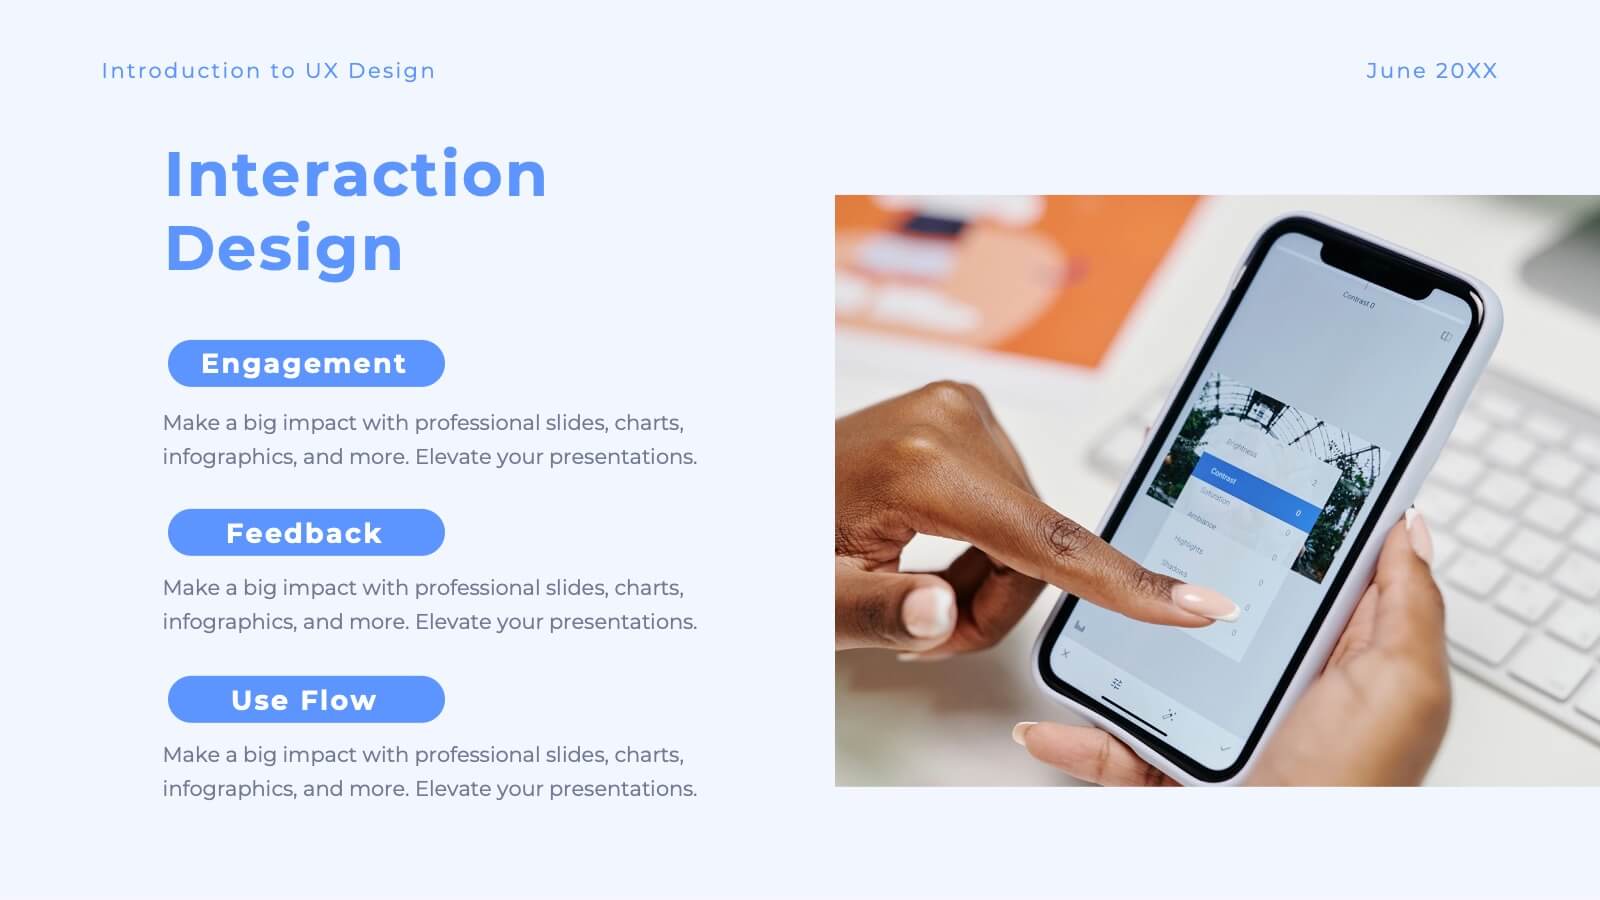
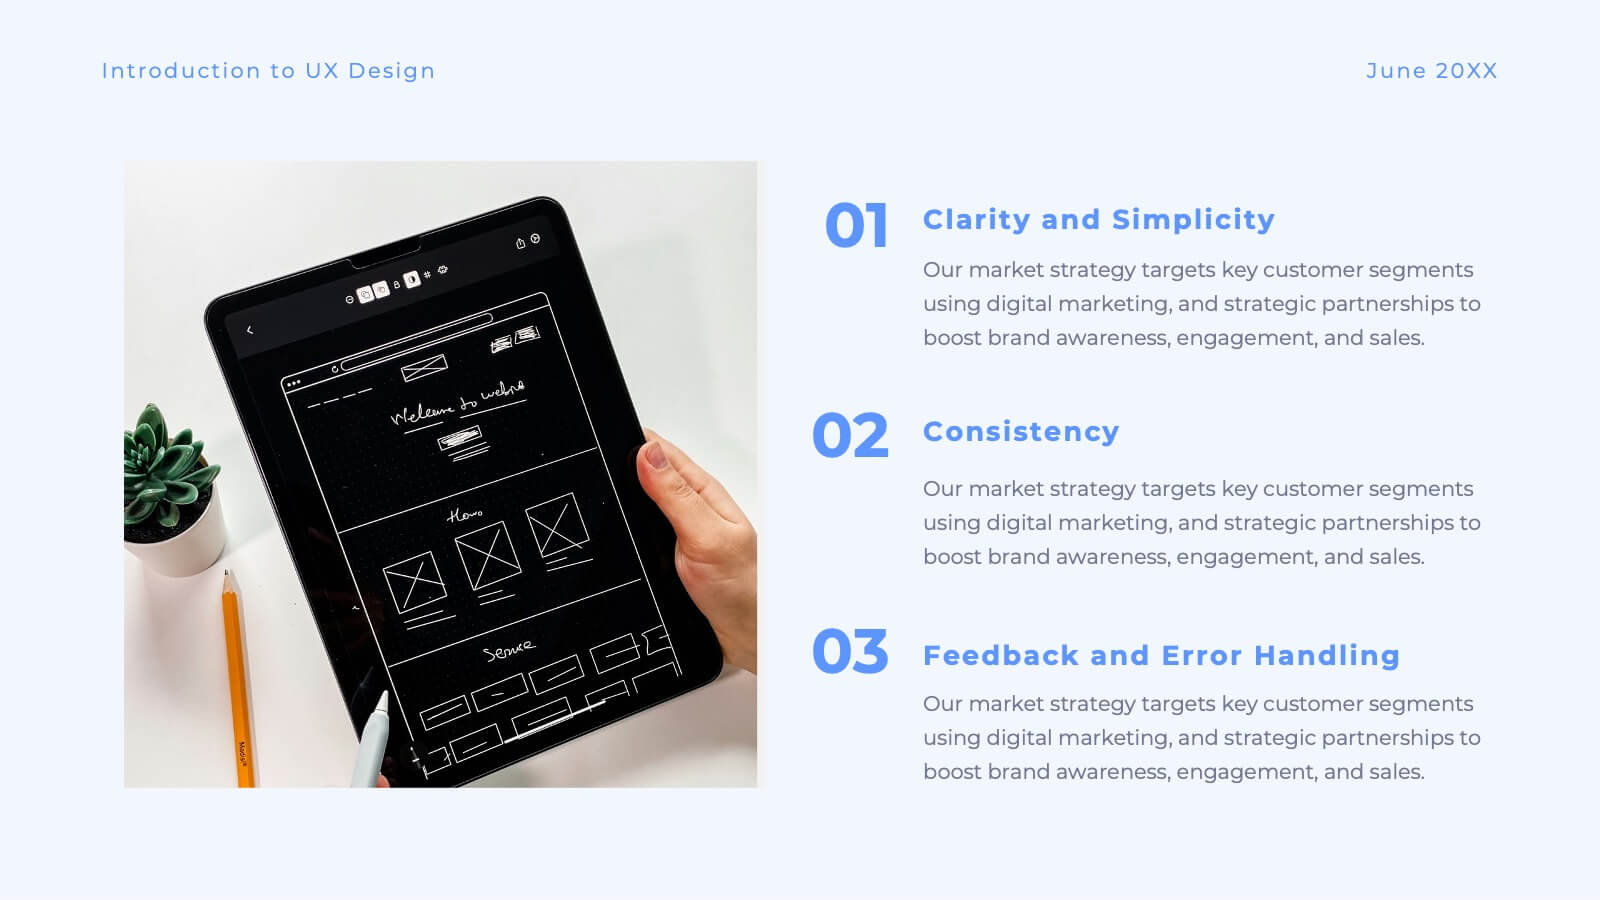
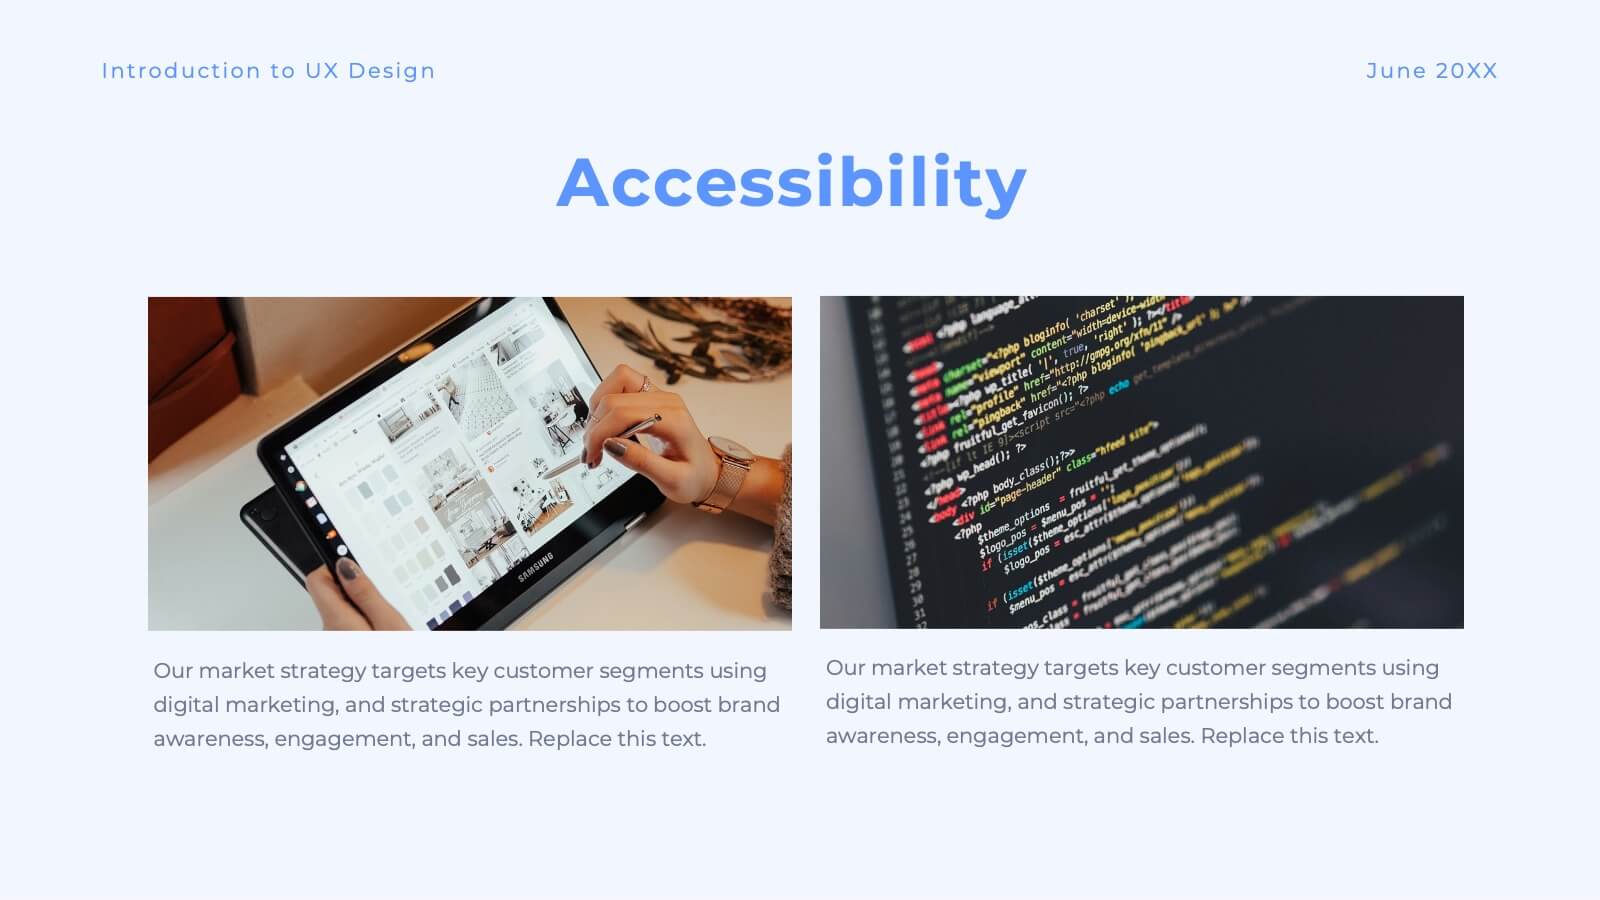
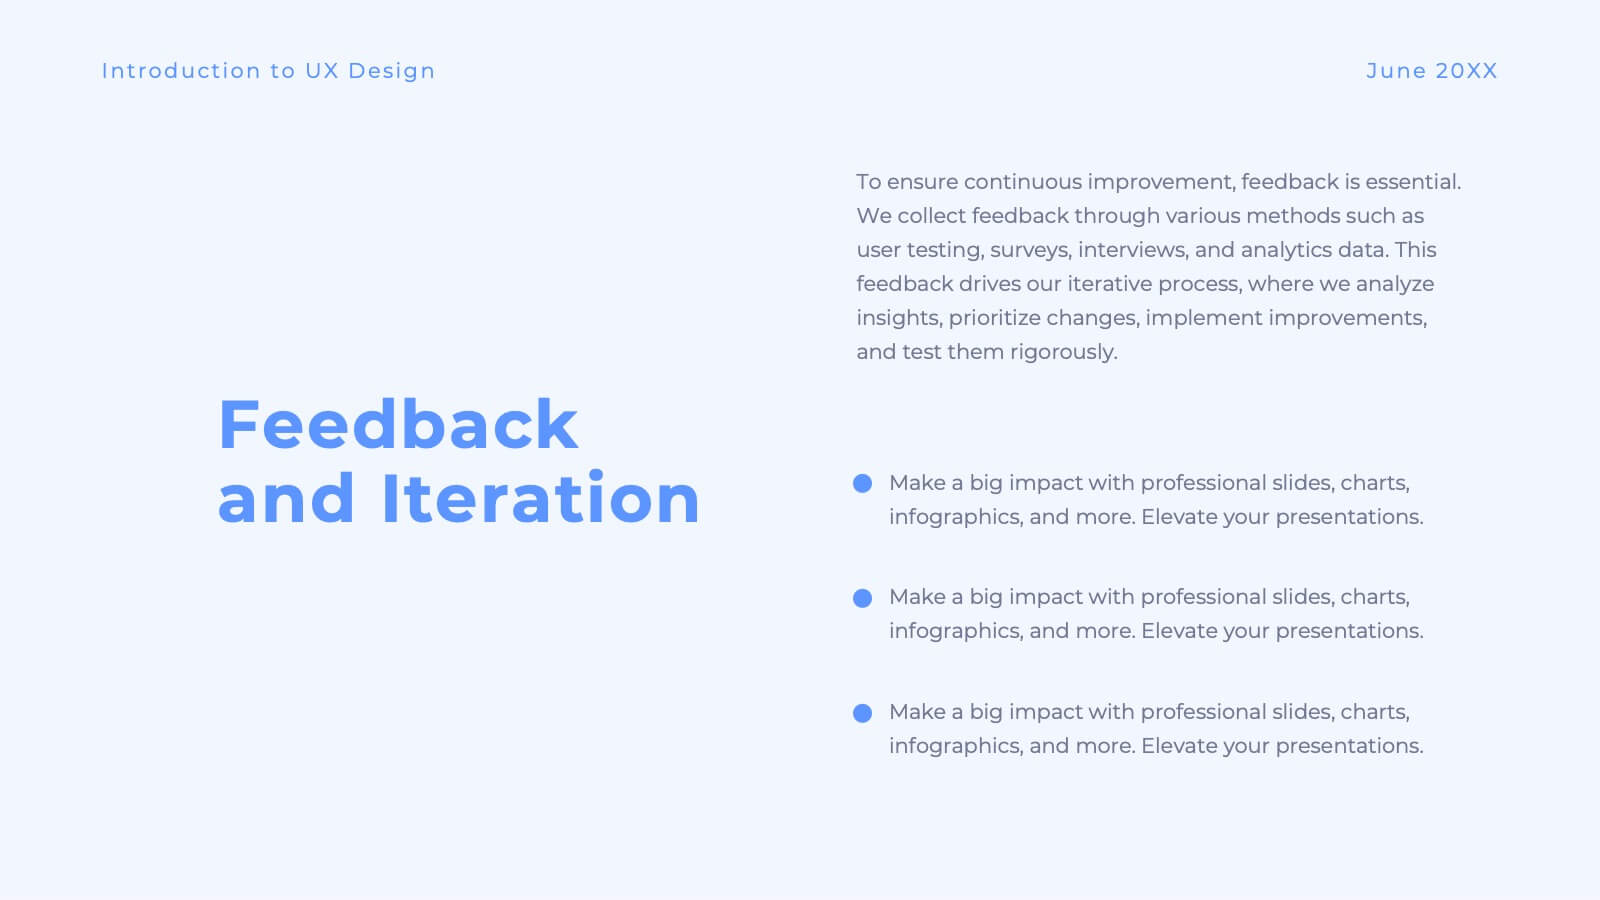
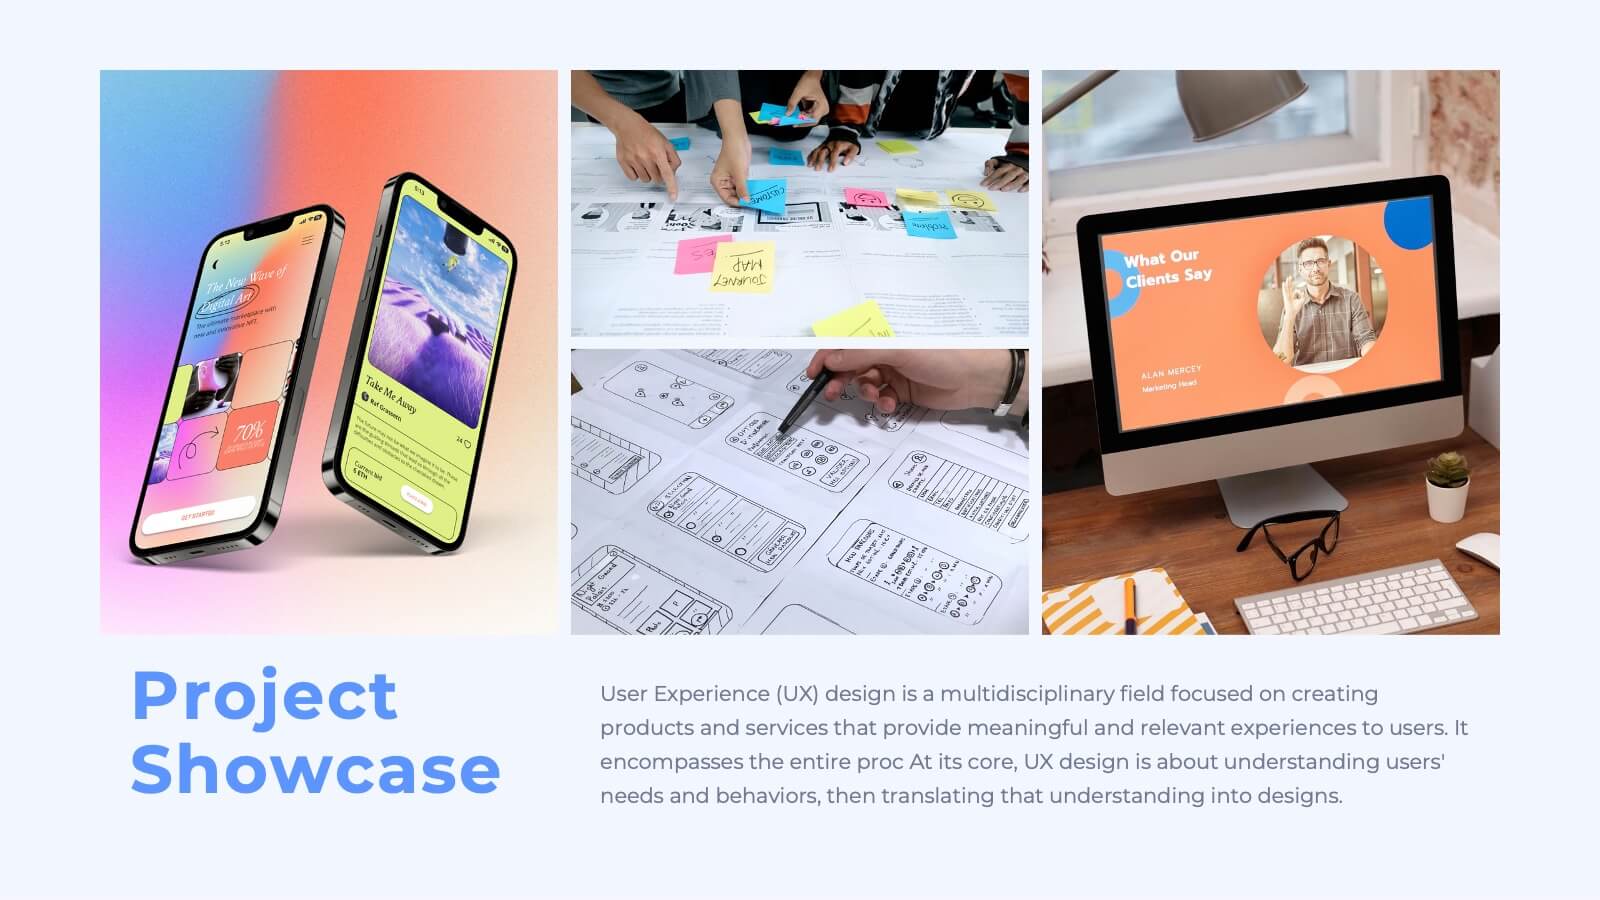
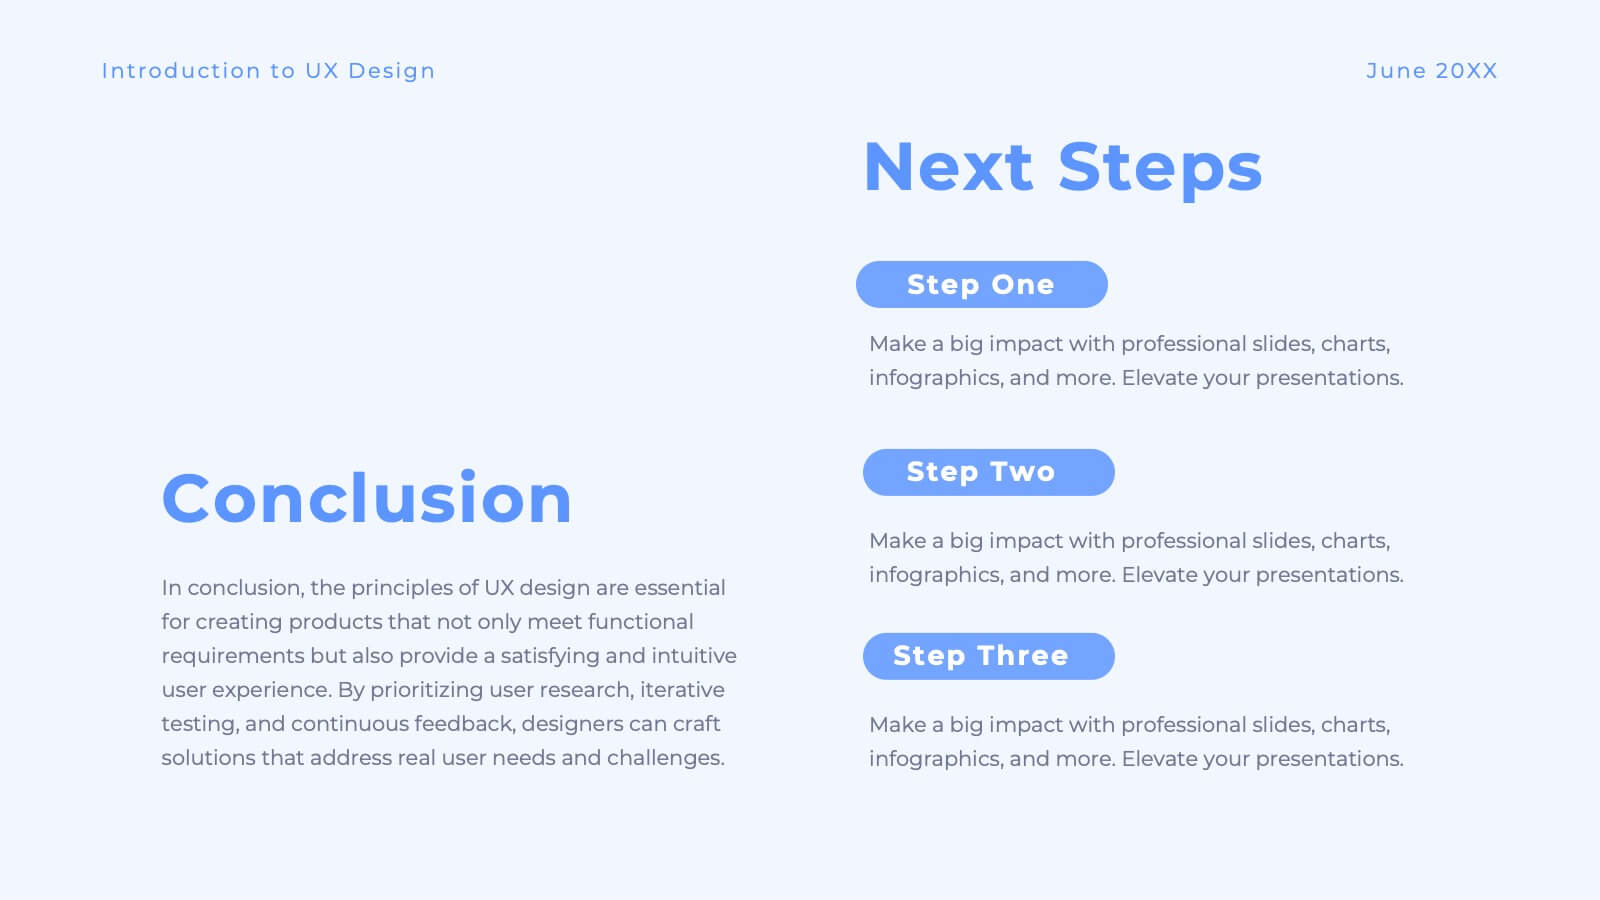
Luster UX Strategy Plan Presentation
Enhance user experience with this comprehensive UX strategy template! Perfect for outlining user research, personas, and design principles. Ideal for UX/UI designers aiming to present their strategies effectively. Compatible with PowerPoint, Keynote, and Google Slides, this template ensures your UX presentations are clear, professional, and impactful. Create exceptional user experiences today!


6 diapositivas
Cryptocurrency Exchange Infographic
A cryptocurrency exchange is a platform that allows users to buy, sell, and trade cryptocurrencies. This infographic template illustrates the key aspects of cryptocurrency exchanges, providing an overview of how these platforms work, their benefits, and the steps involved in trading cryptocurrencies. This infographic aims to educate and inform individuals about cryptocurrency exchanges and make the process of trading digital assets more accessible. This template aims to simplify complex concepts and provide a clear overview of the steps involved in using cryptocurrency exchanges, encouraging more people to participate in the growing digital asset market.


12 diapositivas
Quarterly Status Report Presentation
Crafted for clarity and impact, the Quarterly Status Report presentation template efficiently summarizes a period's achievements and insights. The opening slide immediately captivates the audience, clearly setting the stage for a comprehensive review. Subsequent slides meticulously organize critical data points, from financial forecasts to project milestones, allowing for a granular examination of past performance. The report not only reflects on the quarter's outcomes but also offers a well-defined path forward, with strategic recommendations and a thoughtful action plan. Concluding on a note of gratitude, the template acknowledges the audience's time and consideration, while the final credits slide ensures due recognition of all informational sources used throughout the presentation.


7 diapositivas
Mind Map Infographic Presentation Template
A mind map is a diagram that allows you to visualize how related ideas and concepts are connected to one another. It is especially good for brainstorming, planning and organizing. A mind map allows you to organize information in a way that shows your thinking process and gives you the opportunity for deeper understanding. This template will help others understand how you think about a particular subject or topic. Use this template to "brainstorm" a topic, and create an interesting mind map. You can also use it to share your ideas with others, or to visually organize your thoughts.


7 diapositivas
Time Management Goal Infographic
Time management is the process of organizing and planning how to divide your time between specific activities effectively and efficiently to achieve desired goals or outcomes. This infographic template is designed to empower you in mastering time, optimizing productivity, and seizing the day. This infographic provides a visually striking way to illustrate time management strategies, tips, and hacks for anyone looking to make the most of their time. Fully customizable and compatible with Powerpoint, Keynote, and Google Slides. This showcases time-bound tasks, emphasizing the importance of setting deadlines and managing tasks within periods.

21 diapositivas
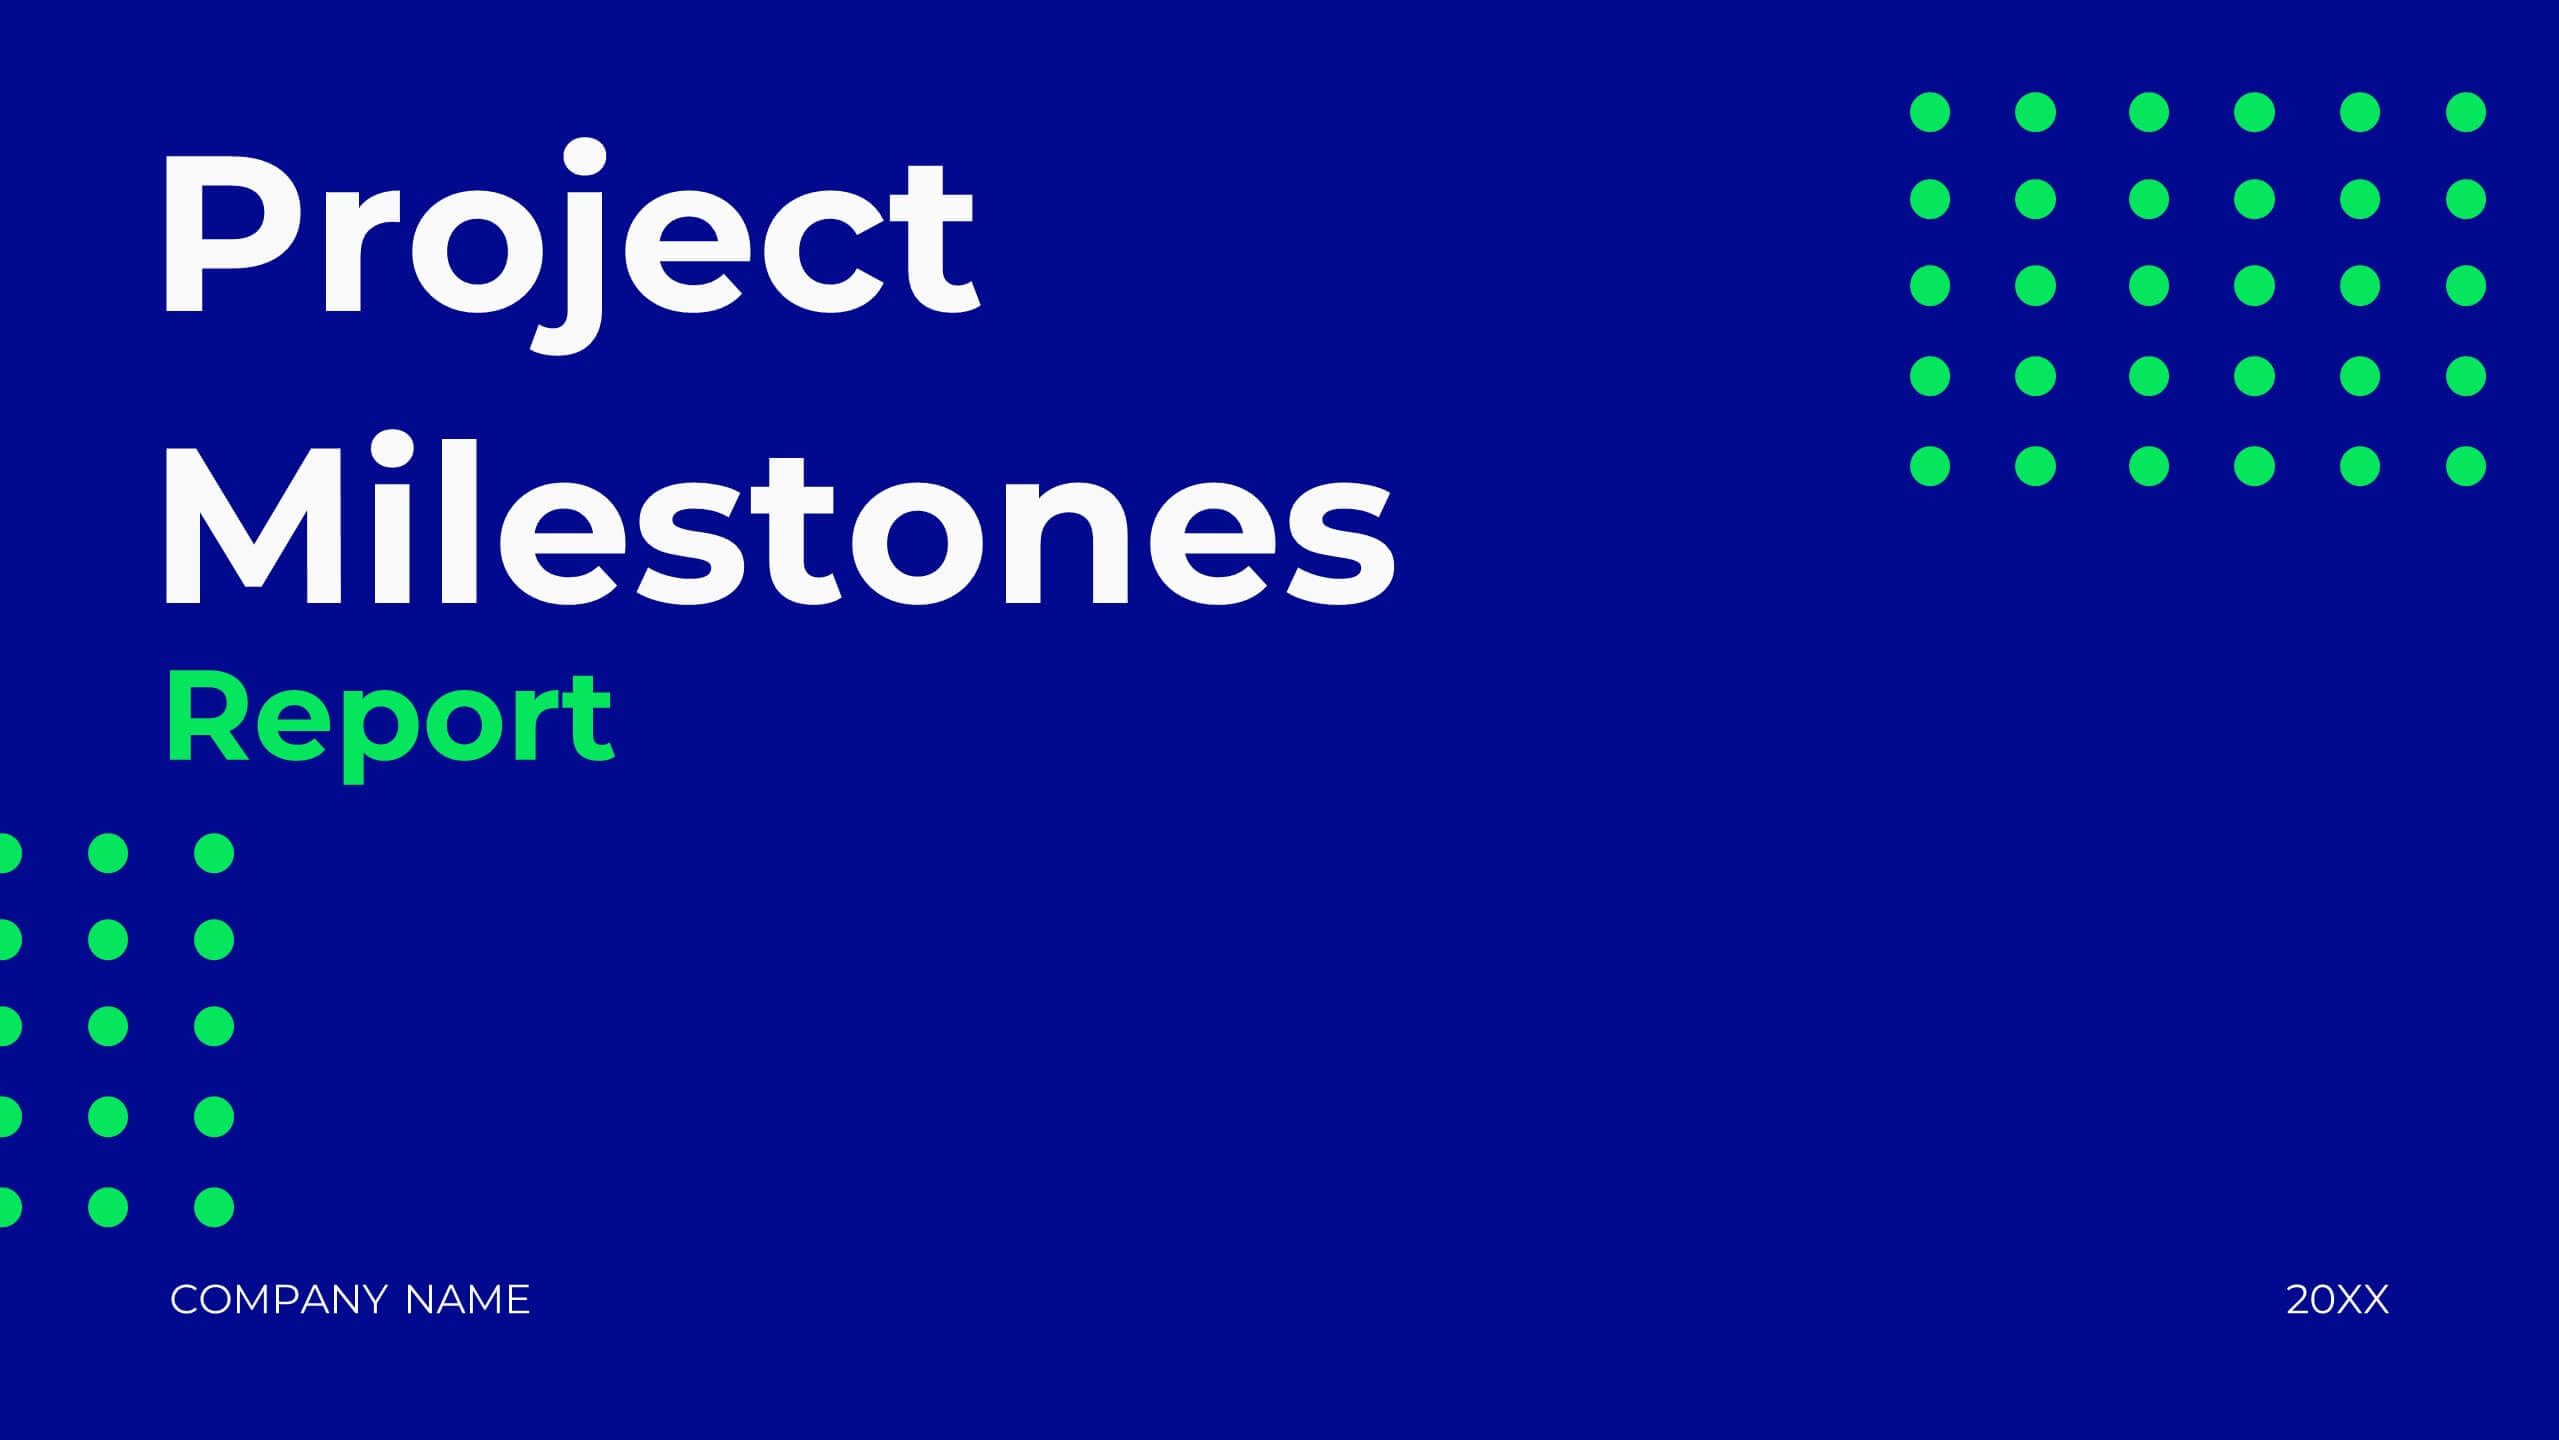
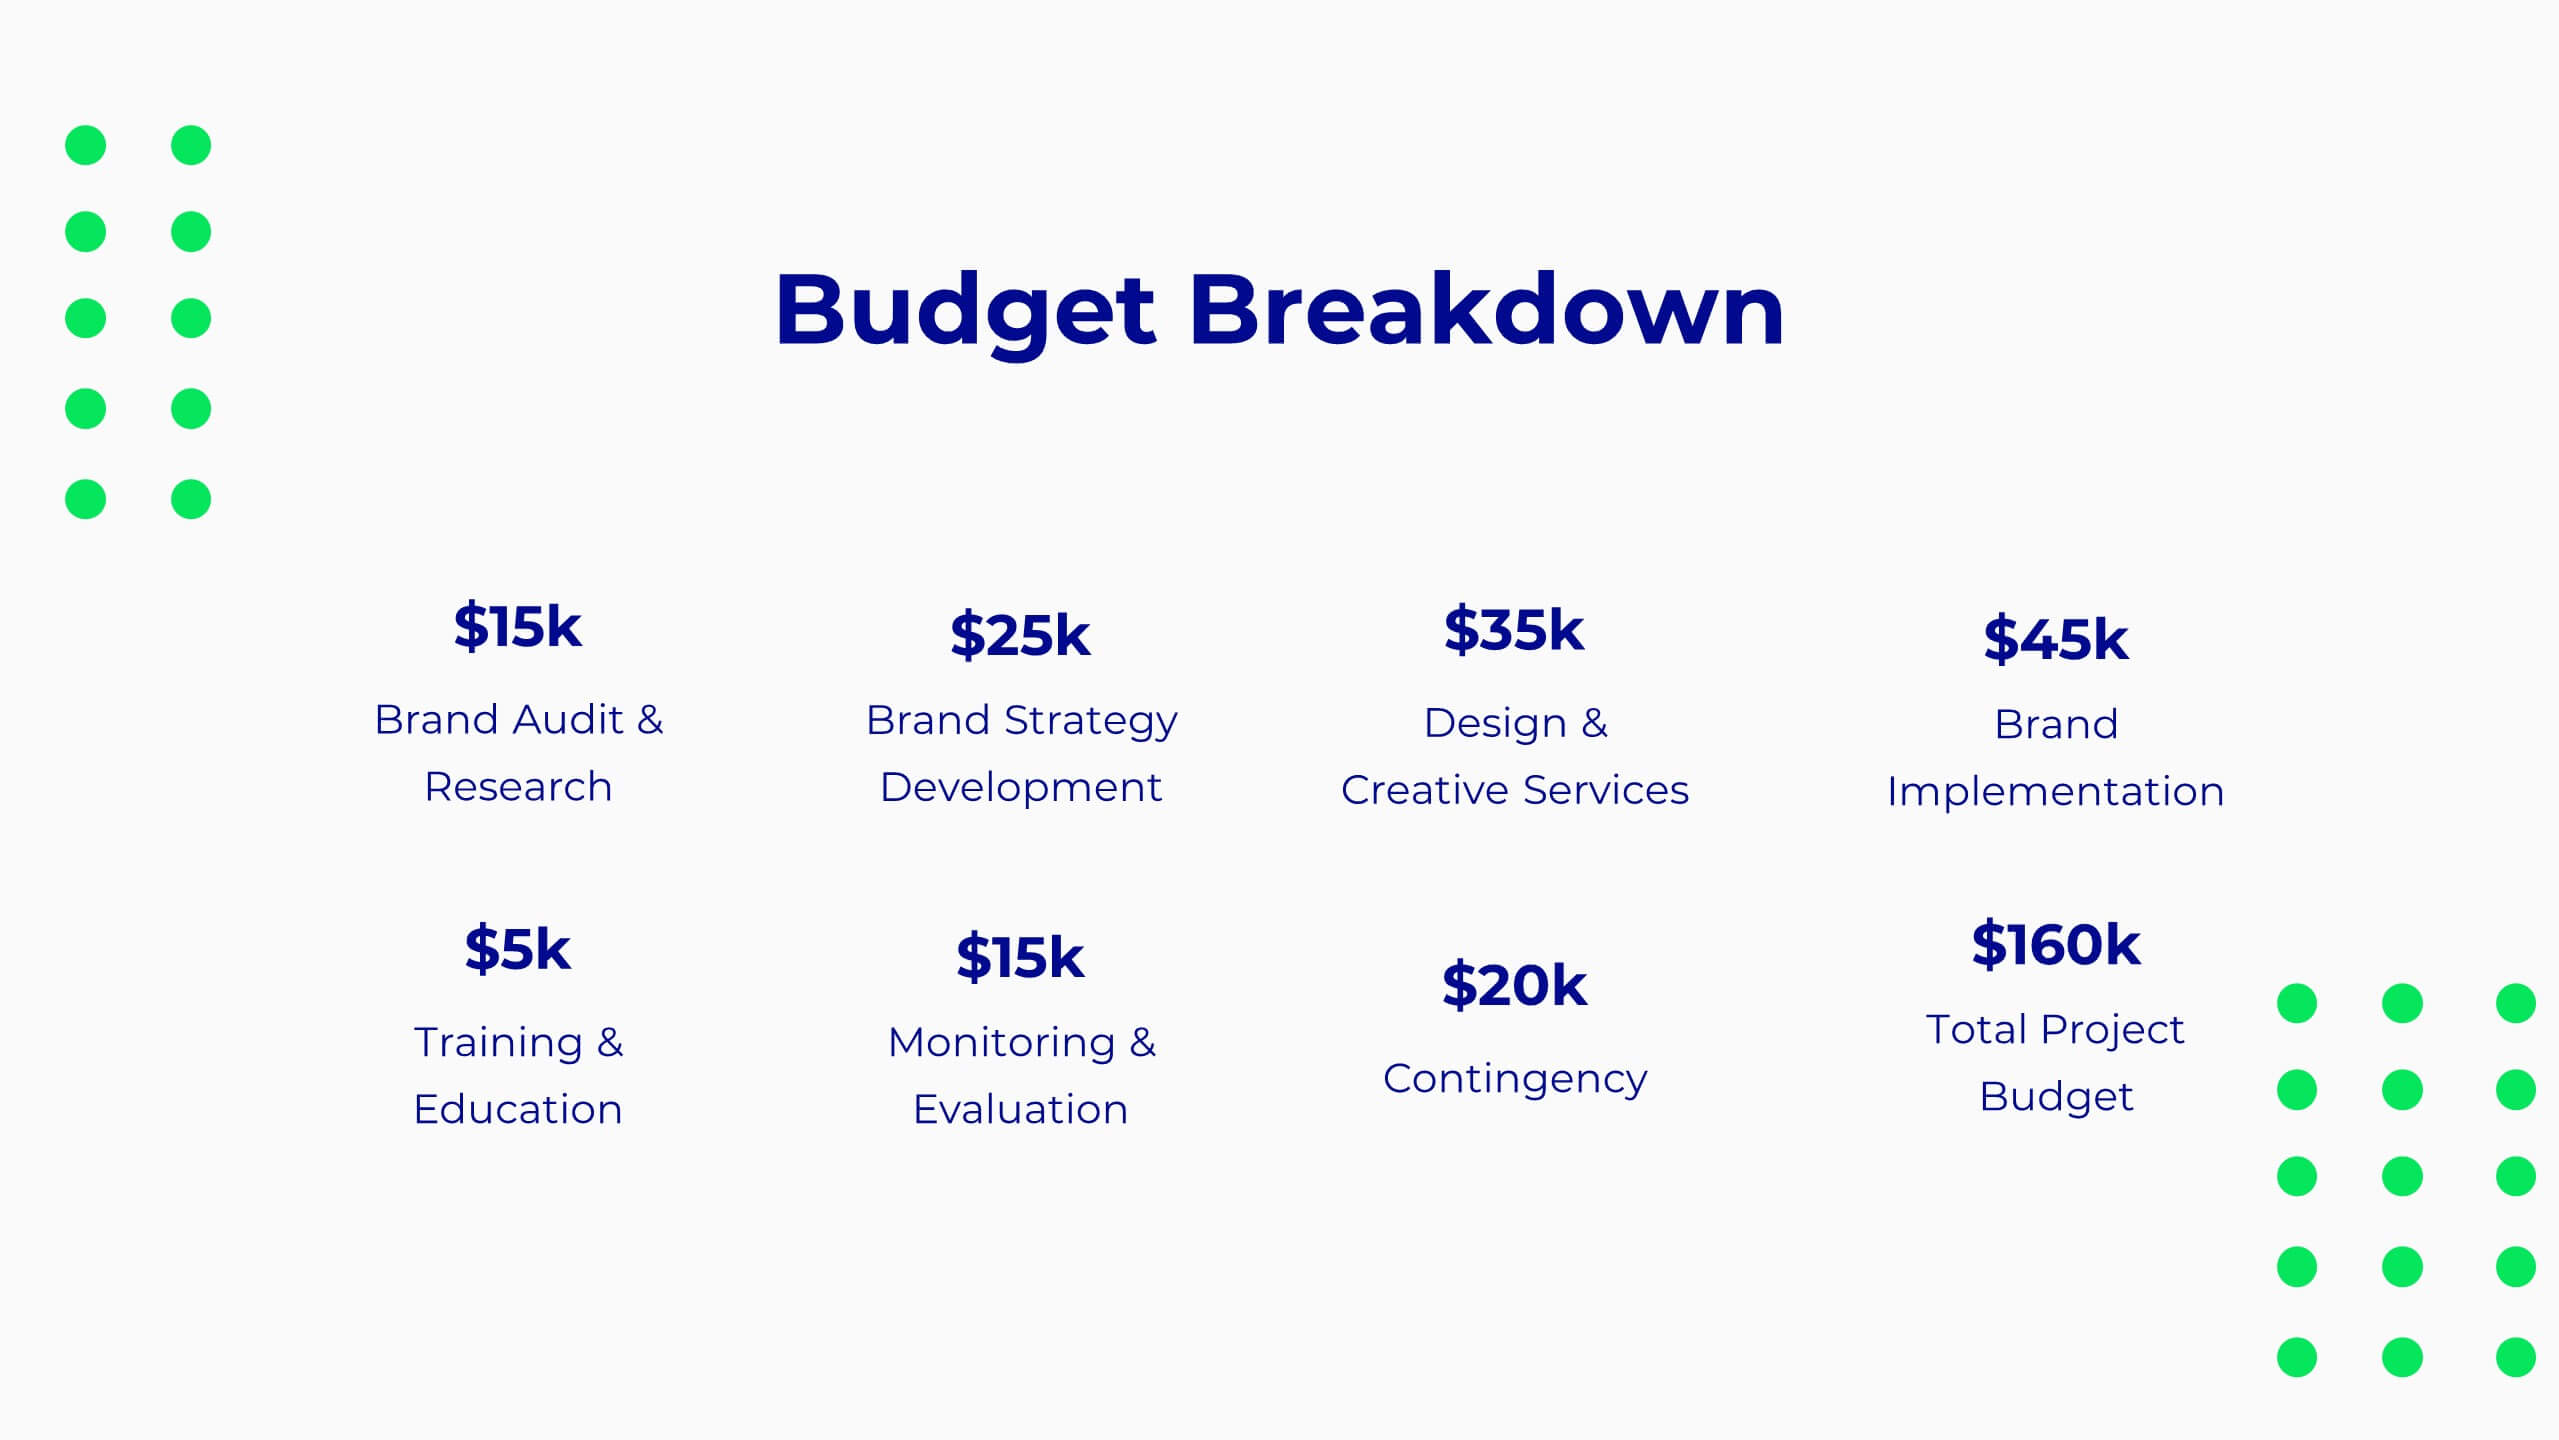
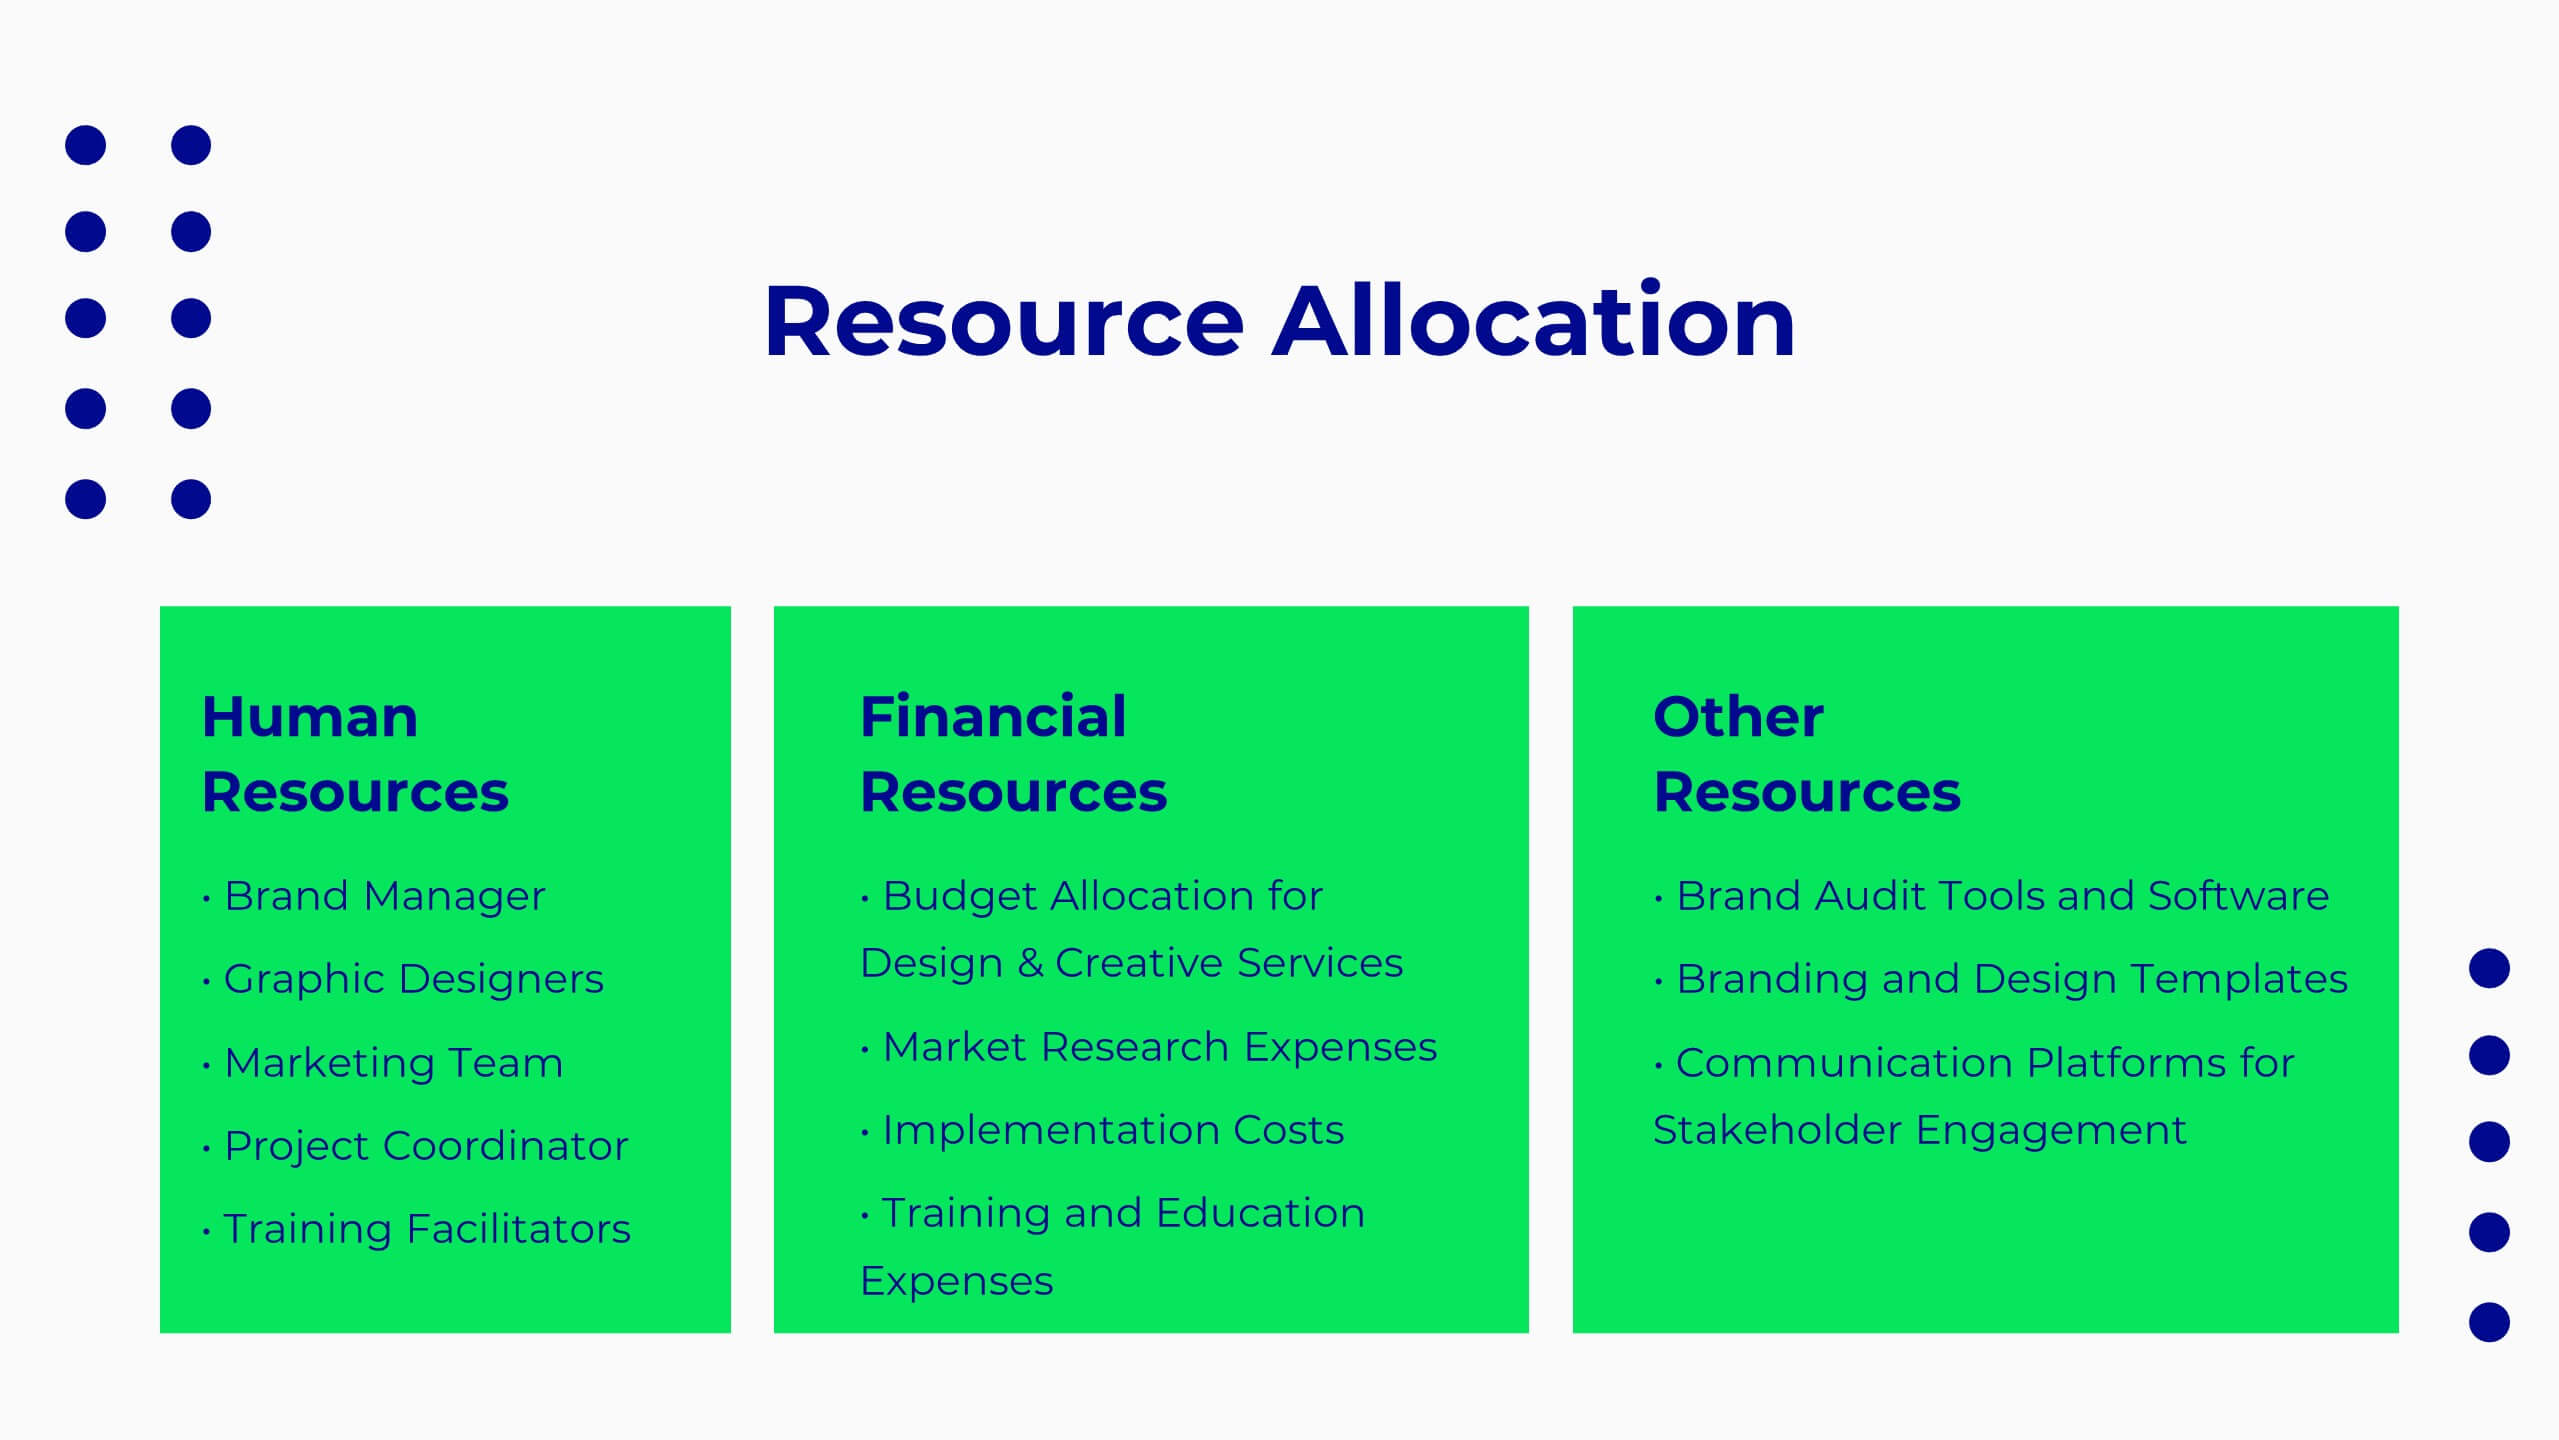
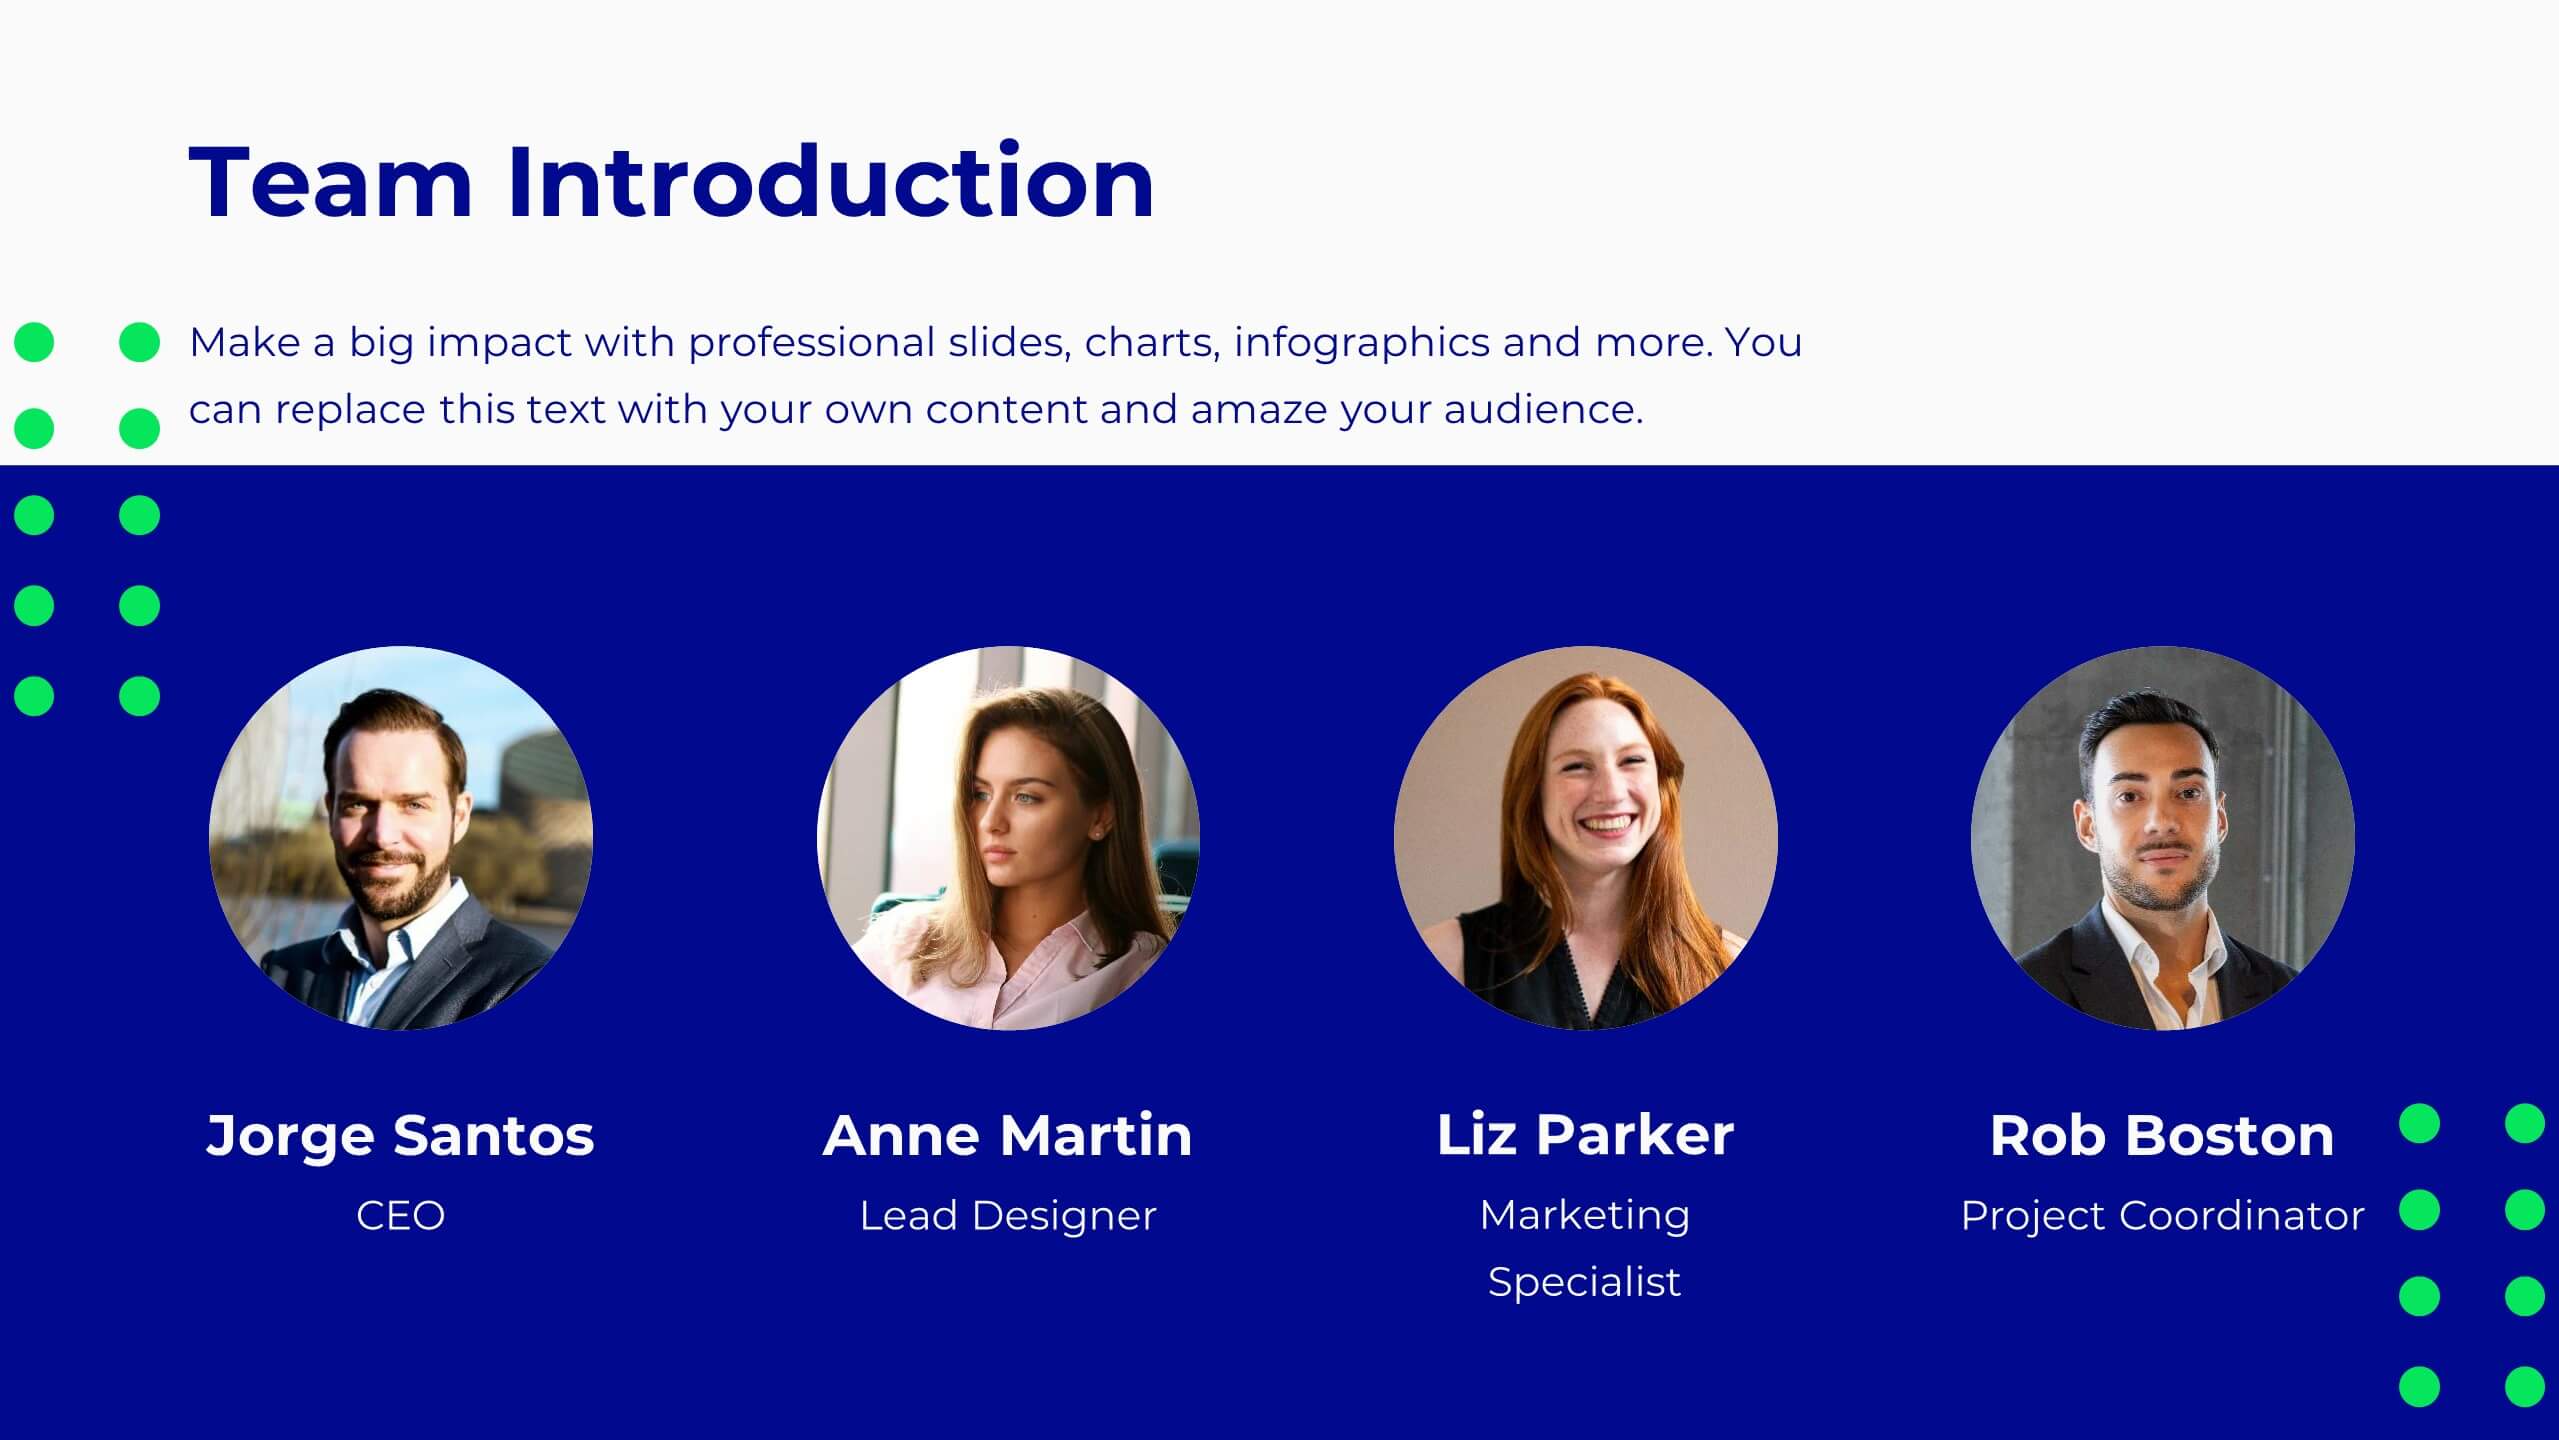
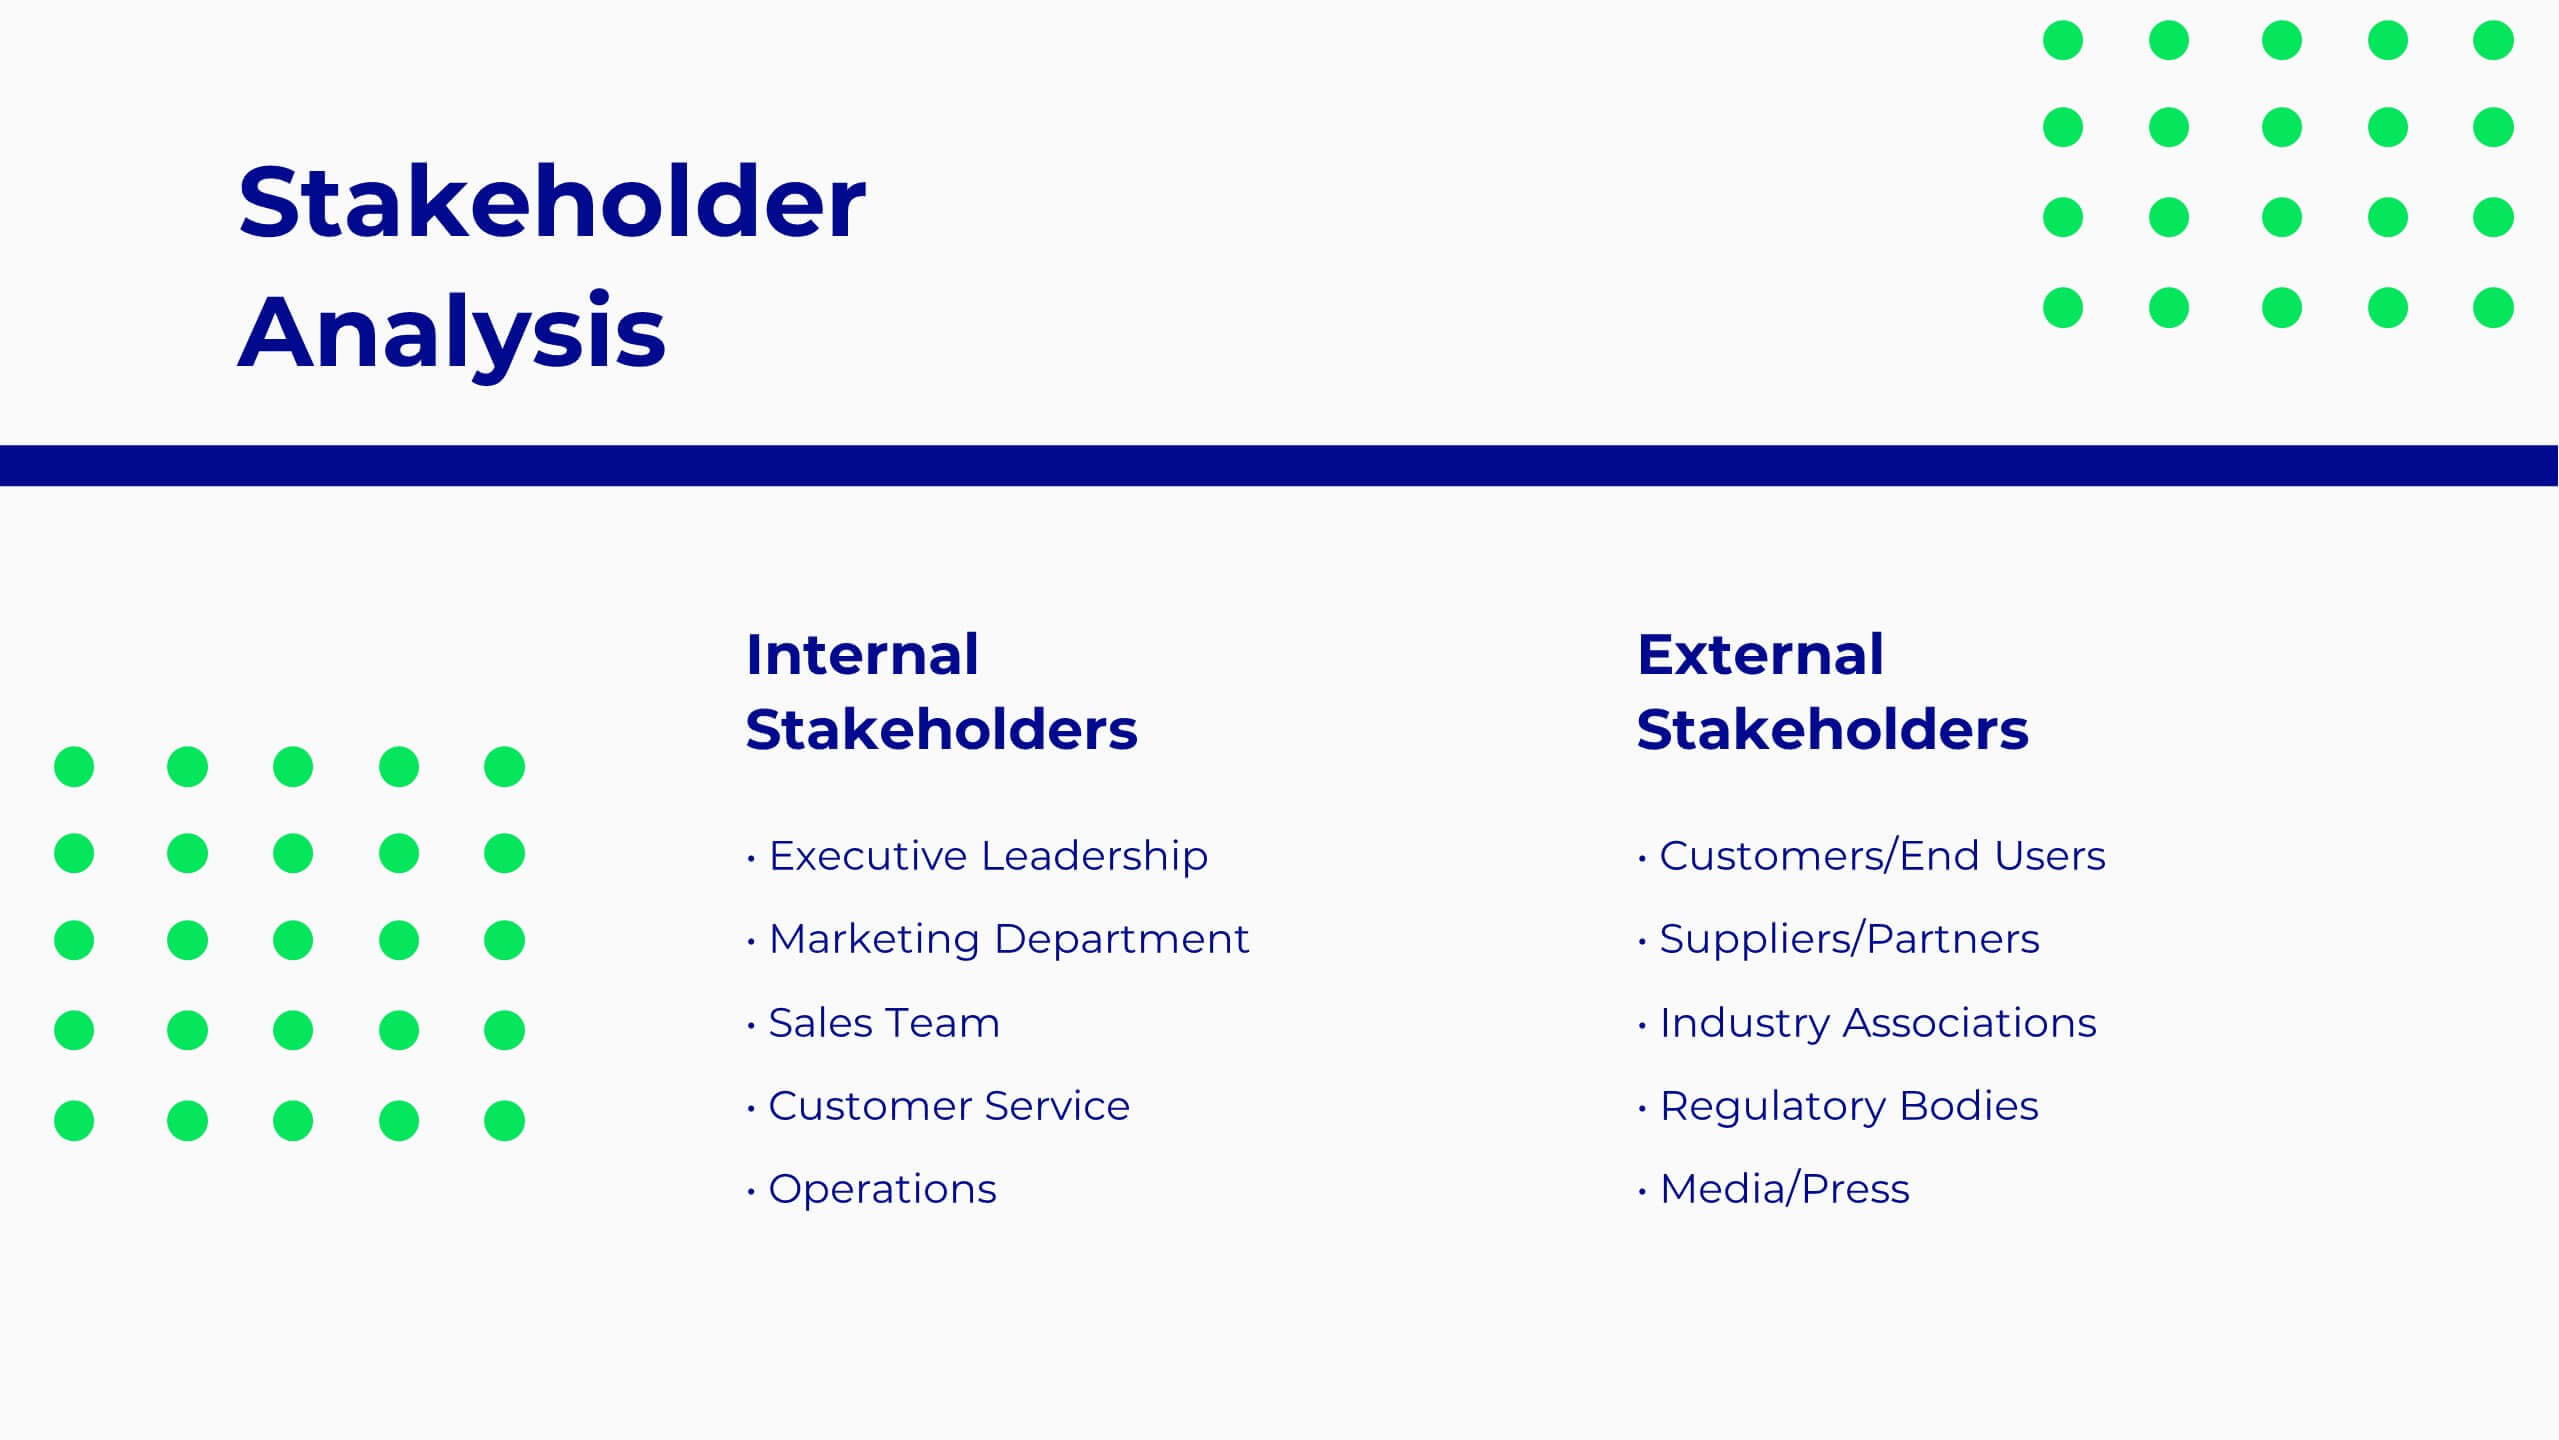
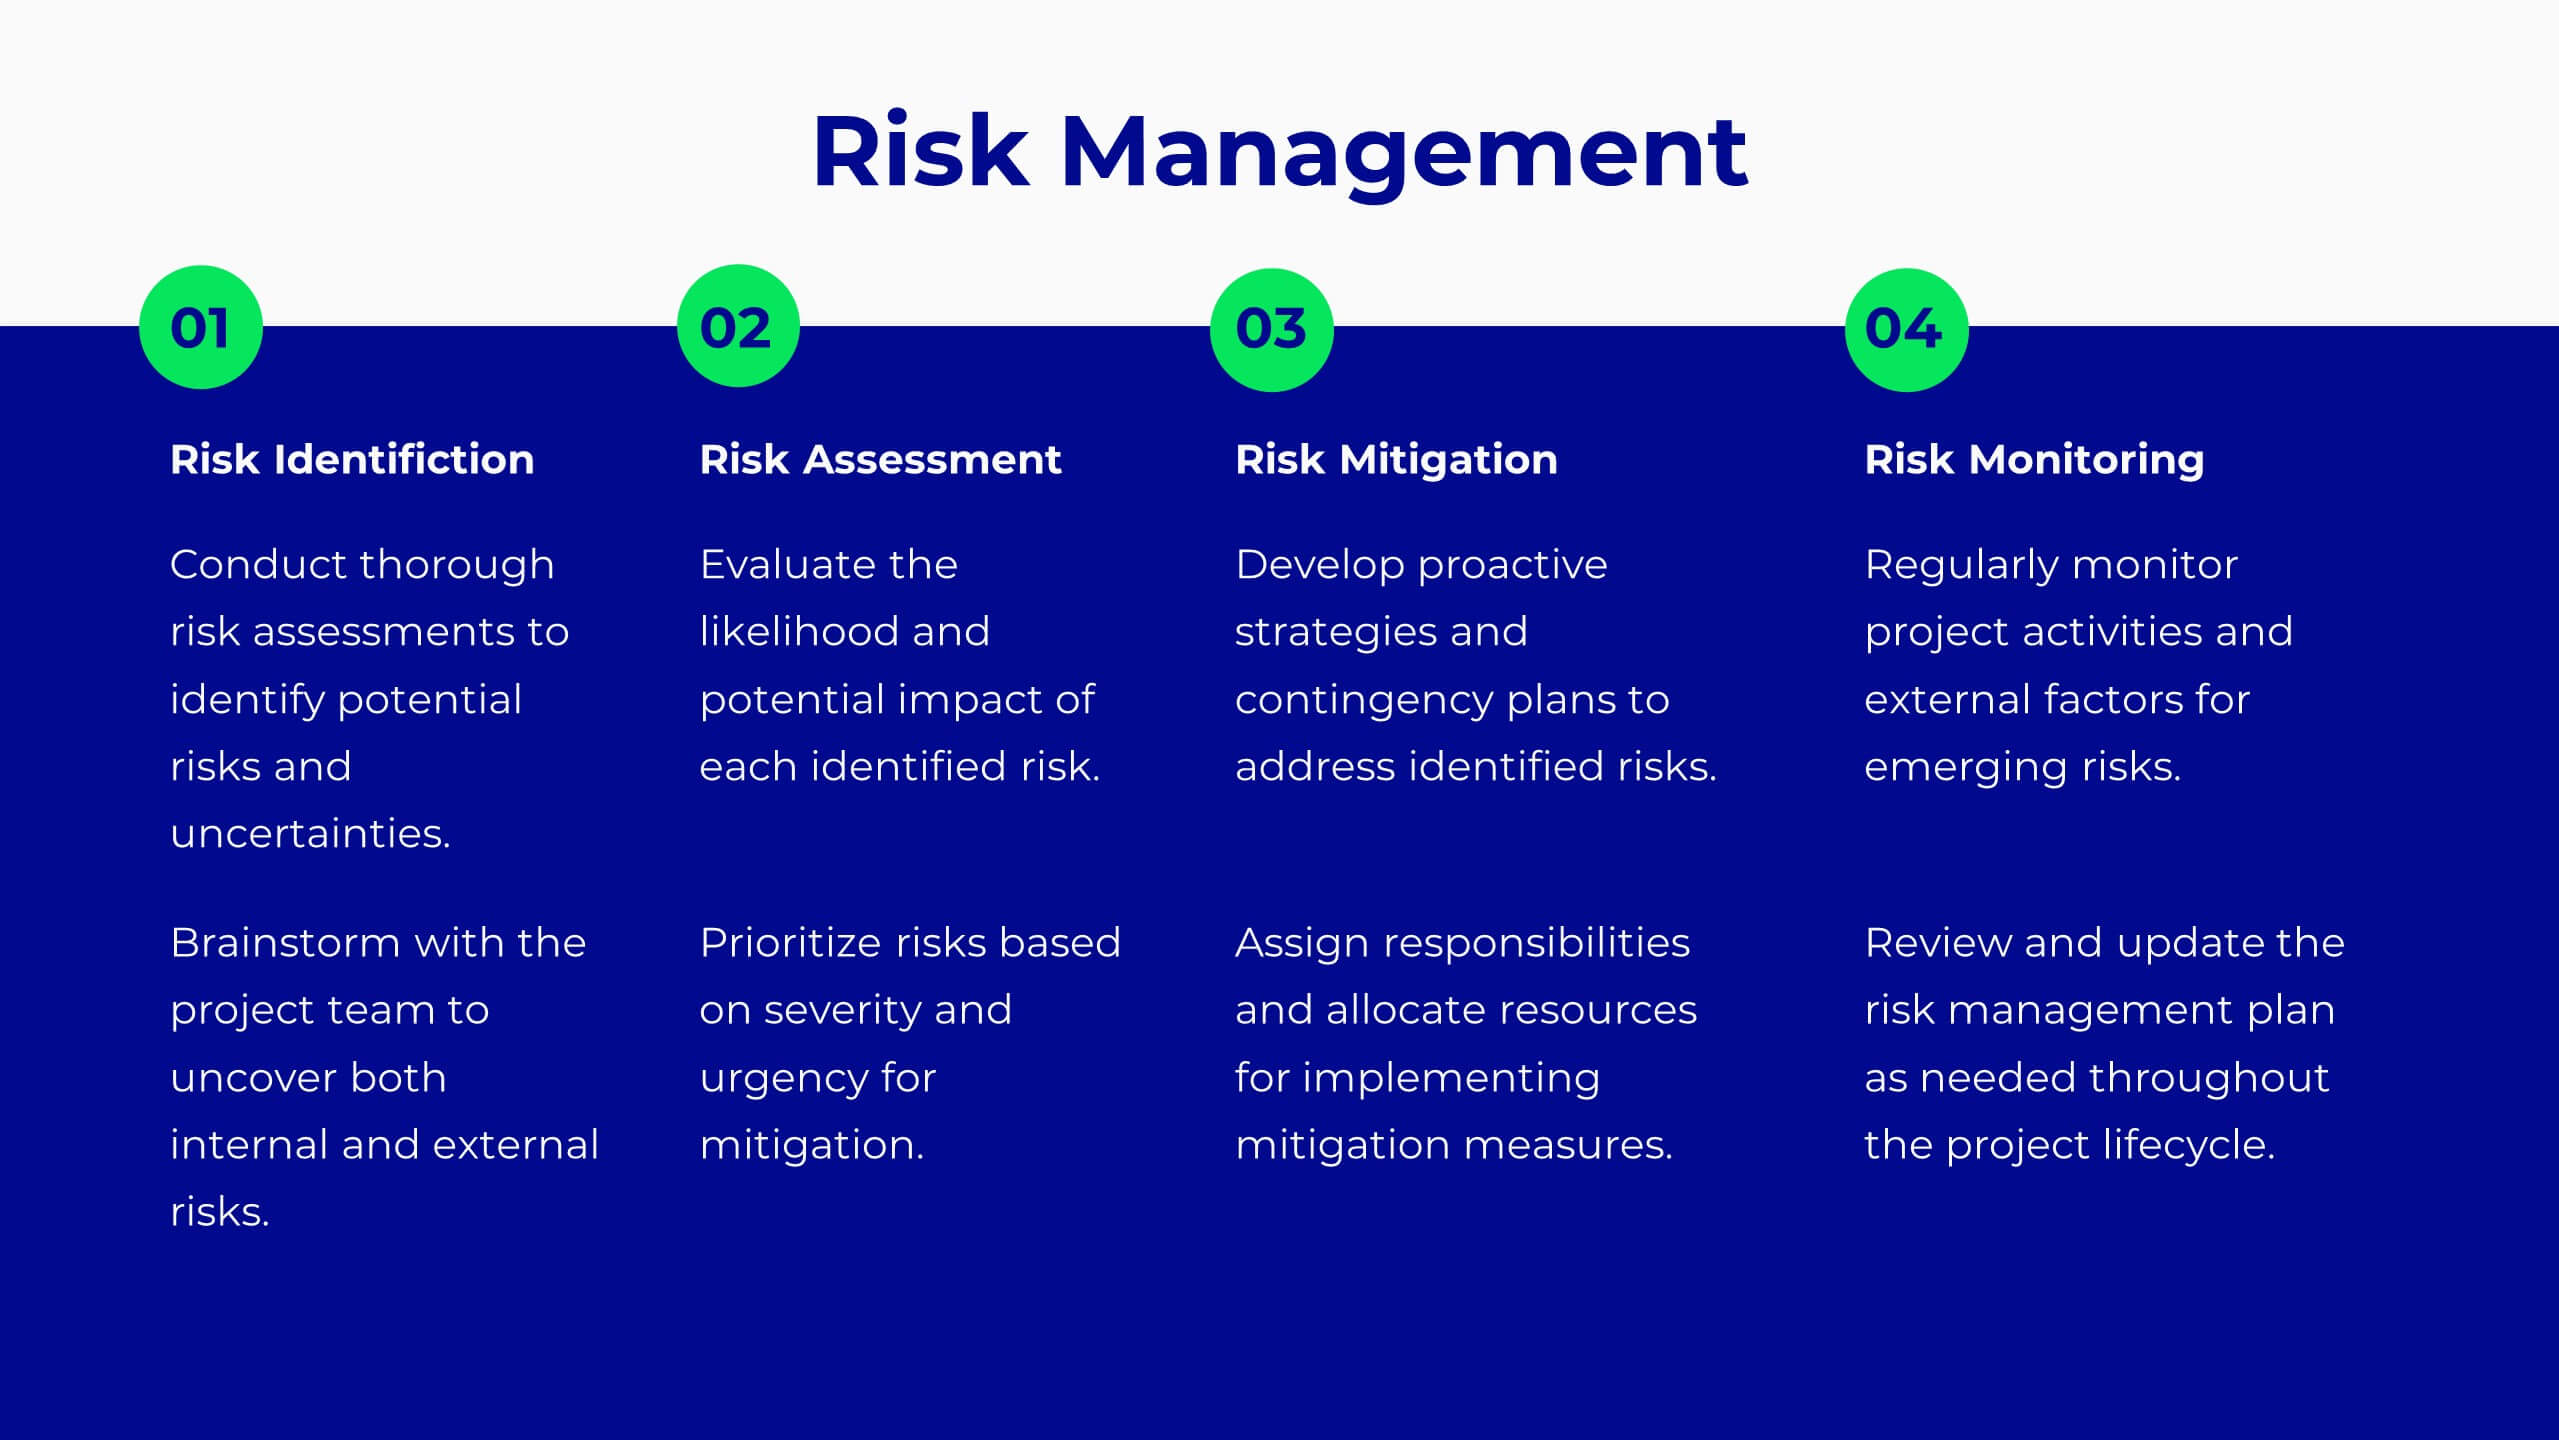
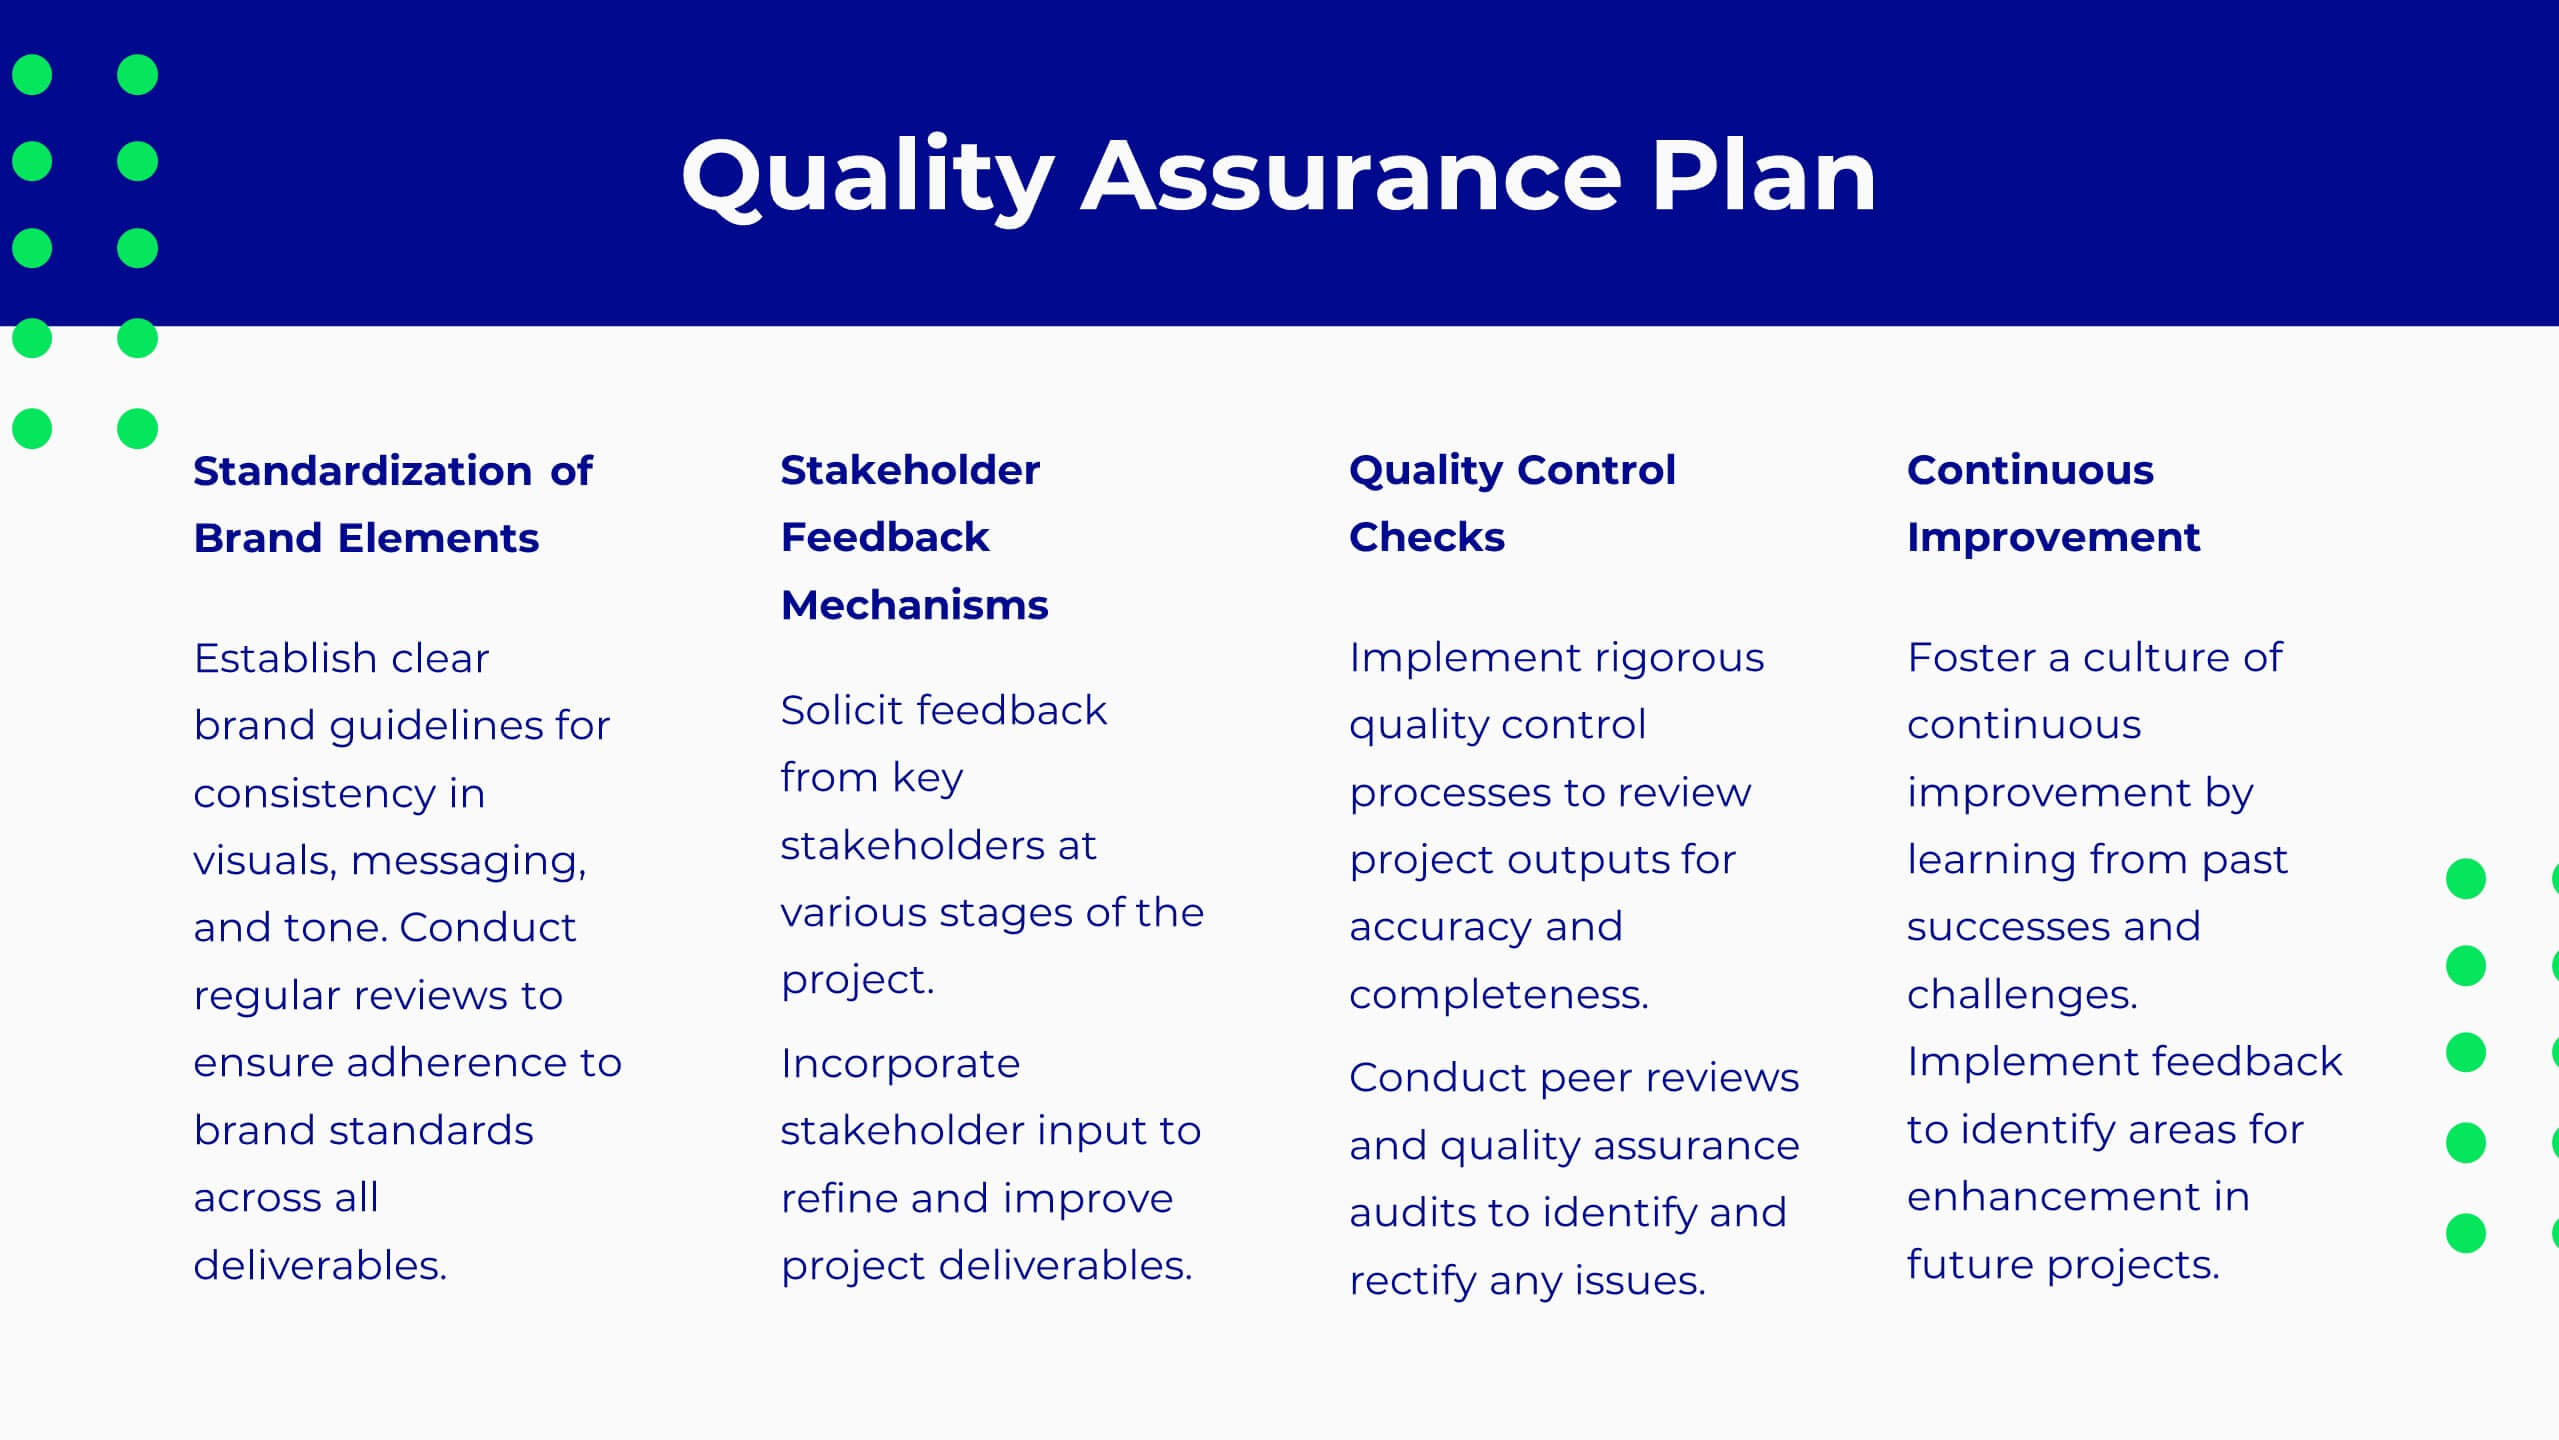
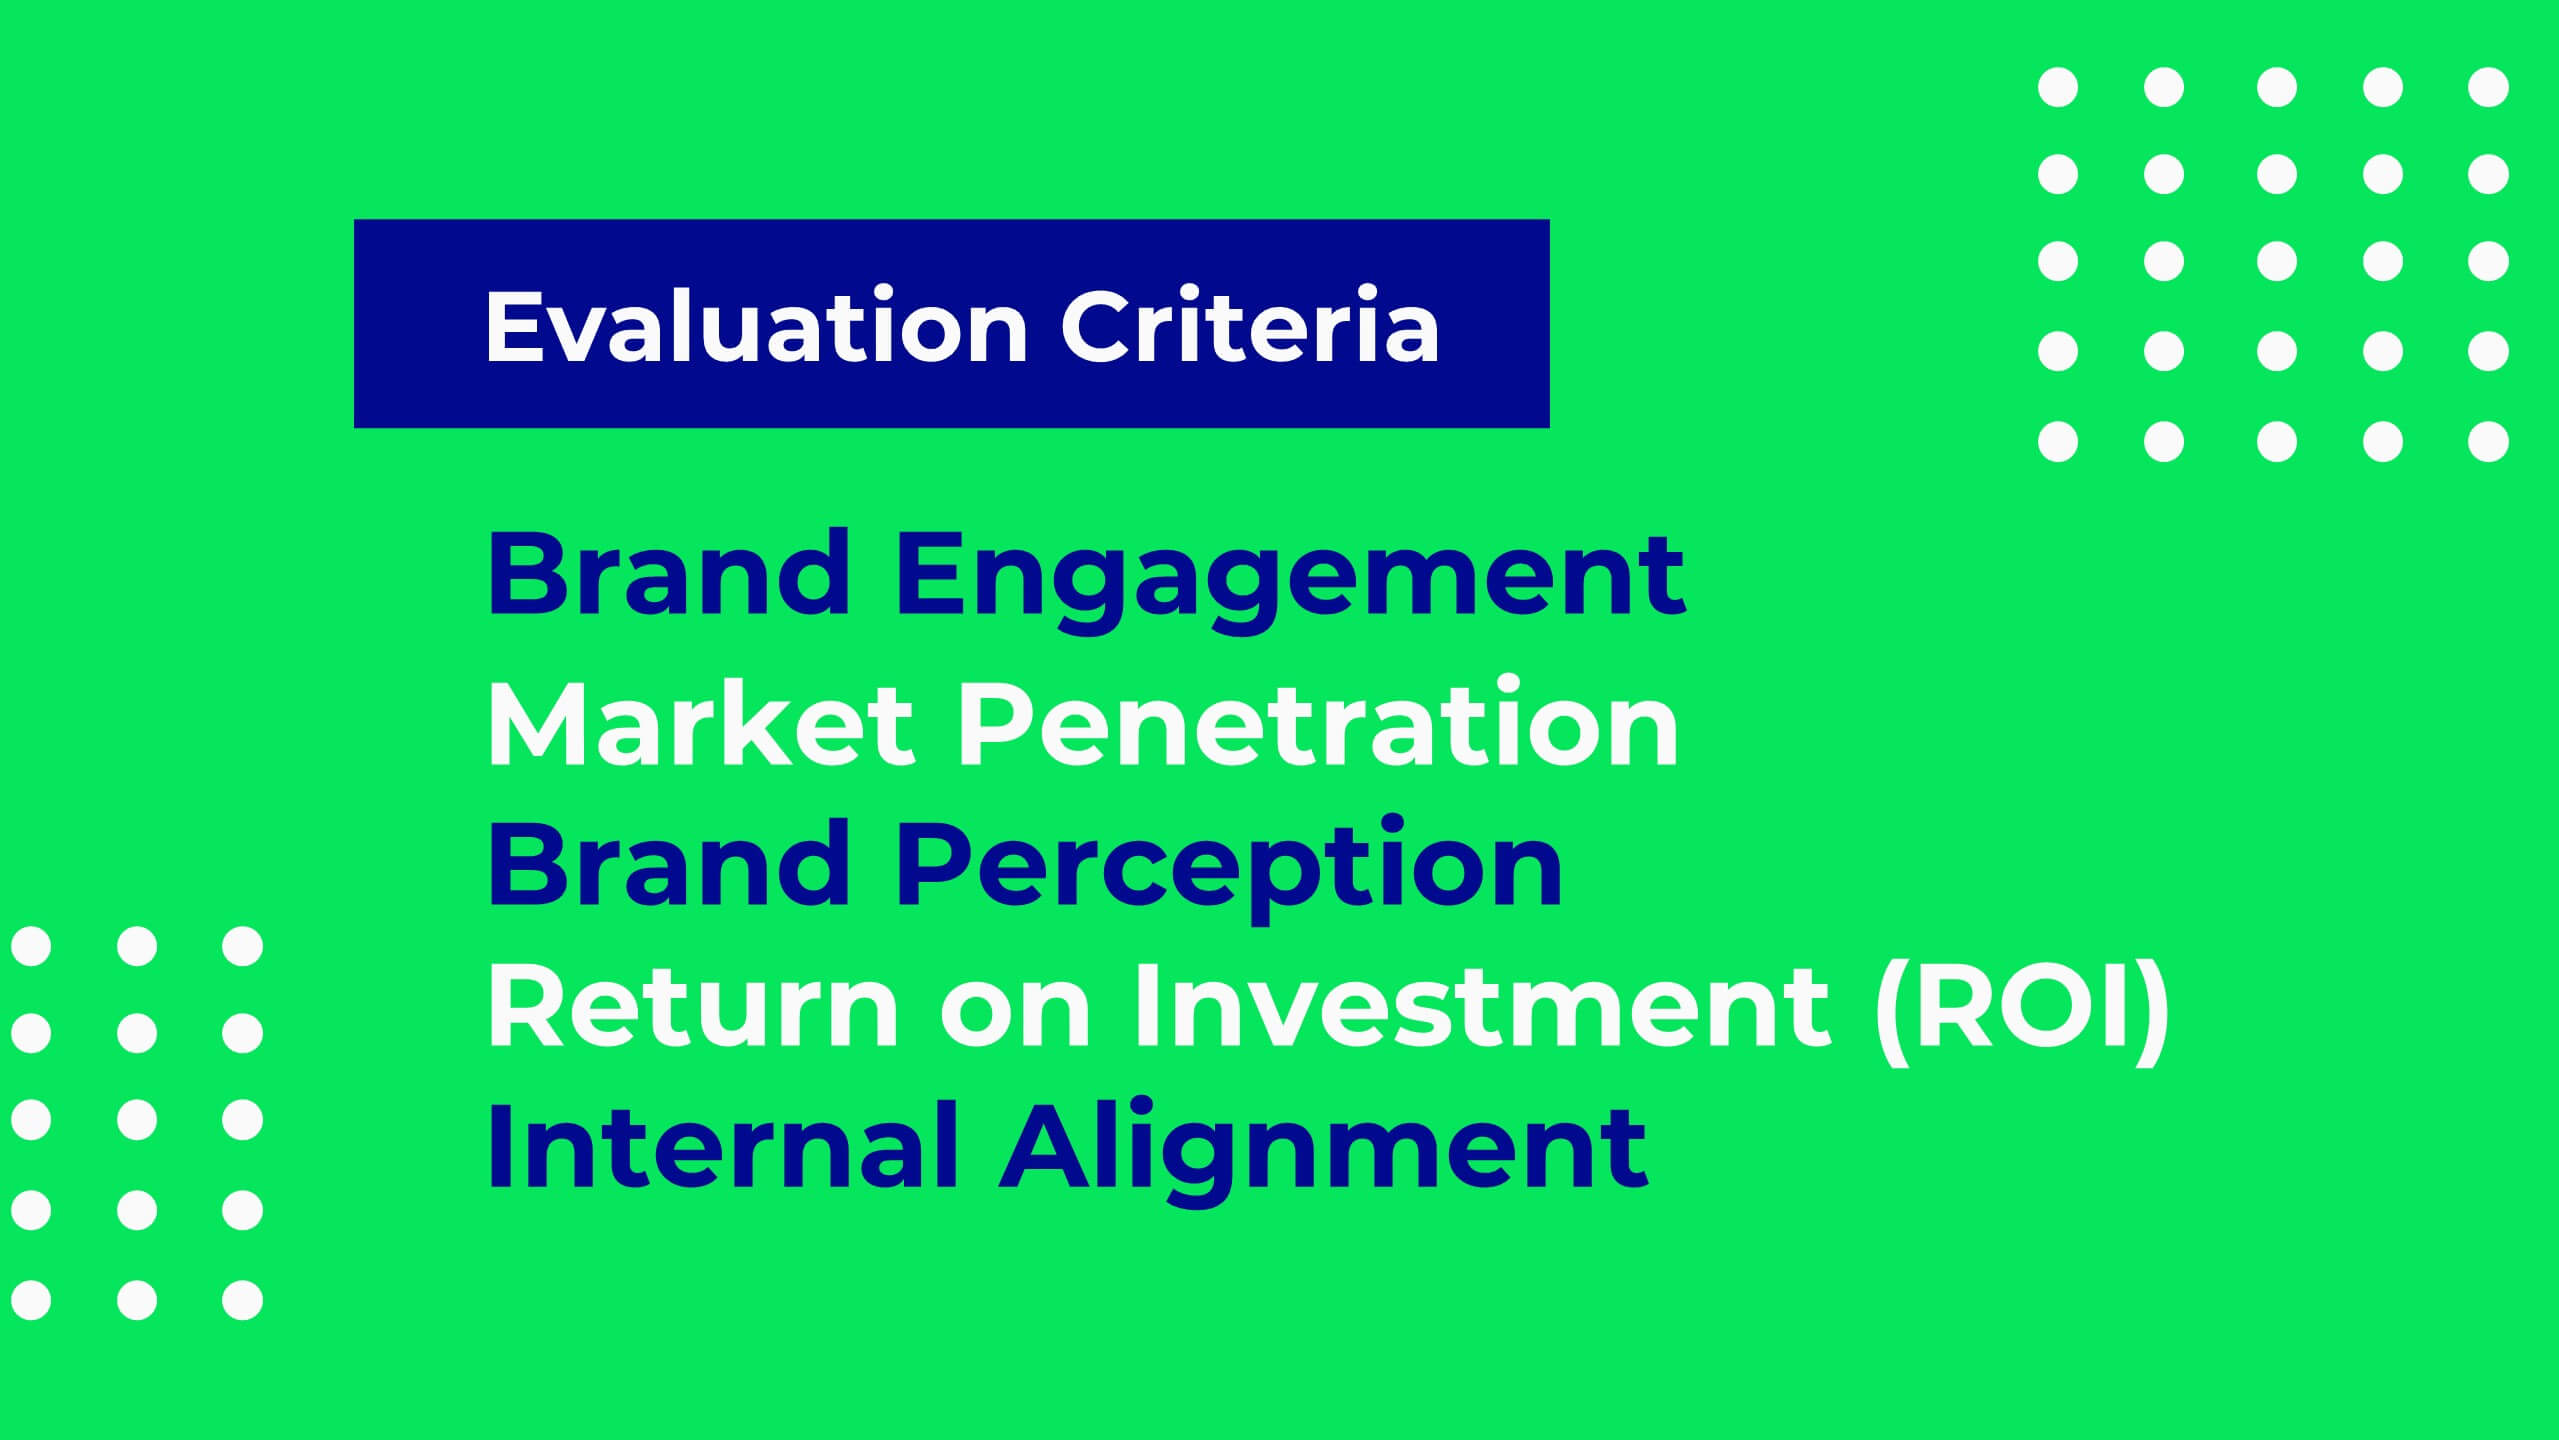
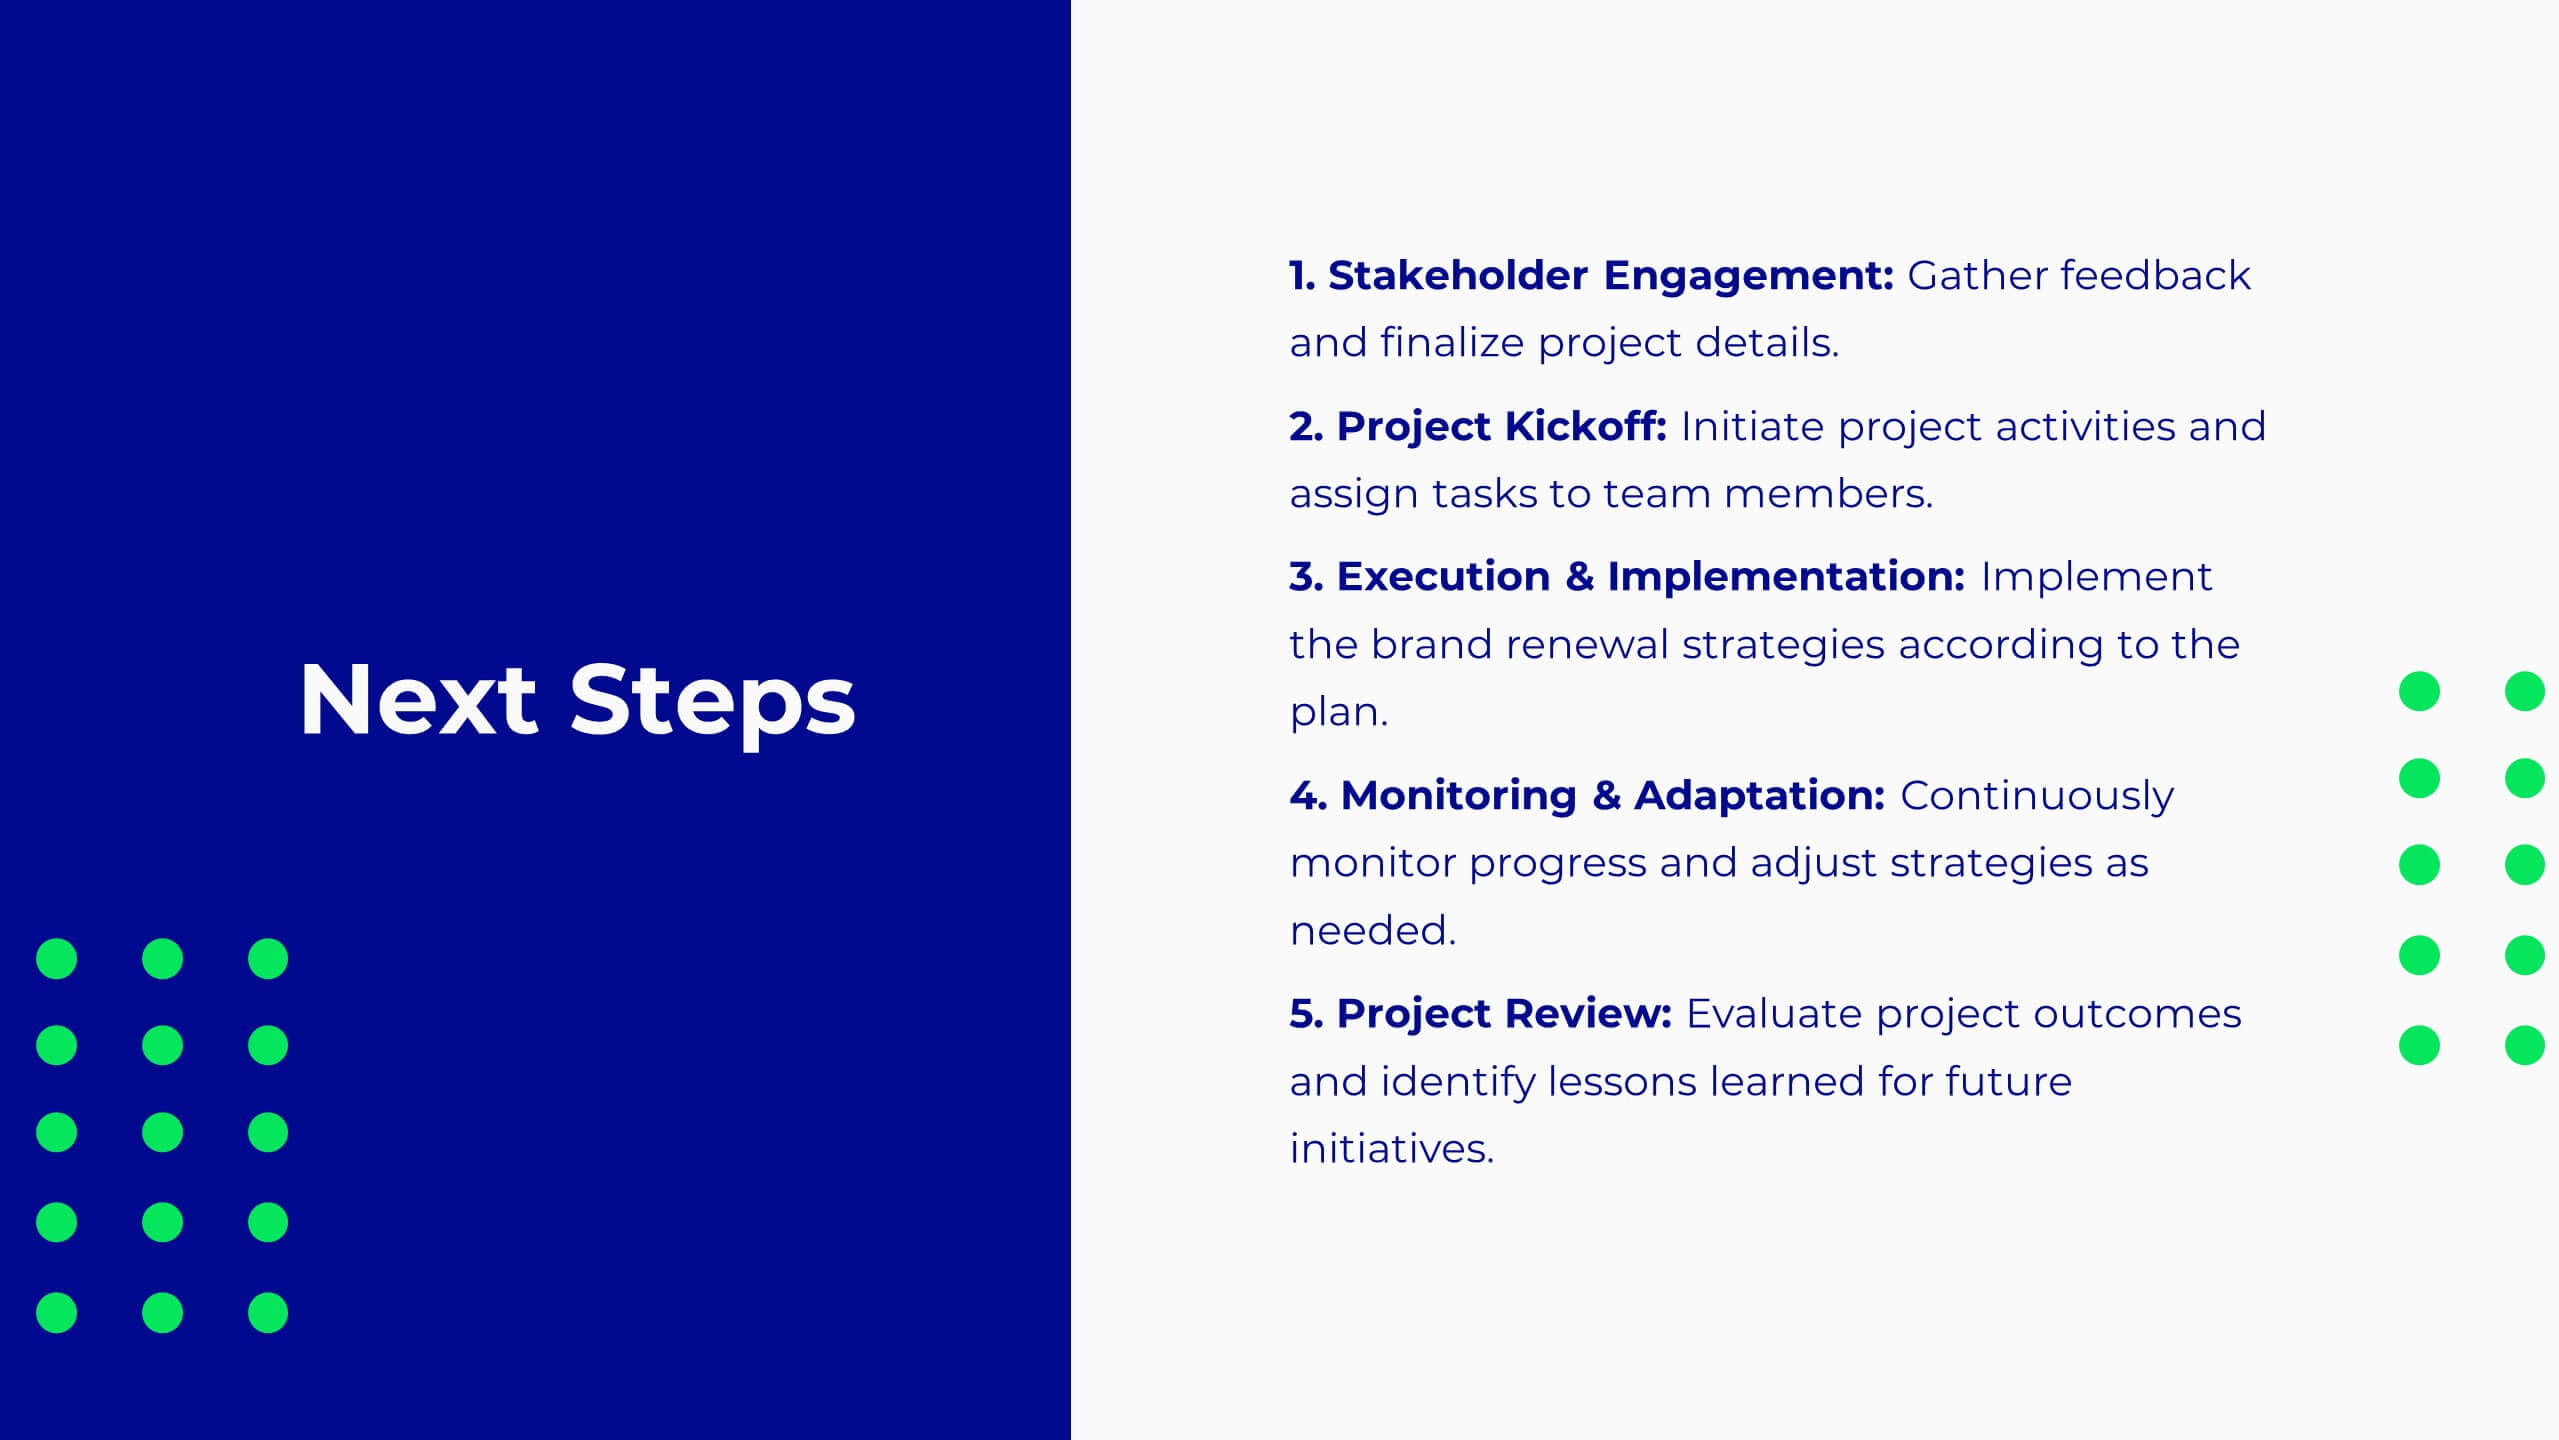
Pulse Project Milestones Report Presentation
Present project milestones effectively with this sleek, professional template. Cover project overview, timeline, and budget. Perfect for defining objectives, scope of work, and resource allocation. Highlight team introductions and stakeholder analysis. Ensure quality with risk management and assurance plans. Compatible with PowerPoint, Keynote, and Google Slides. Elevate your presentations today!


26 diapositivas
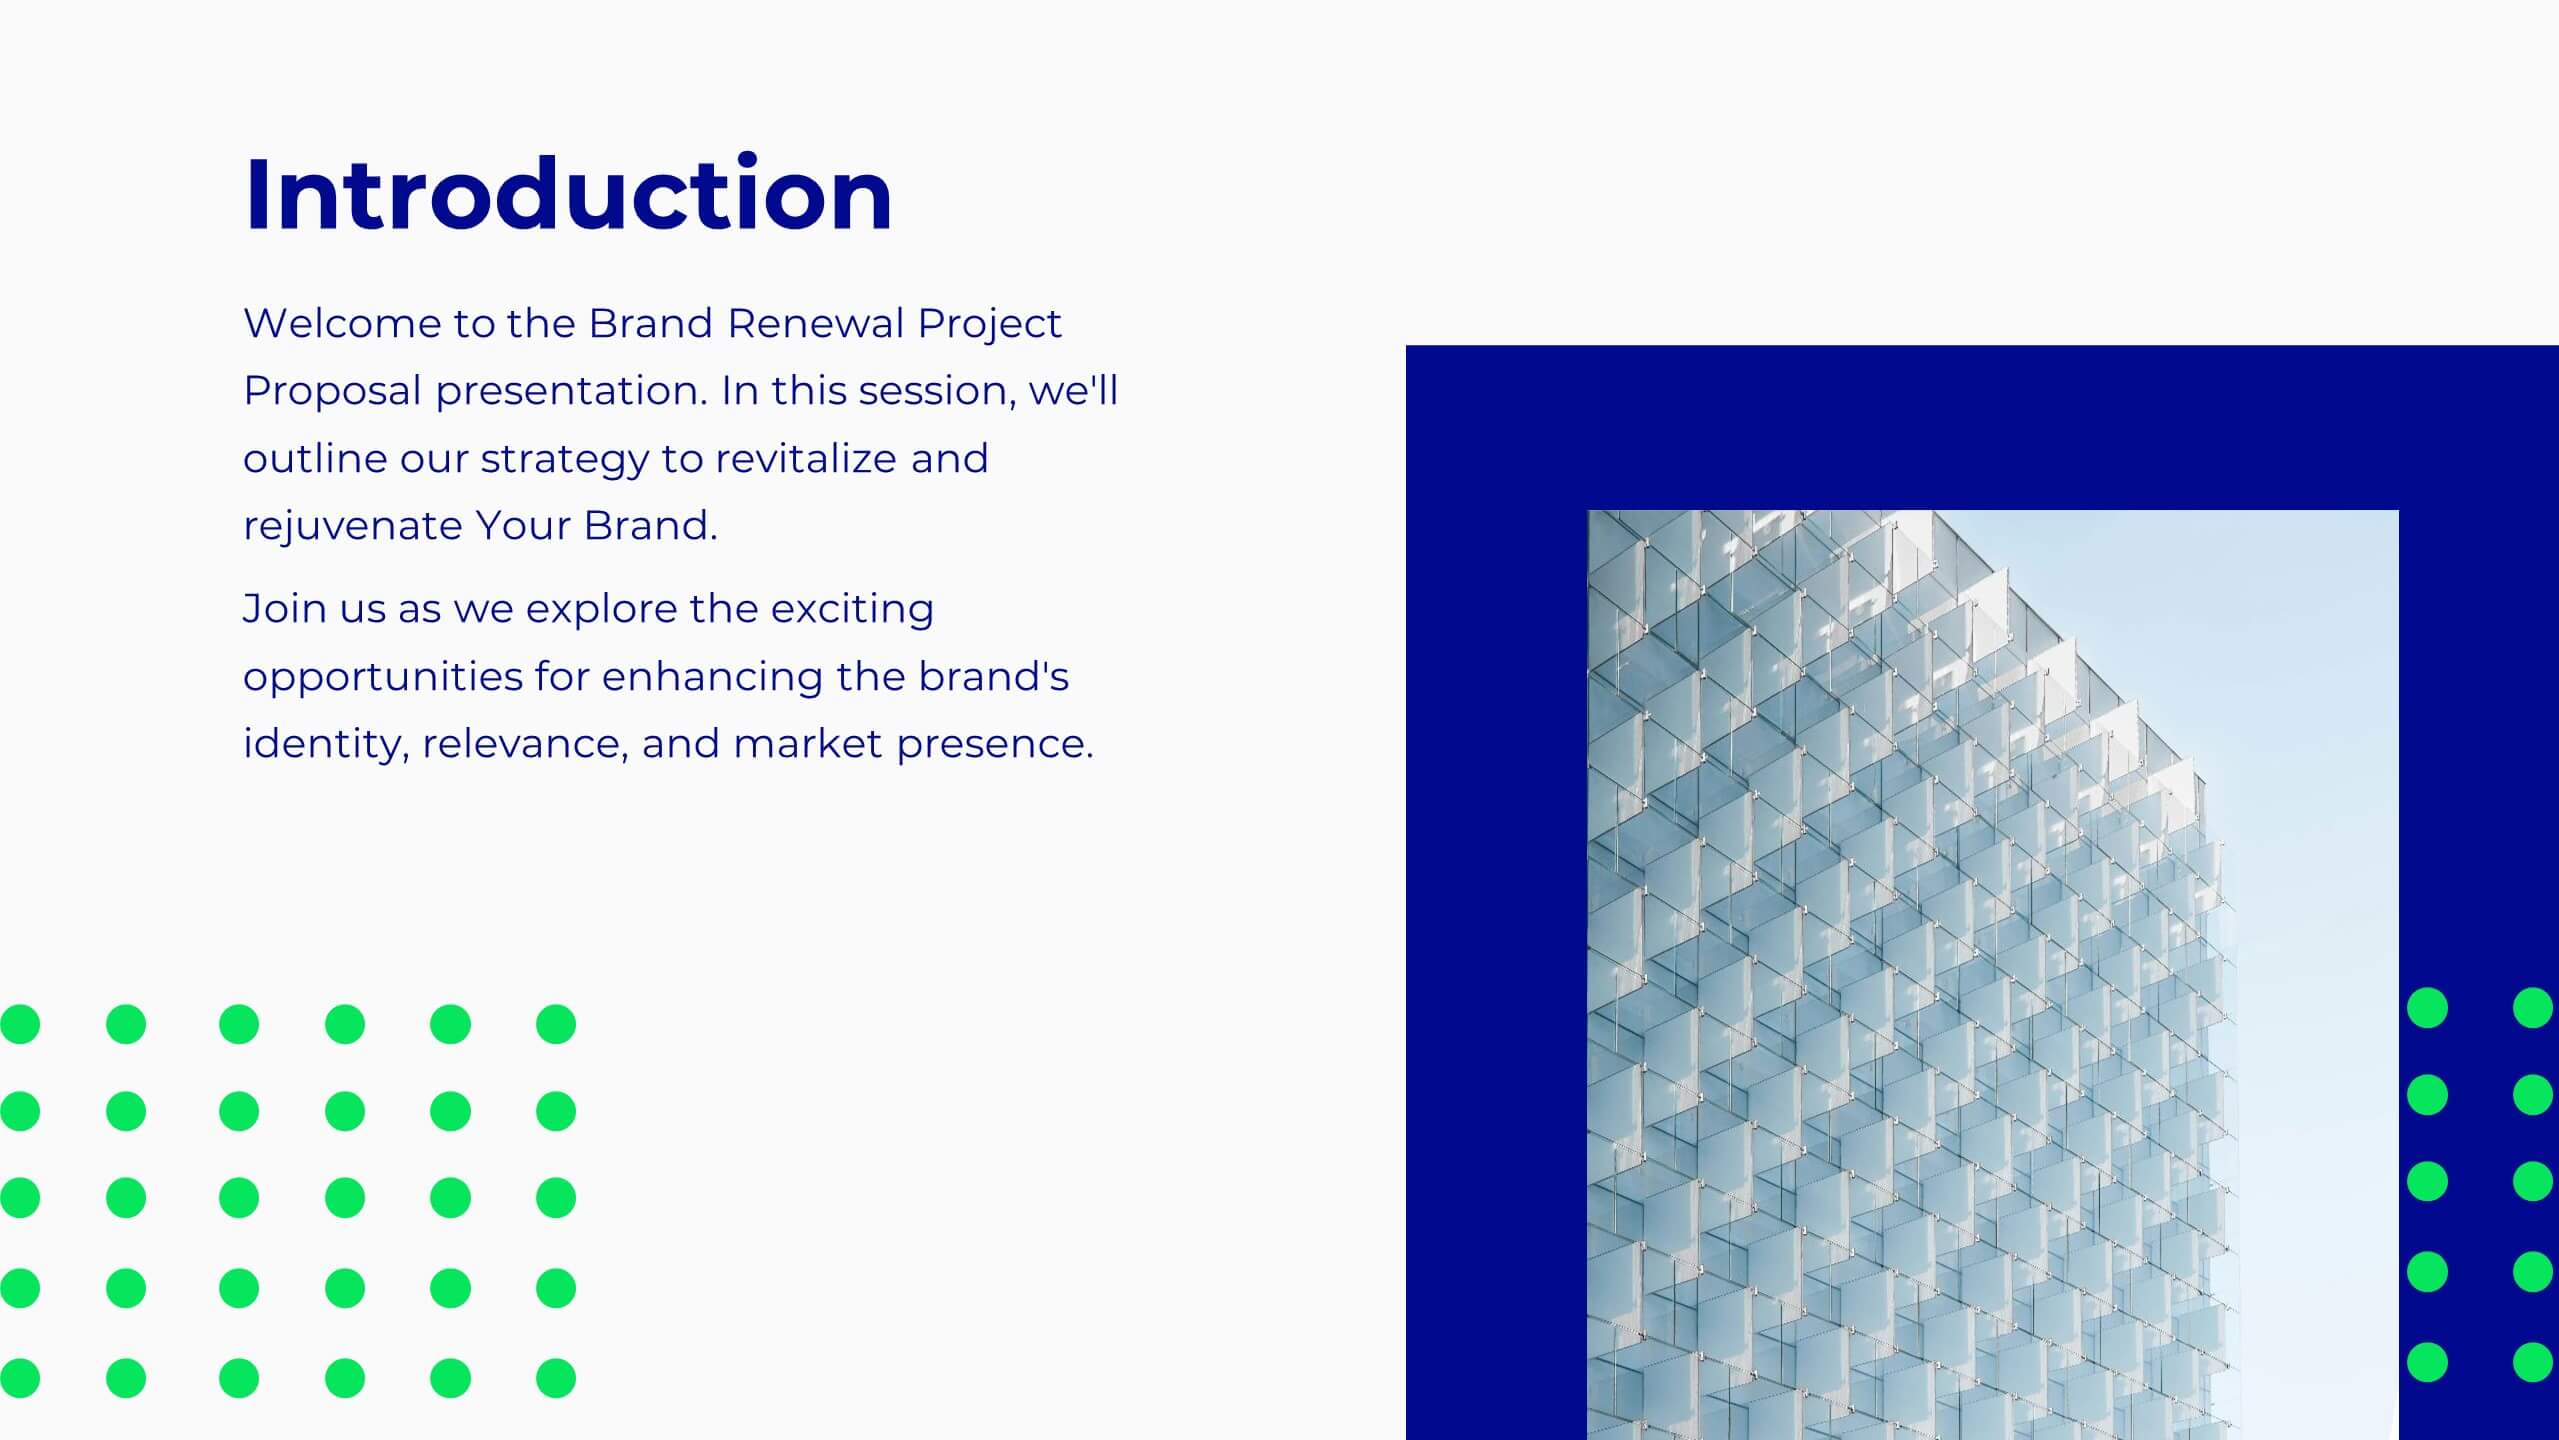
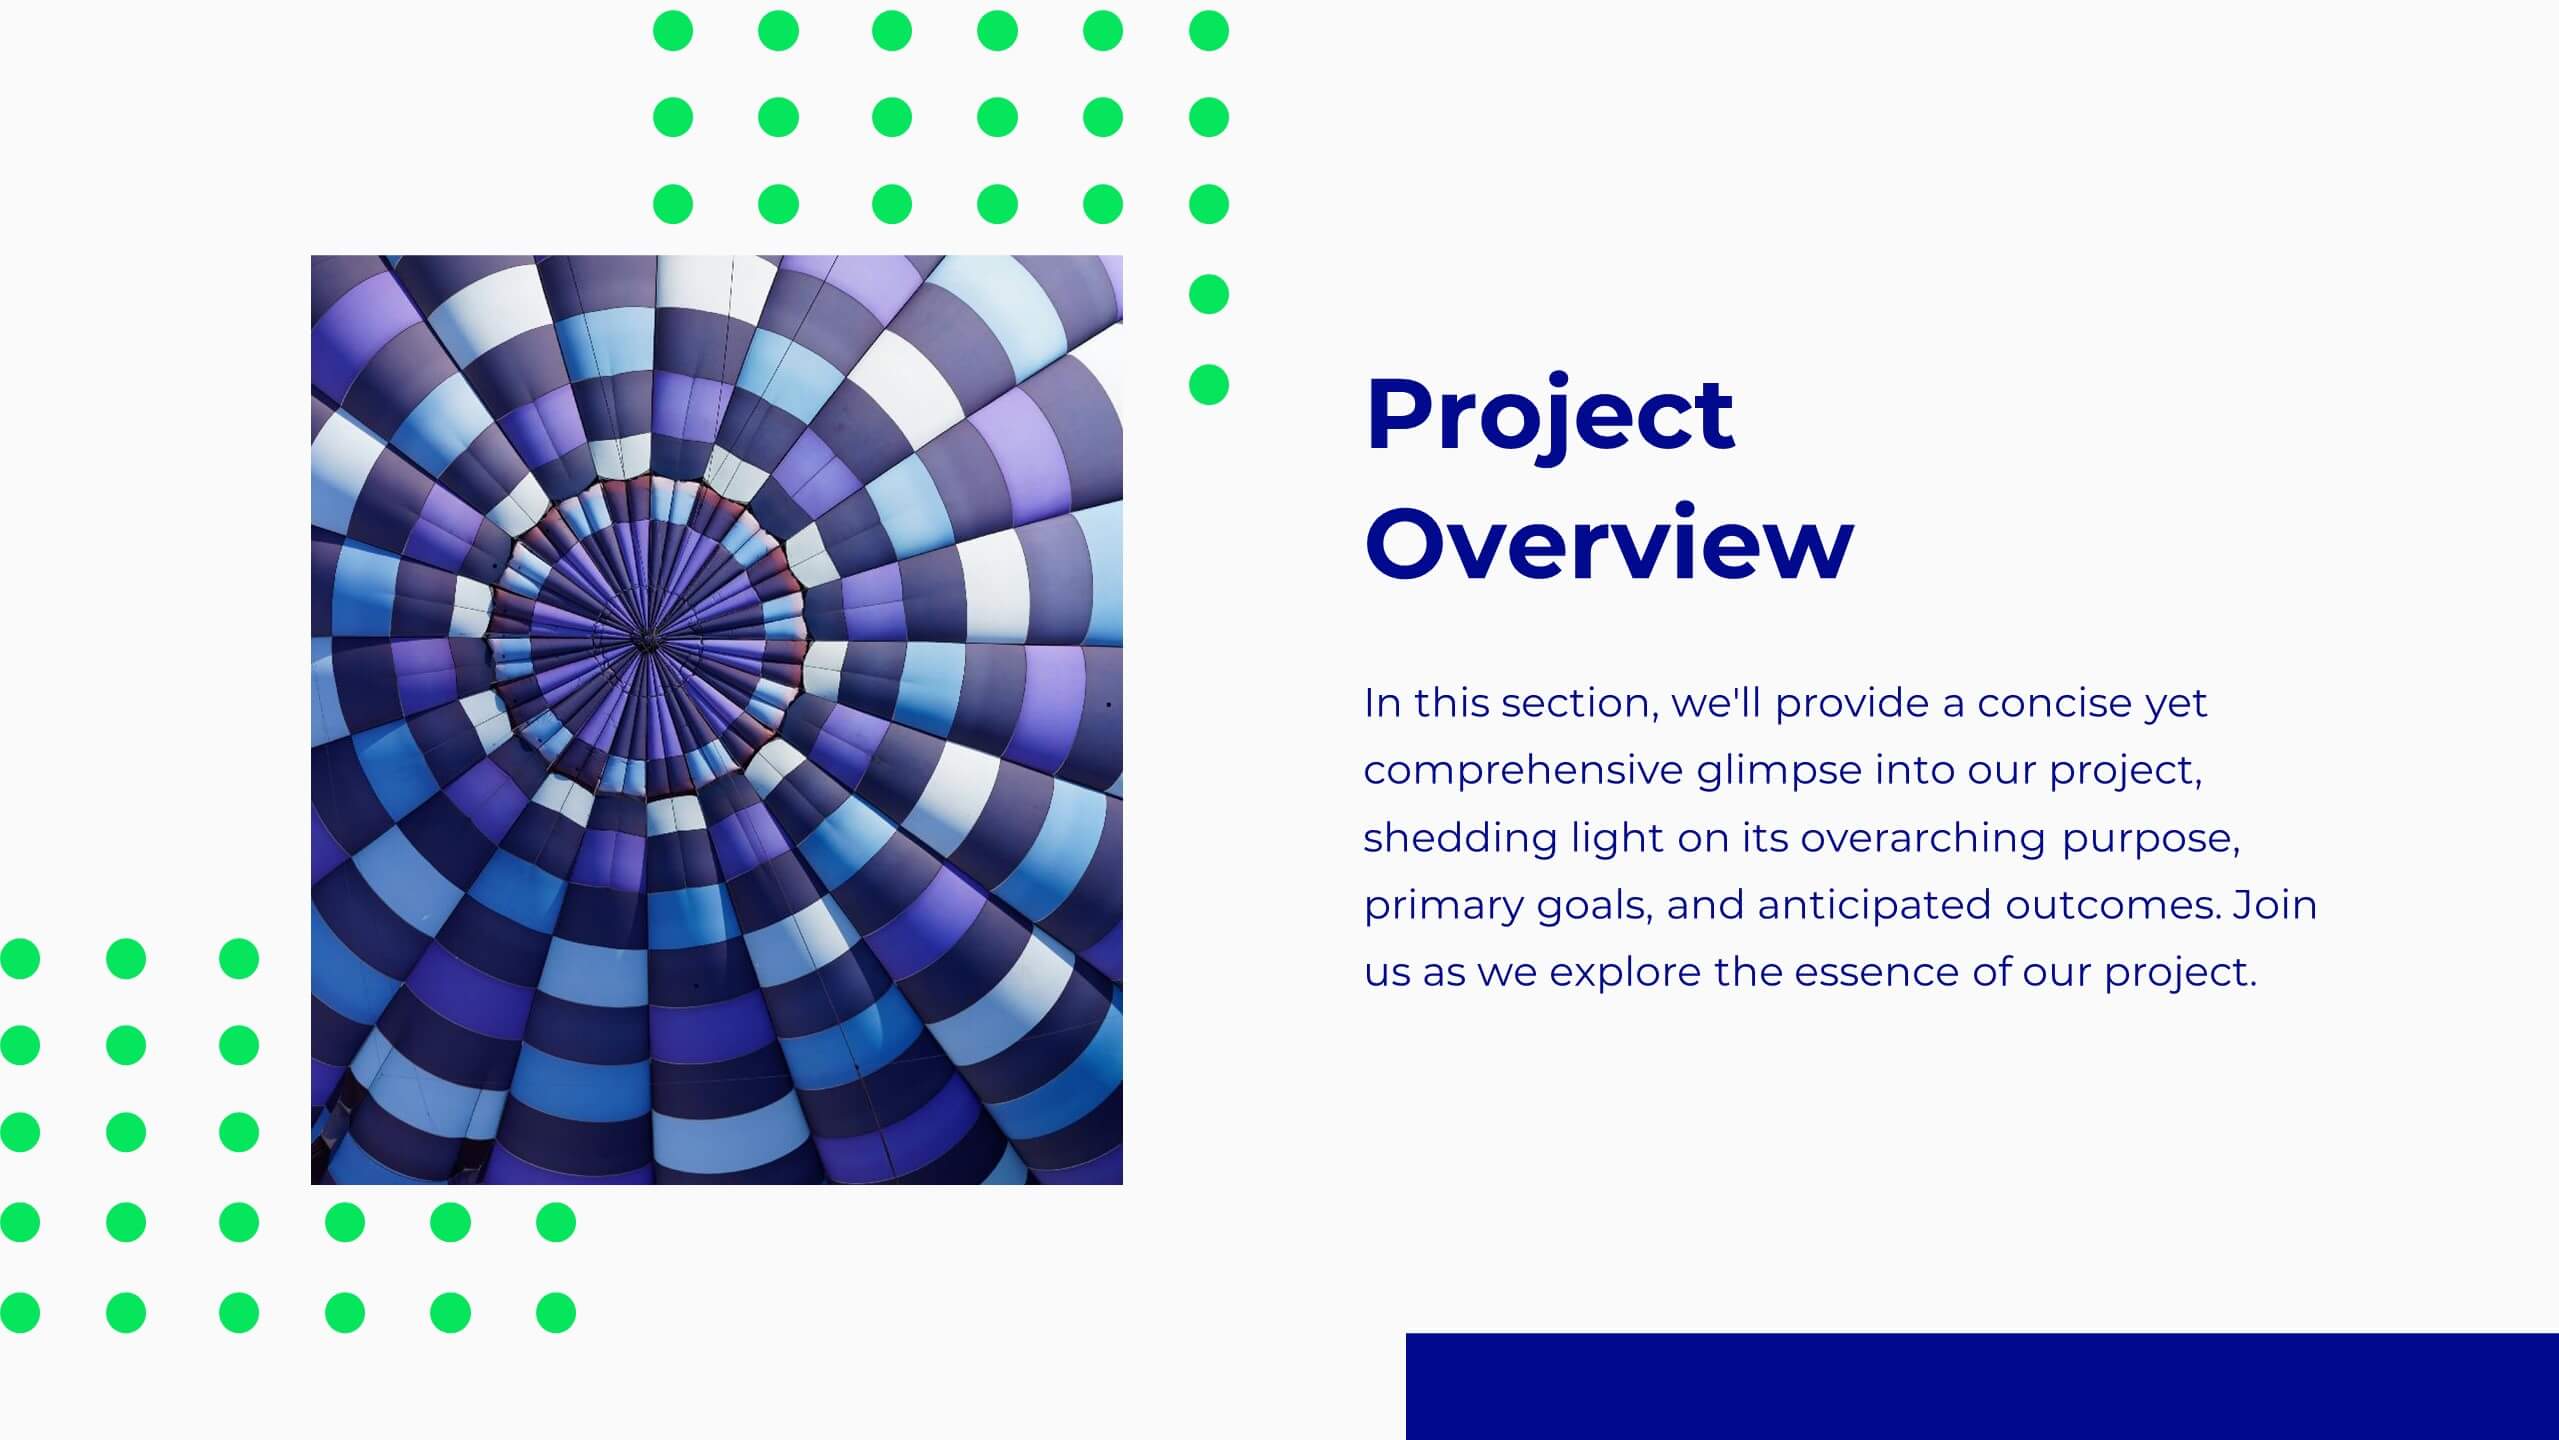
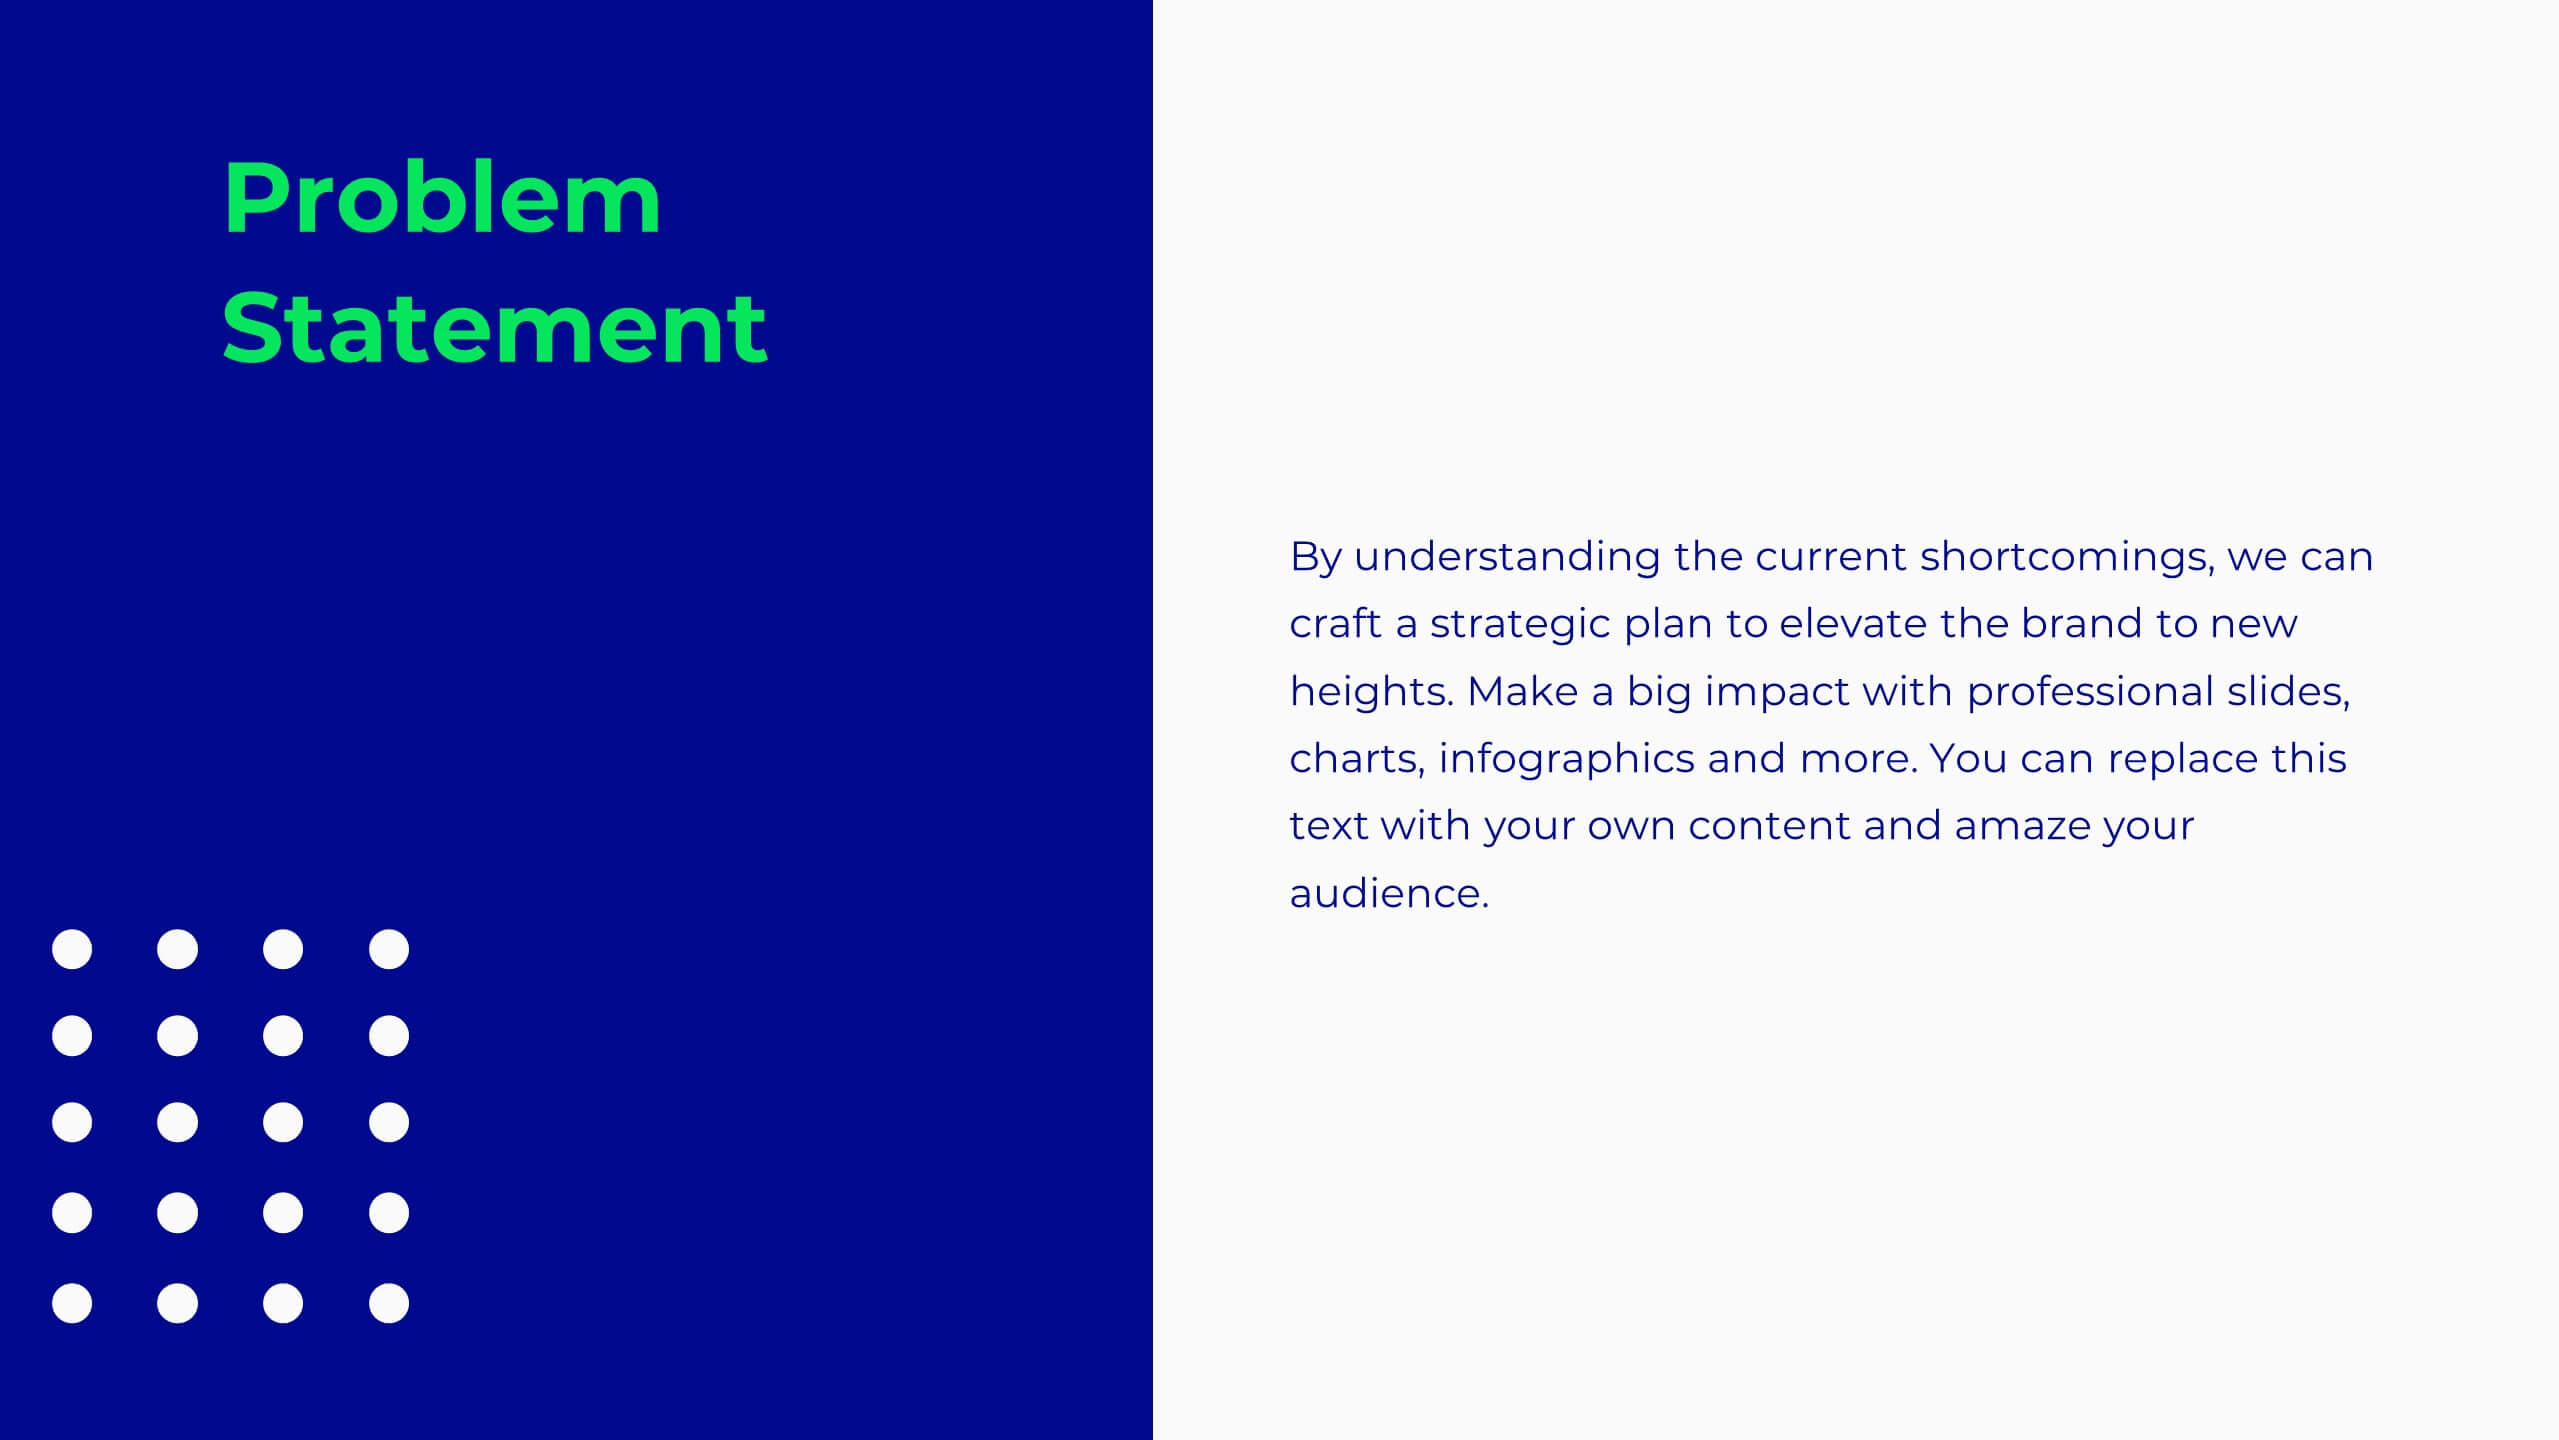
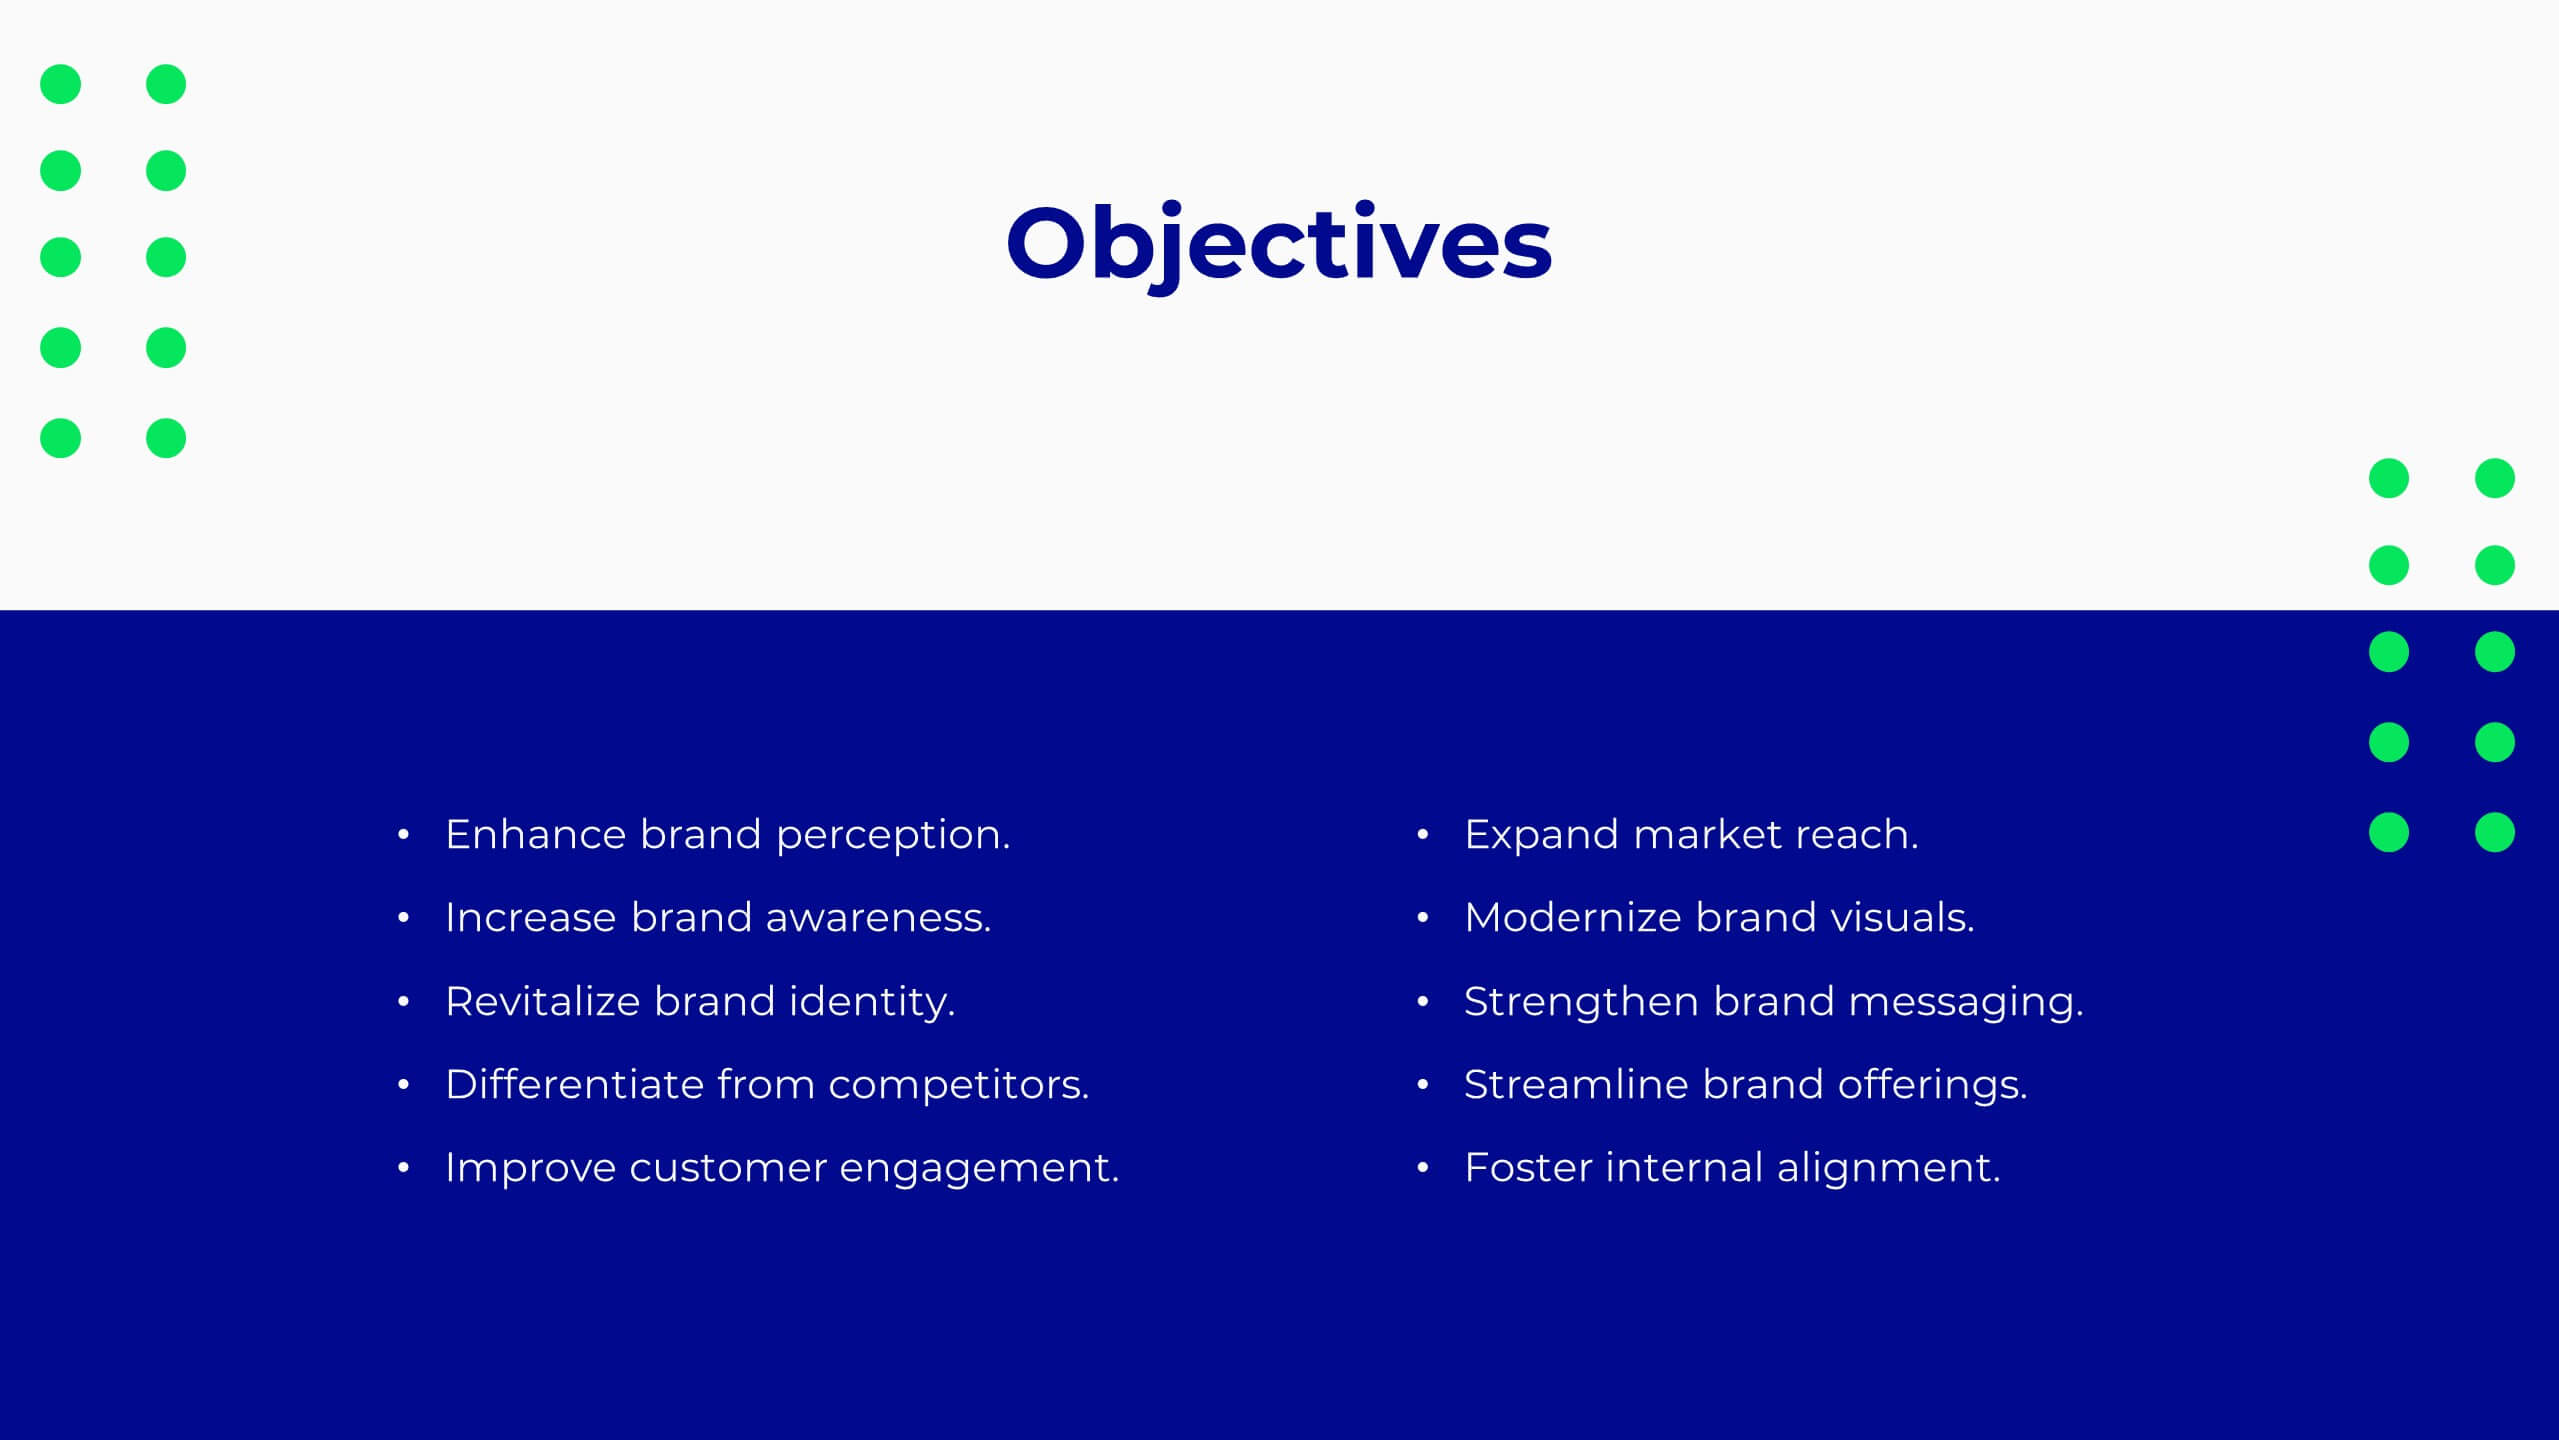
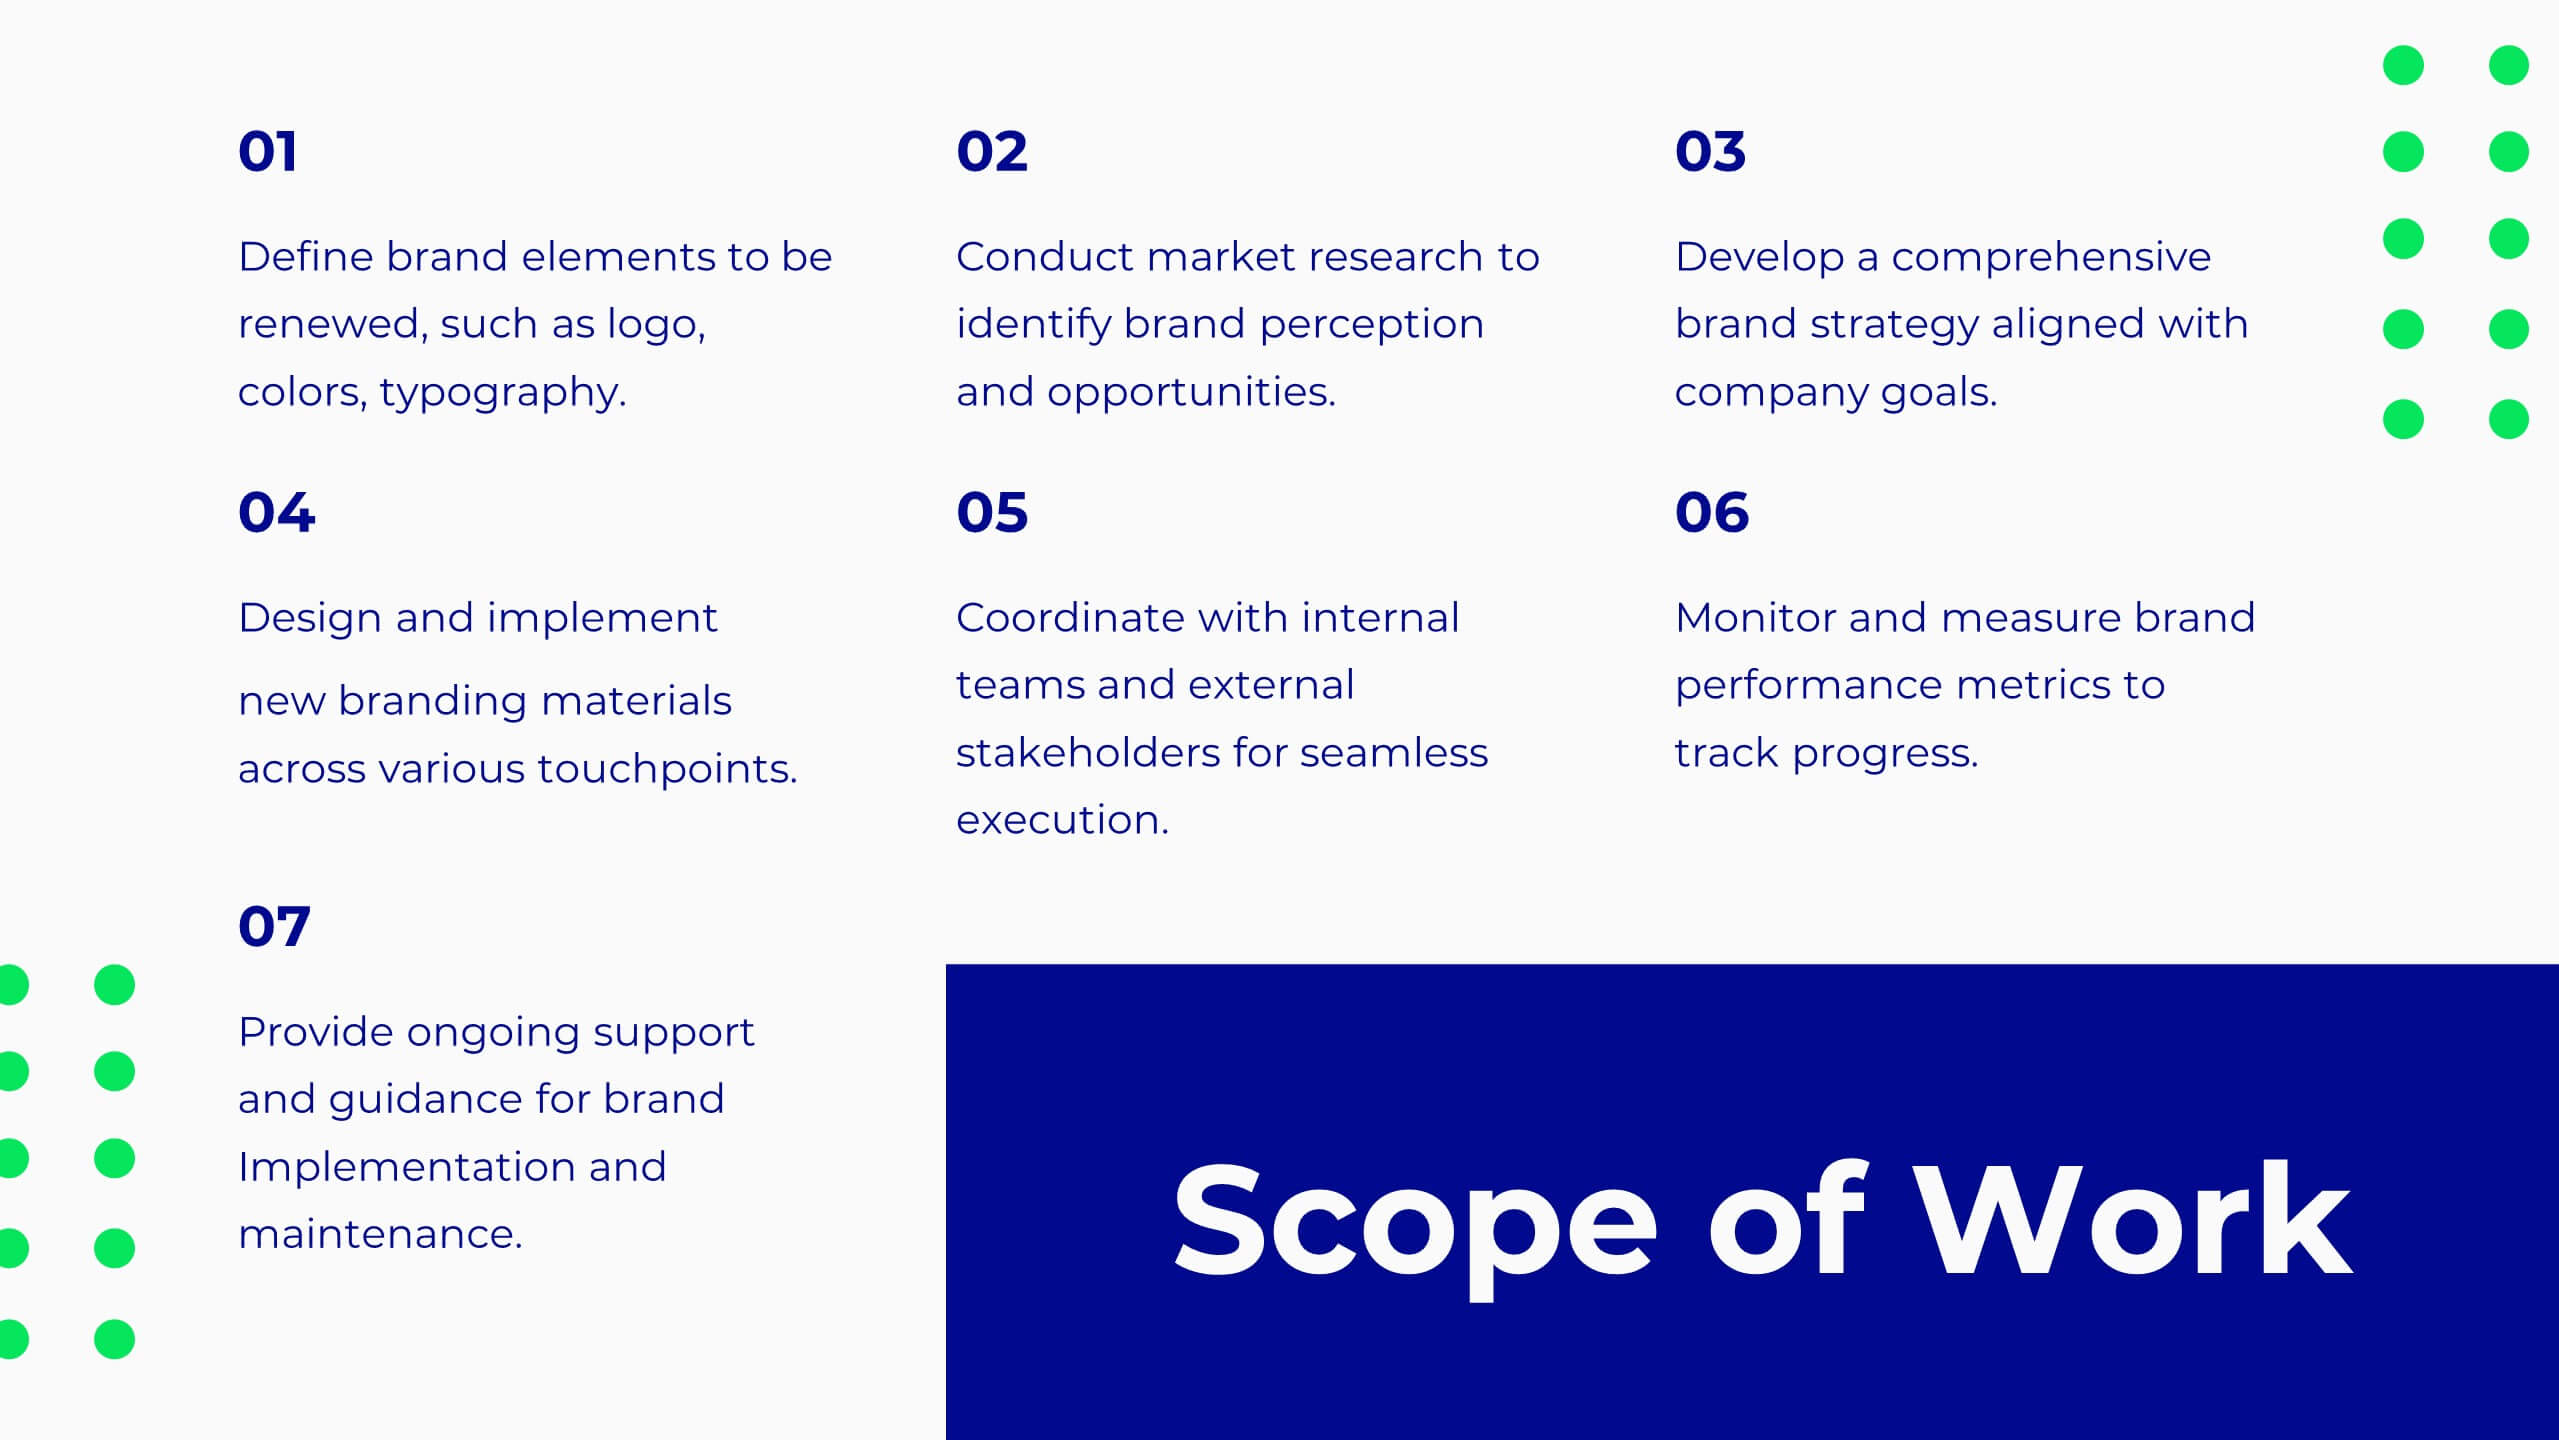
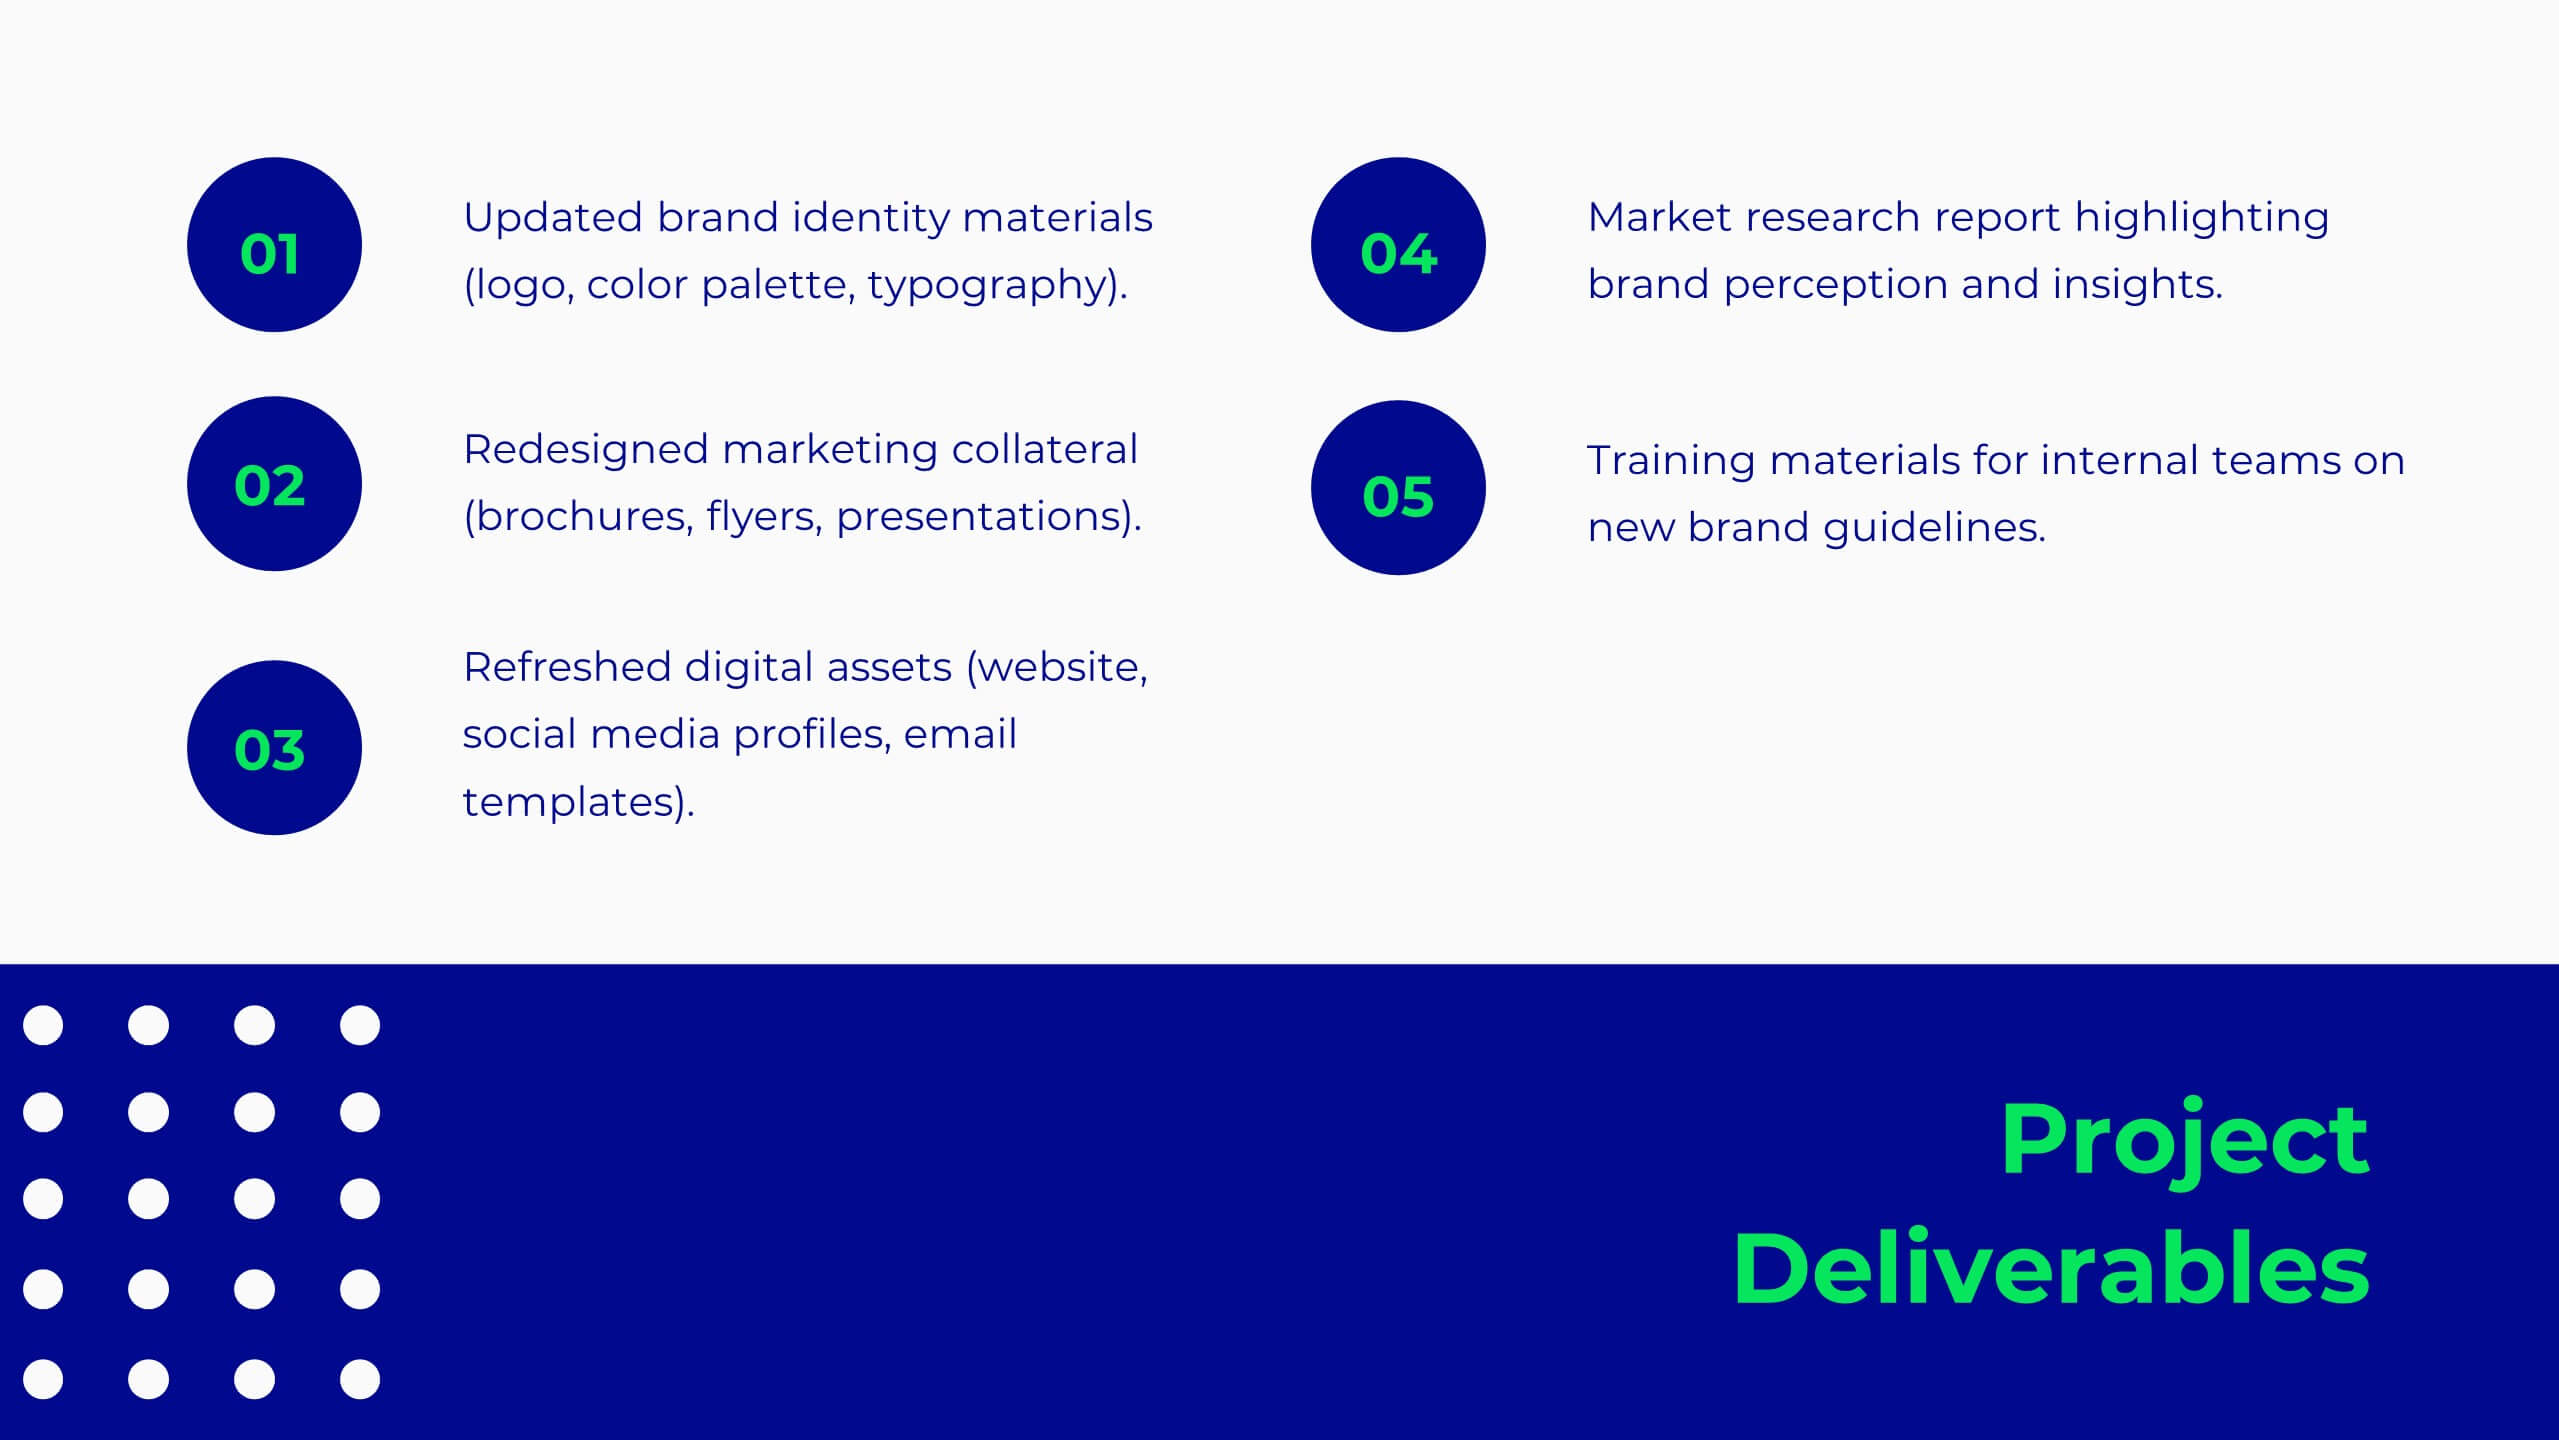
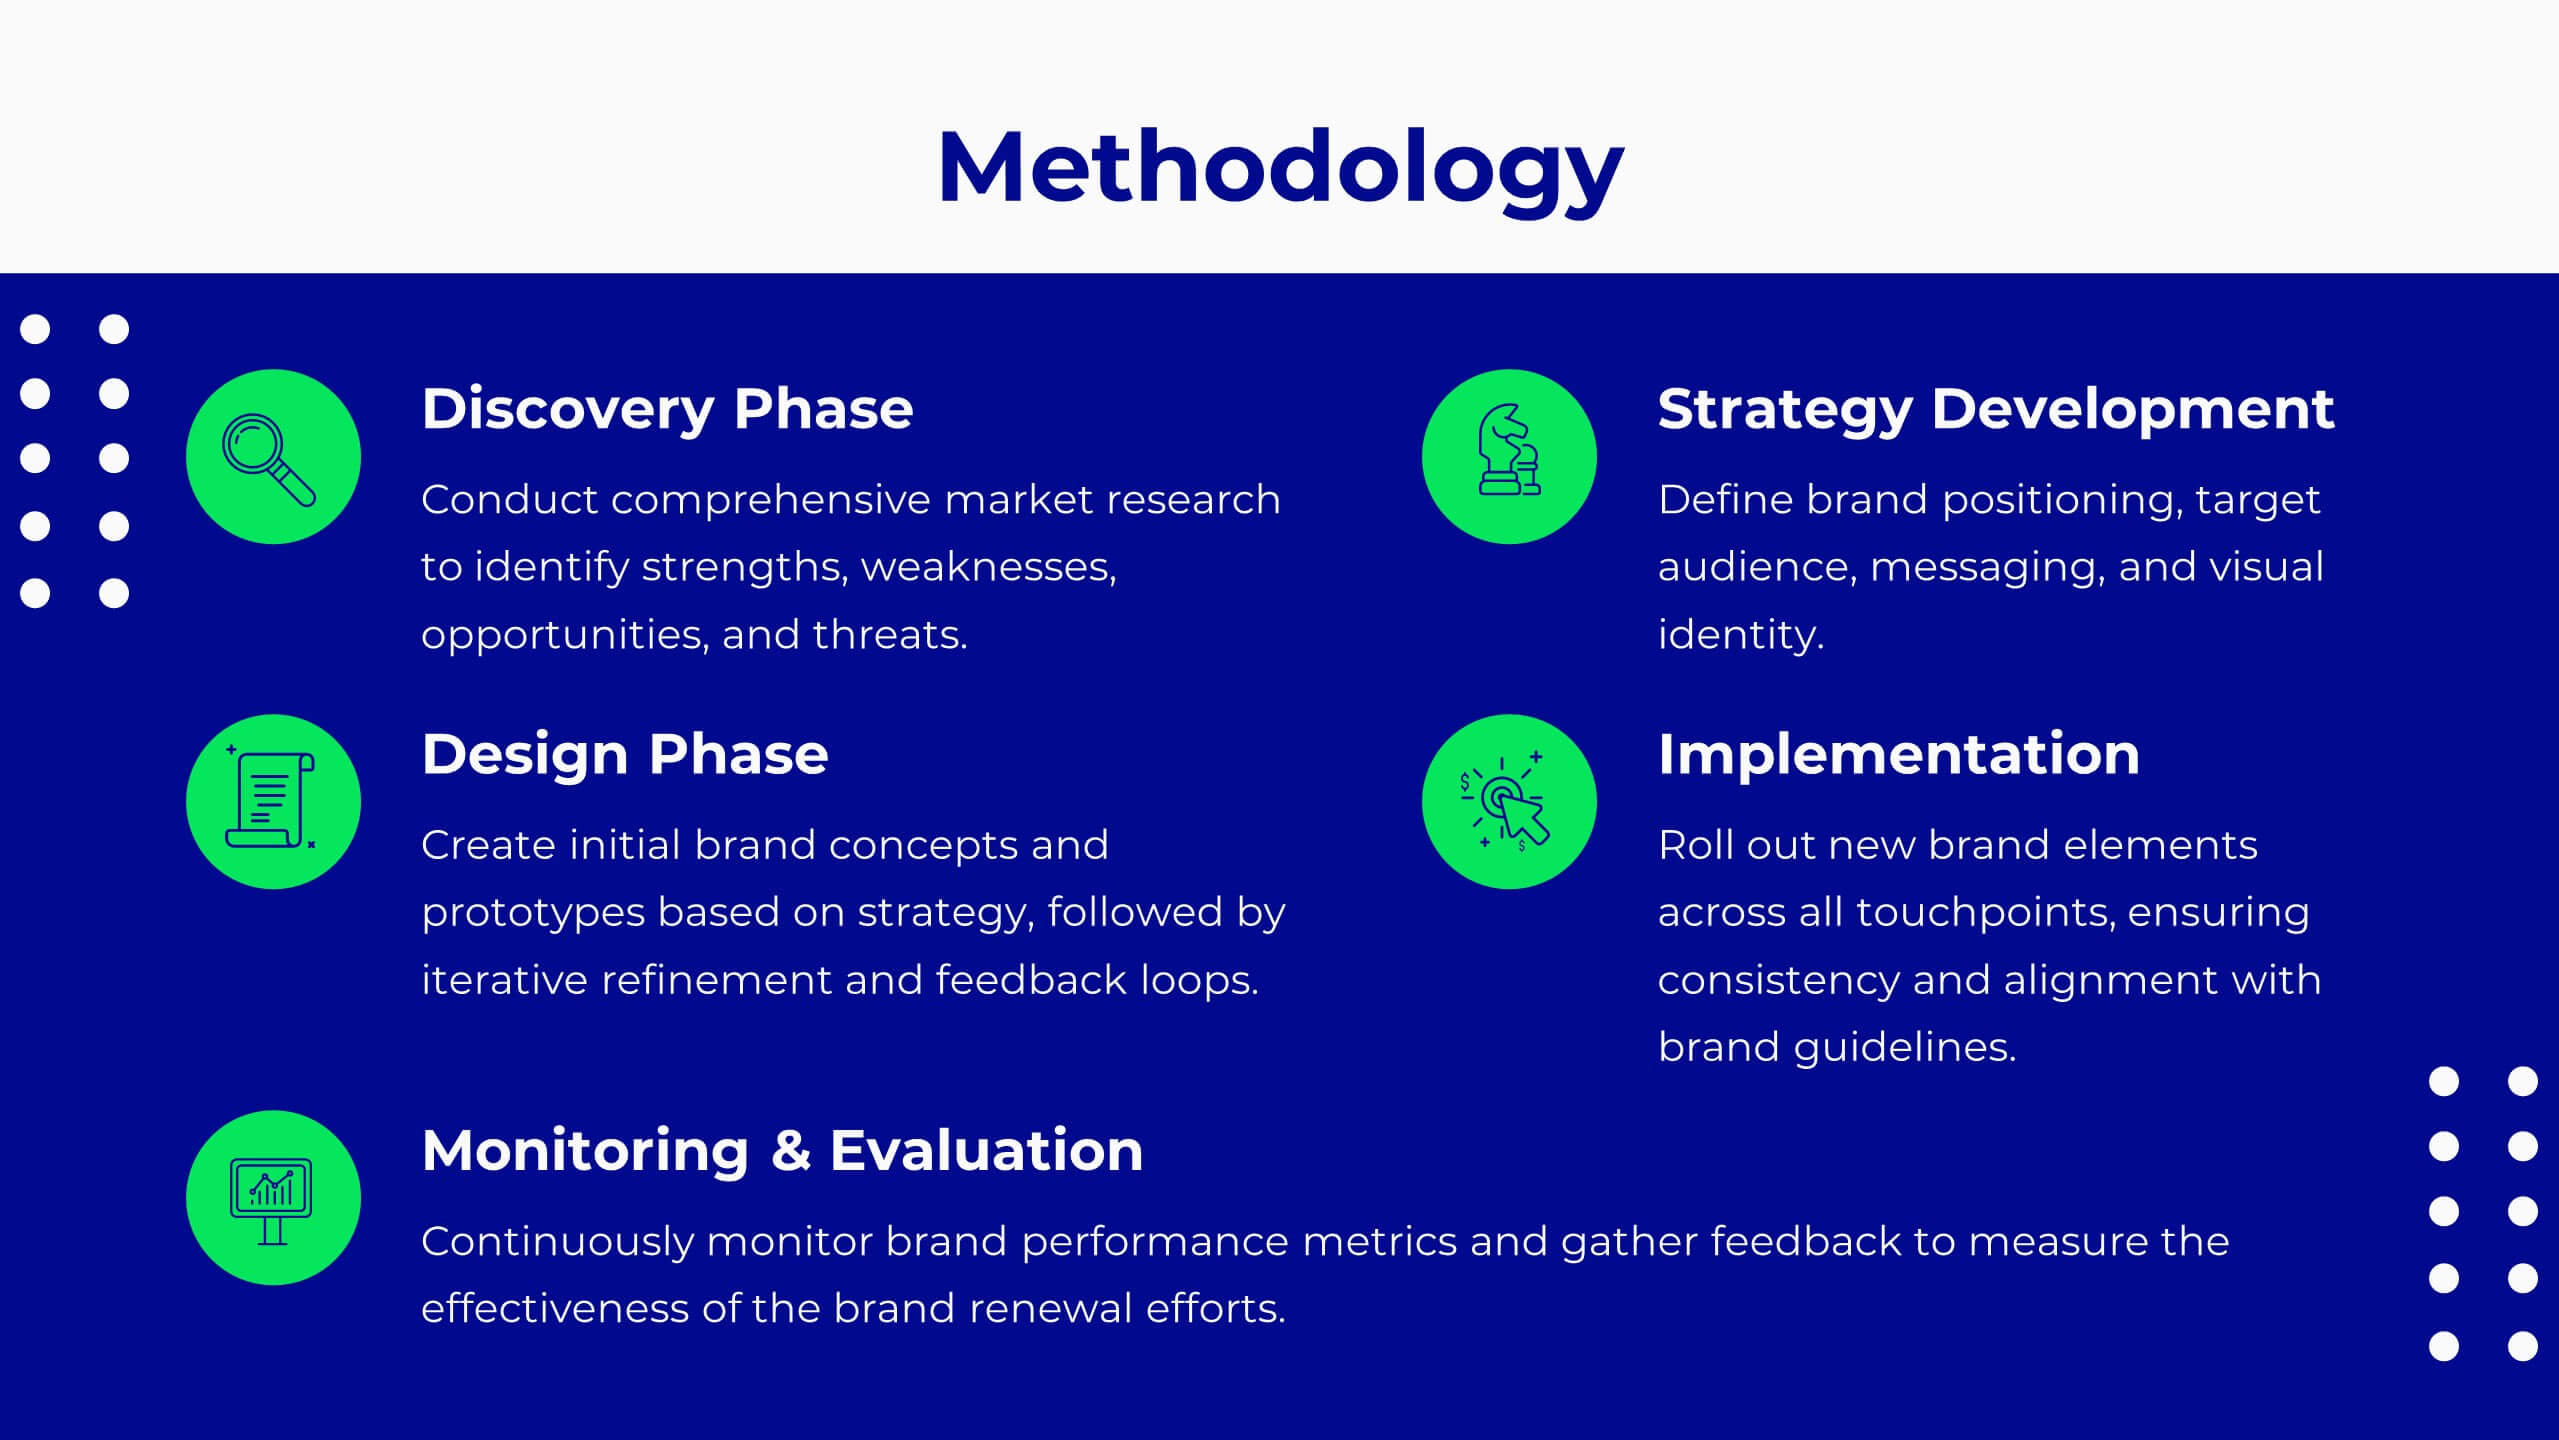
Tempo Brand Identity Presentation
Introduce and elevate your brand with this versatile presentation template designed to reflect your company's vision and values. Perfect for businesses looking to showcase their brand strategy, components, and touchpoints with clarity and professionalism. This presentation features thoughtfully designed slides covering brand identity components, visual guidelines, target audience insights, and future development plans. Use dedicated sections to outline your unique selling proposition, positioning, and strategy. With its clean layout and attention to detail, it's ideal for presenting a cohesive and impactful brand narrative. Compatible with PowerPoint, Google Slides, and Keynote, this template is fully customizable. Edit colors, text, and images to align with your brand aesthetics and messaging. Deliver your presentation with confidence, ensuring your audience is inspired by a polished and professional brand identity.


5 diapositivas
Digital Marketing Strategy Roadmap
Visualize your marketing initiatives step-by-step with this clean, arrow-driven roadmap design. Ideal for showcasing campaign planning, funnel stages, or content rollouts, this slide helps keep your strategy clear and easy to follow. Fully editable and compatible with PowerPoint, Keynote, and Google Slides.


20 diapositivas
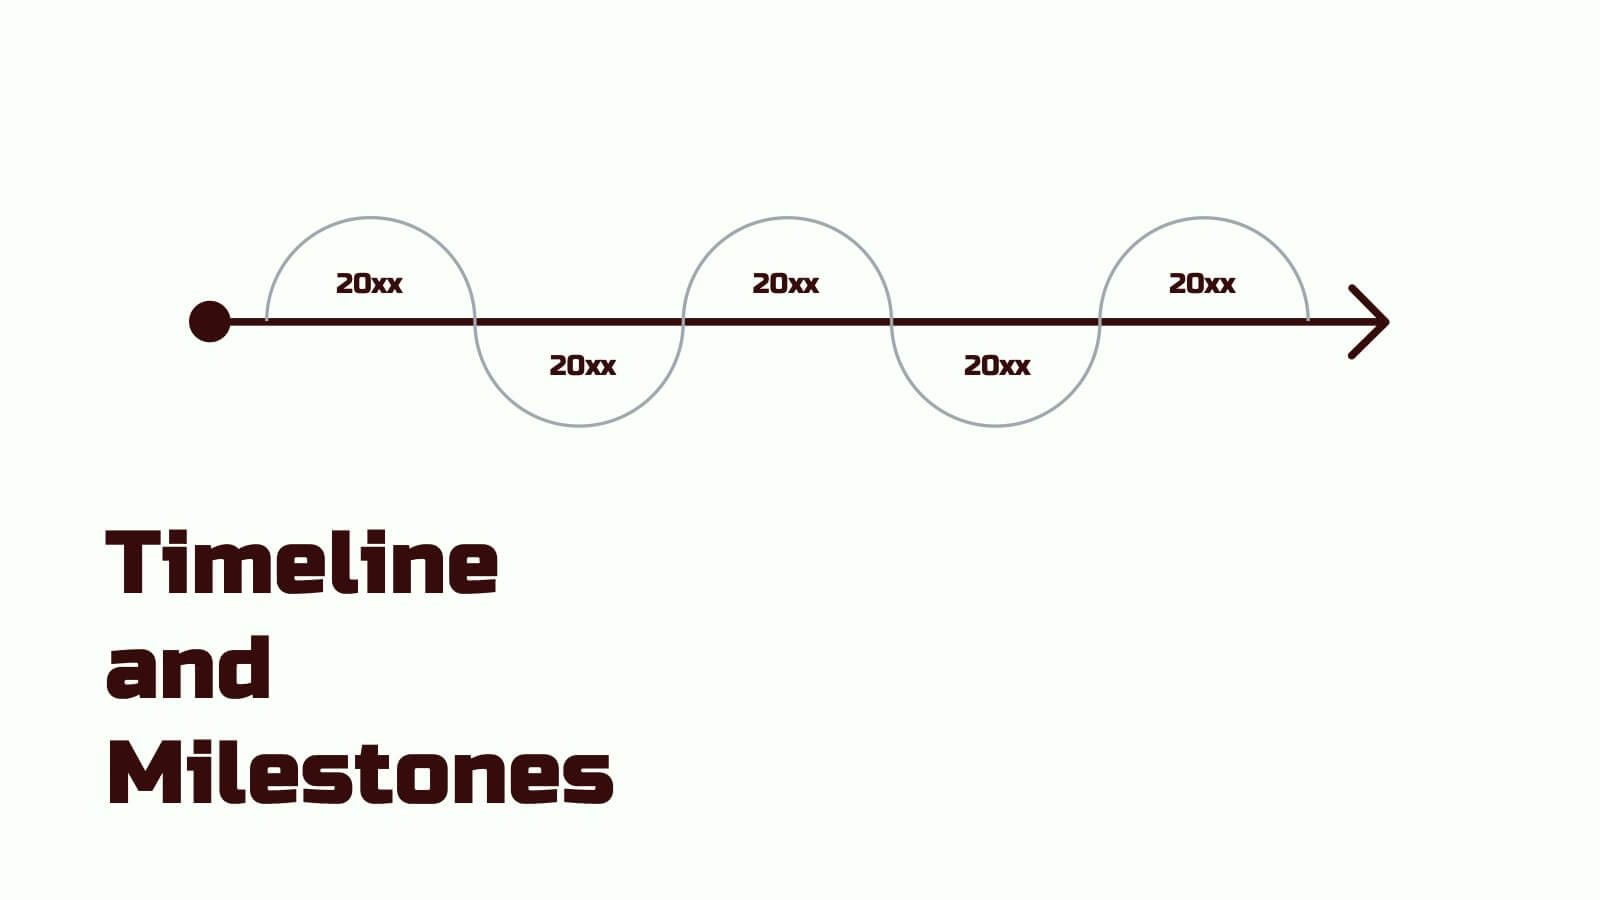
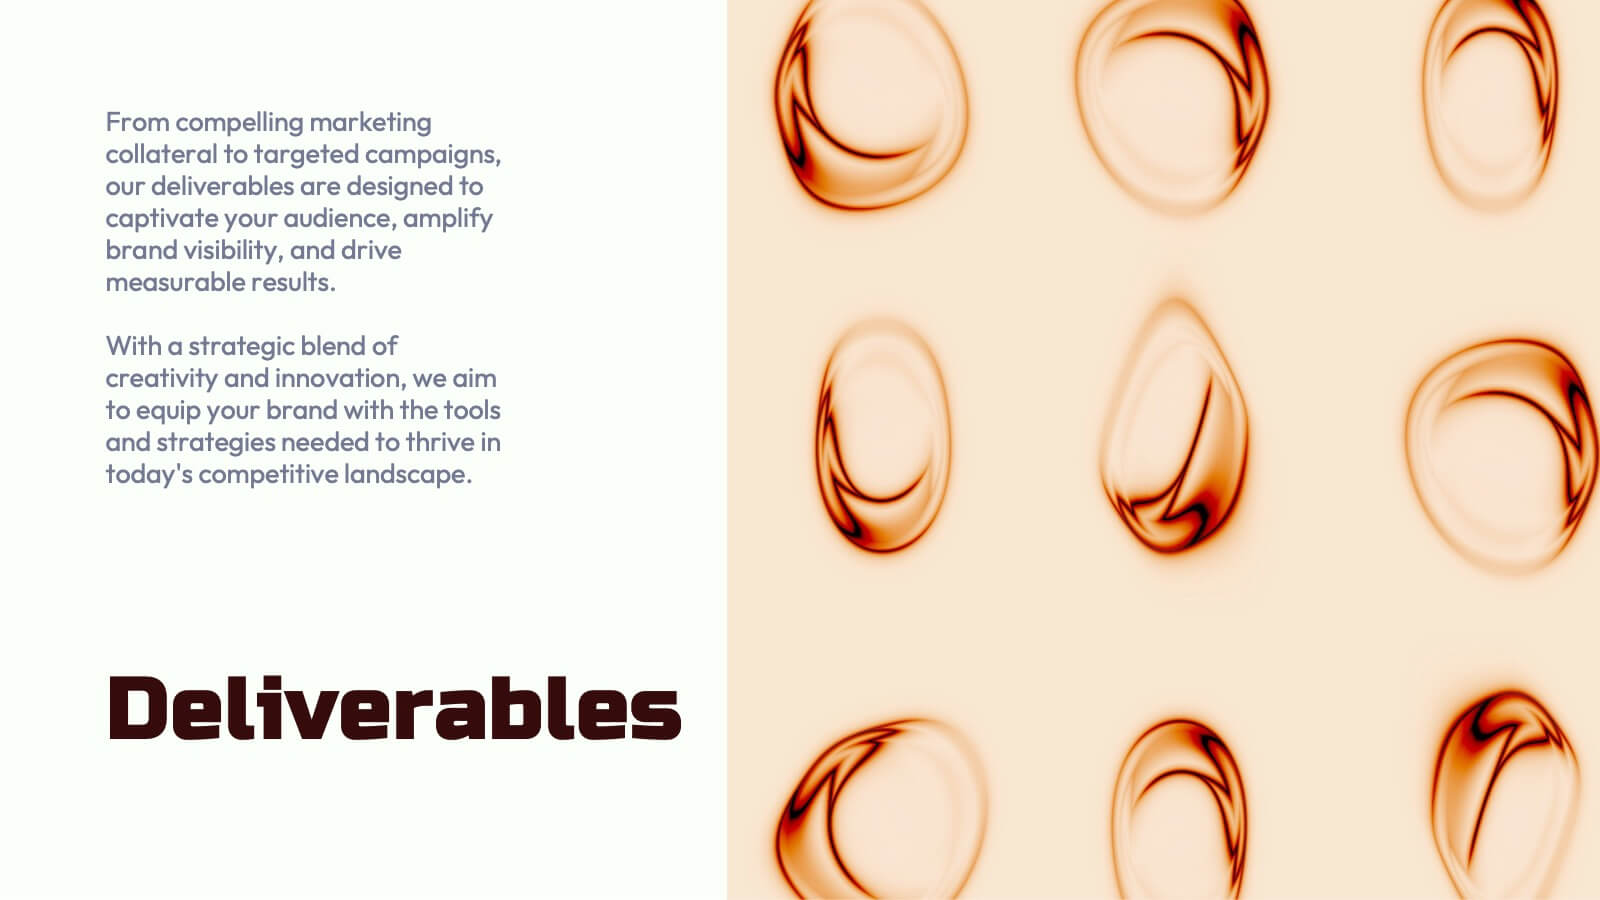
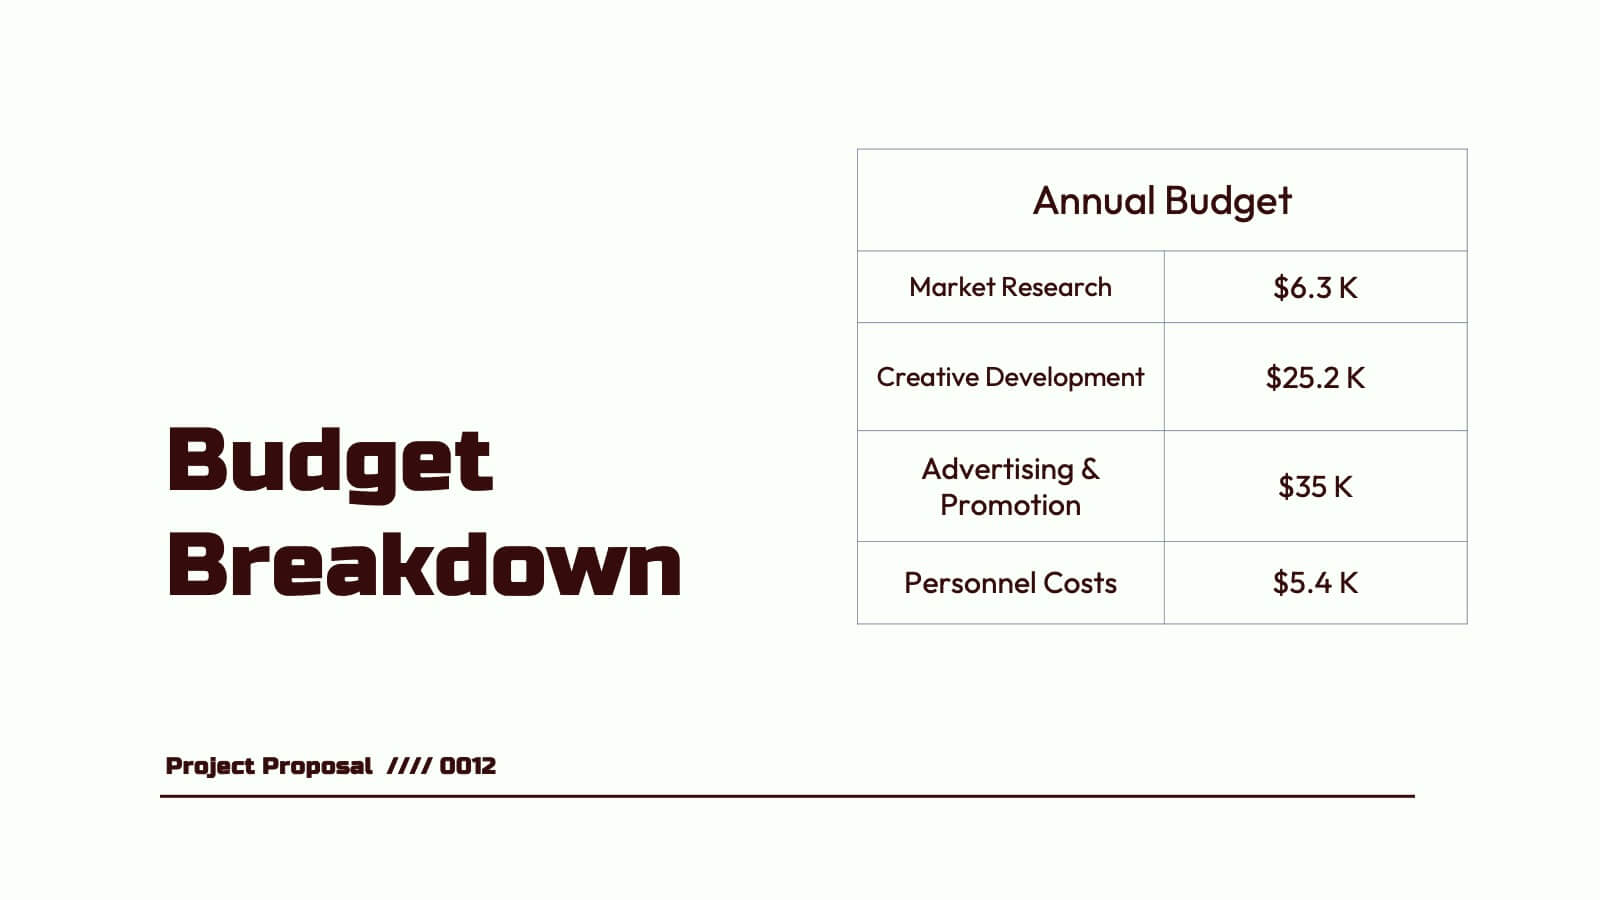
Nebula Project Proposal Presentation
Create a compelling project proposal with this structured, professional template! It includes sections for problem statements, proposed solutions, goals, timelines, and pricing. Perfect for organizing your ideas clearly and professionally, it's fully customizable and compatible with PowerPoint, Keynote, and Google Slides. This template makes it easy to present your proposals effectively and win clients.


4 diapositivas
Logistics Chain and Delivery Map Presentation
Navigate global supply chains with ease using this dynamic shipping and delivery slide. Designed around a cargo ship visual, this infographic helps teams outline each stage of their logistics journey—from origin to destination. Ideal for supply chain updates, shipping plans, or logistics strategy meetings. Fully compatible with PowerPoint, Keynote, and Google Slides.


7 diapositivas
Target Market Segmentation Infographic Presentation
A Target Market refers to a specific group of customers or consumers that a company or organization aims to sell its products or services too. This template has a design that can compliment your company's or organization's branding elements to make it a professional looking presentation. This template is perfect for the audience with in-depth knowledge of marketing; the template allows you to include important facts and statistics that will make it easily understandable by all types of audiences. The template comes with different chart slides, nice color combinations and graphs!


6 diapositivas
Overlapping Venn Diagram Comparison Presentation
Highlight similarities and distinctions with the Overlapping Venn Diagram Comparison Presentation. This template is perfect for showcasing three interconnected concepts, ideas, or departments in a clean and professional layout. Each circle is color-coded and labeled, with the intersections visually emphasizing shared elements. Ideal for project planning, business analysis, or strategic presentations. Fully editable in PowerPoint, Keynote, and Google Slides.


3 diapositivas
Professional Introduction Slide
Introduce team members with clarity and style using this profile-focused slide. Designed to highlight key stats, roles, and responsibilities, it’s perfect for internal presentations, onboarding, or proposals. Easily customizable in PowerPoint, Keynote, and Google Slides.


5 diapositivas
Educational Planning & Class Activities Presentation
Organize your lessons with this creative education-themed layout. Featuring a playful stack of books and apple illustration, this slide is ideal for outlining academic plans, class objectives, or weekly activities. Fully editable in PowerPoint, Keynote, and Google Slides—perfect for teachers, homeschoolers, and education professionals seeking clarity and visual appeal.


14 diapositivas
Leadership Training Workshop
Build stronger leaders with a visually engaging puzzle-style layout that maps out each stage of leadership development. This training workshop presentation uses an intuitive, step-by-step format to guide your audience through key growth areas, making it perfect for team-building or executive sessions. Fully compatible with PowerPoint, Keynote, and Google Slides.