


Características


¿Tienes alguna pregunta?
Recomendar


26 diapositivas
Corporate Finance Presentation
The "Corporate Finance" template is your financial compass for presentations that require a mix of precision and clarity. Tailored for use on PowerPoint, Keynote, and Google Slides, it is perfect for demystifying the world of corporate finance. Commence with the "Wealth strategies designed for your unique journey" slide to capture the tailored approach of your financial services. The "Table of Contents" neatly outlines the topics such as investment strategies, risk management, and financial forecasting. Introduce the minds behind the numbers with "Meet Our CEO" and "Meet Our Team" slides. Utilize the "Three Option Slide" to present different financial models, and the "Chart Slide" to depict financial performance. The "Bringing a new perception of investing" slide can redefine investment approaches, while "Feel good with Earning, Feel free to call us." invites engagement. Every slide offers the opportunity to infuse data-driven insights with compelling visuals, ensuring that your "Corporate Finance" presentation not only informs but also impresses your corporate audience.


6 diapositivas
Target Audience Segmentation Strategy
Break down your audience with clarity using the Target Audience Segmentation Strategy Presentation. This slide features a vibrant vertical funnel layout, ideal for displaying five customer segments or persona categories. Each layer is numbered and color-coded, with connected callout areas for detailed insights. Perfect for marketers, campaign strategists, or product teams presenting customer journey data, audience demographics, or behavioral insights. Fully customizable in PowerPoint, Keynote, and Google Slides—easily align the design with your brand colors and content structure.


3 diapositivas
Strategic Planning and Business Model Presentation
Present your business roadmap with clarity using this Strategic Planning and Business Model slide. Featuring a modular grid layout, it allows you to break down initiatives, objectives, and action items into digestible segments. Perfect for business strategy sessions, planning workshops, or executive reports. Fully editable in PowerPoint, Canva, and Google Slides.


6 diapositivas
2-Option Comparison Chart Presentation
Make your decision-making story pop with a clean, energetic layout that clearly contrasts two paths side by side. This presentation helps you compare options, outline pros and cons, and guide audiences toward confident choices with sharp visual structure. Fully compatible with PowerPoint, Keynote, and Google Slides.


4 diapositivas
Three-Part Triangle Model Presentation
Show the perfect balance between three core ideas with this dynamic triangular layout. Designed for clarity and structure, it’s ideal for visualizing strategies, models, or relationships in a professional way. Fully editable and compatible with PowerPoint, Keynote, and Google Slides for effortless customization and polished results.


5 diapositivas
Modern Design with Geometric Elements Presentation
Elevate your message with this clean, modern layout featuring four-leaf geometric icons and subtle color accents. Perfect for showcasing strategic concepts or business pillars in a stylish, easy-to-read format. Ideal for proposals, updates, or team presentations. Fully editable in PowerPoint, Google Slides, Keynote, and Canva. Professional and versatile.


5 diapositivas
Consideration in Contract Law Infographics
Navigate the complexities of contract law with our consideration in contract law infographics. Crafted with a vintage aesthetic, using a palette of brown, tan, and blue, this sophisticated template radiates a classic legal ambiance. Ideal for law students, legal professionals, and educators, this collection aids in dissecting intricate contractual principles with clarity and elegance. Compatible with Powerpoint, Keynote, and Google Slides. The creative, vintage-themed design, adorned with graphics and icons, not only enriches your presentation but also serves as a compelling educational tool, transforming legal jargon into accessible information.

23 diapositivas
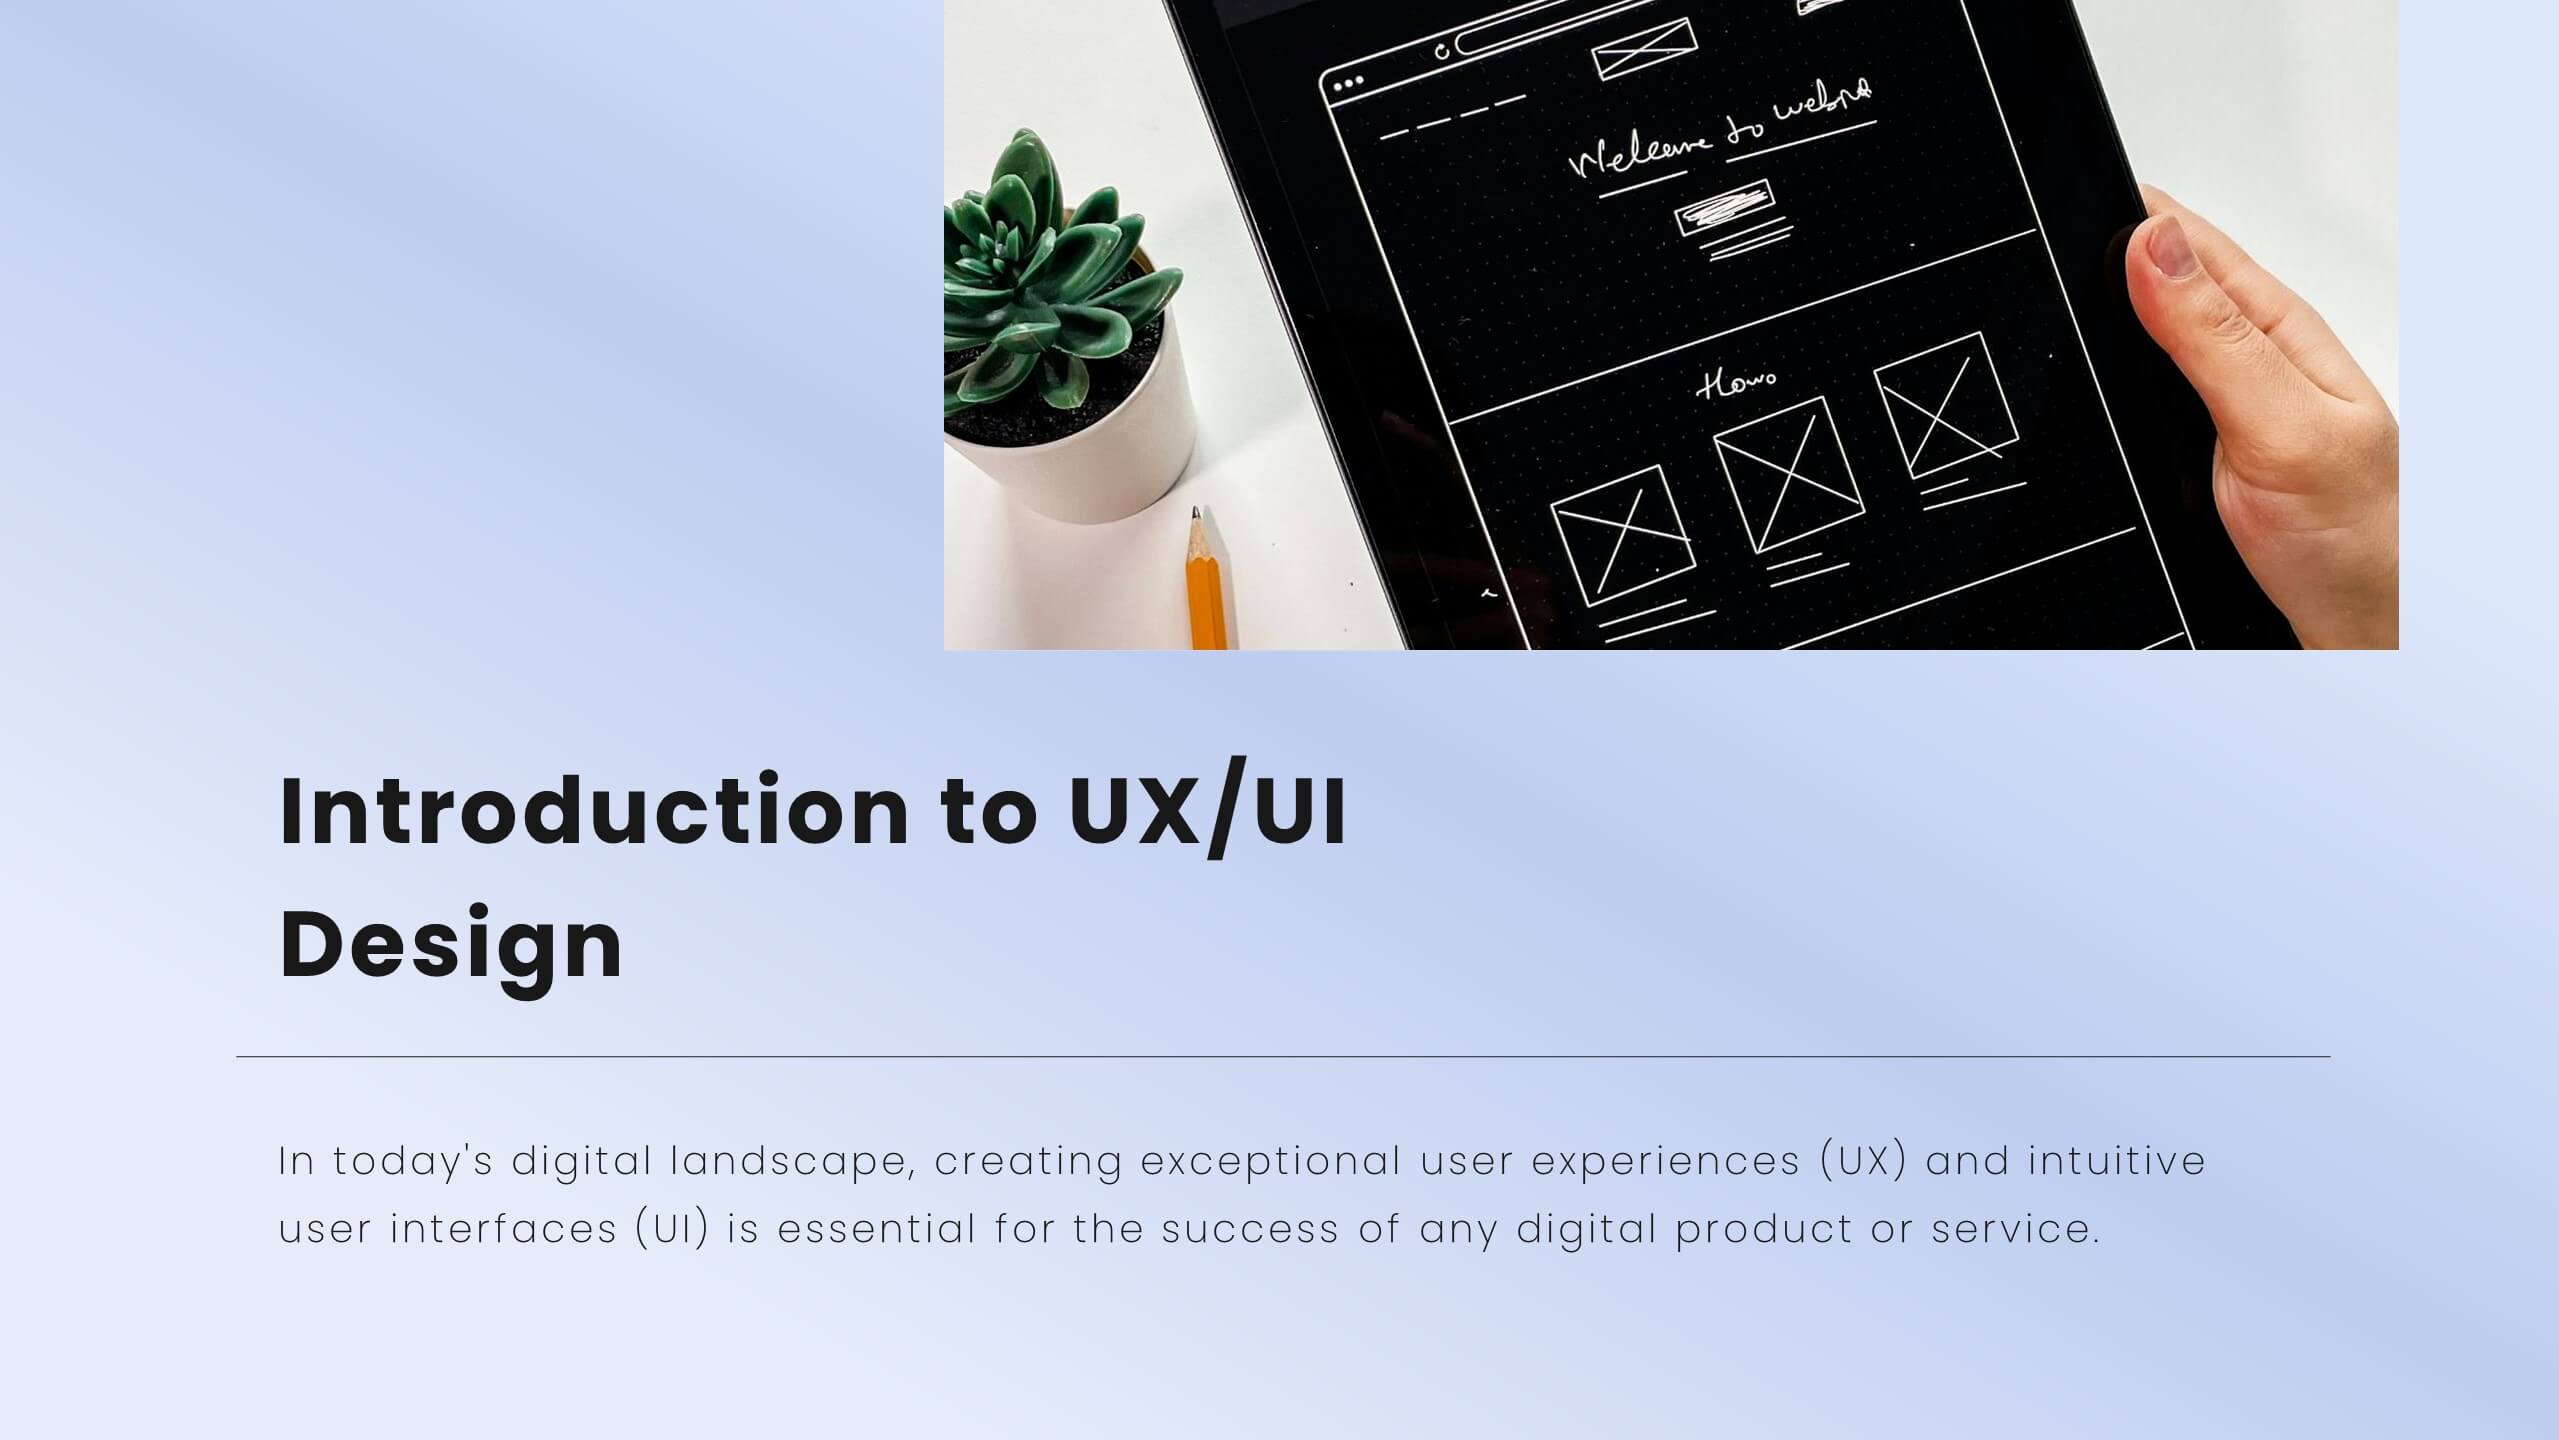
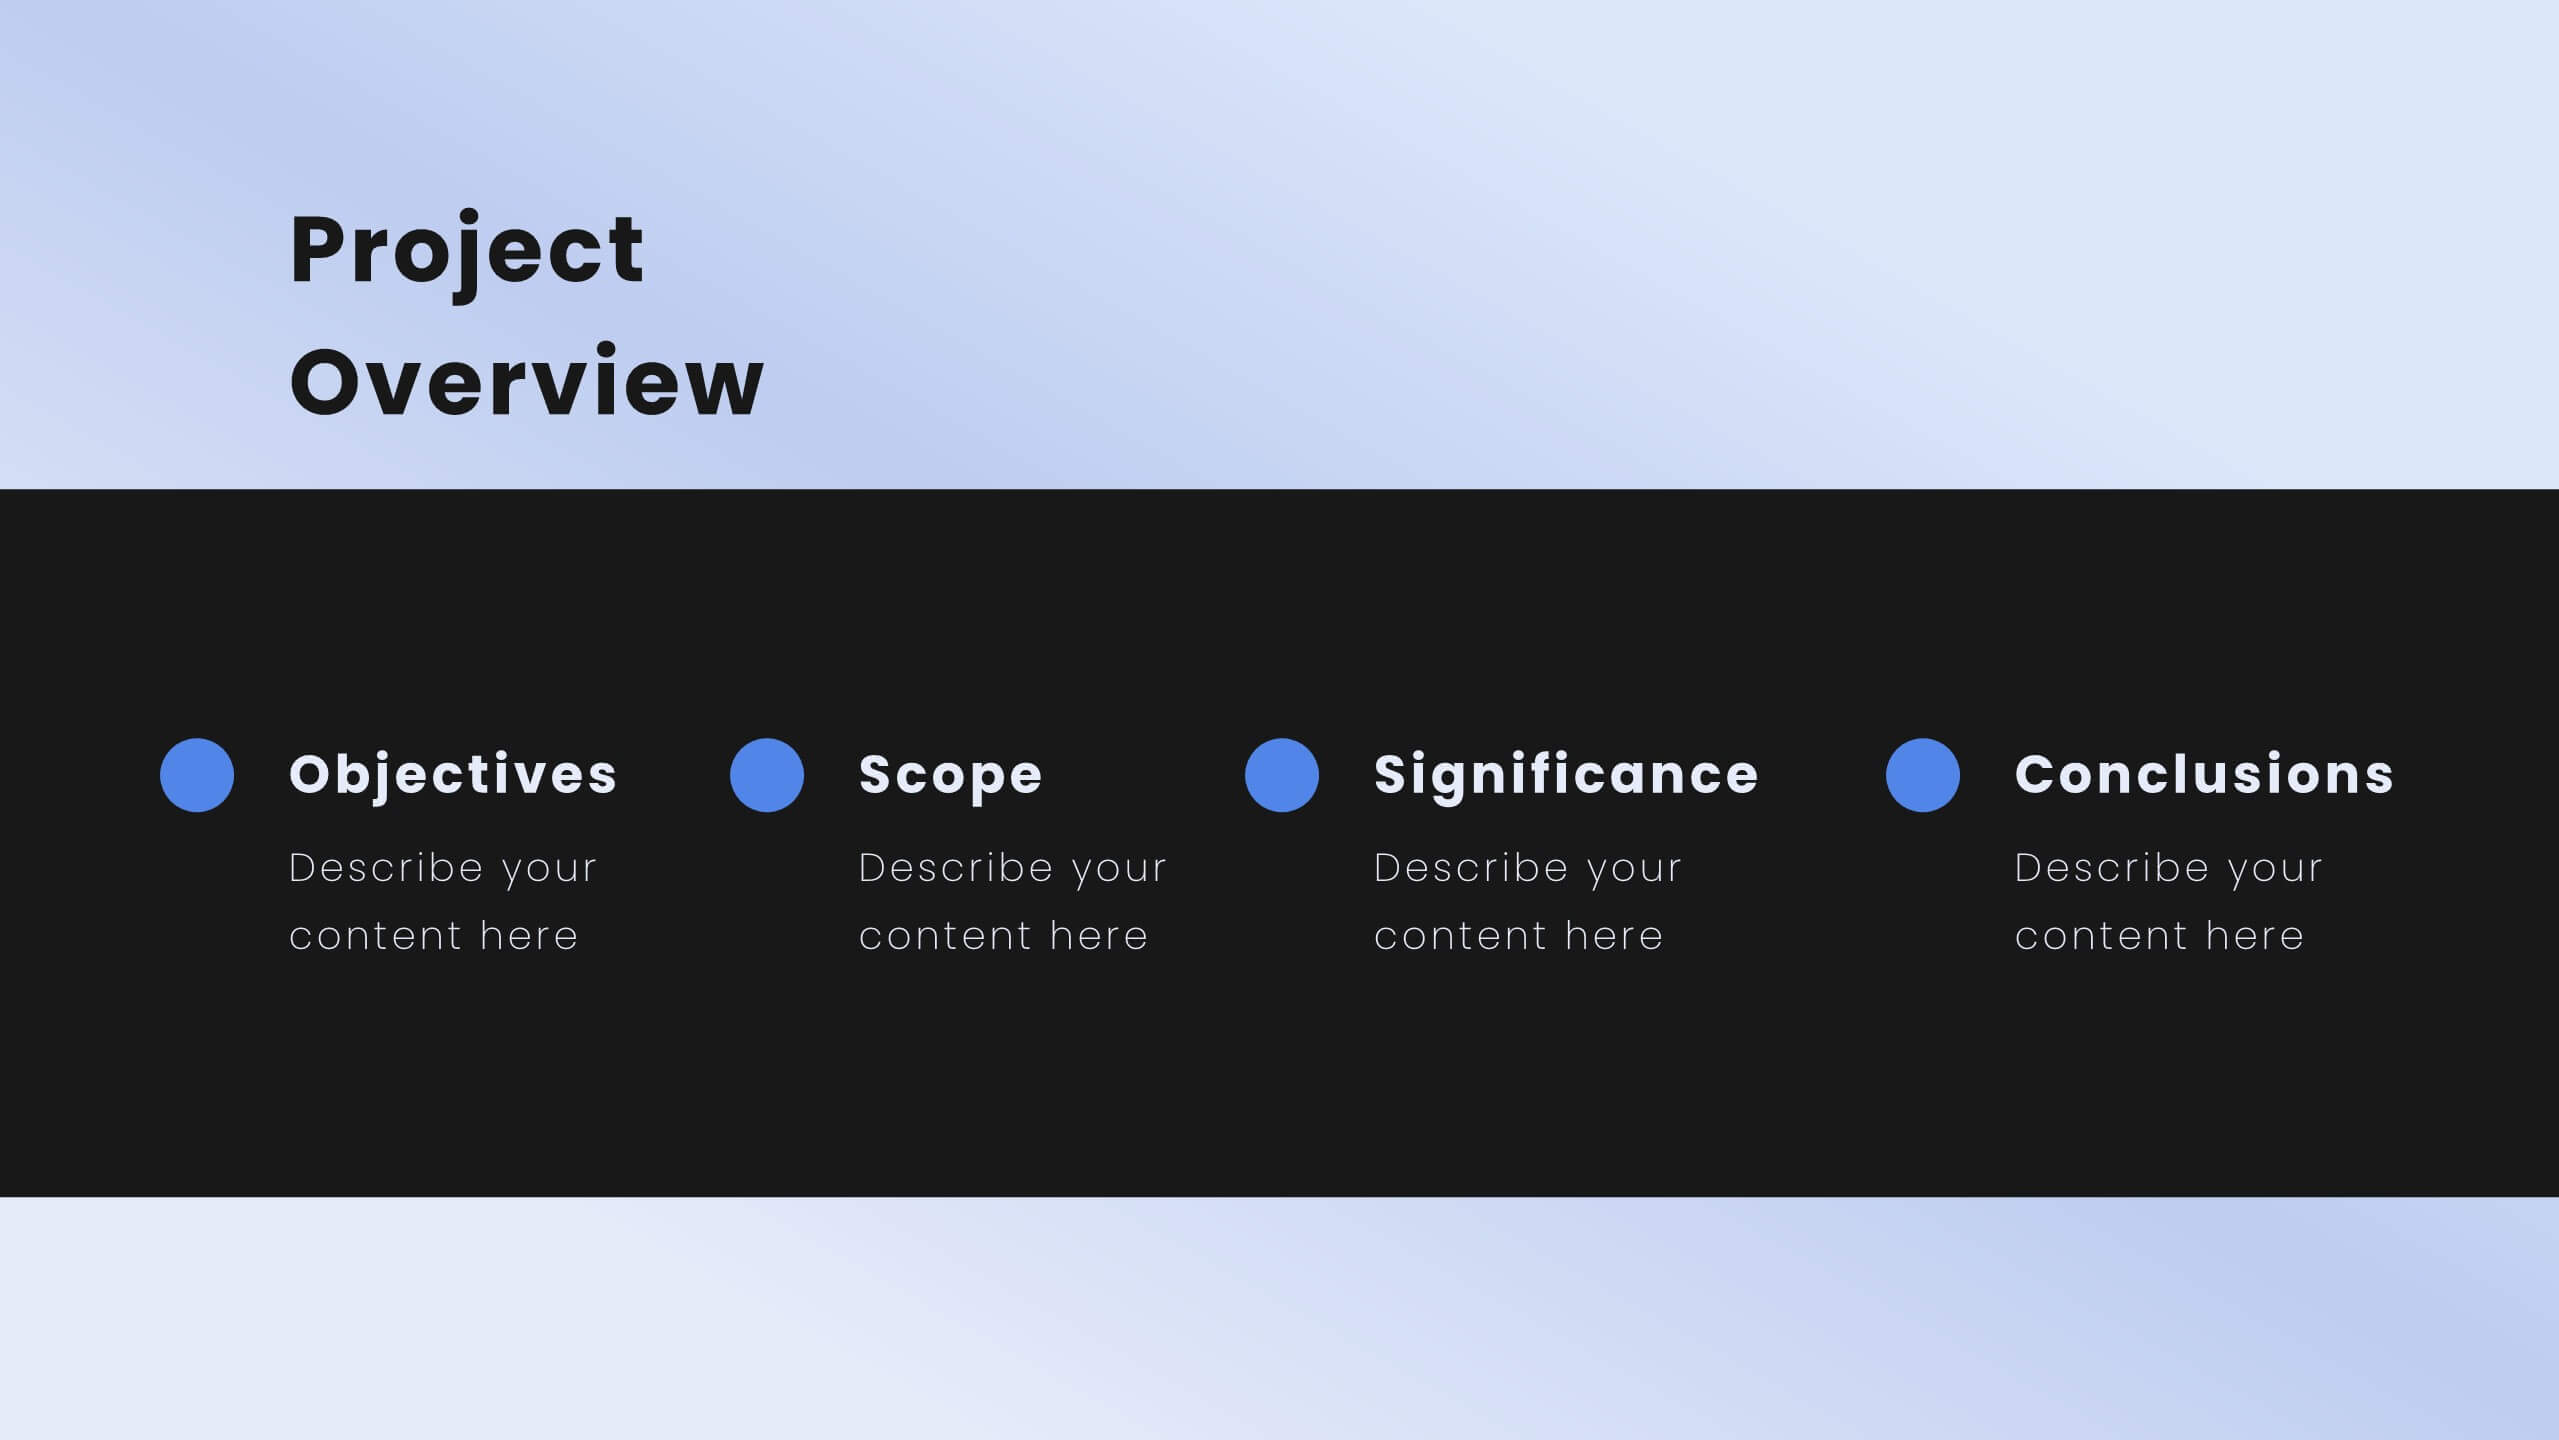
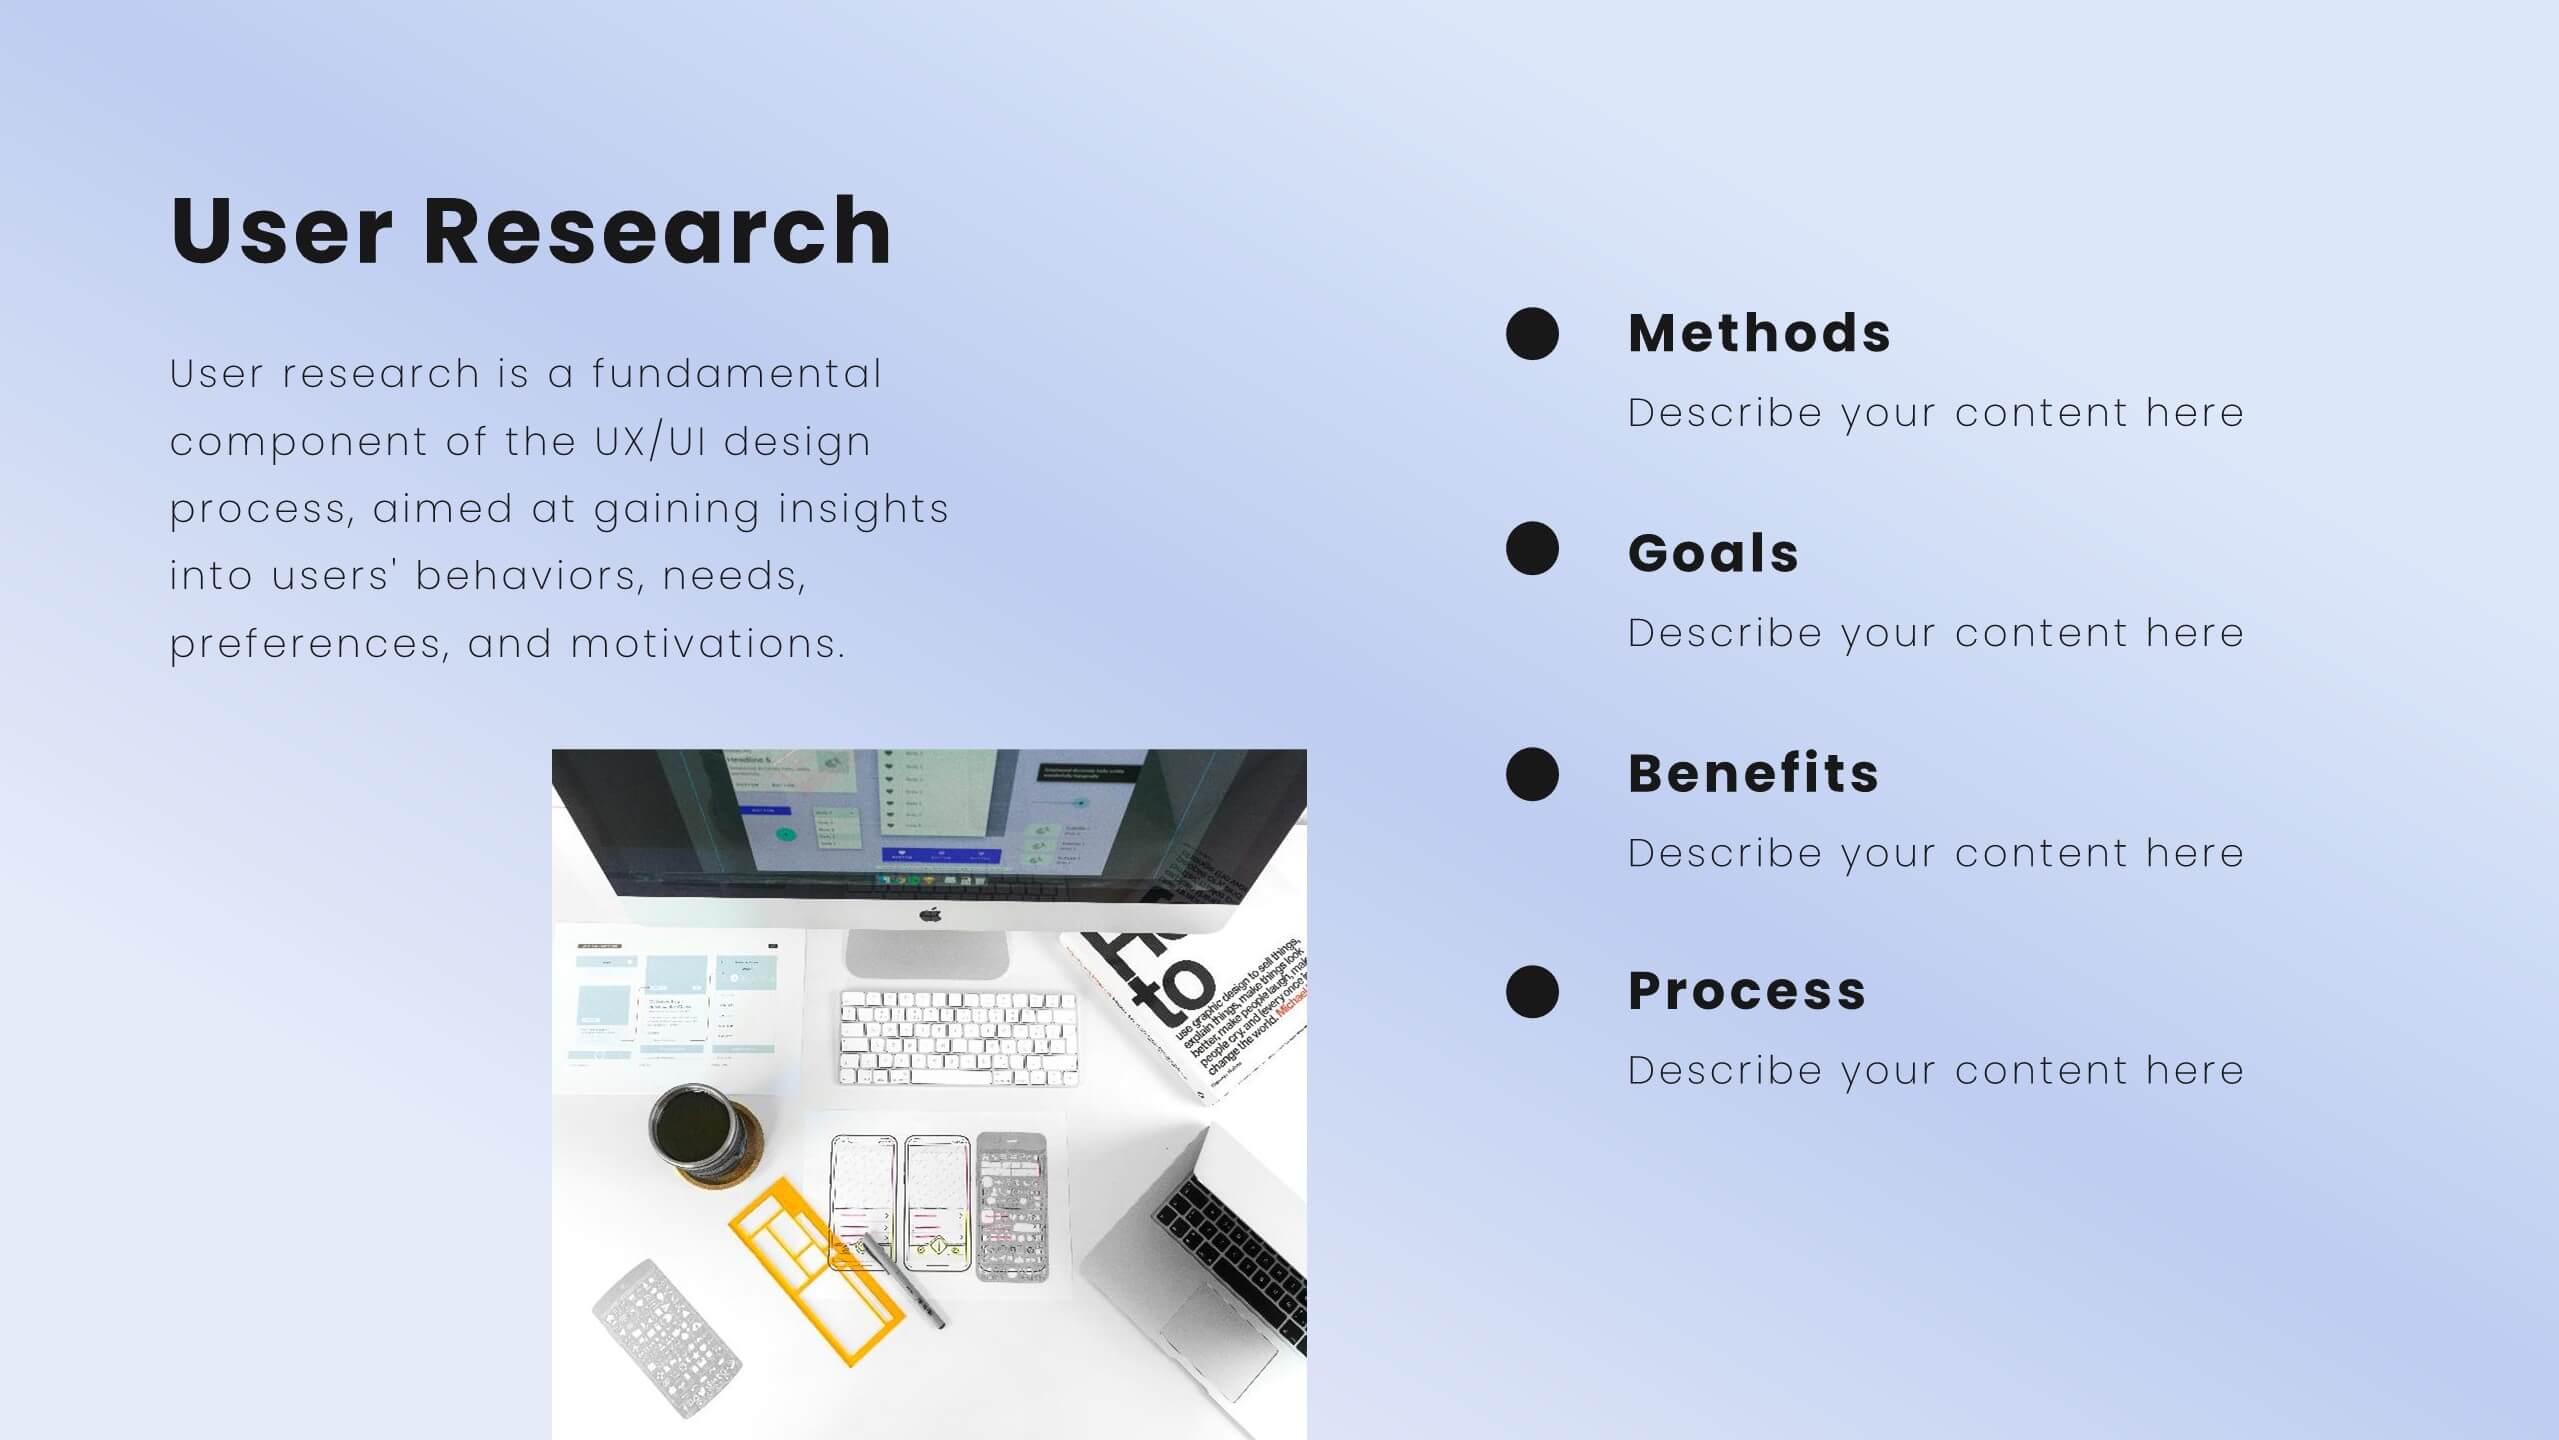
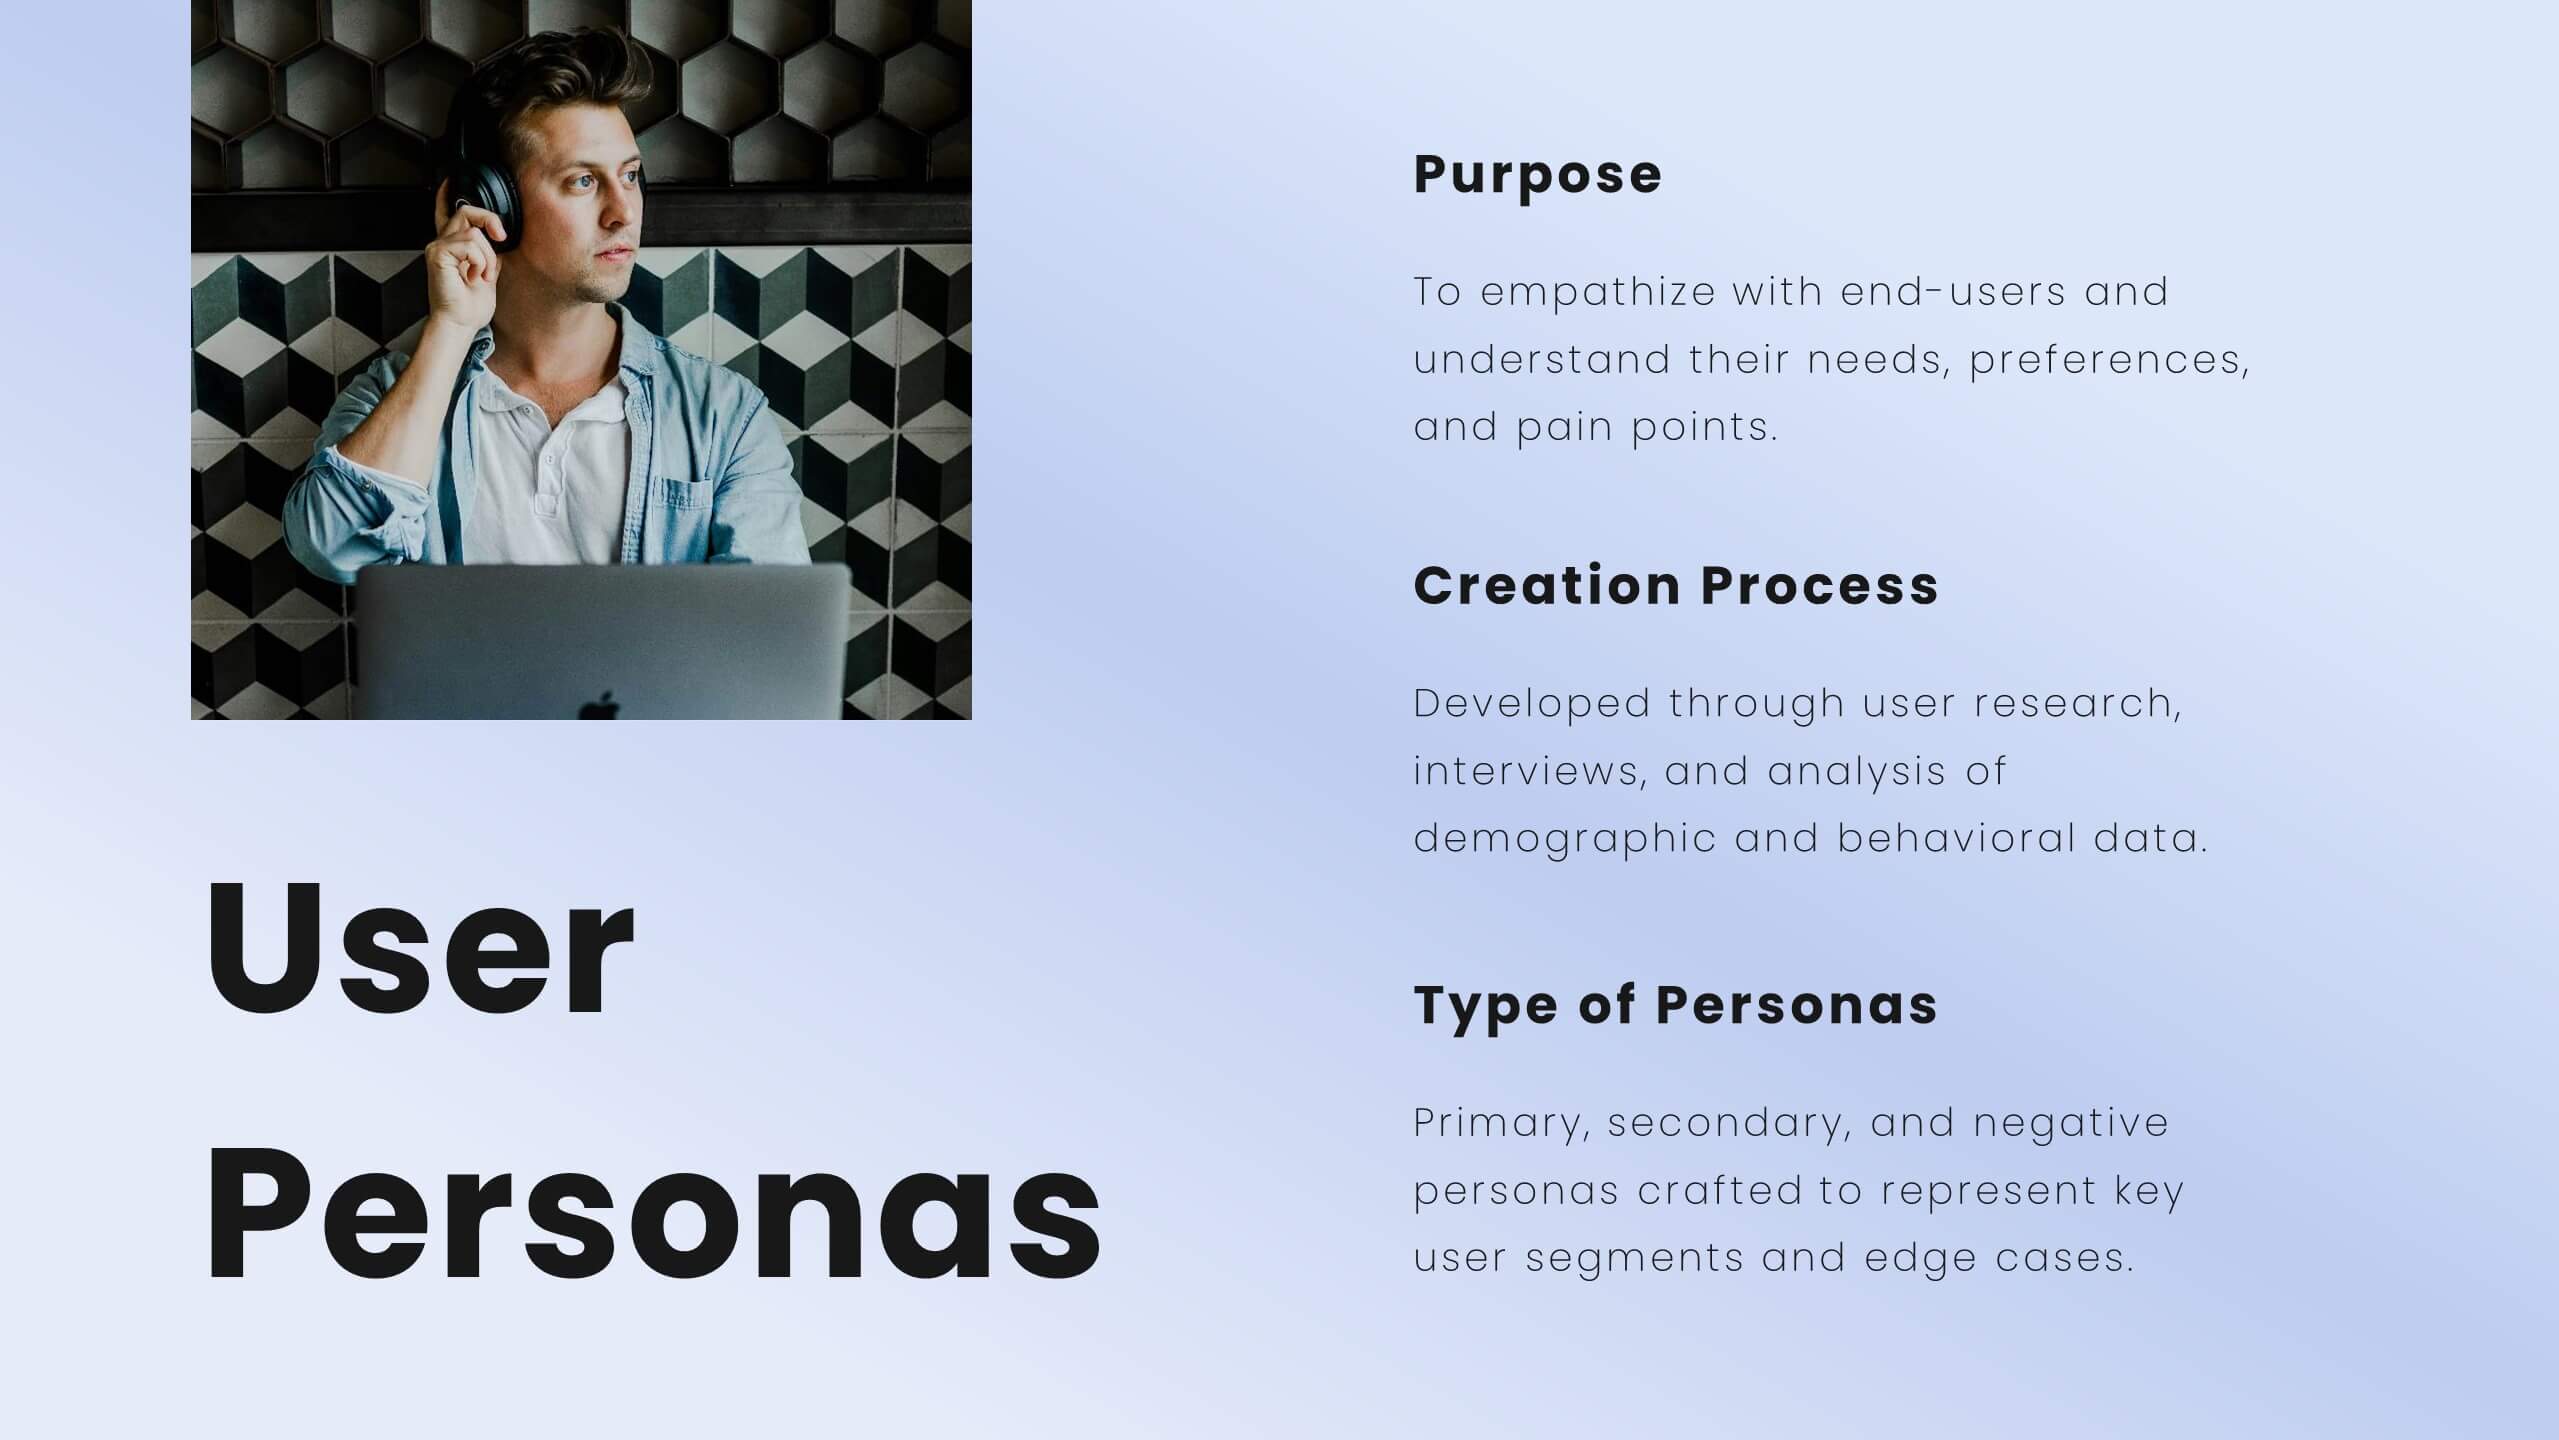
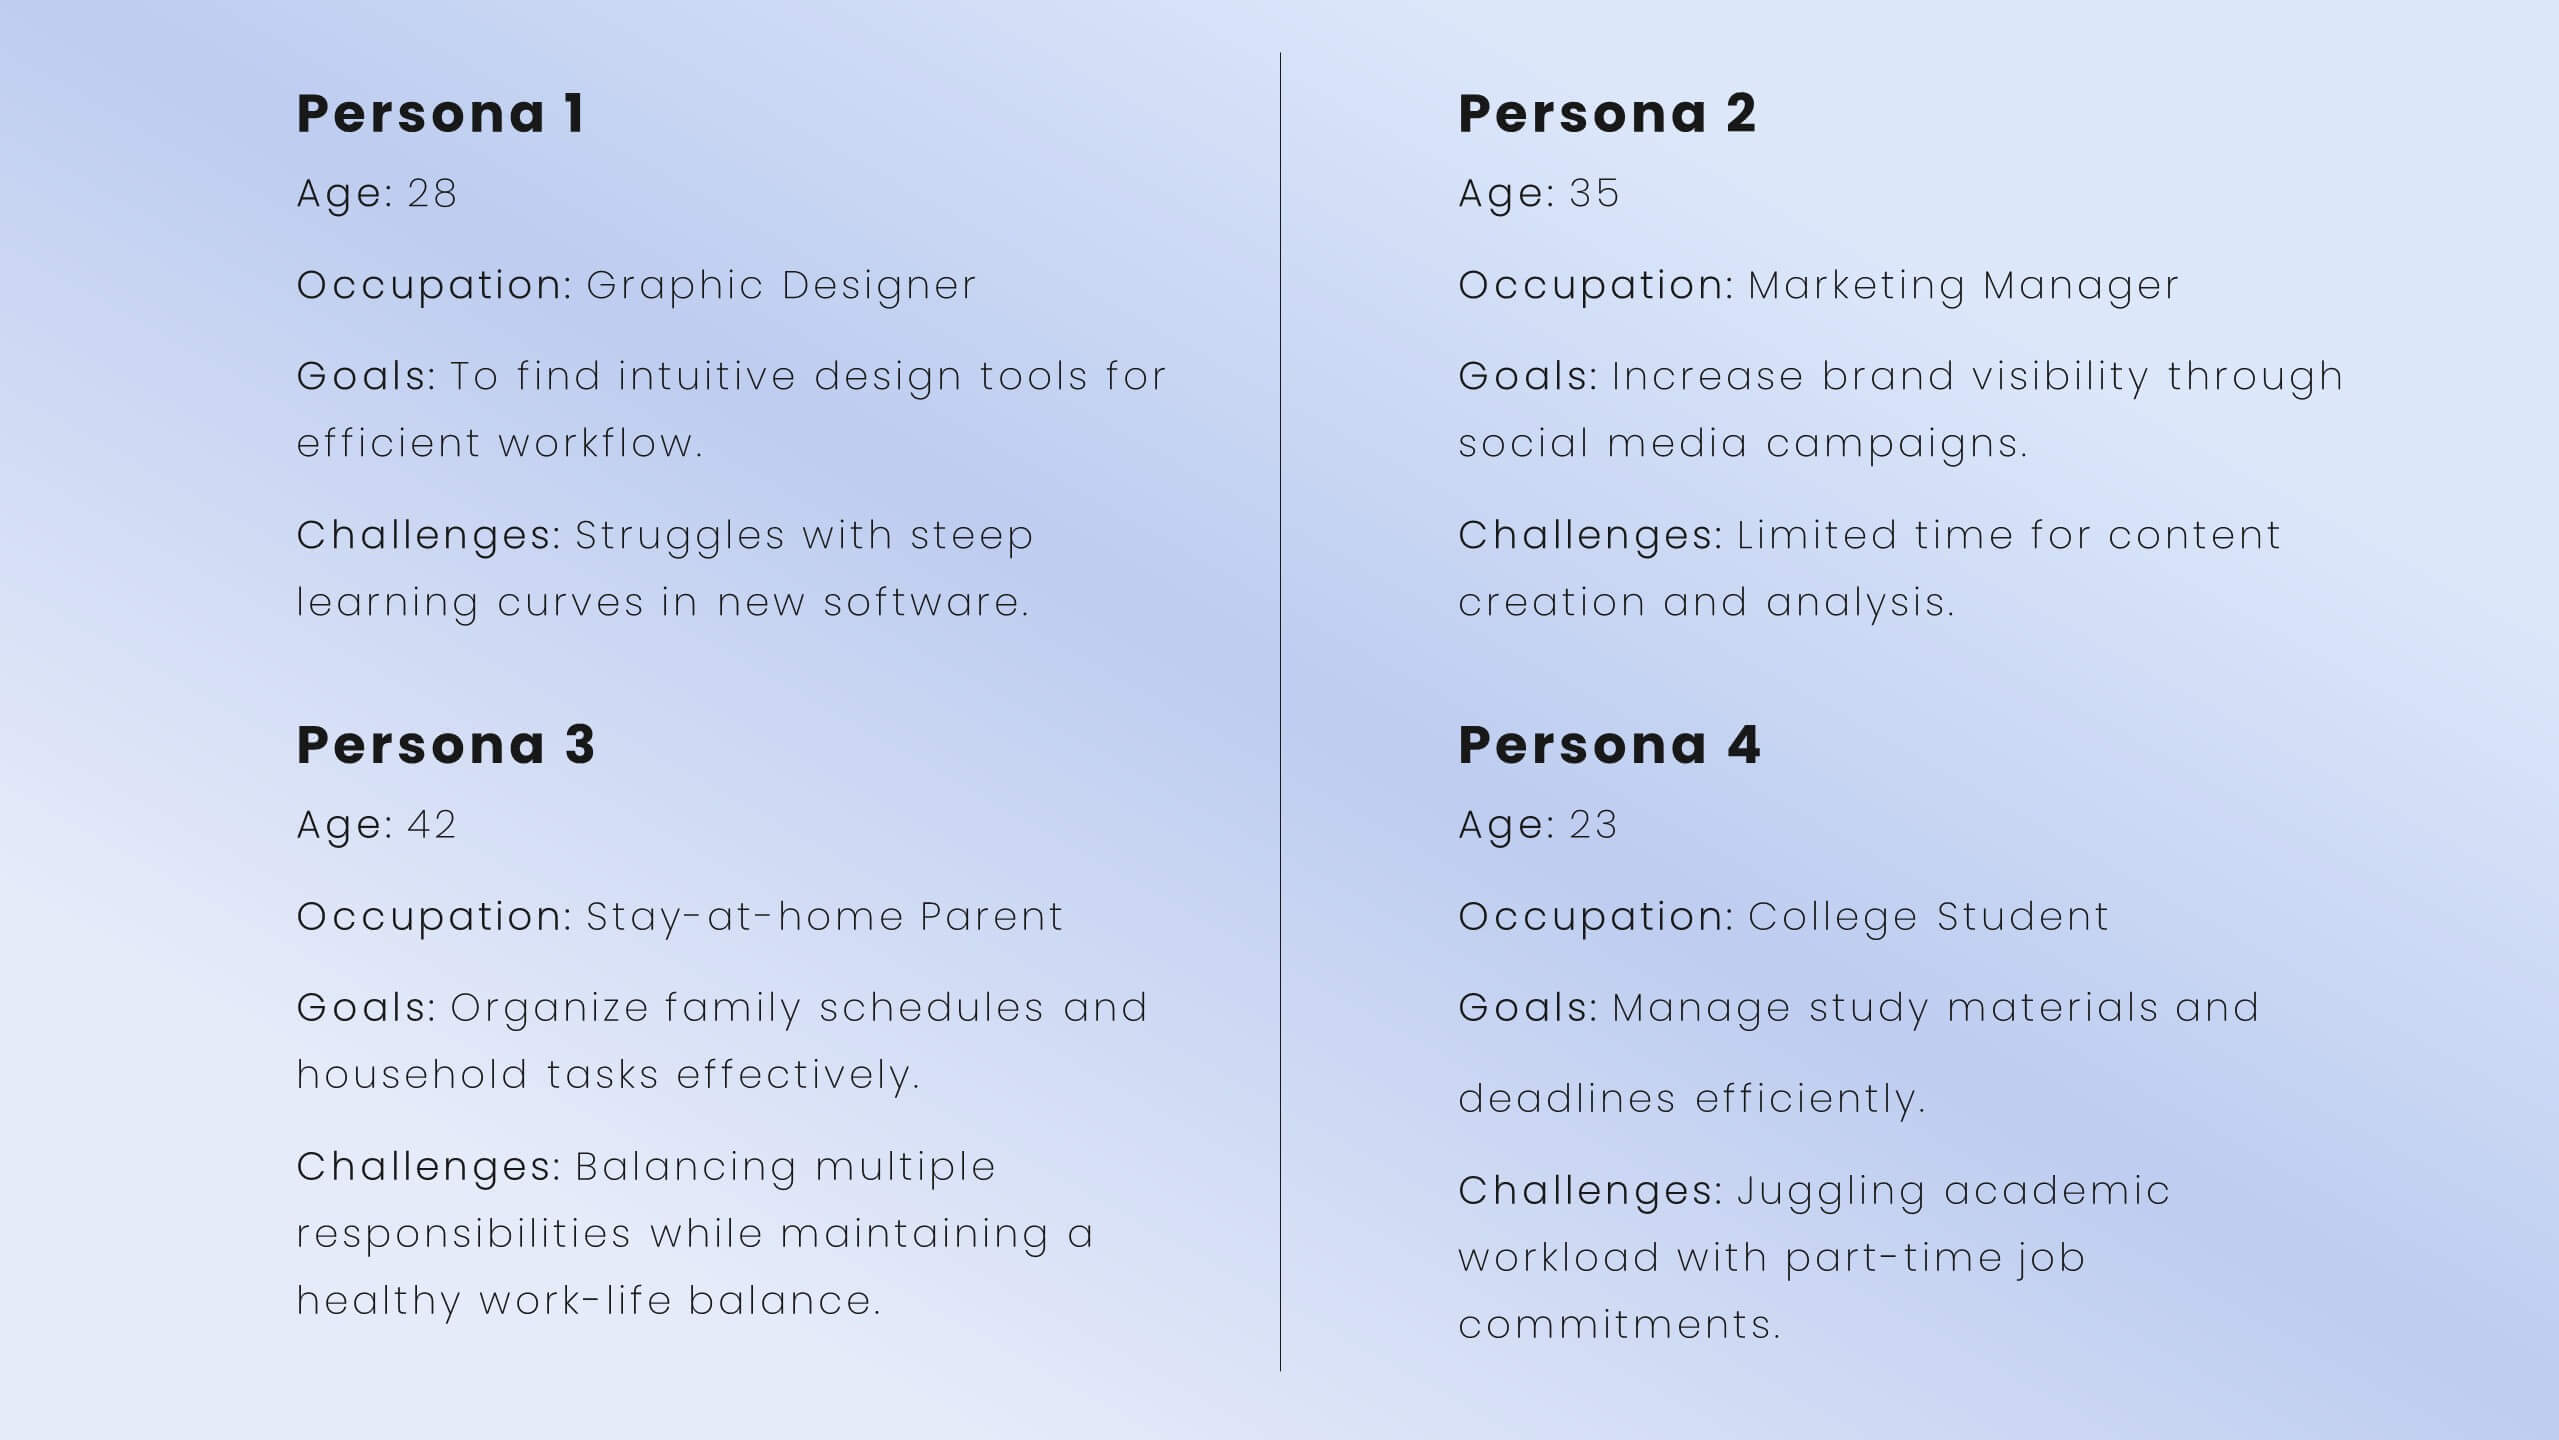
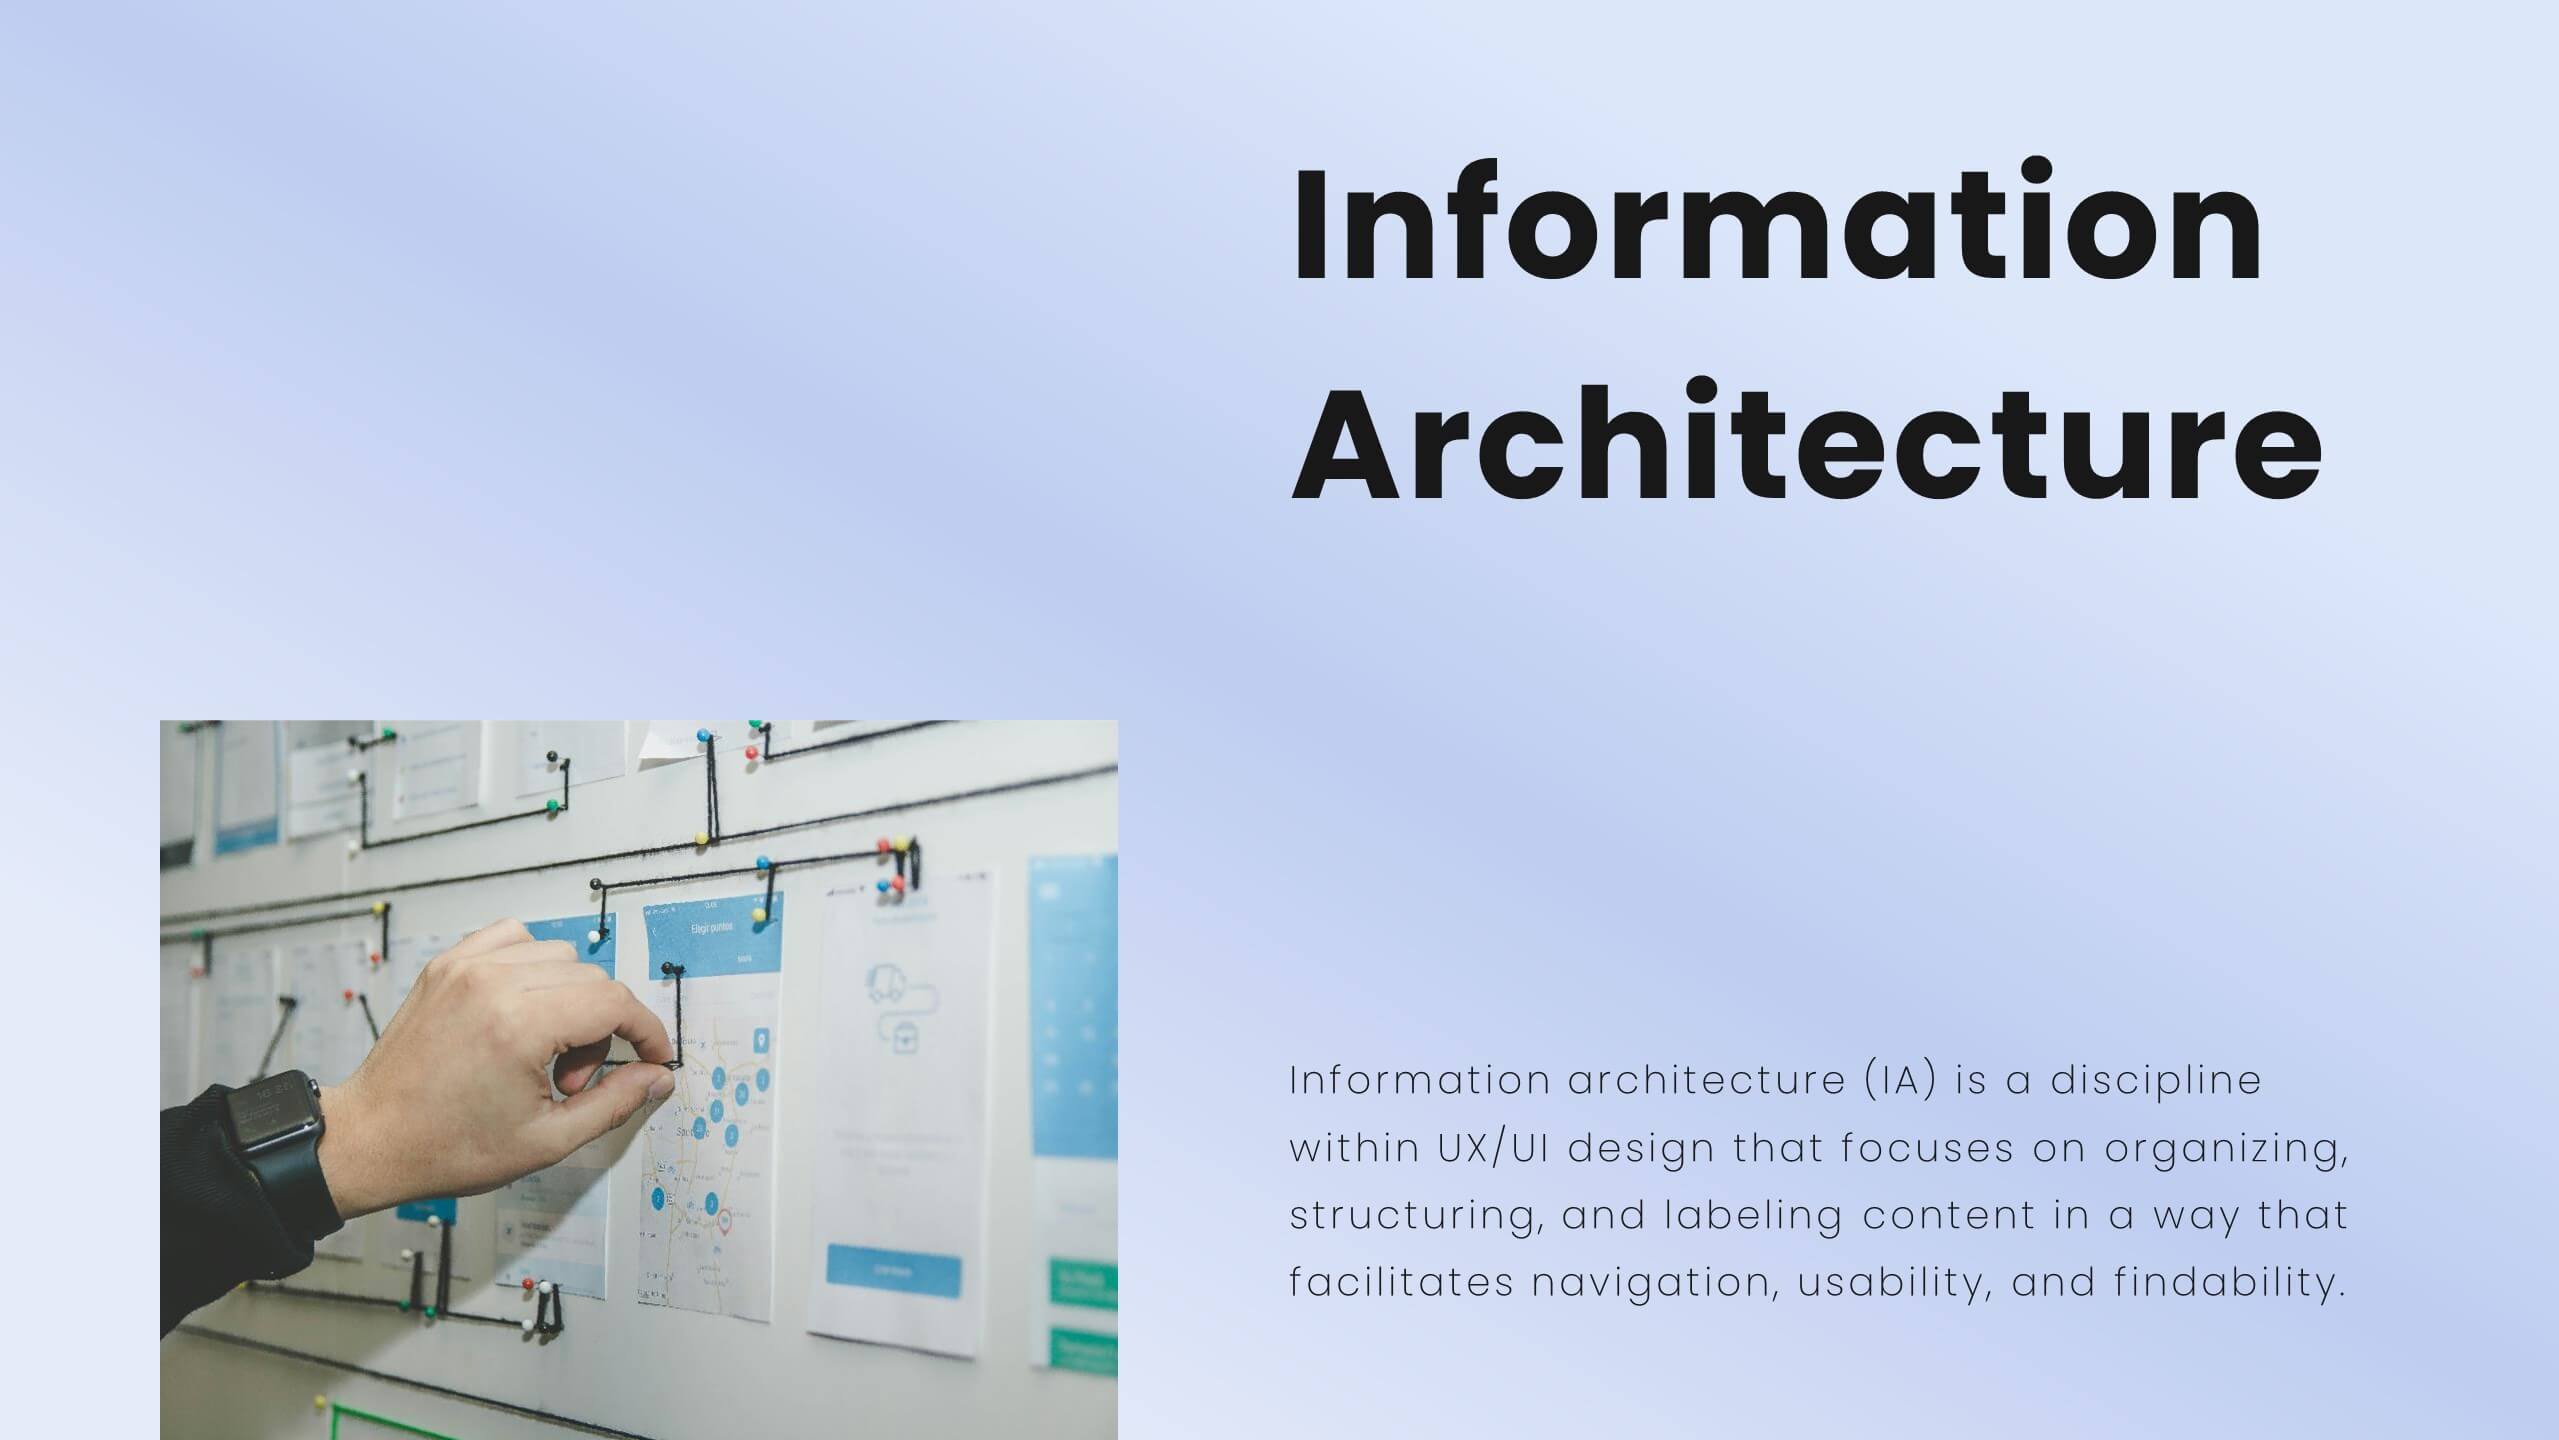
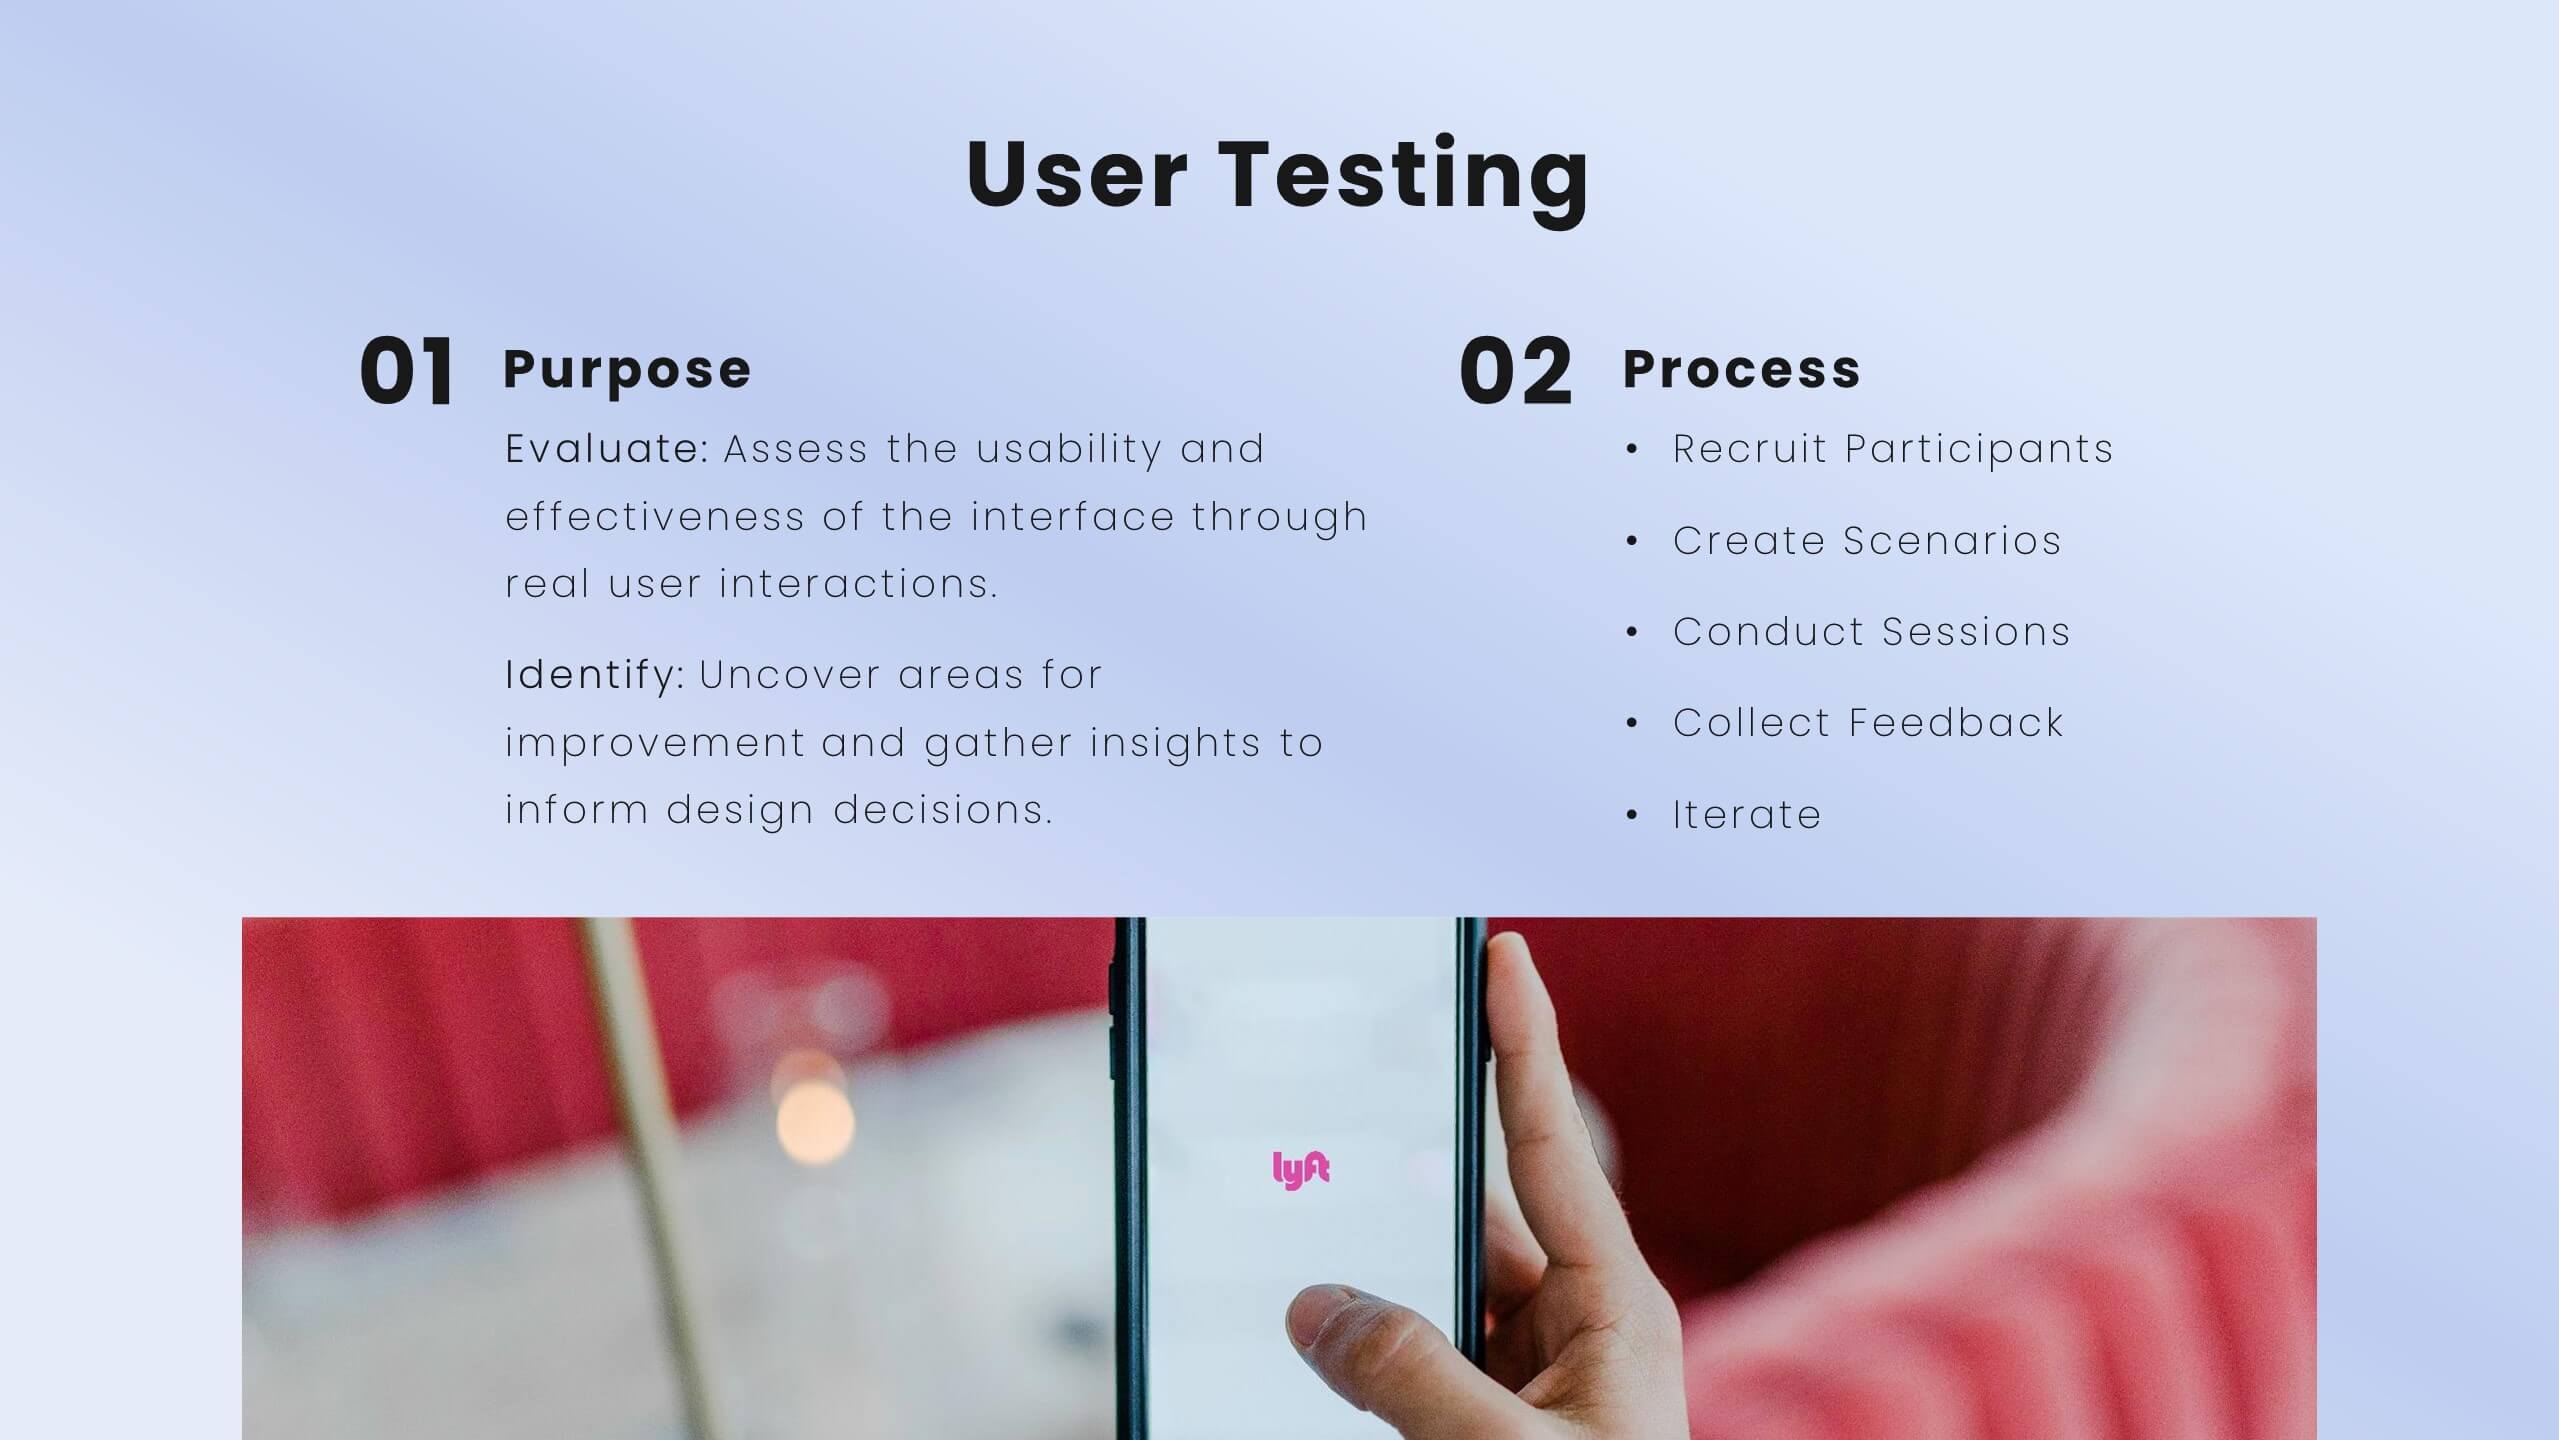
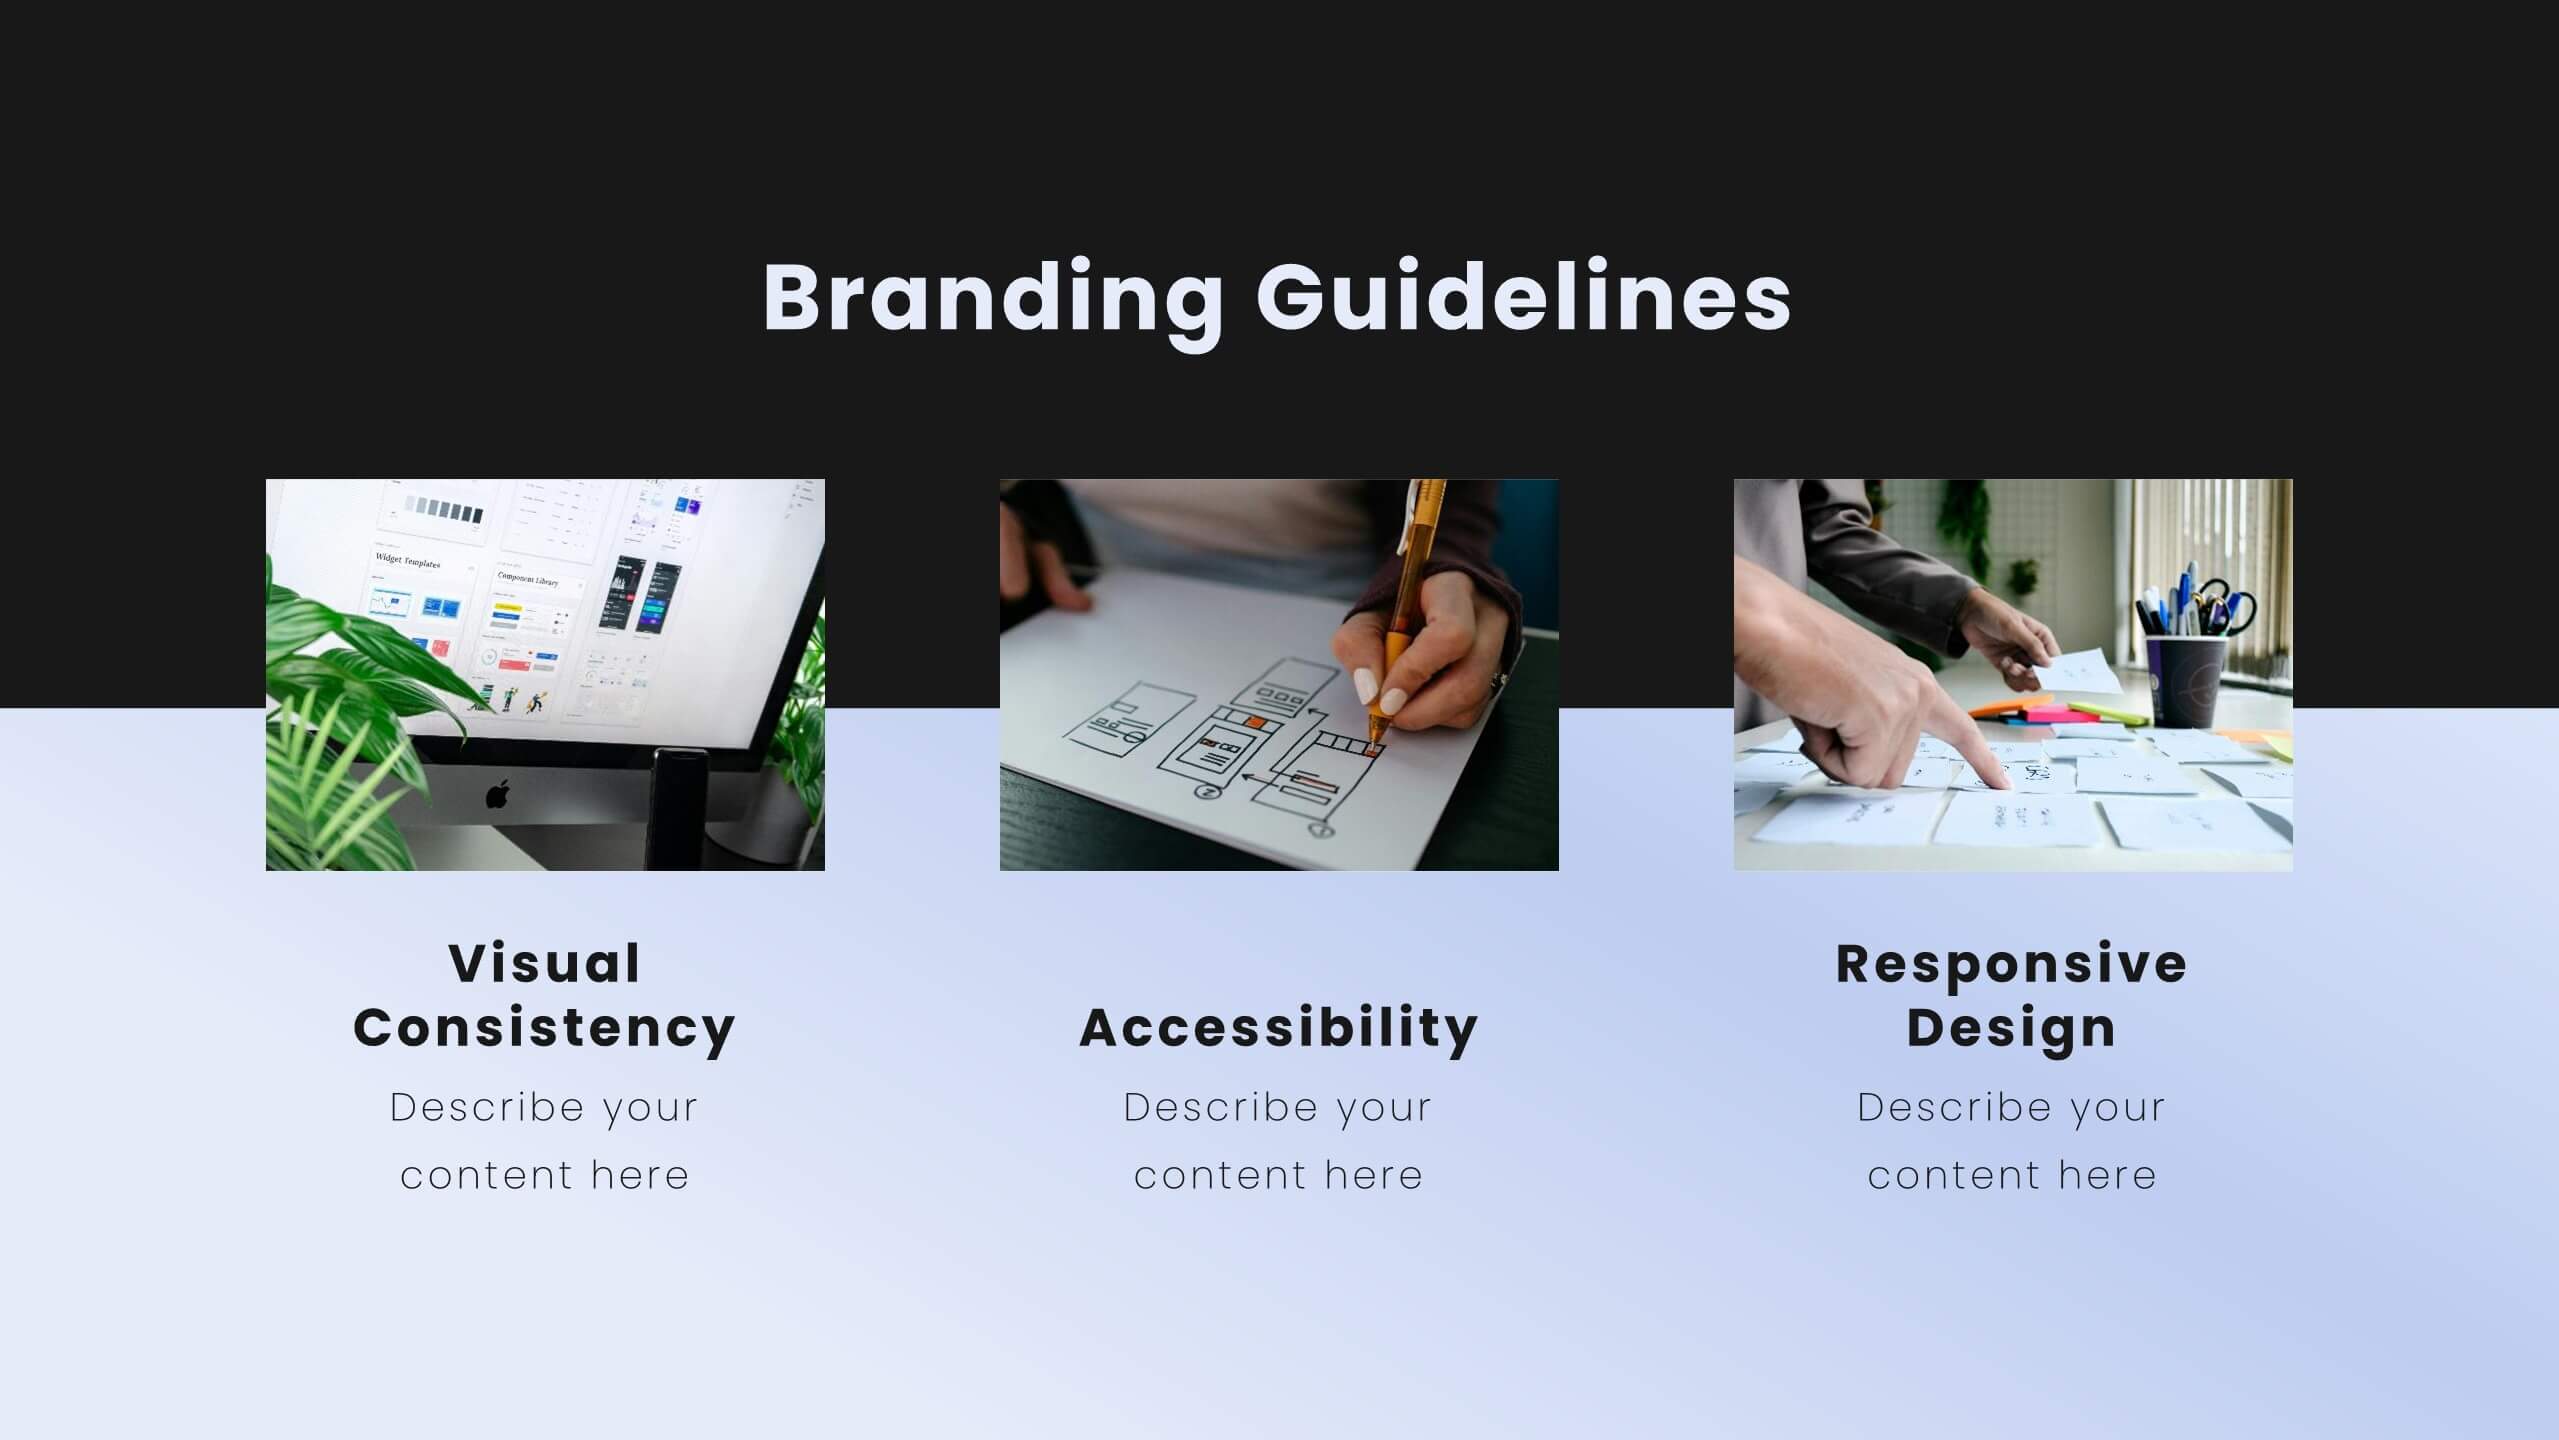
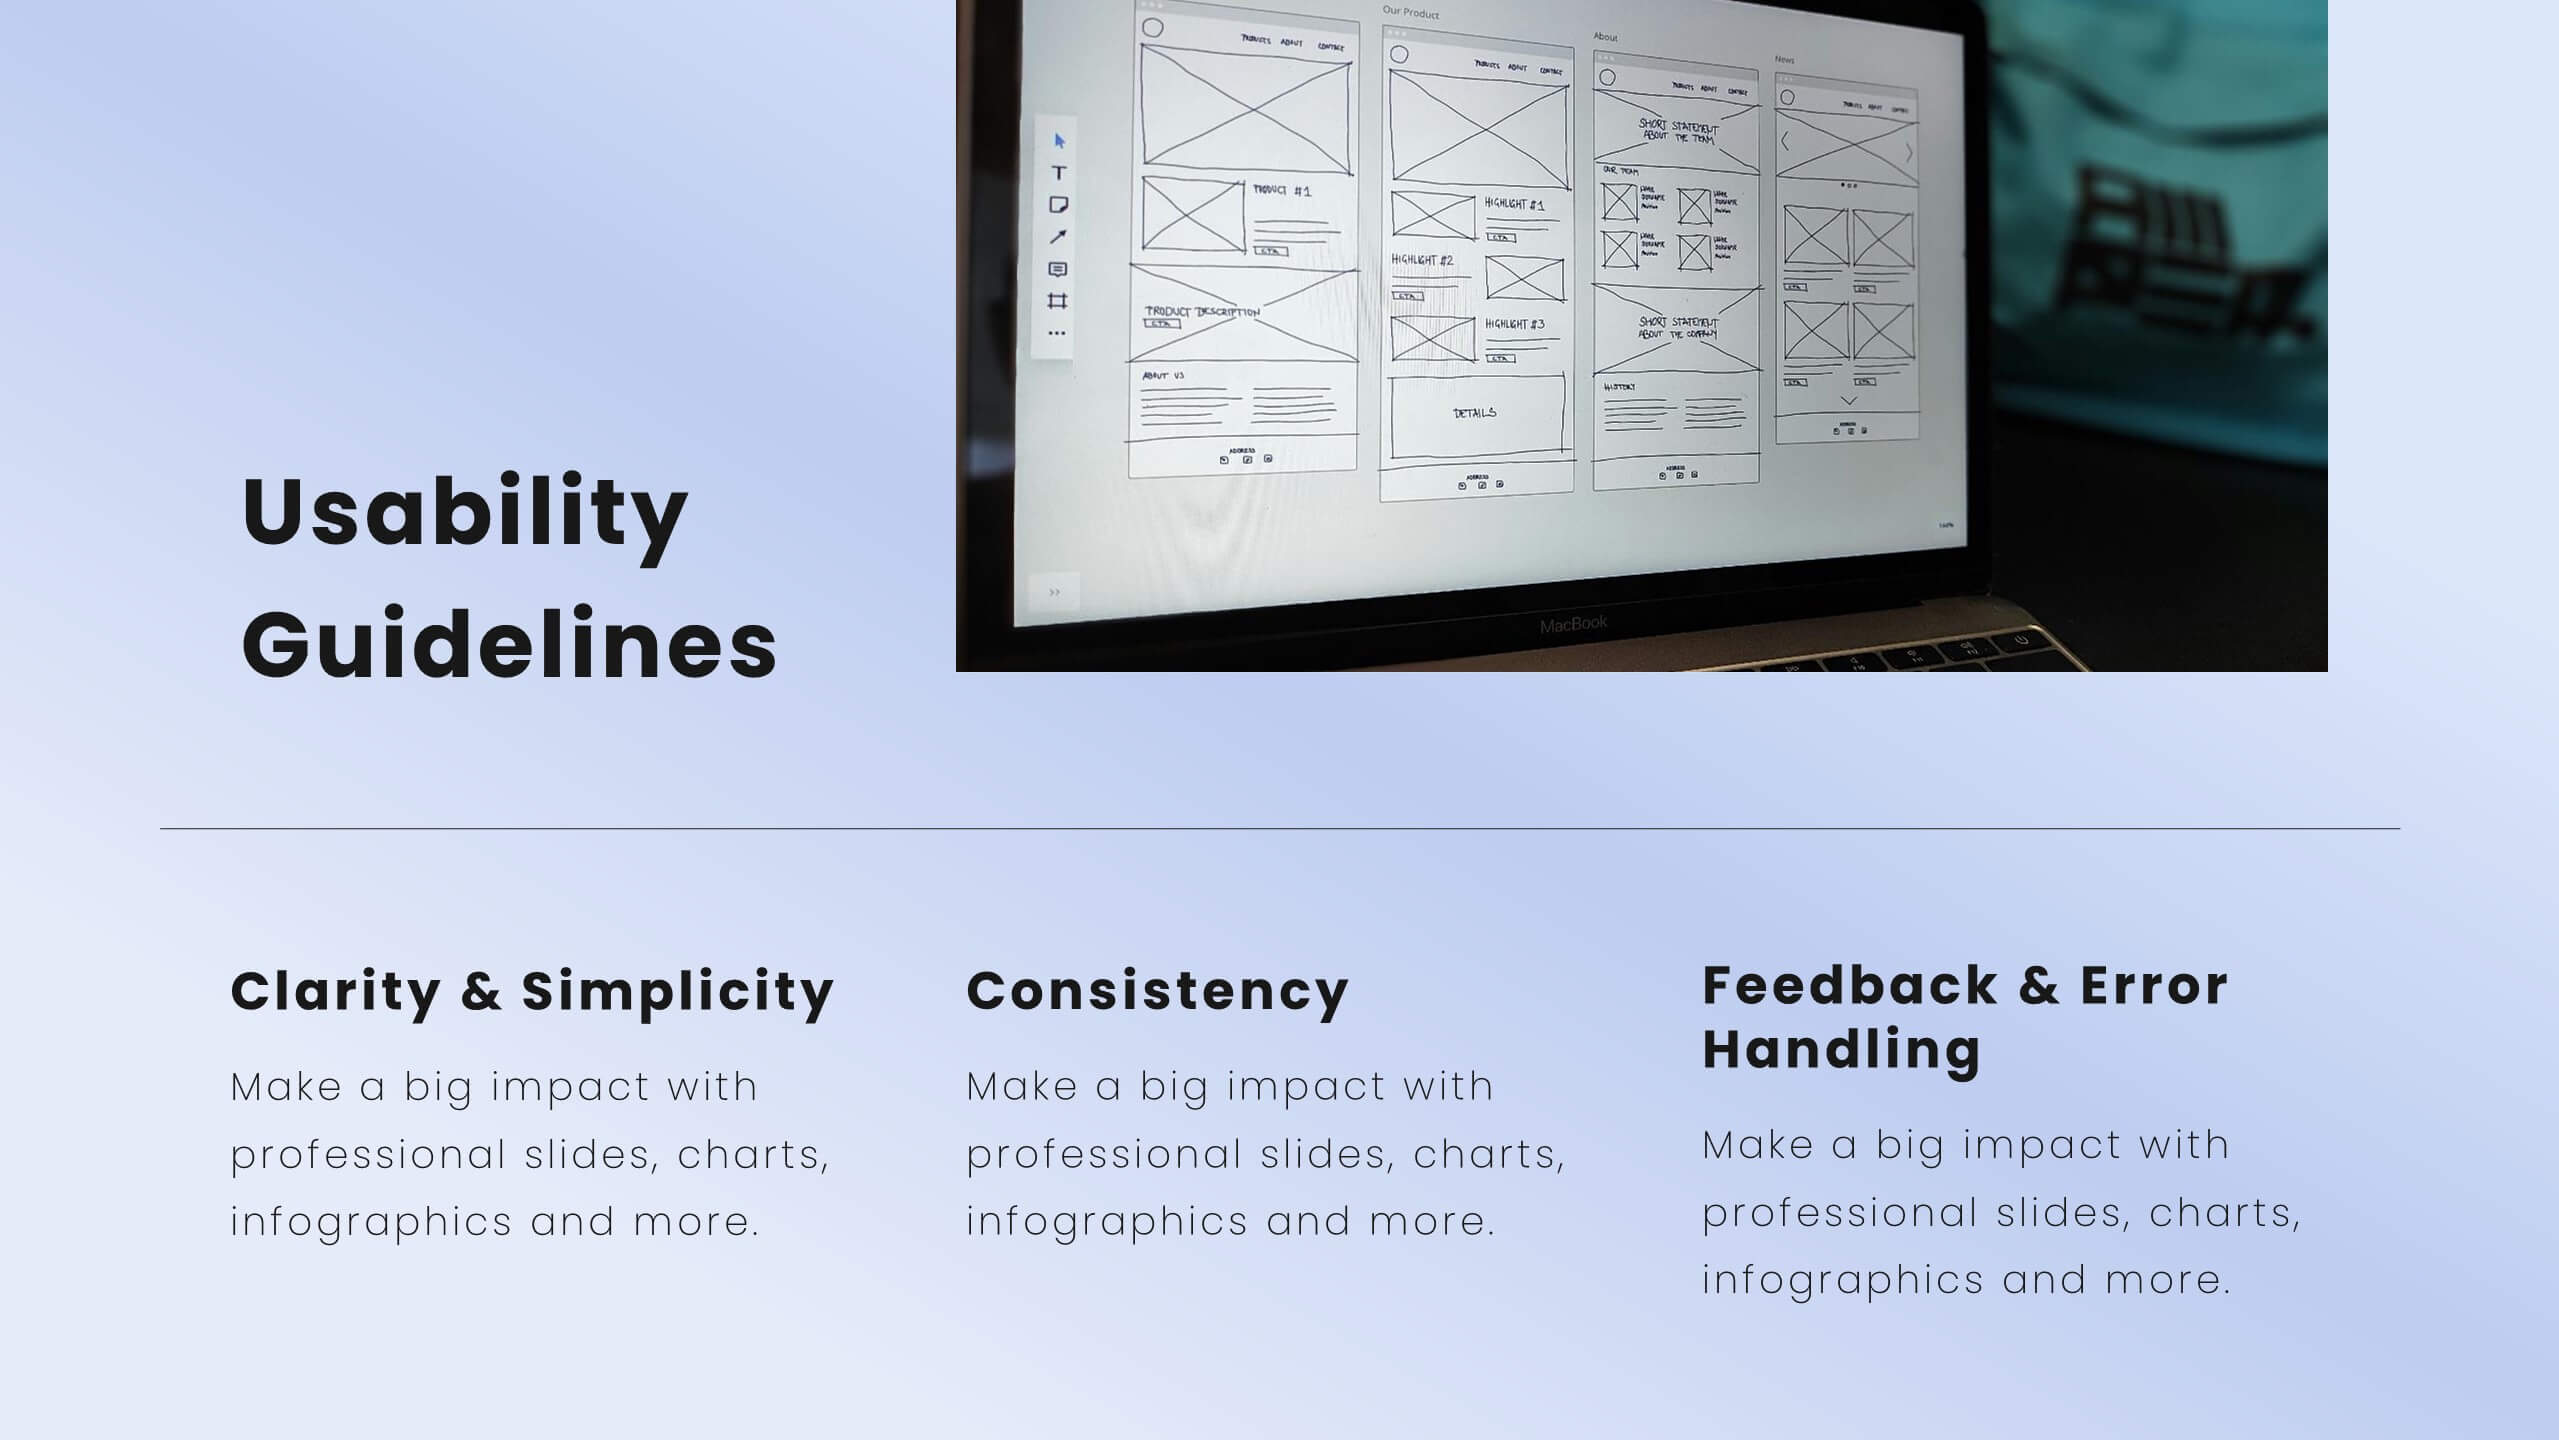
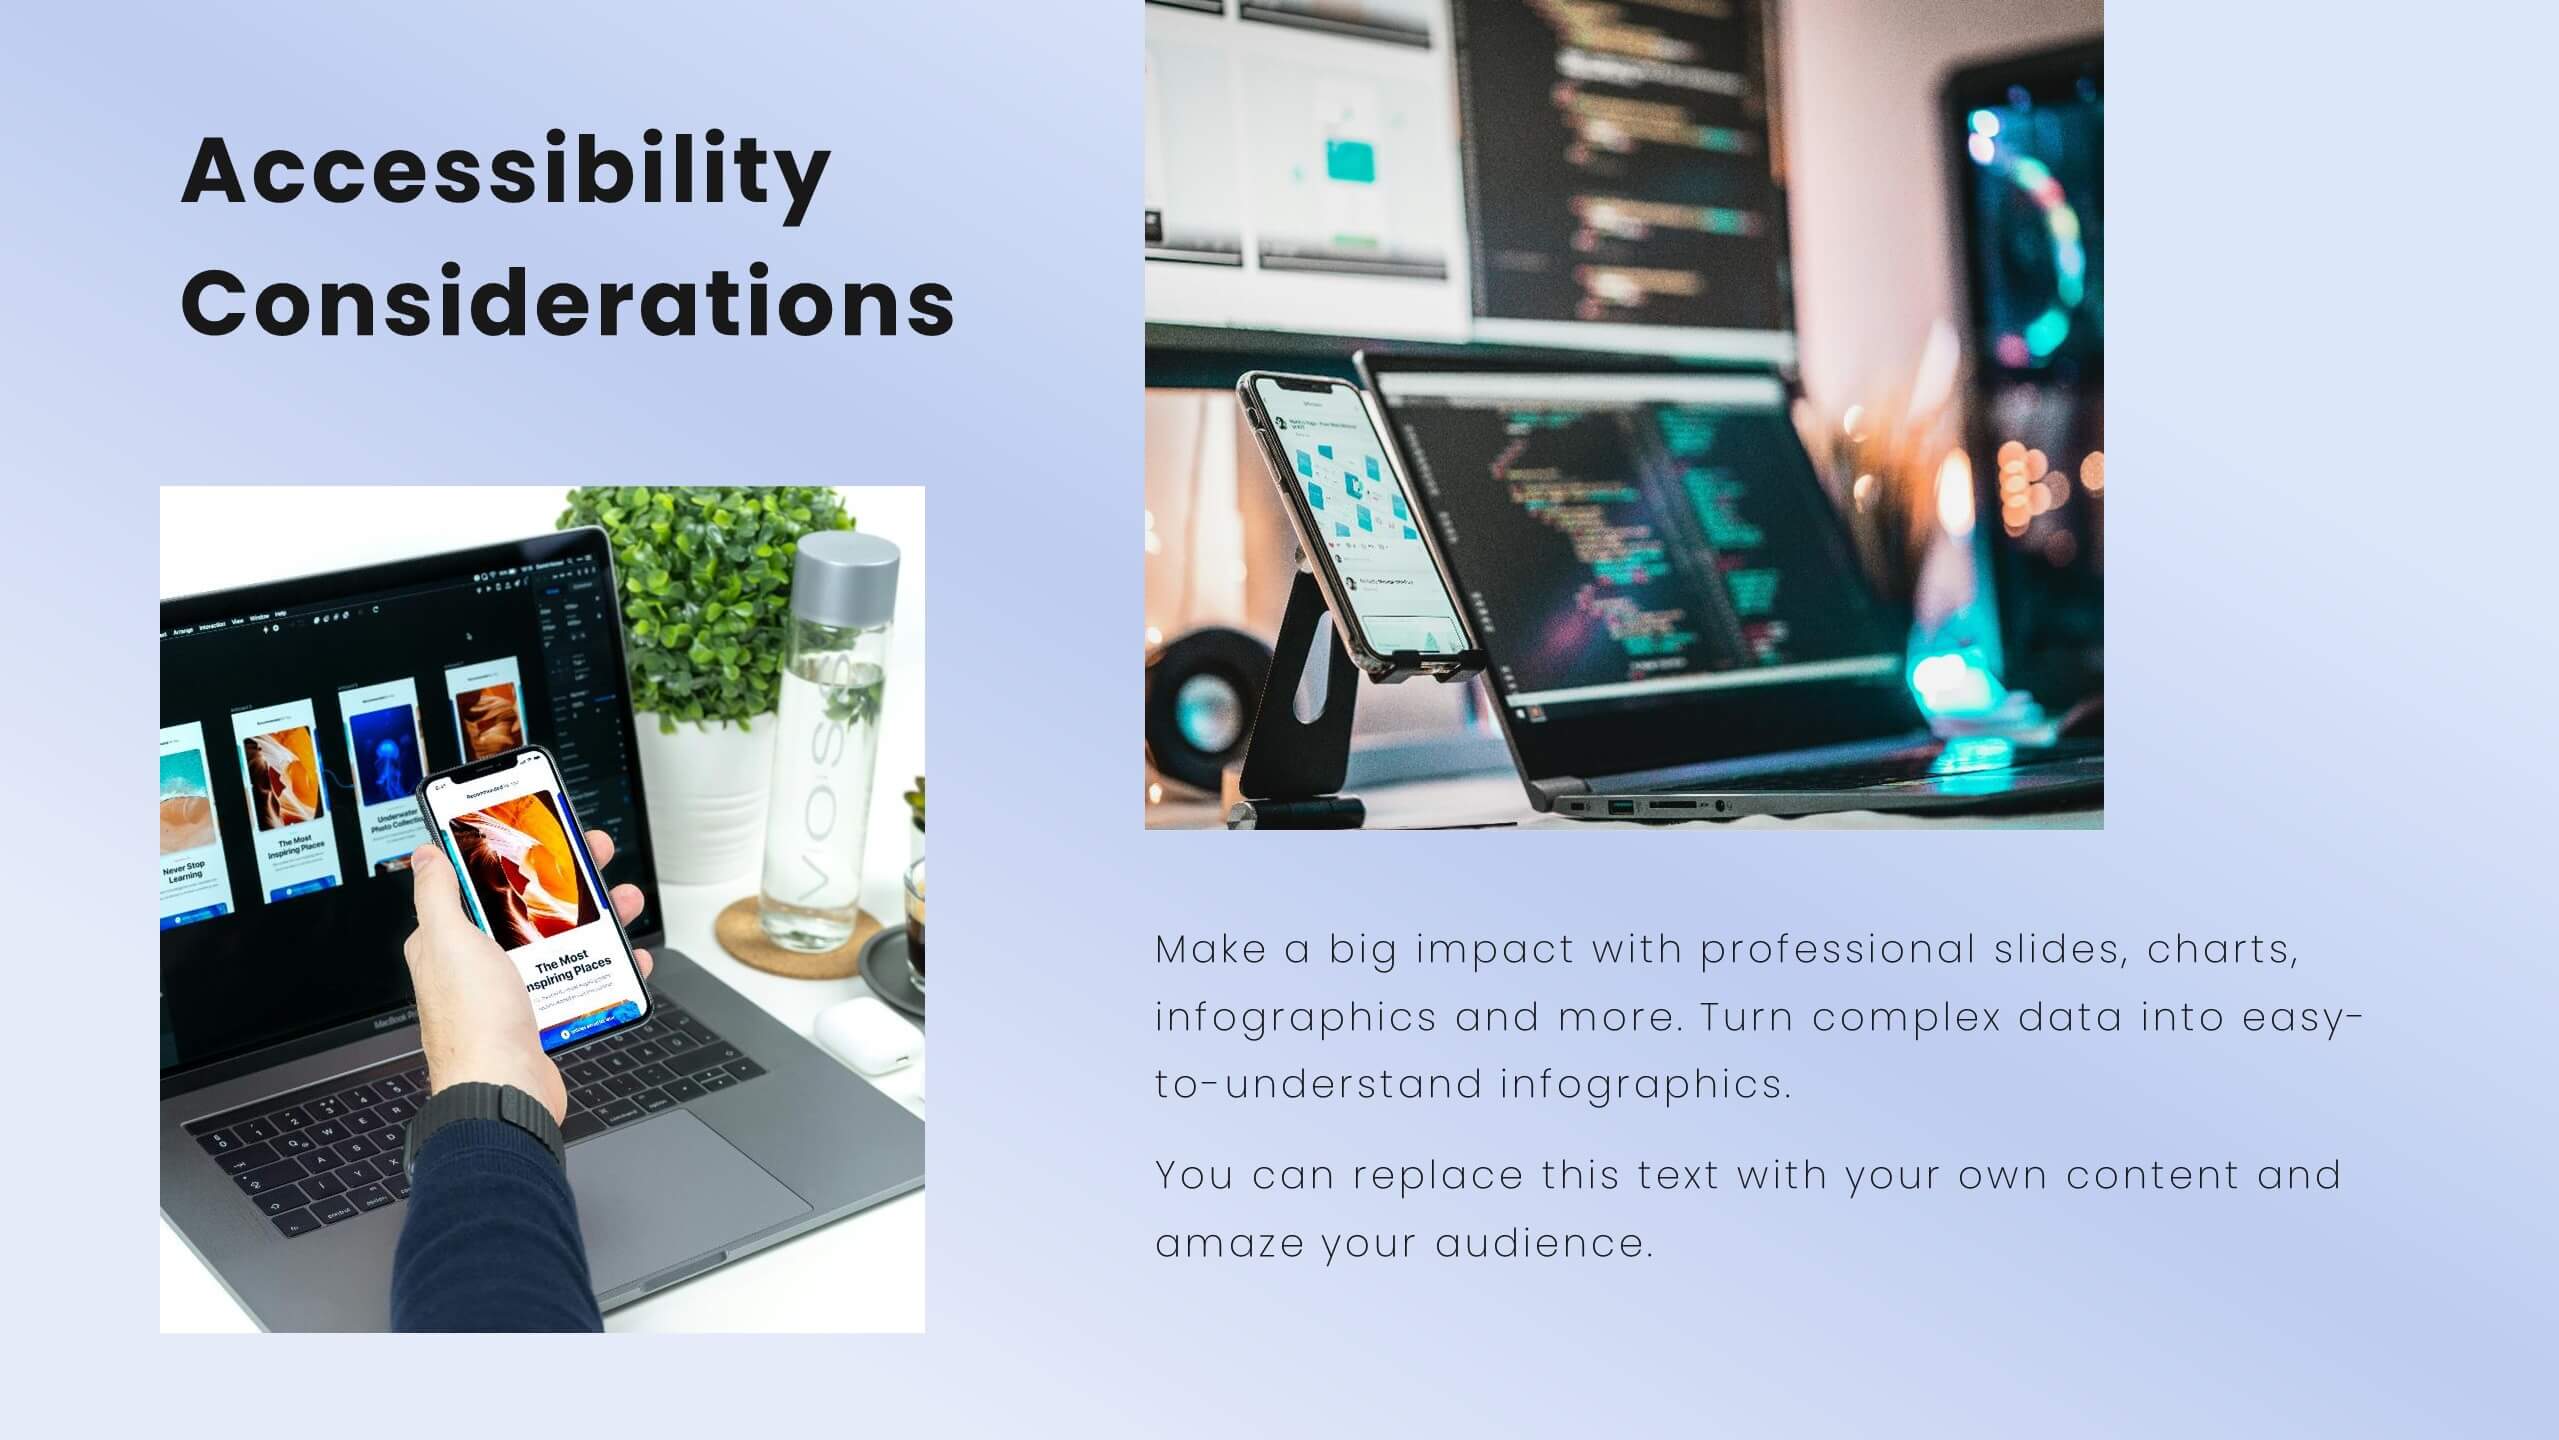
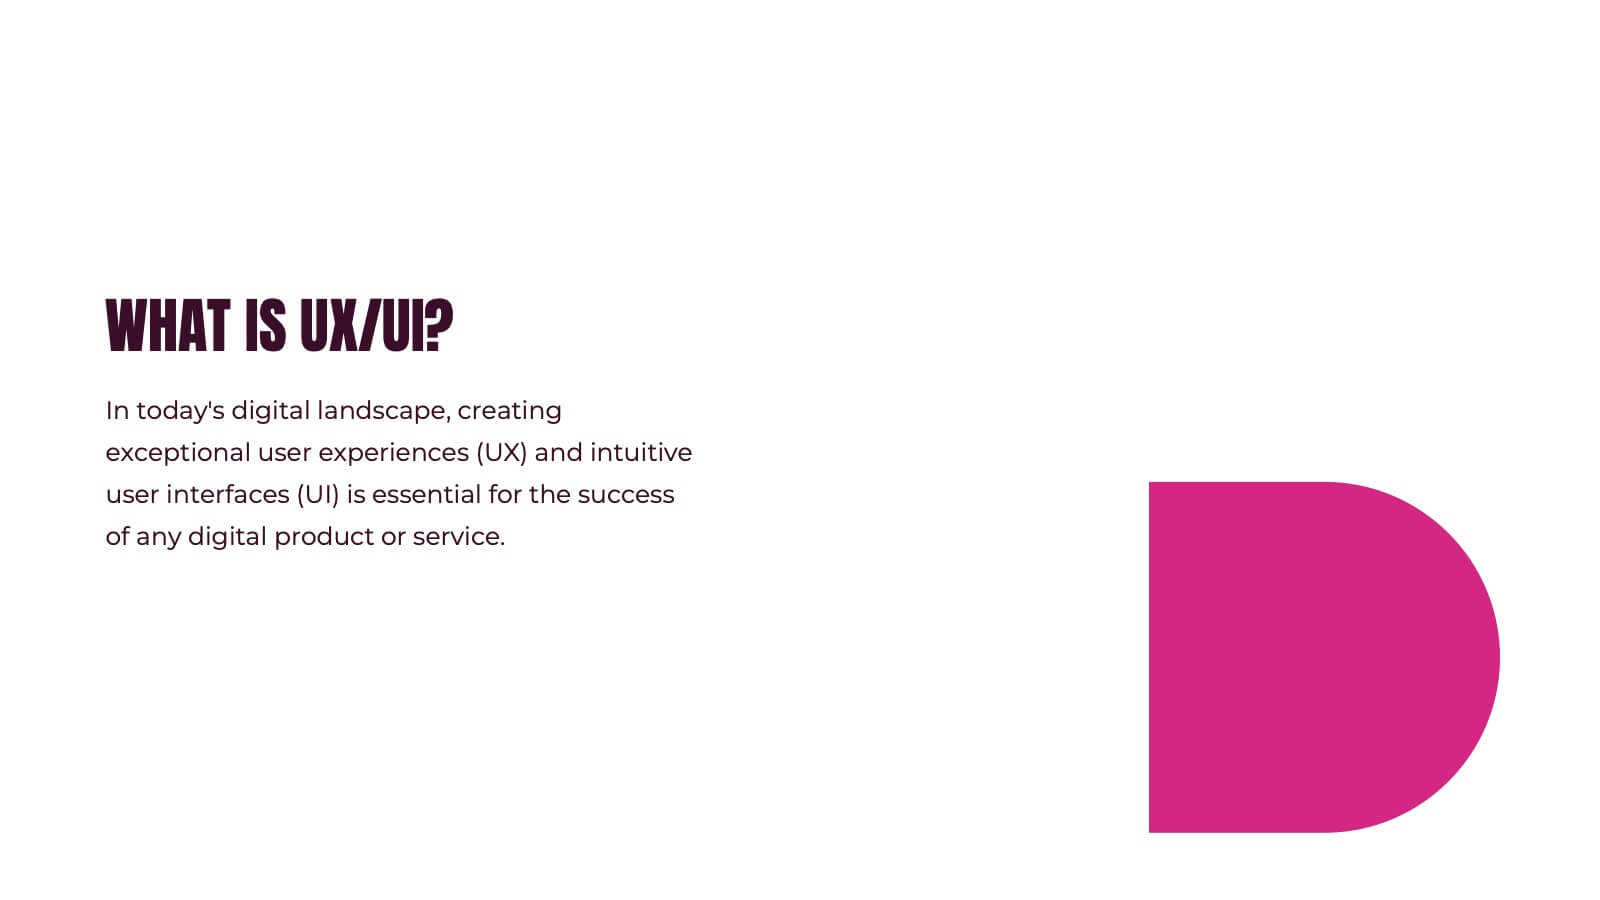
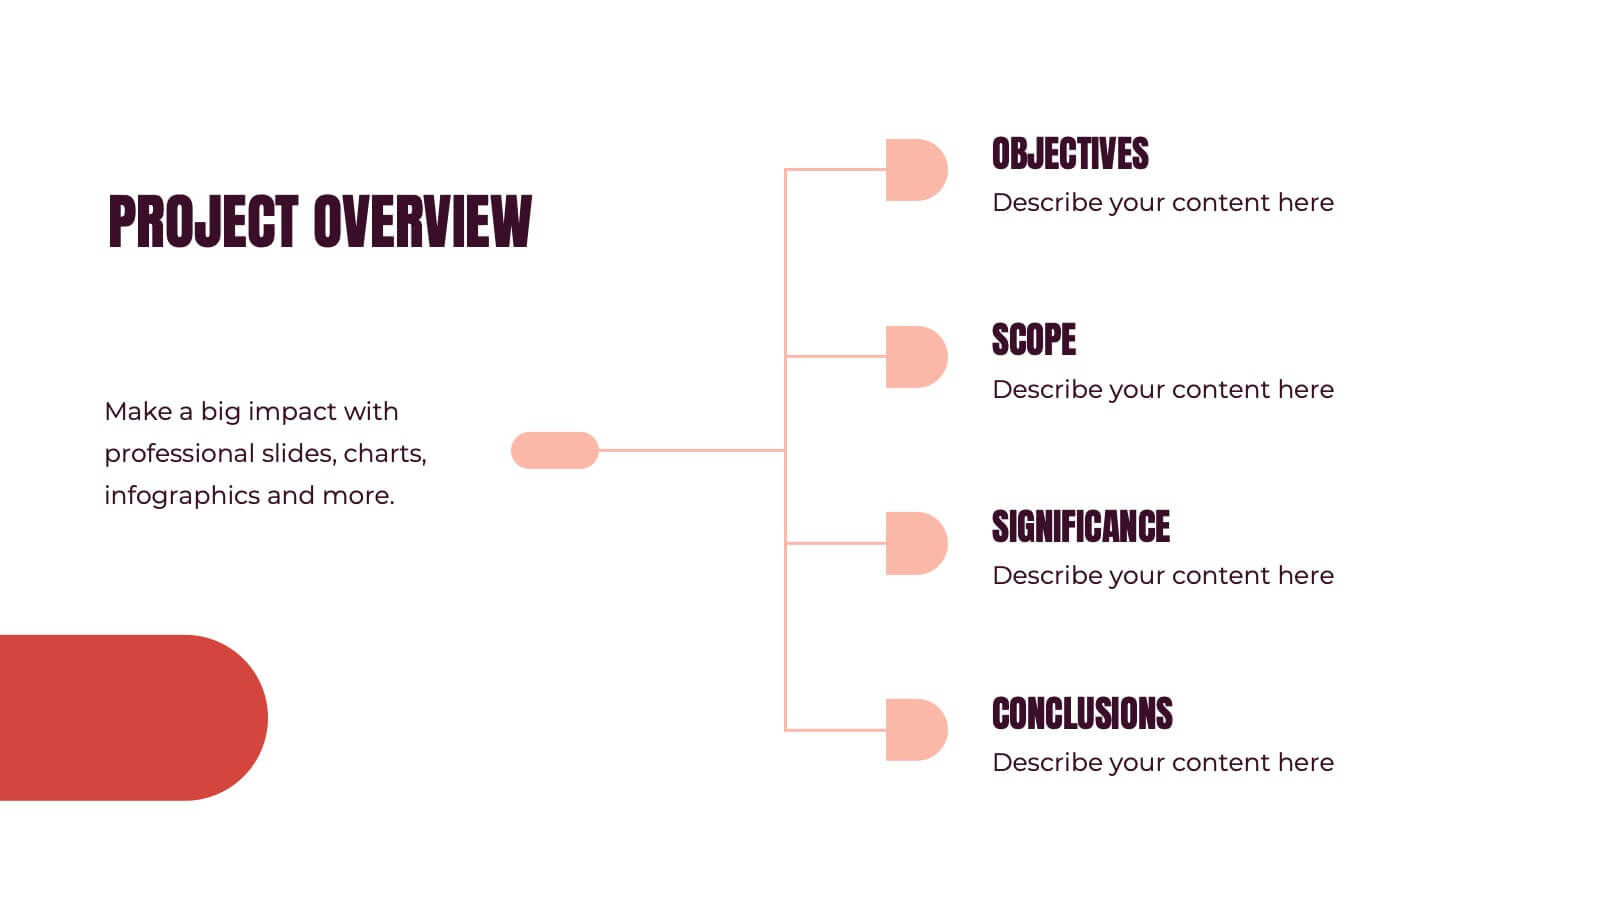
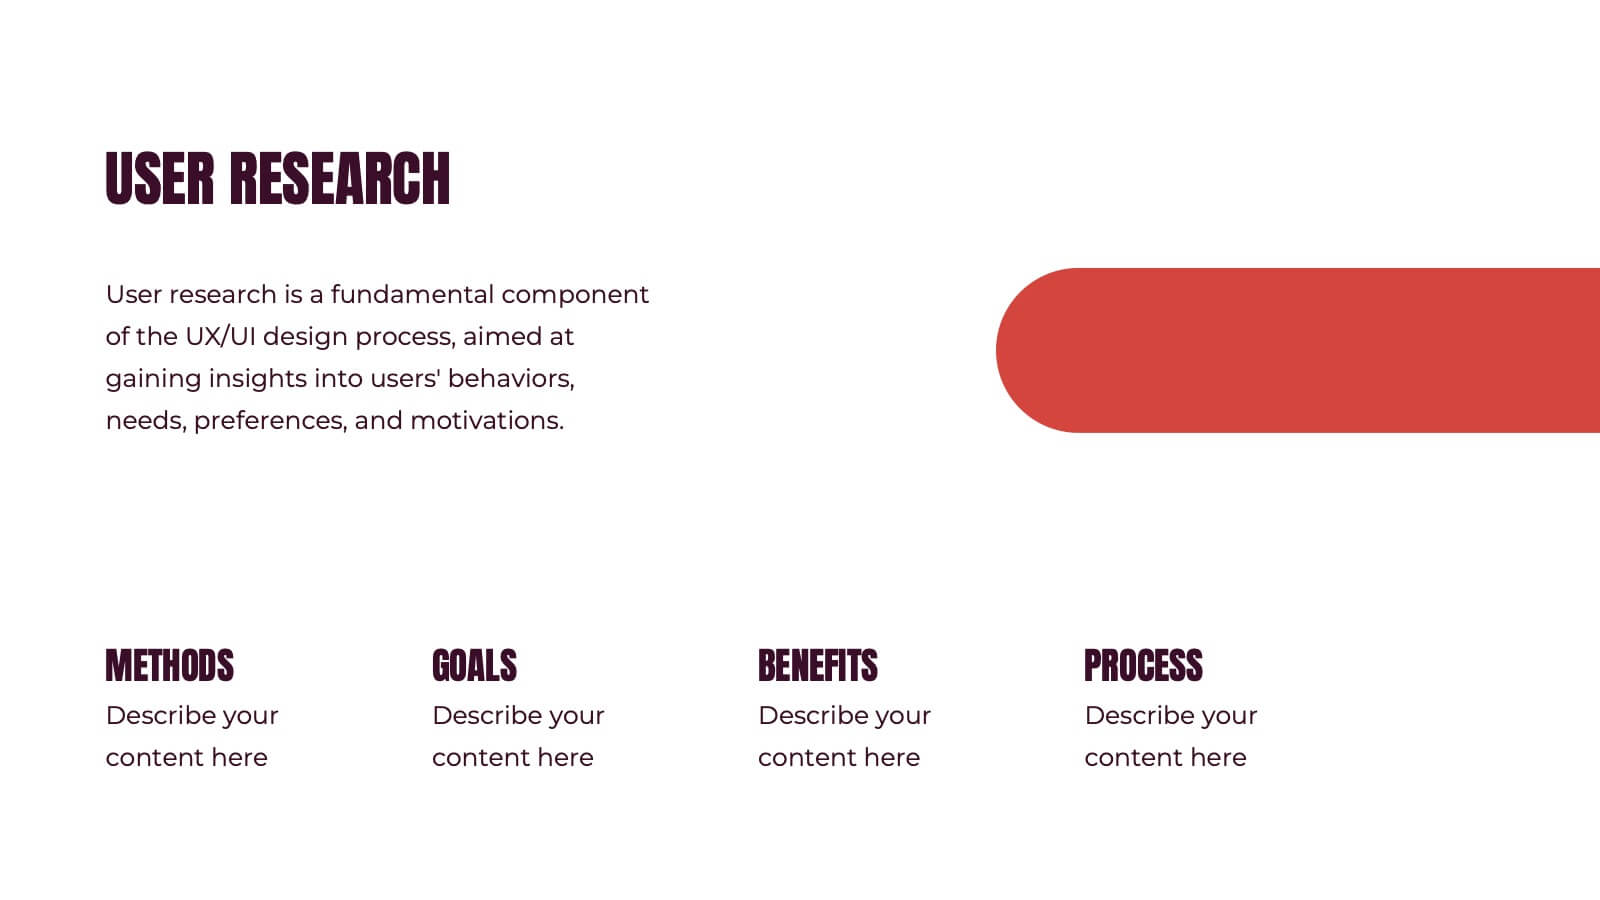
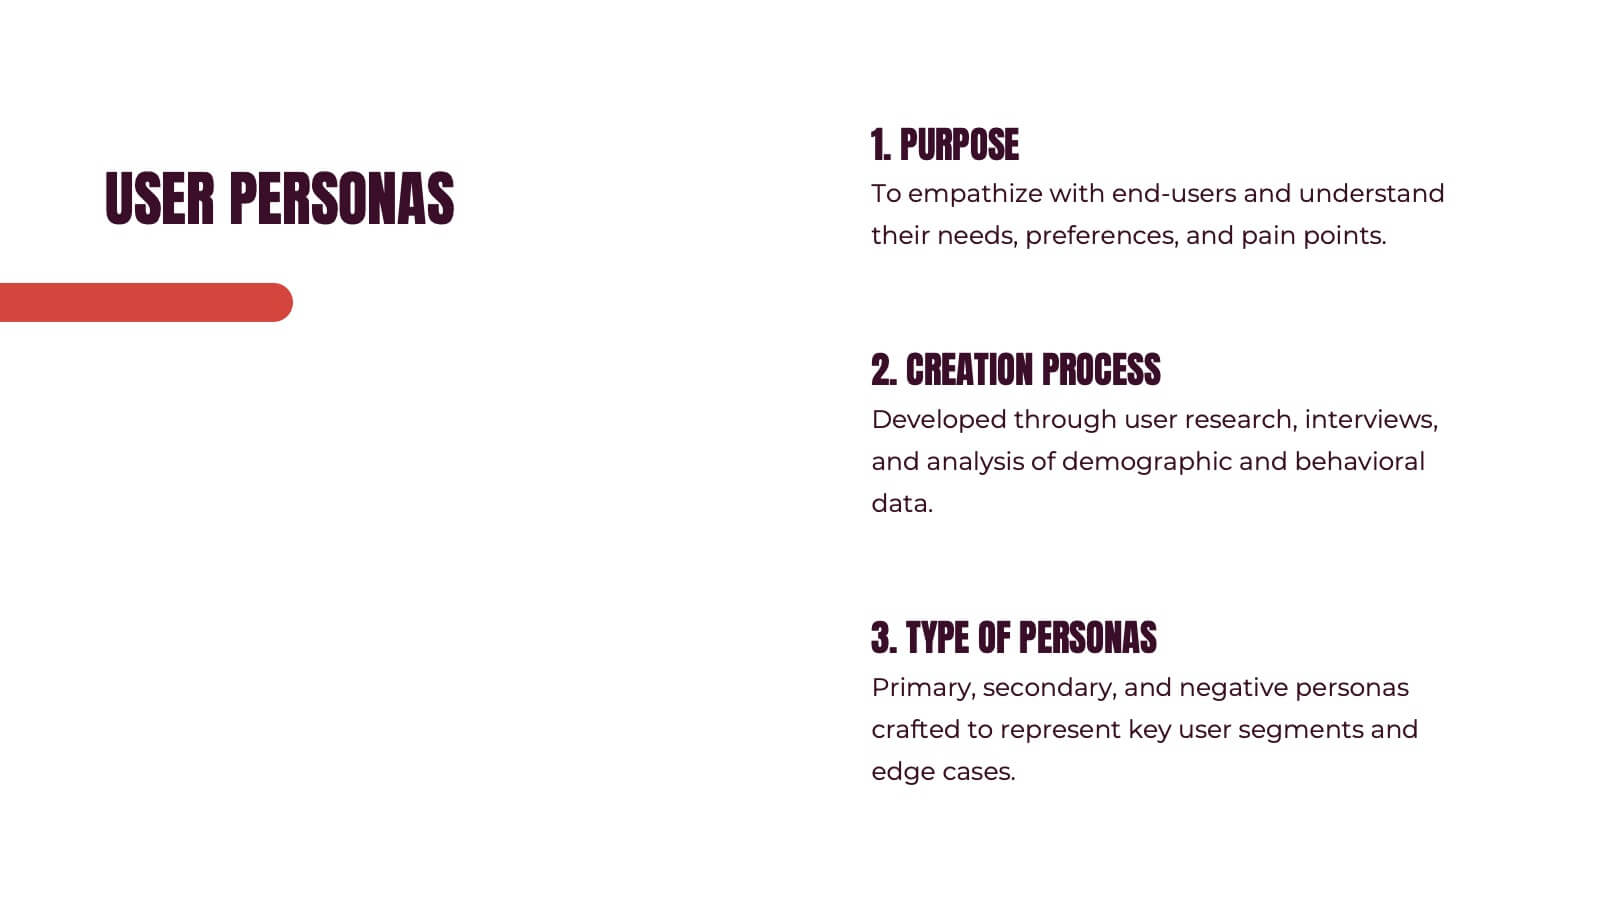
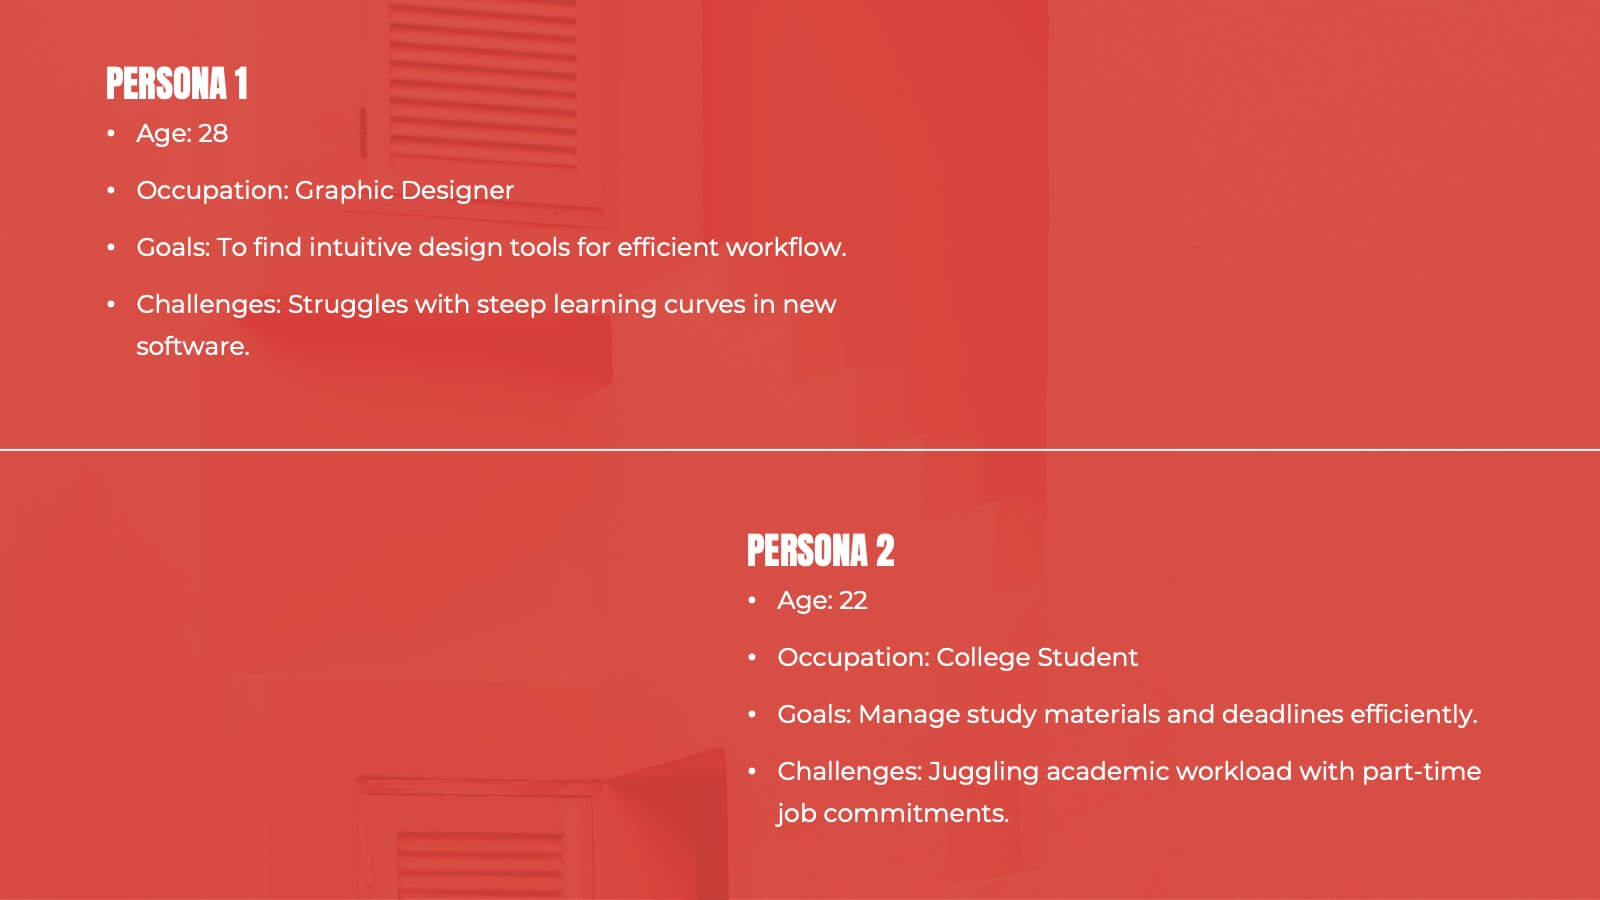
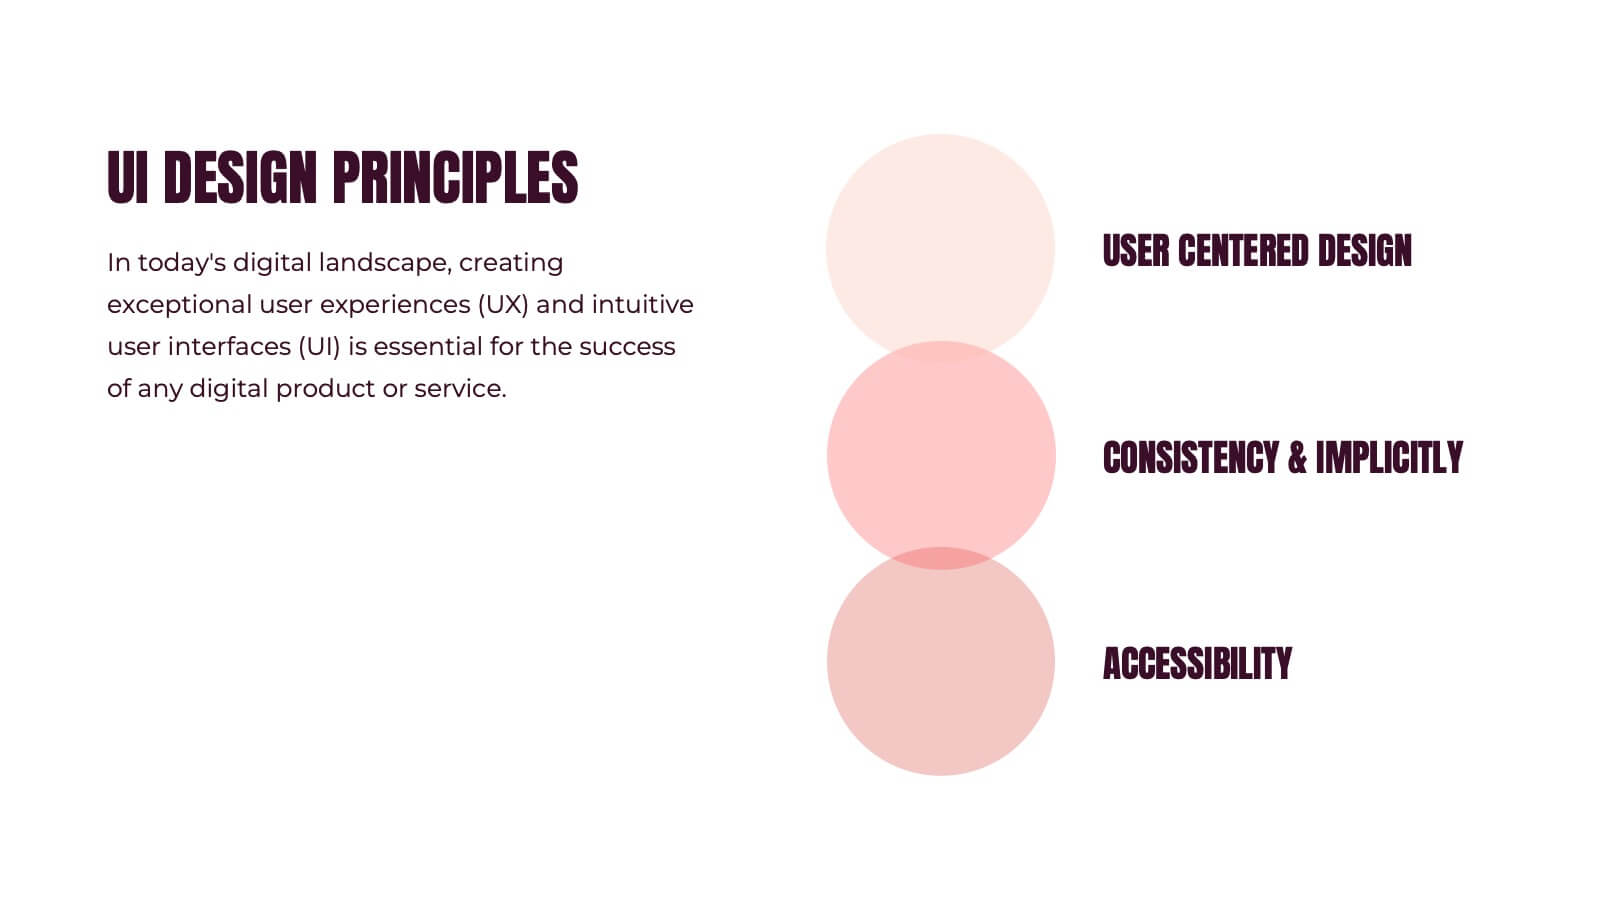
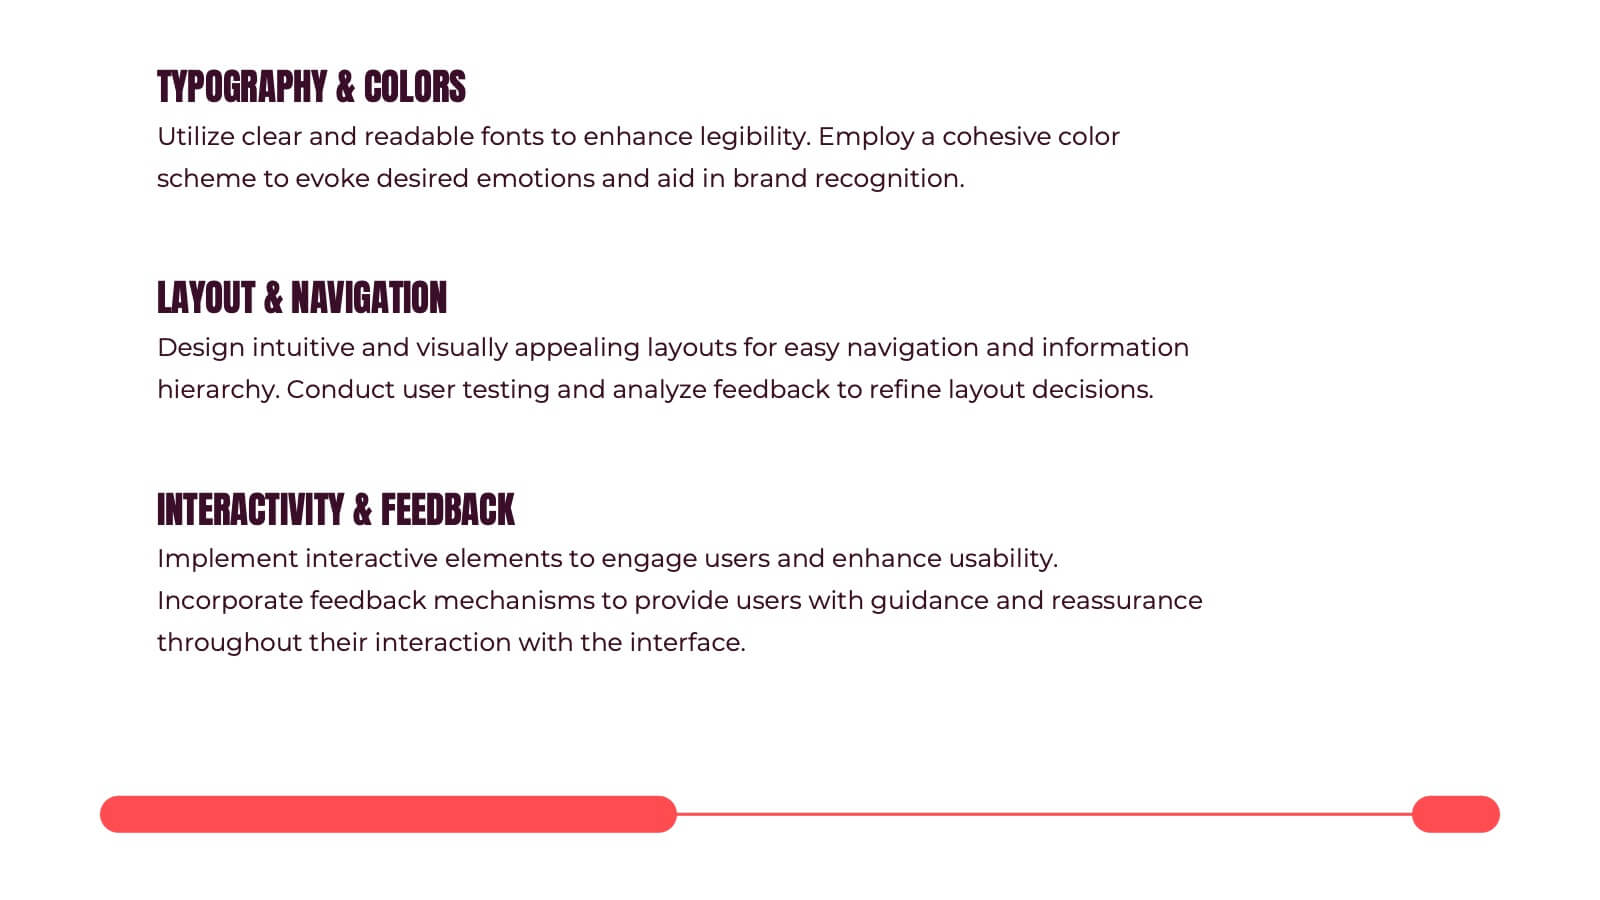
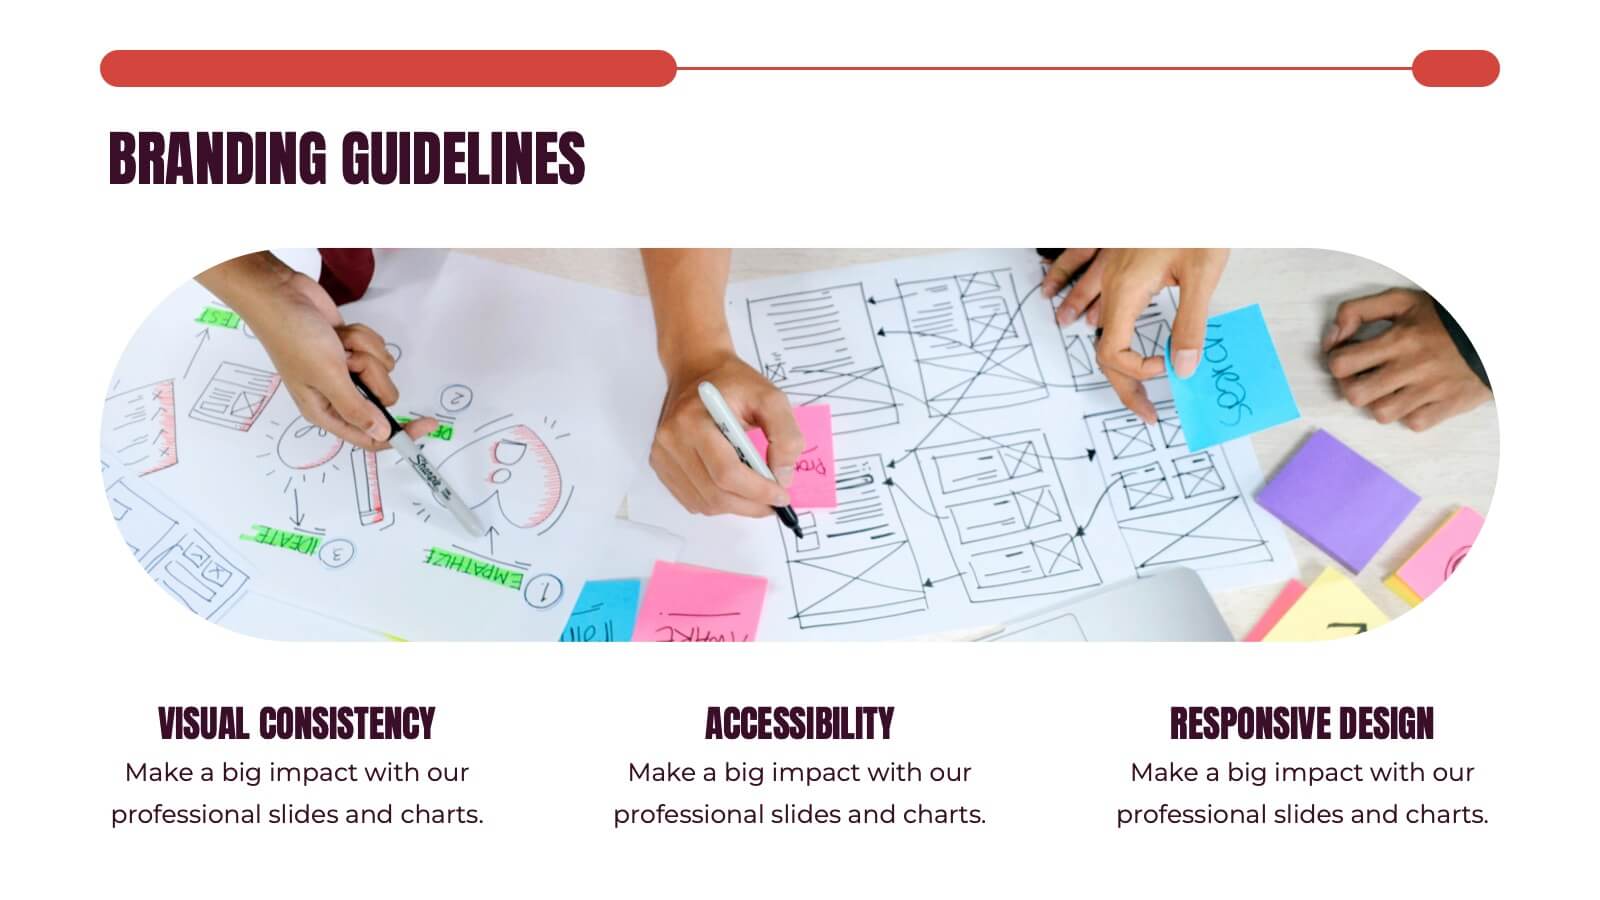
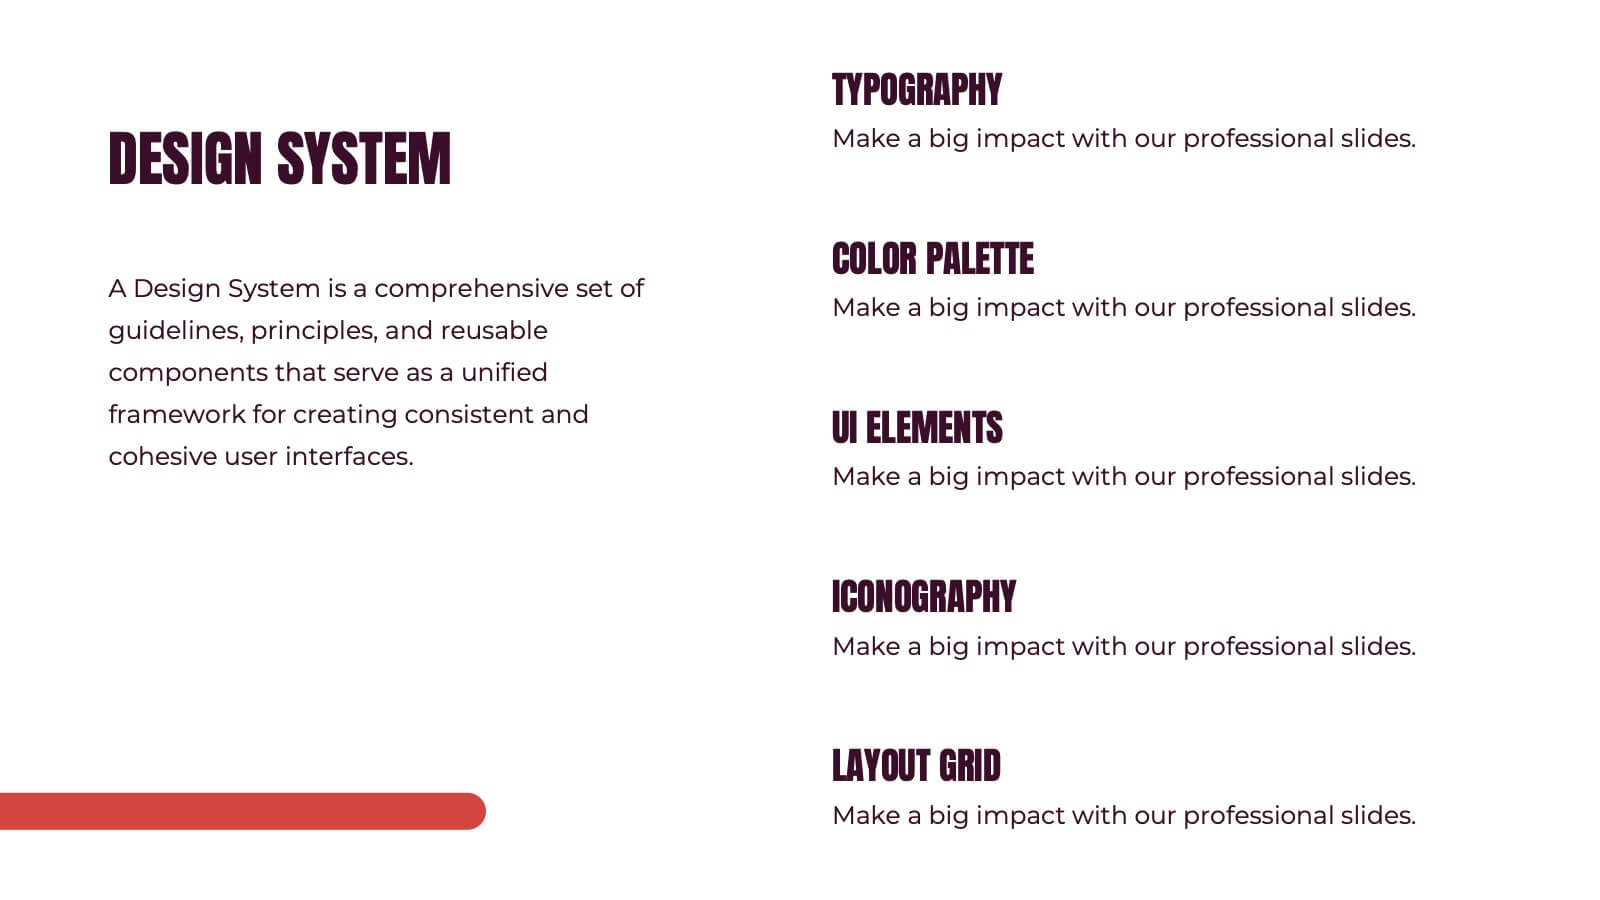
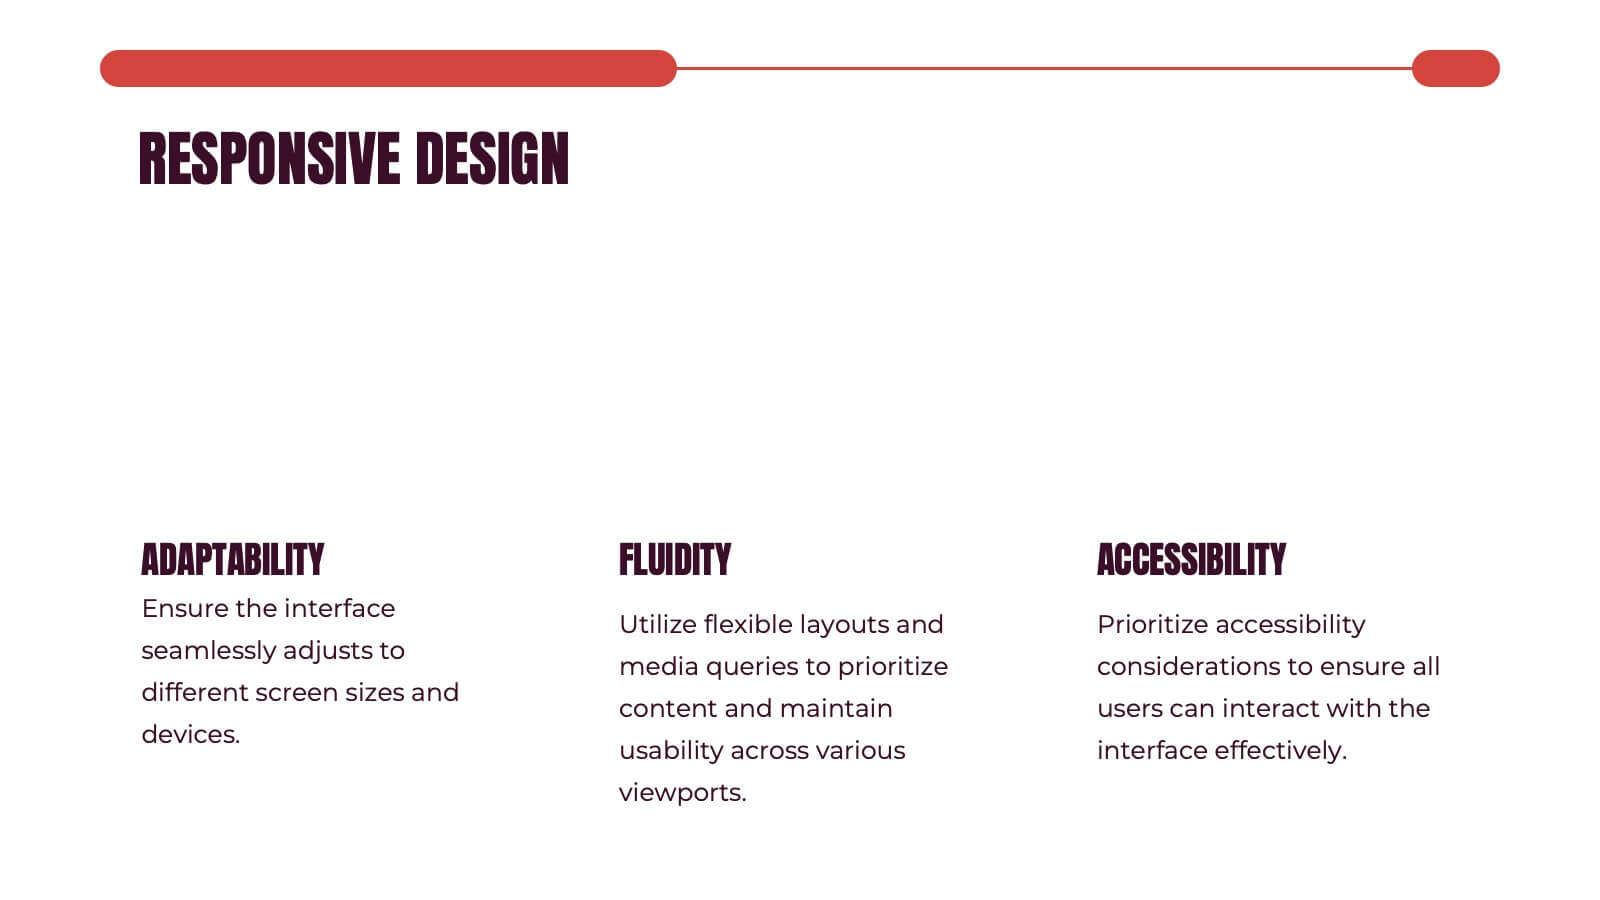
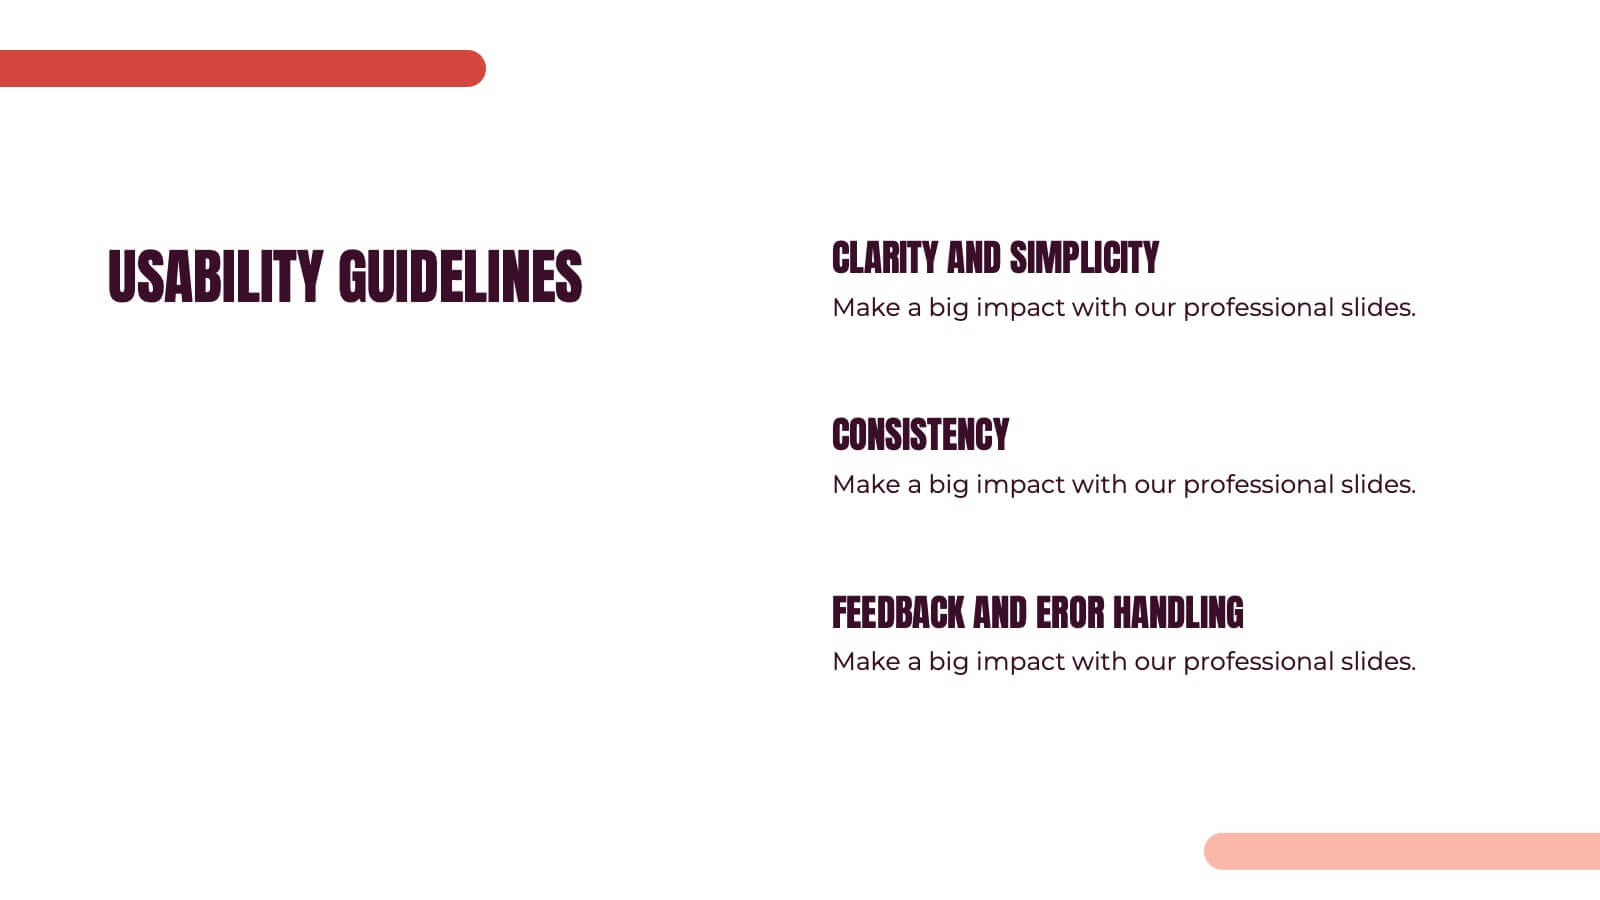
Jigsaw User Experience Proposal Presentation
Enhance user experience with this comprehensive UX proposal template! Perfect for outlining user research, personas, and design principles. Ideal for UX/UI designers aiming to present their strategies and solutions. Compatible with PowerPoint, Keynote, and Google Slides, this template ensures your UX proposals are clear, professional, and impactful. Create exceptional user experiences today!

24 diapositivas
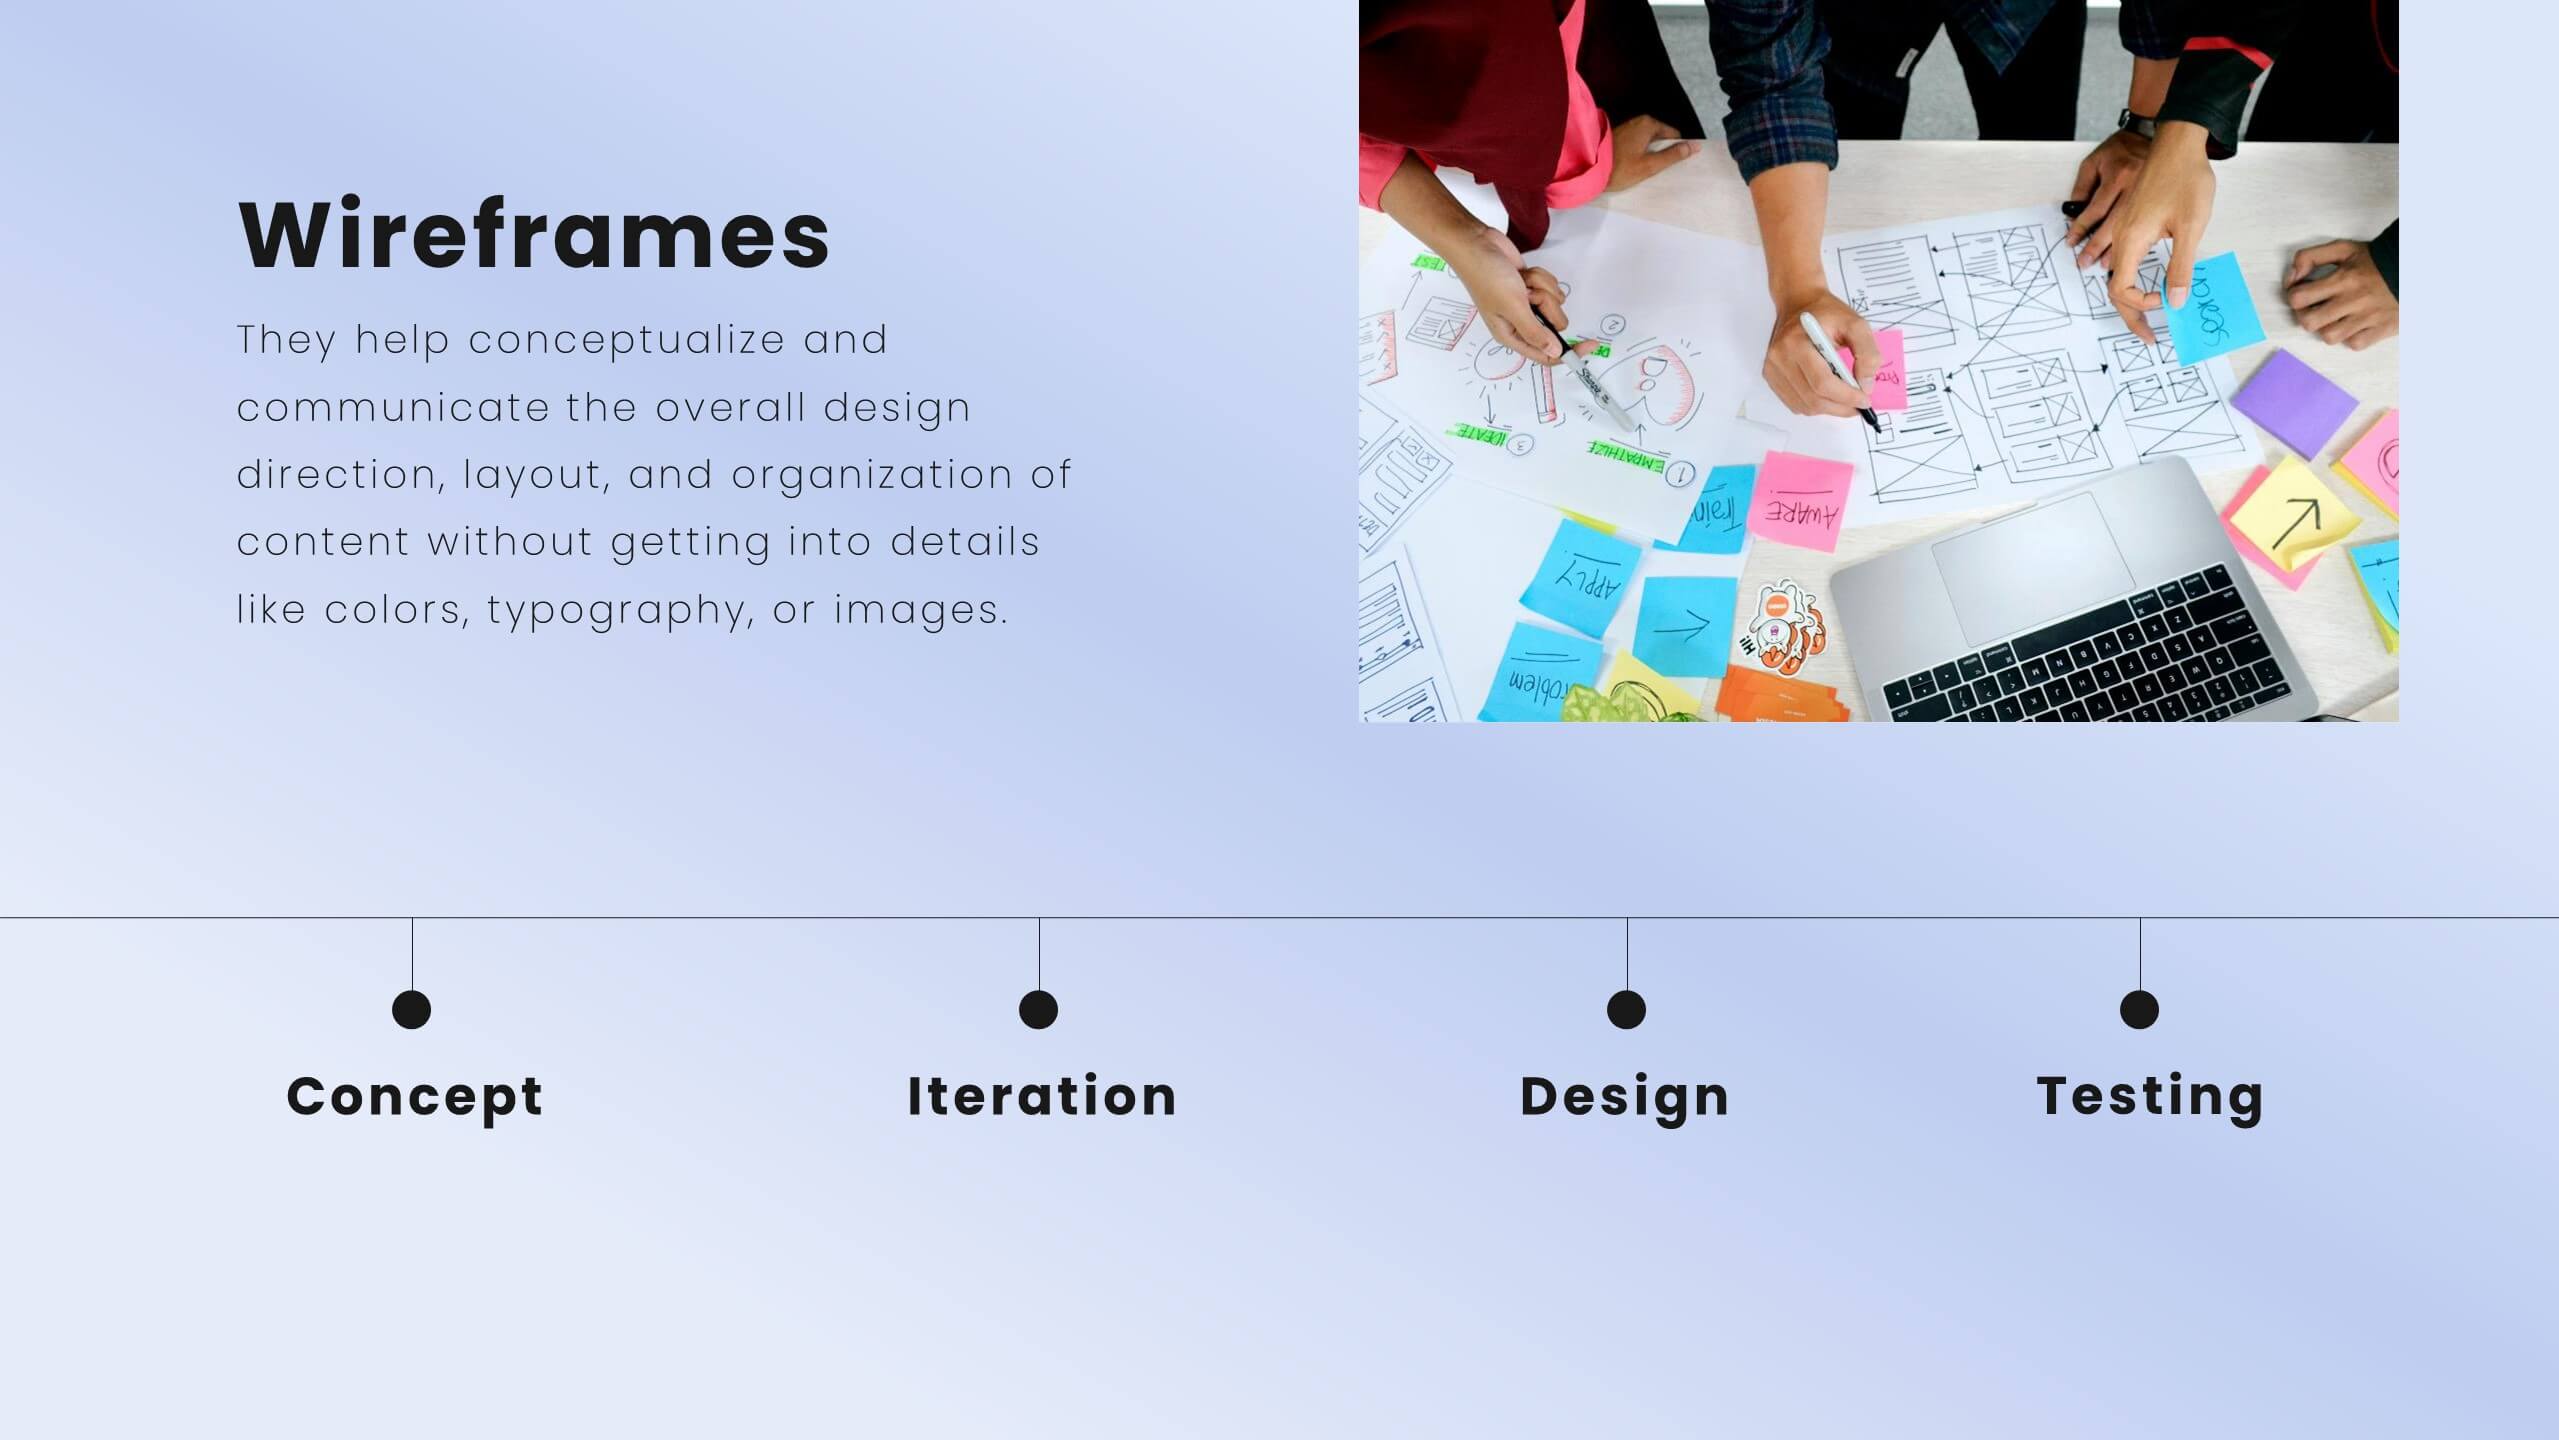
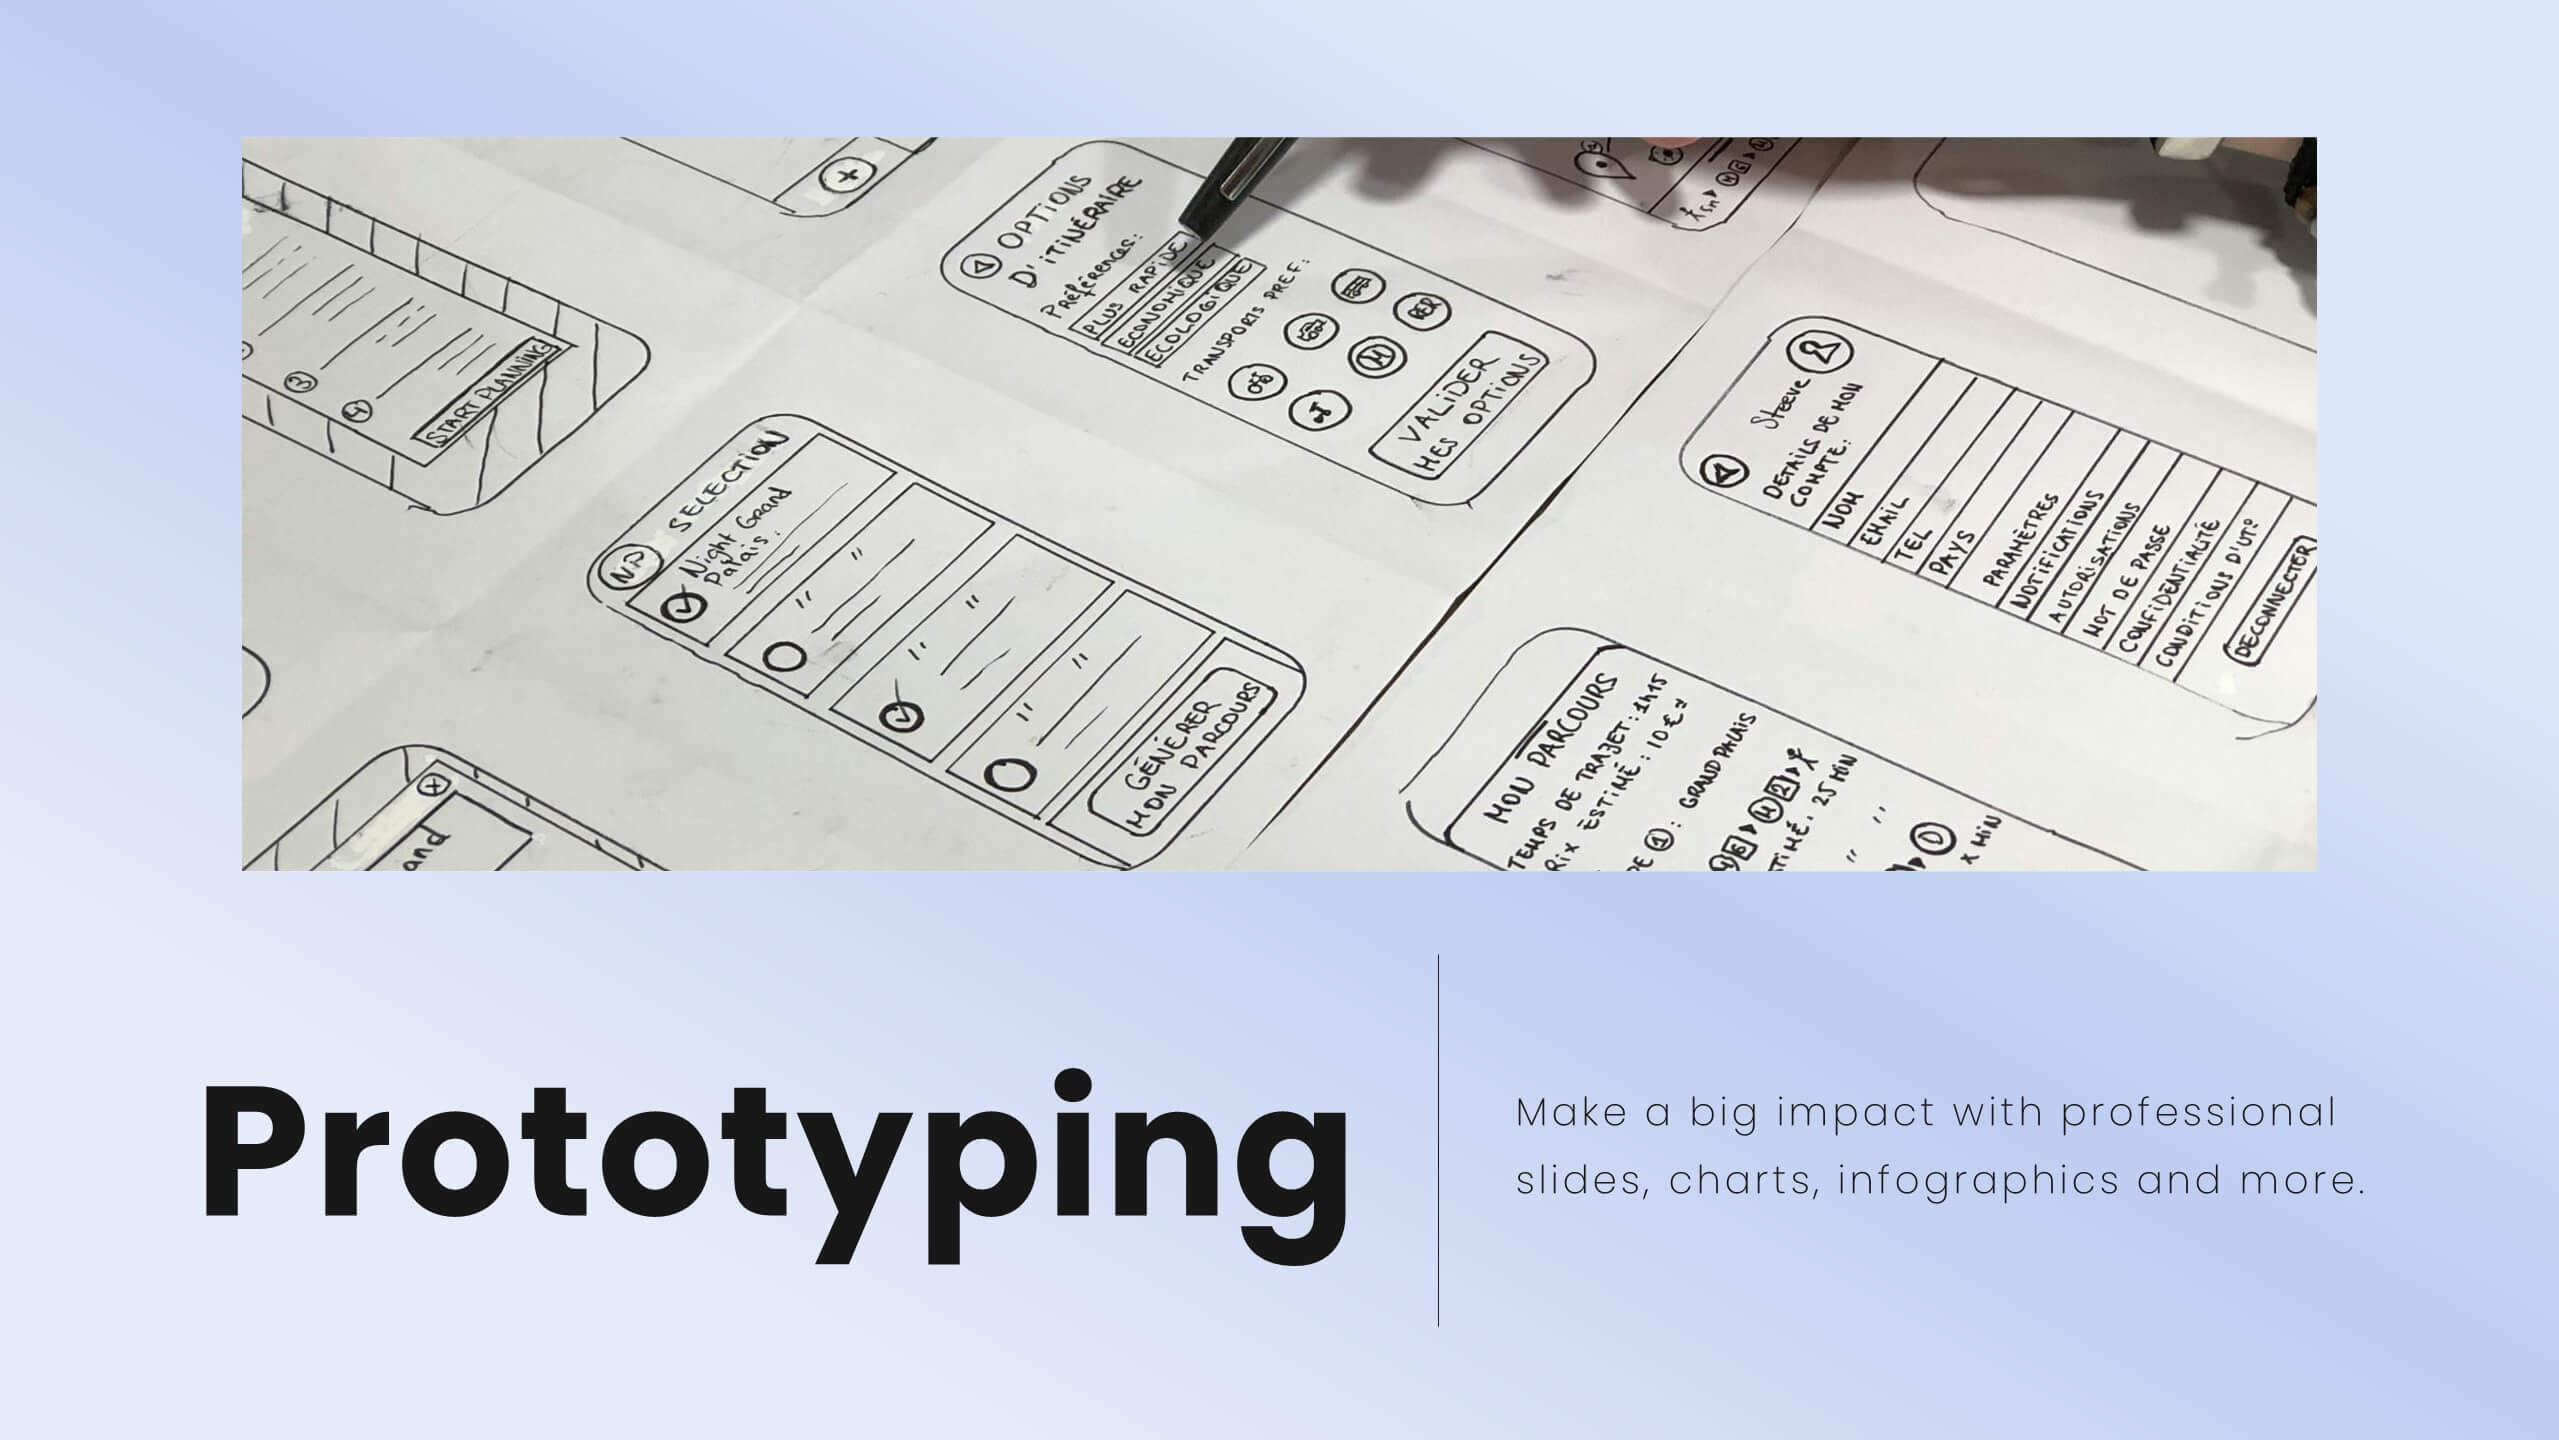
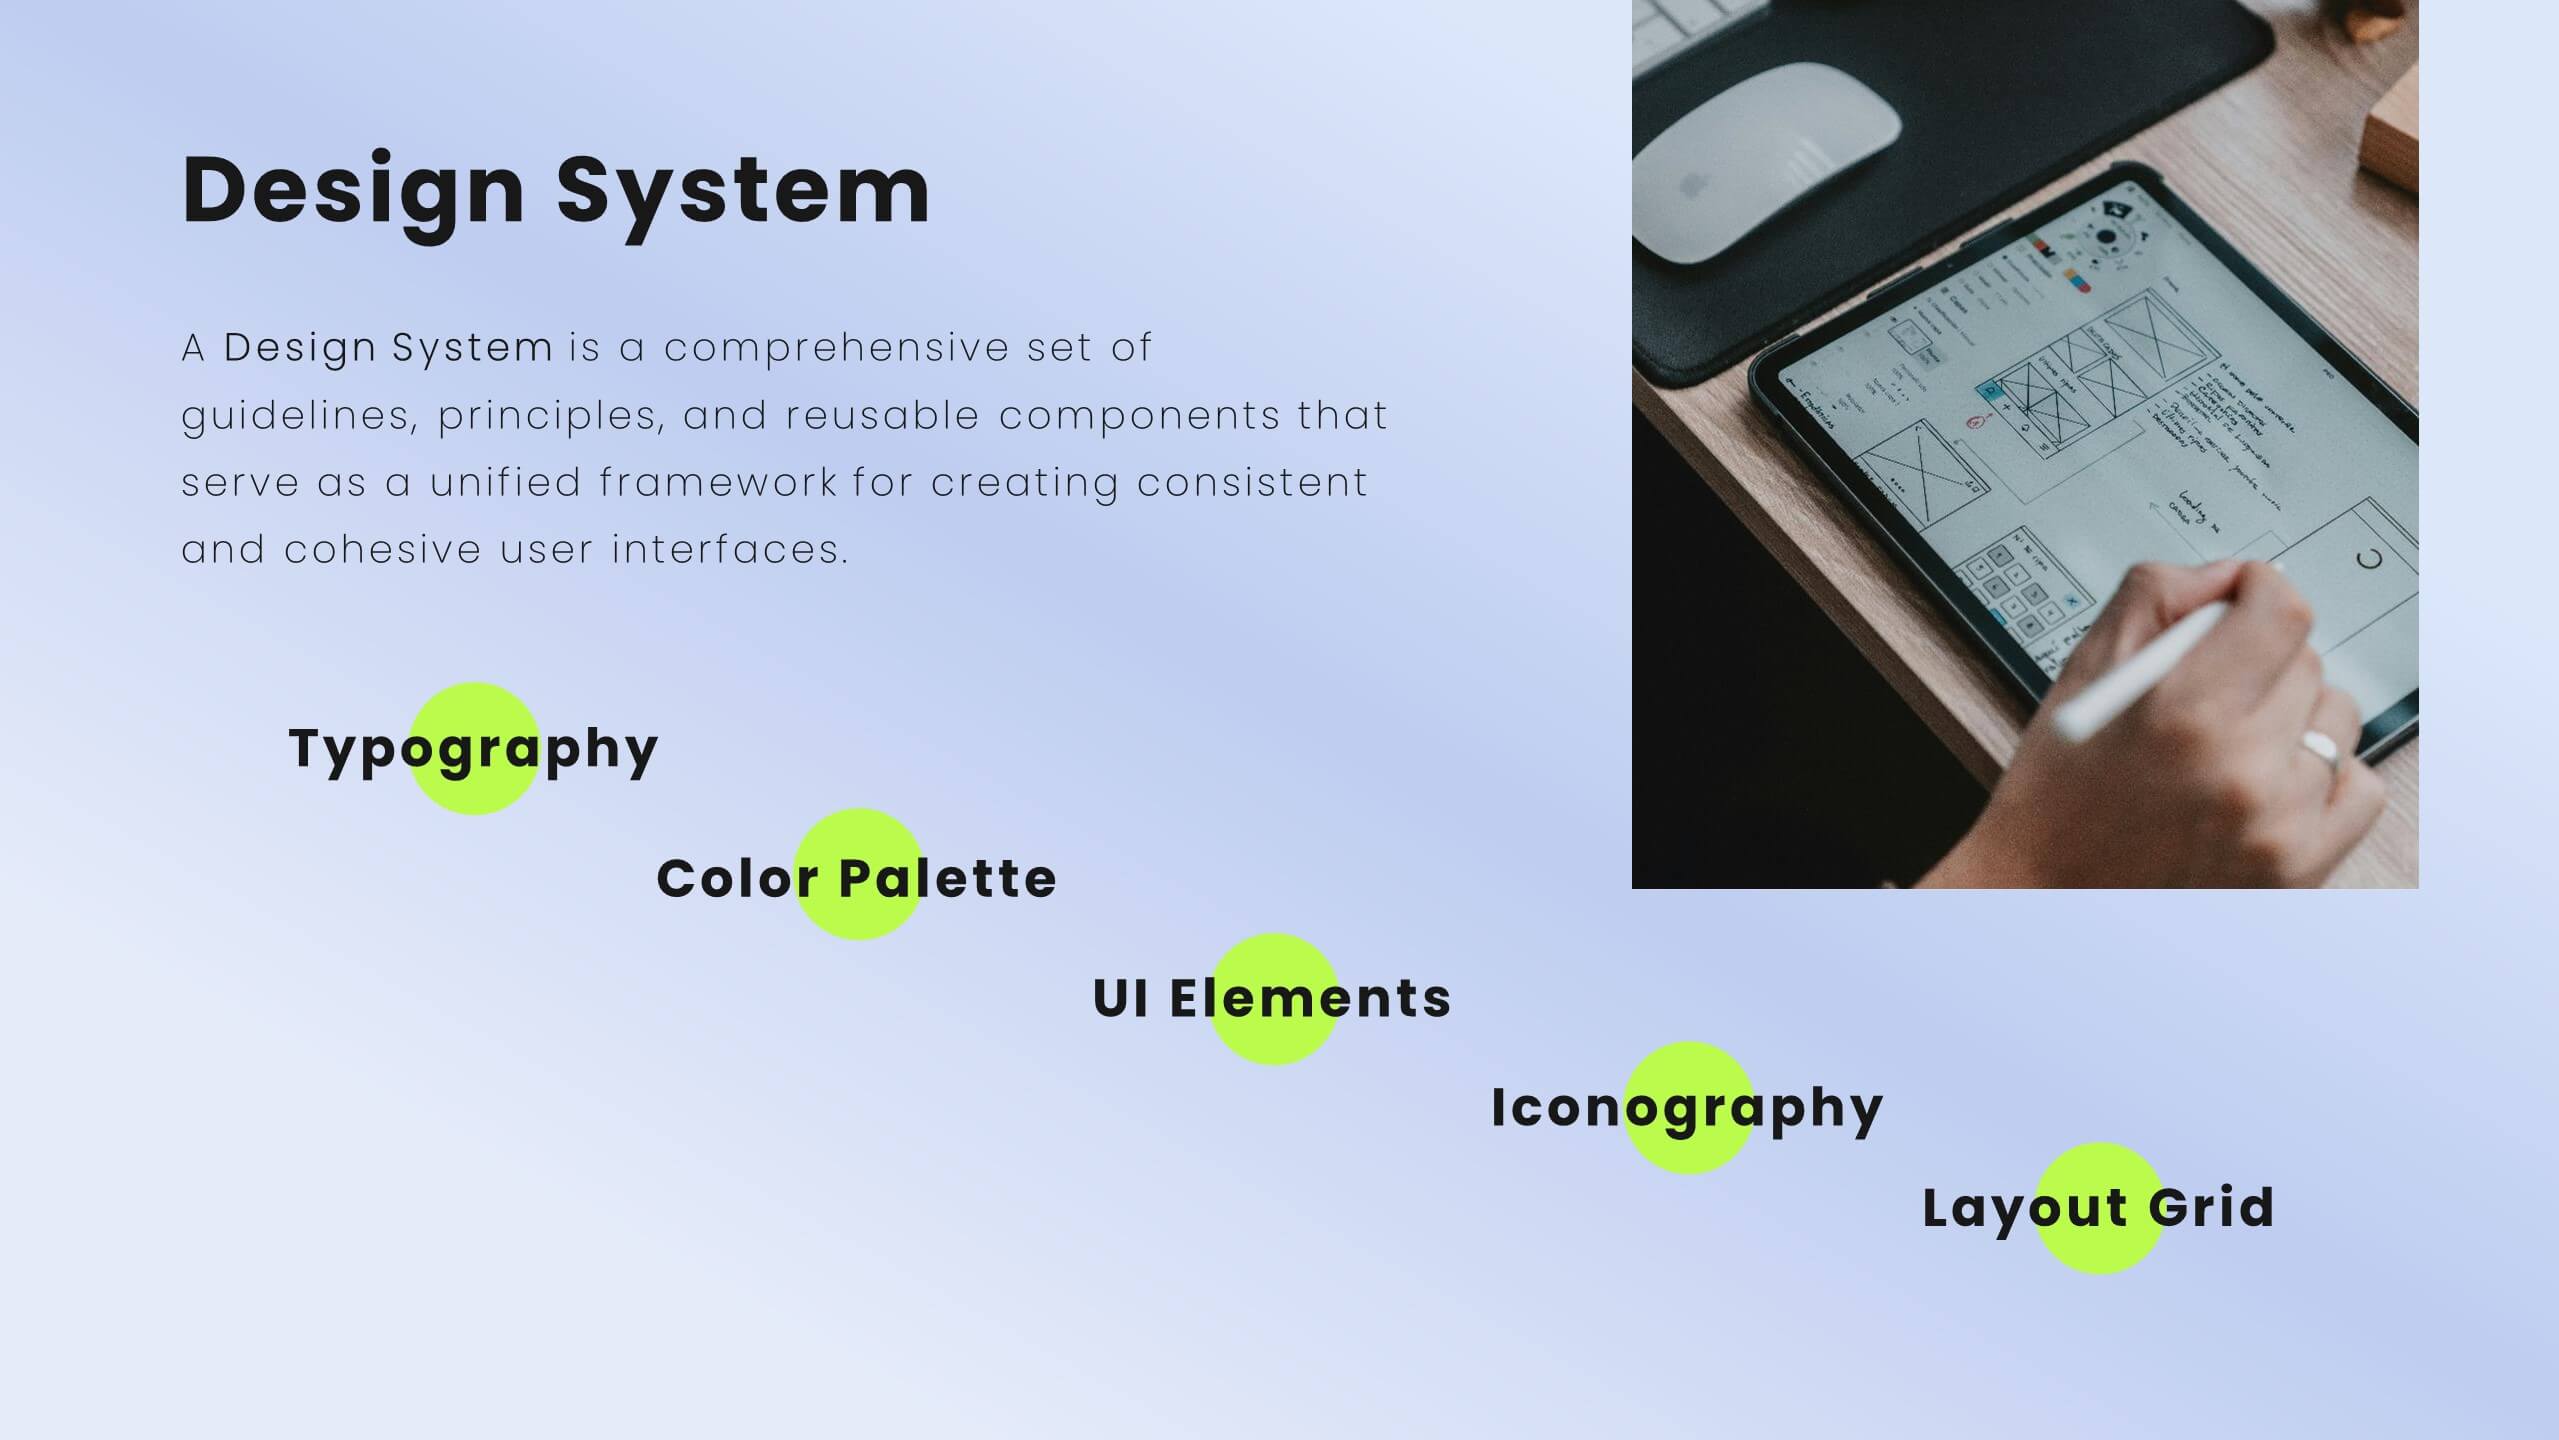
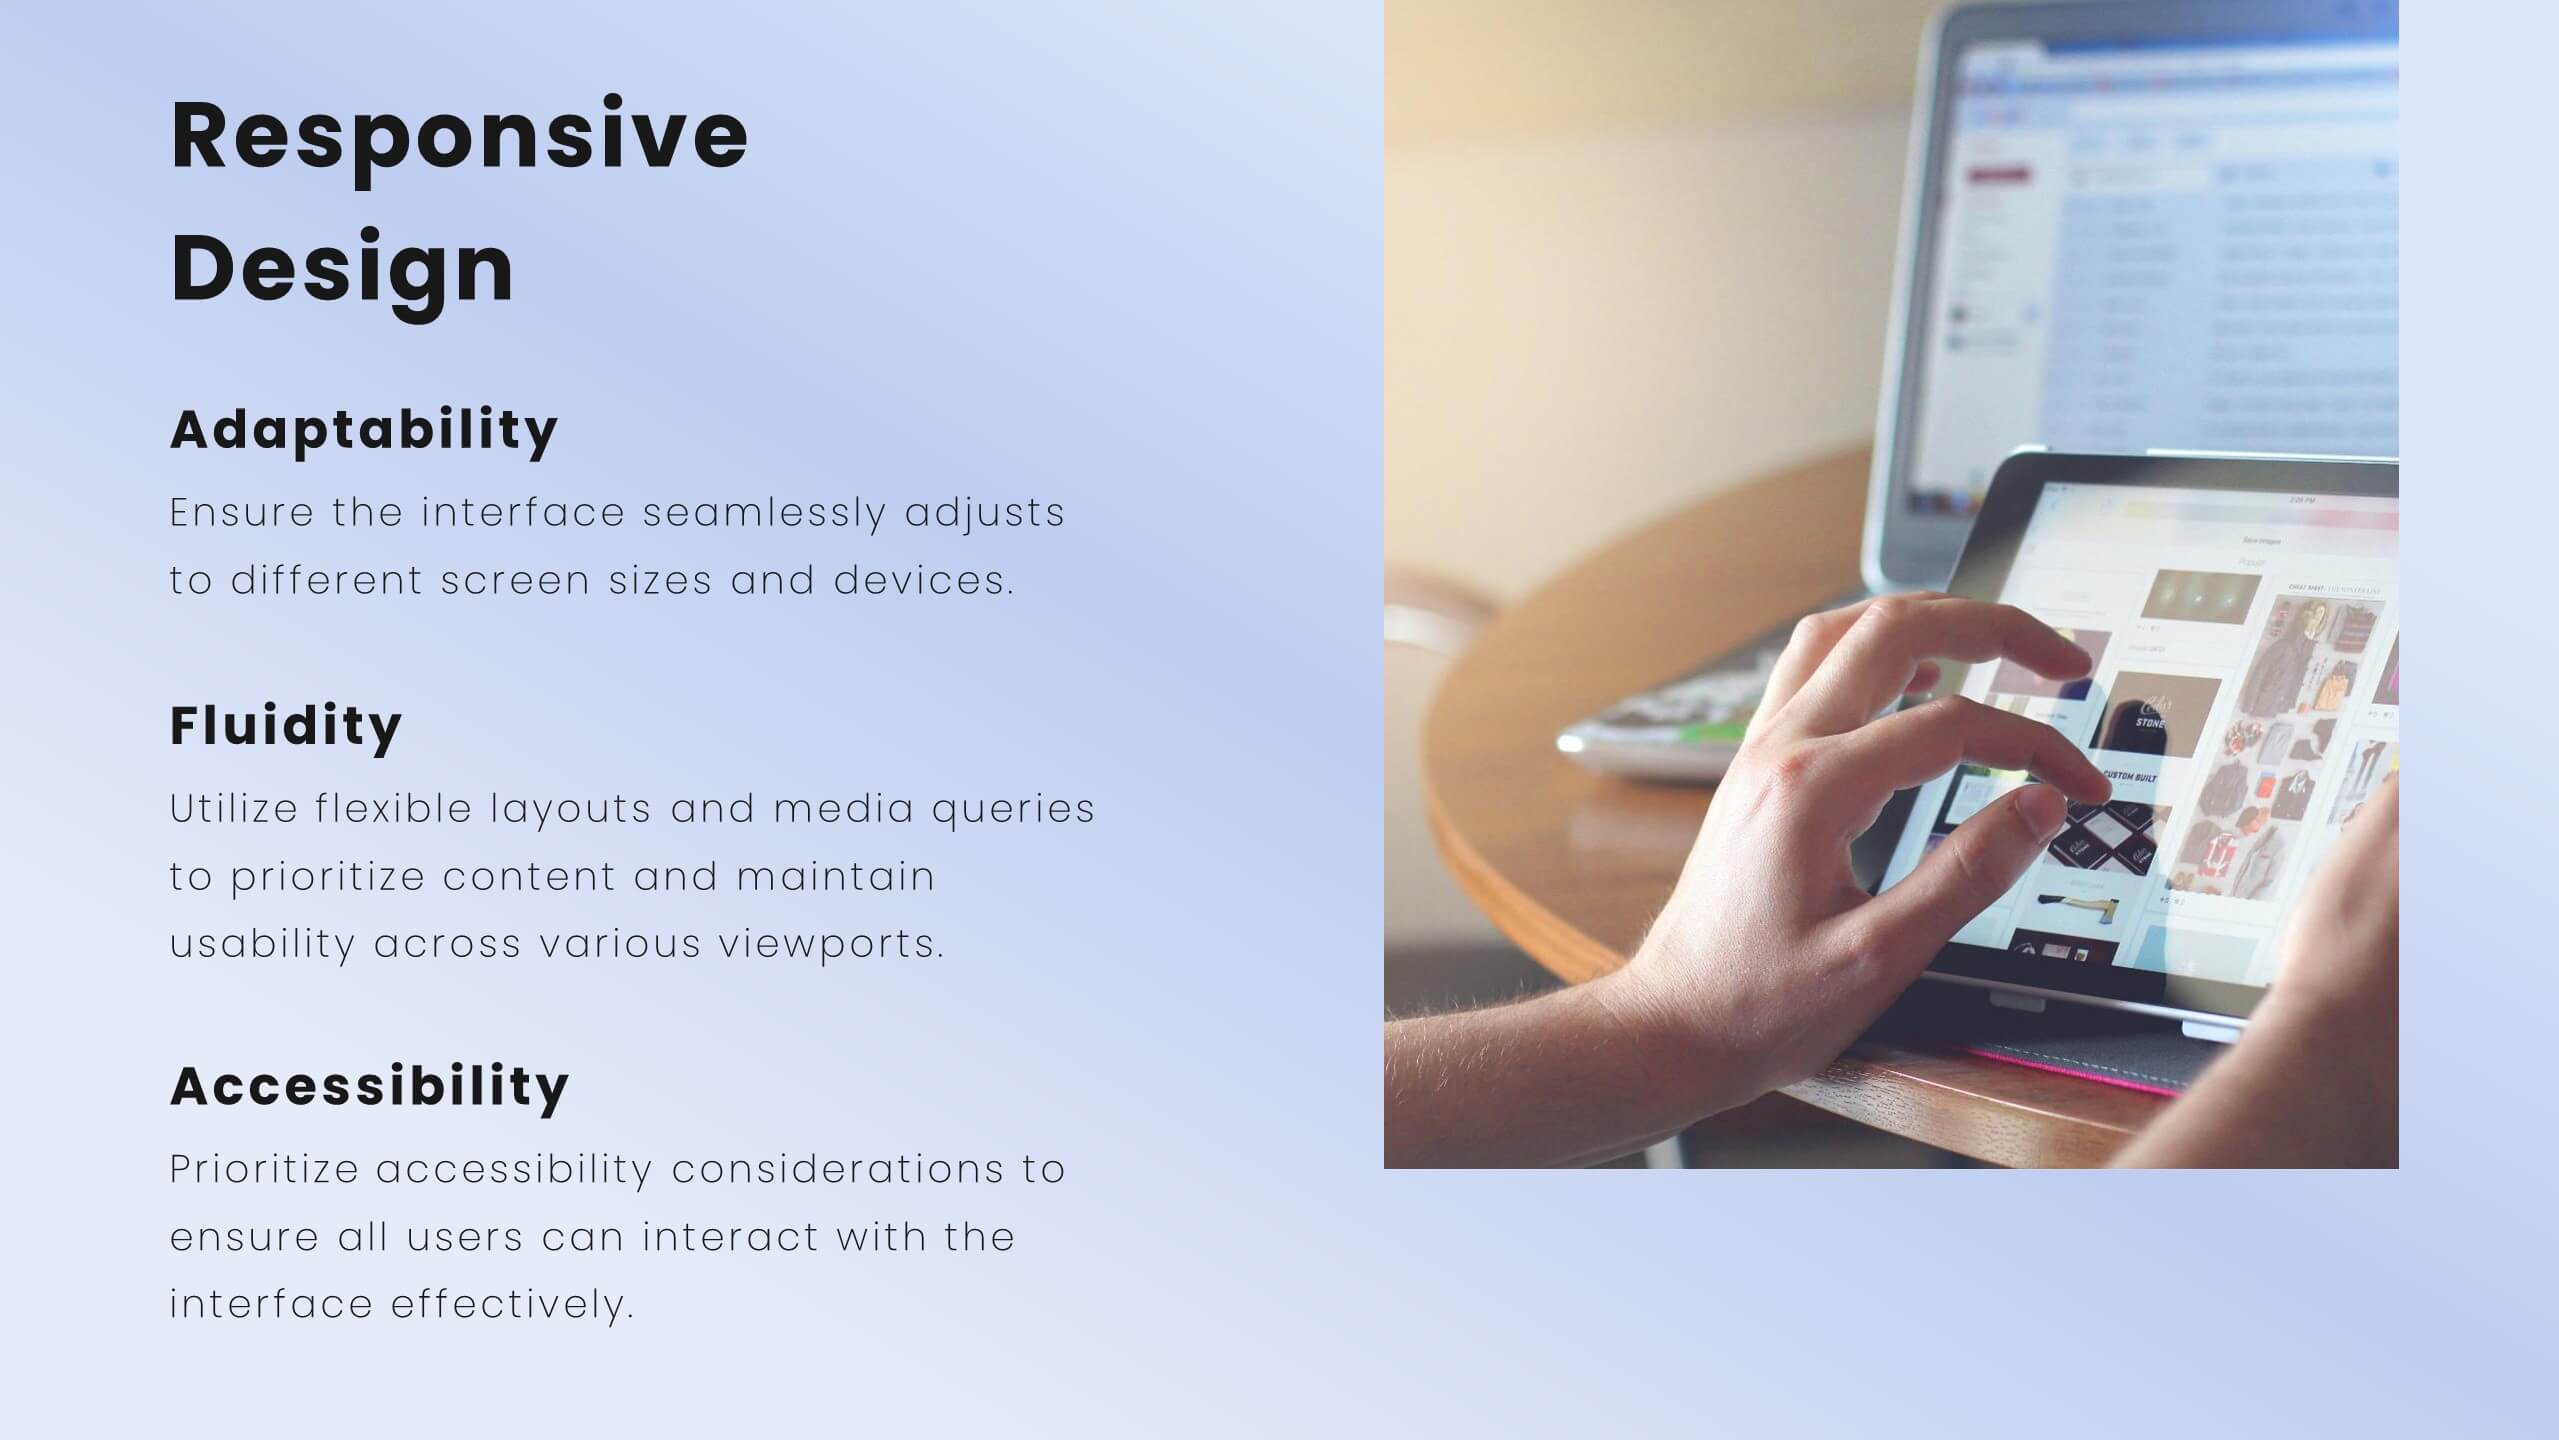
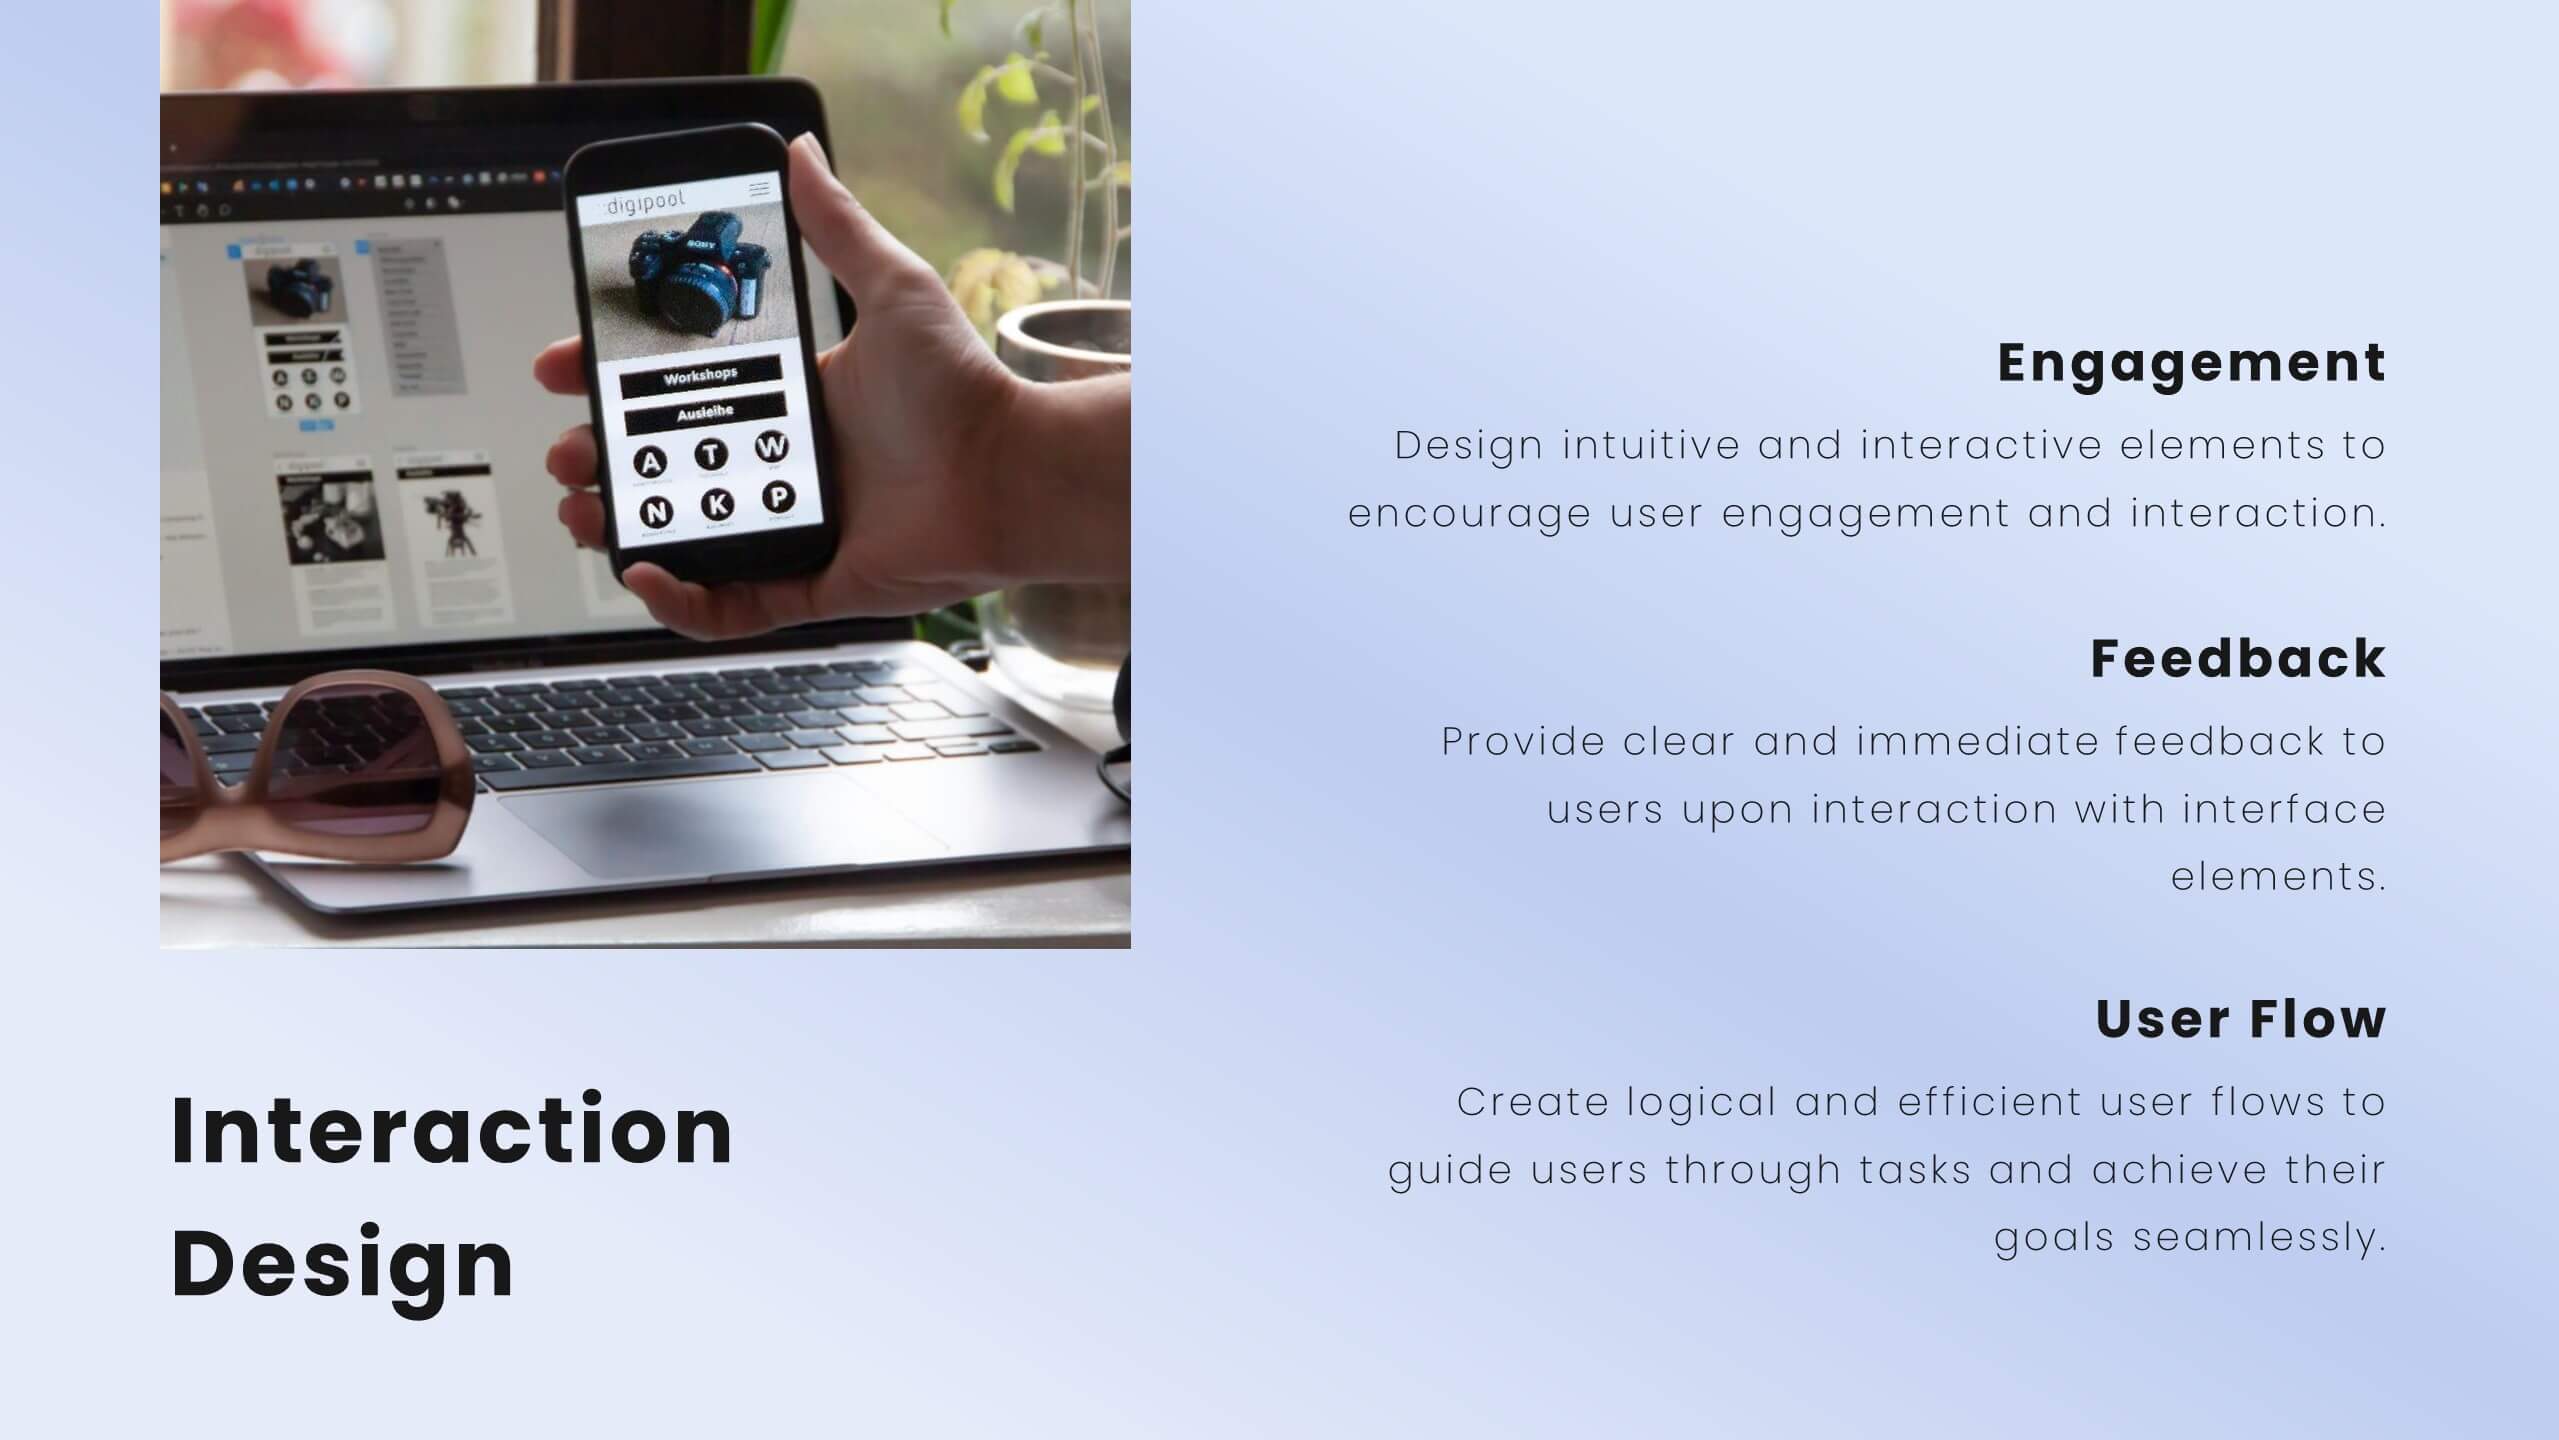
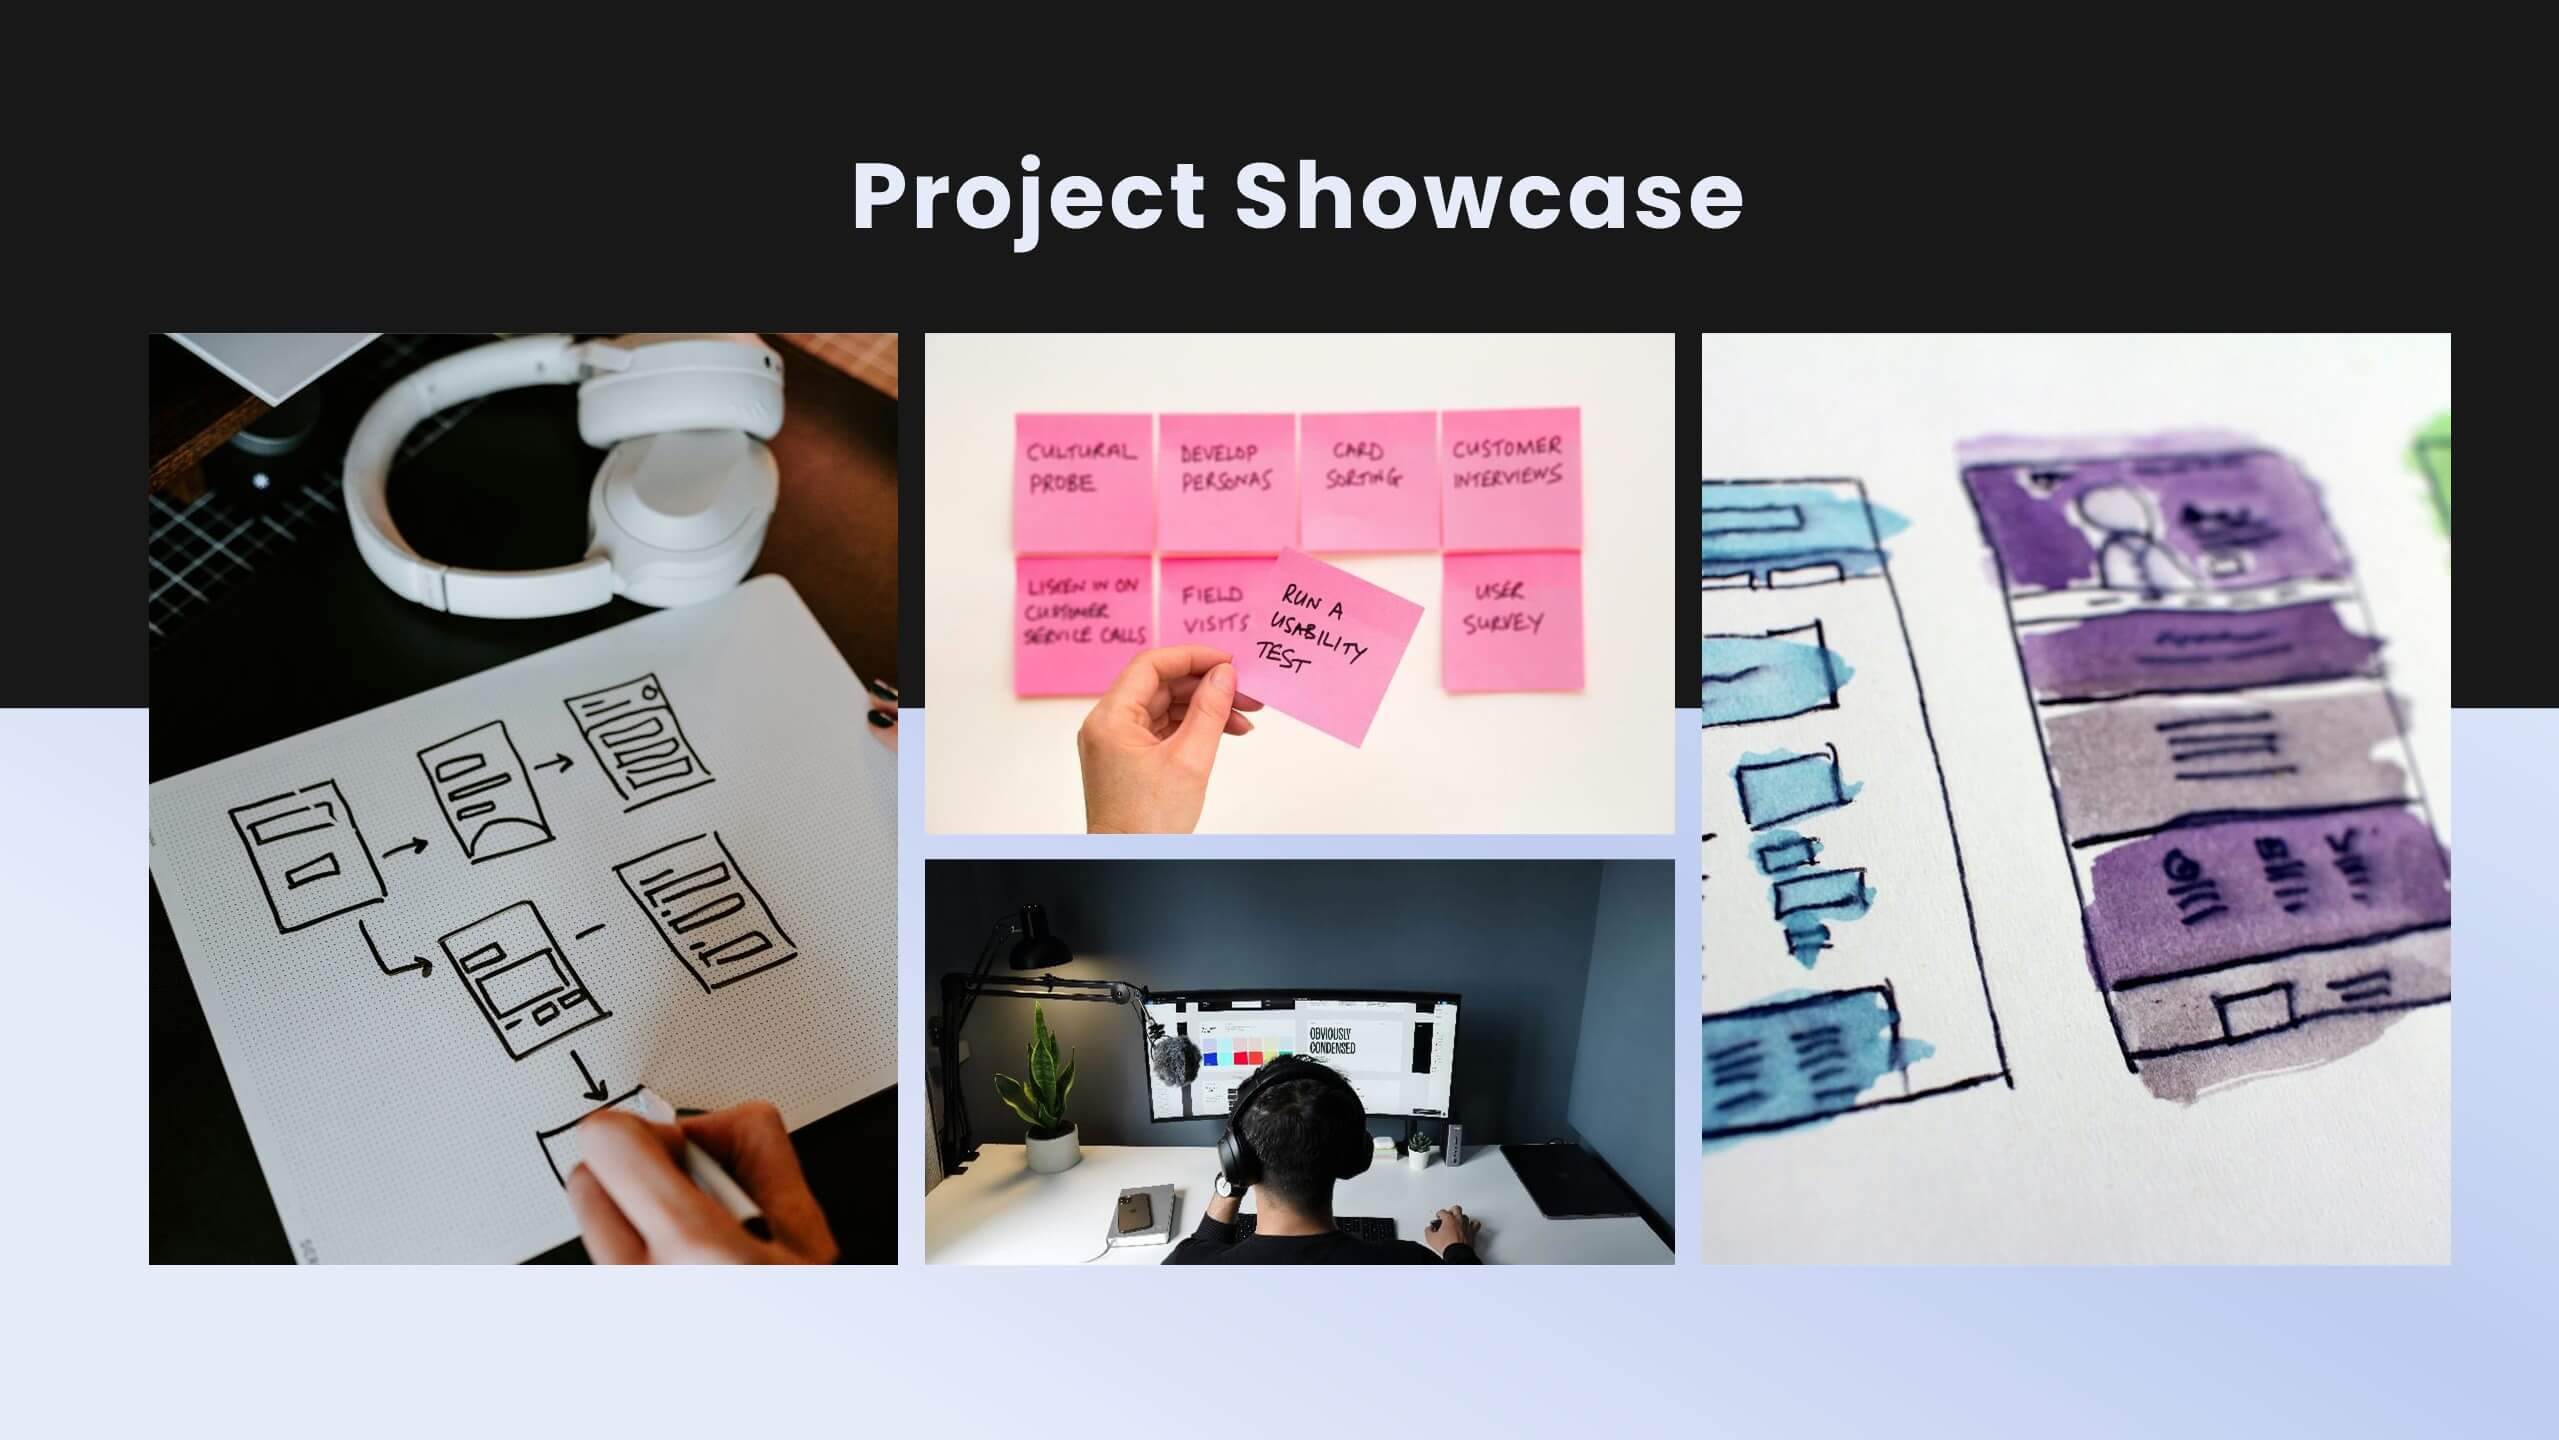
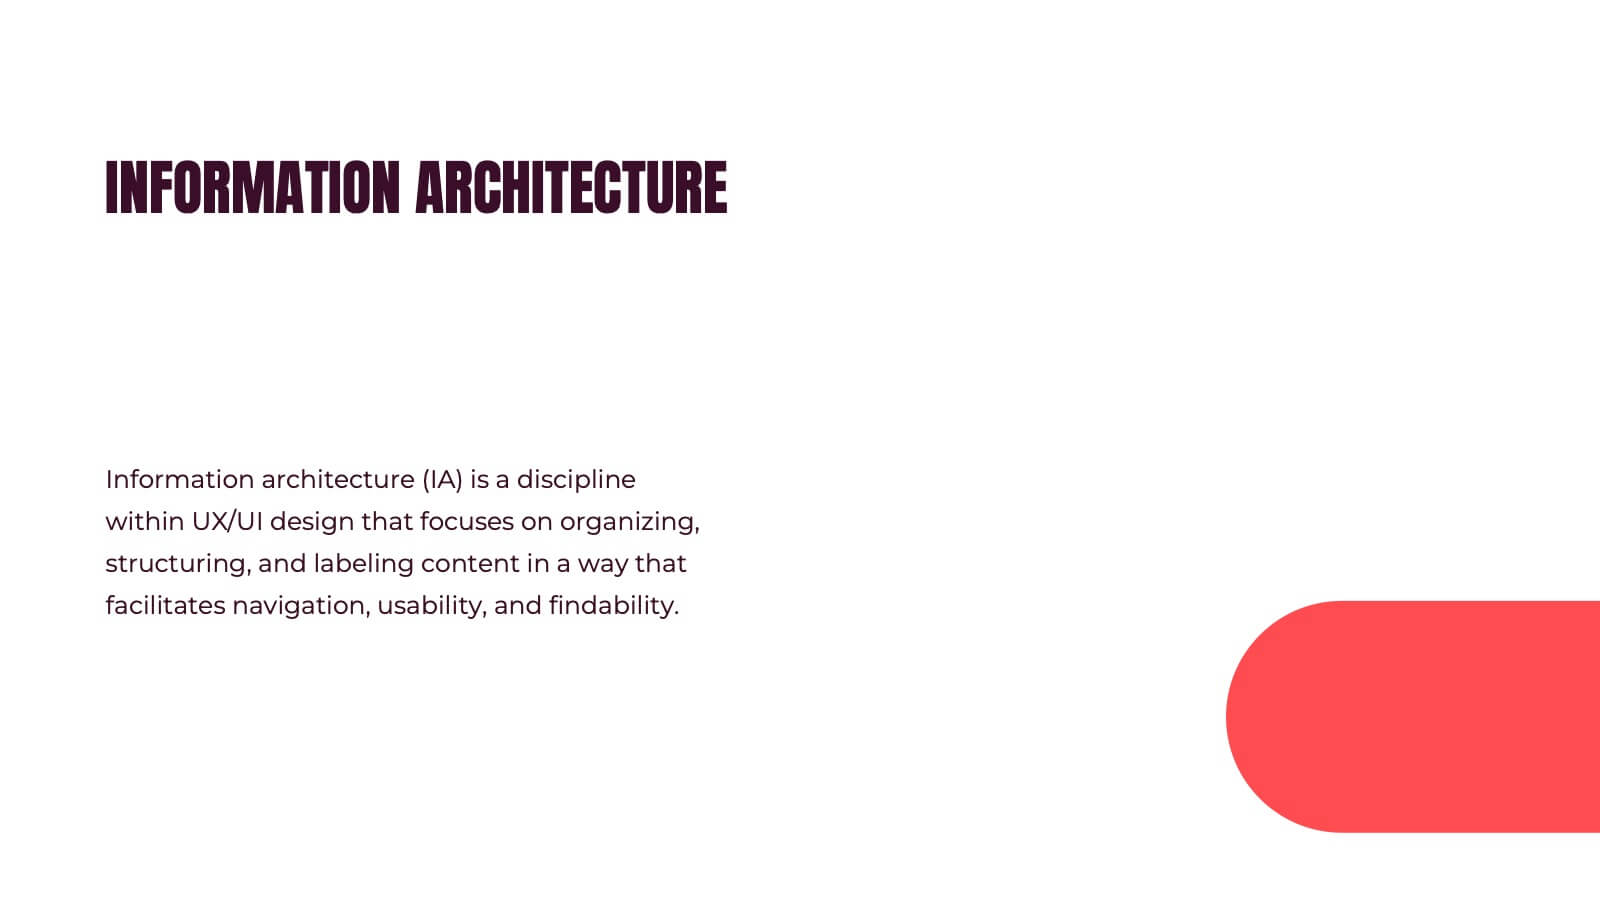
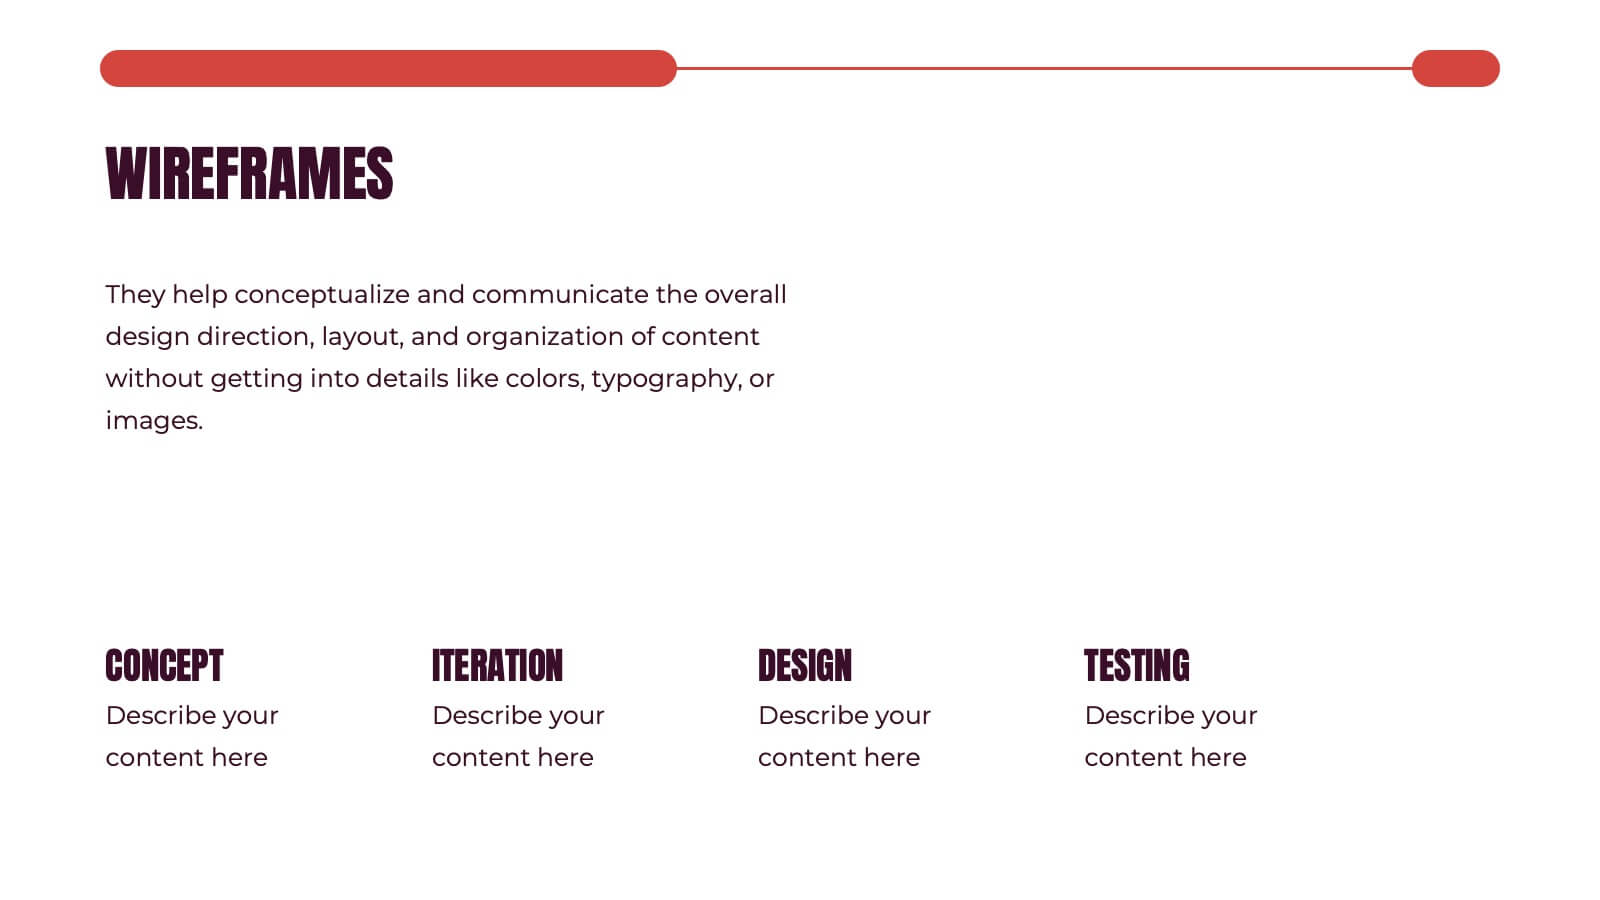
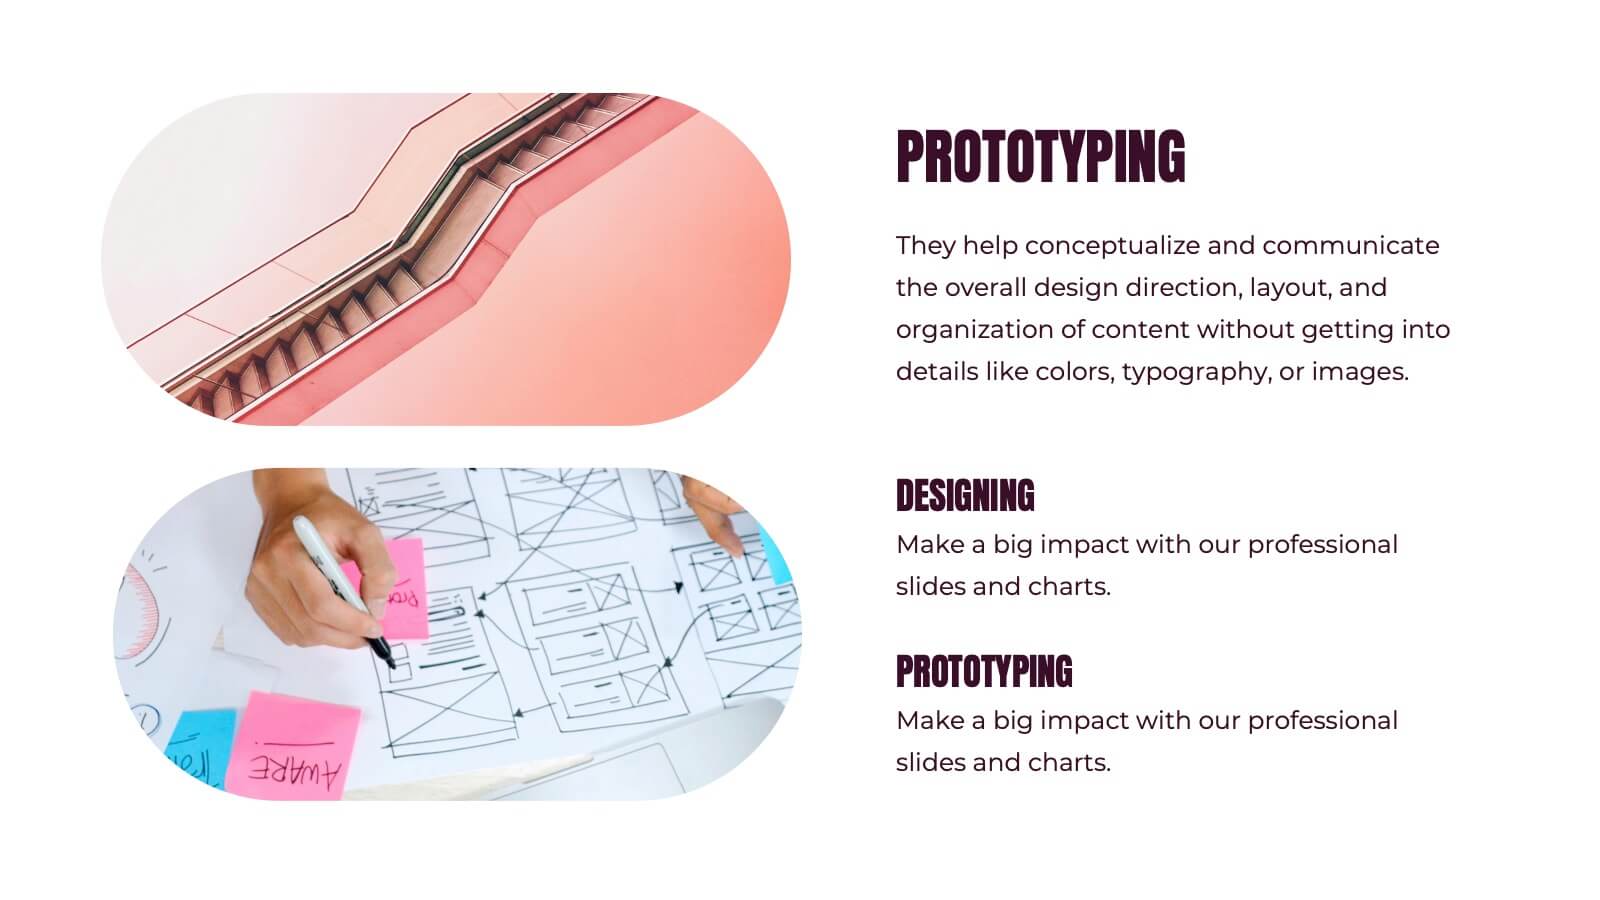
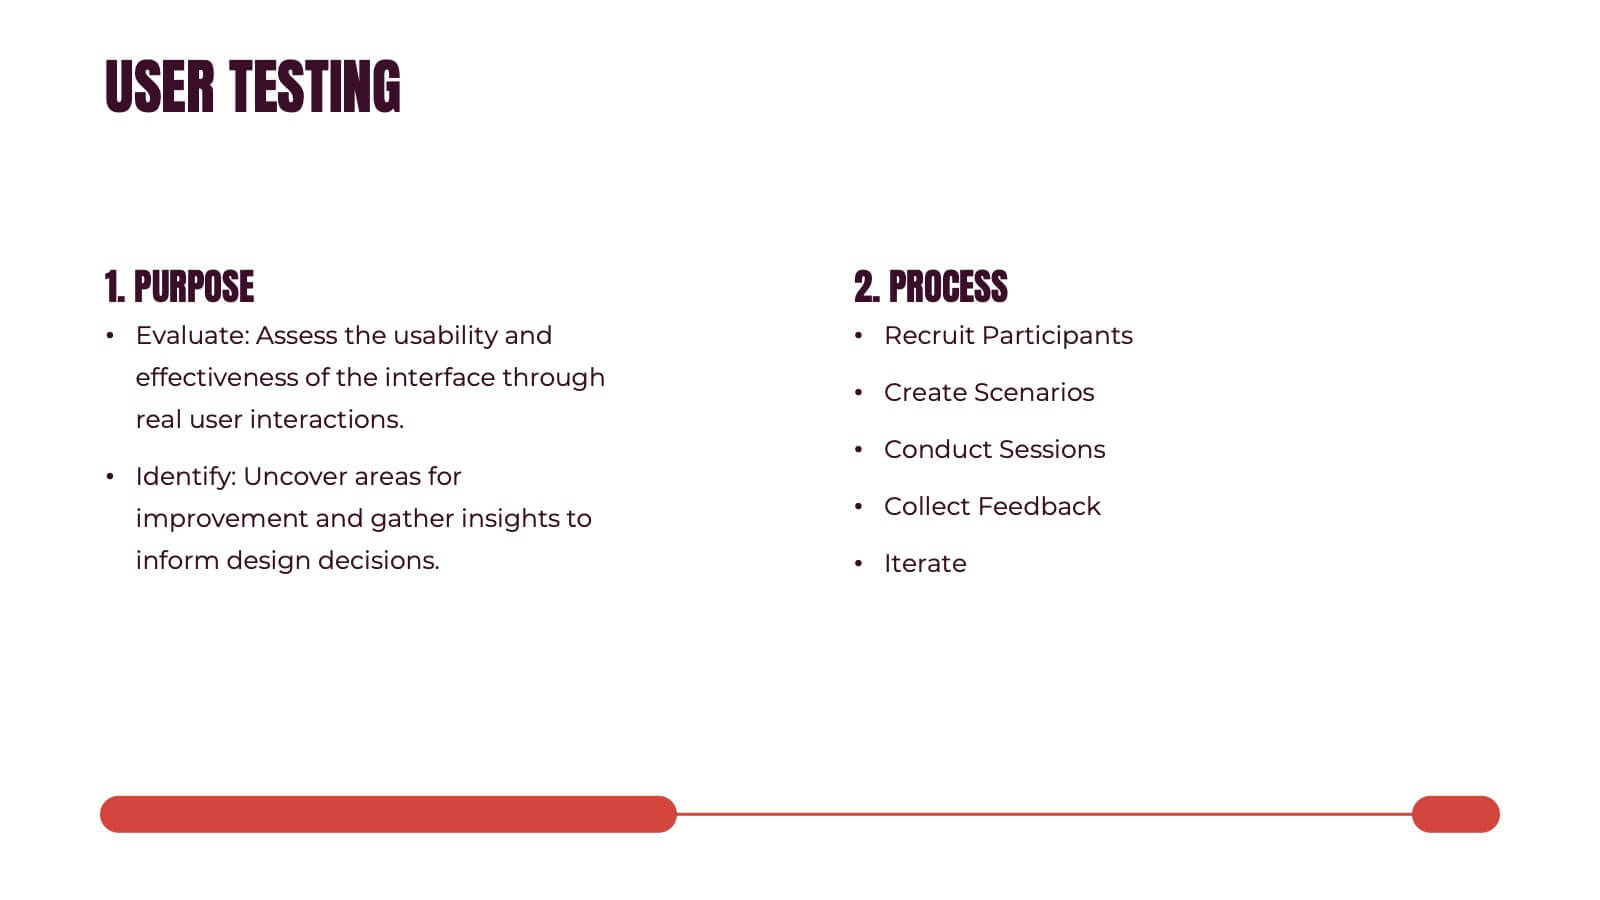
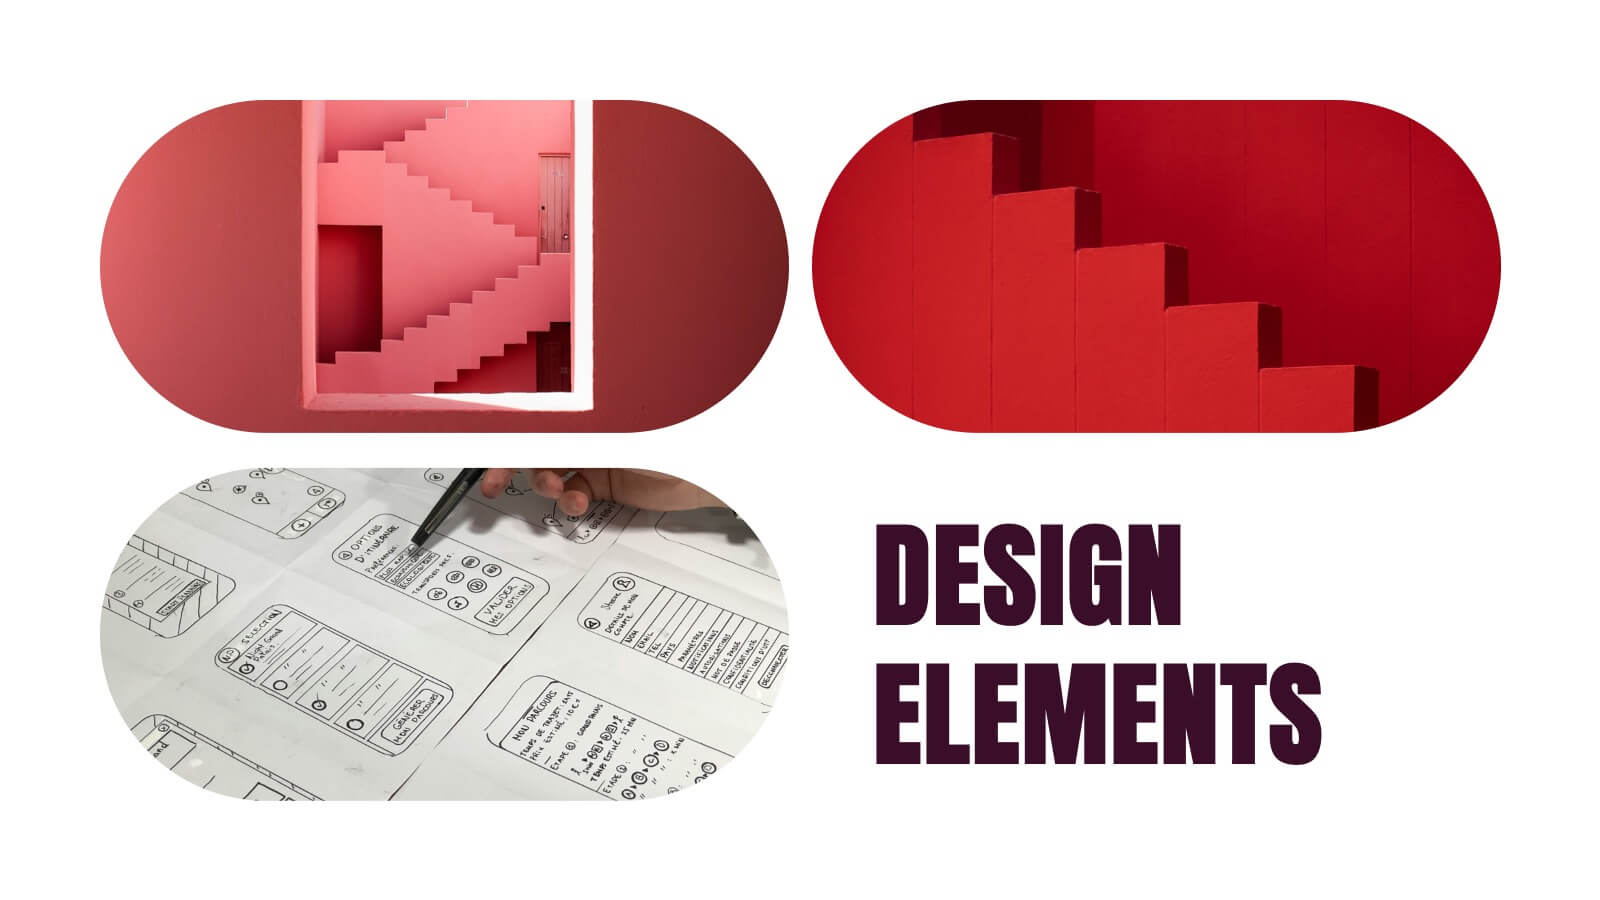
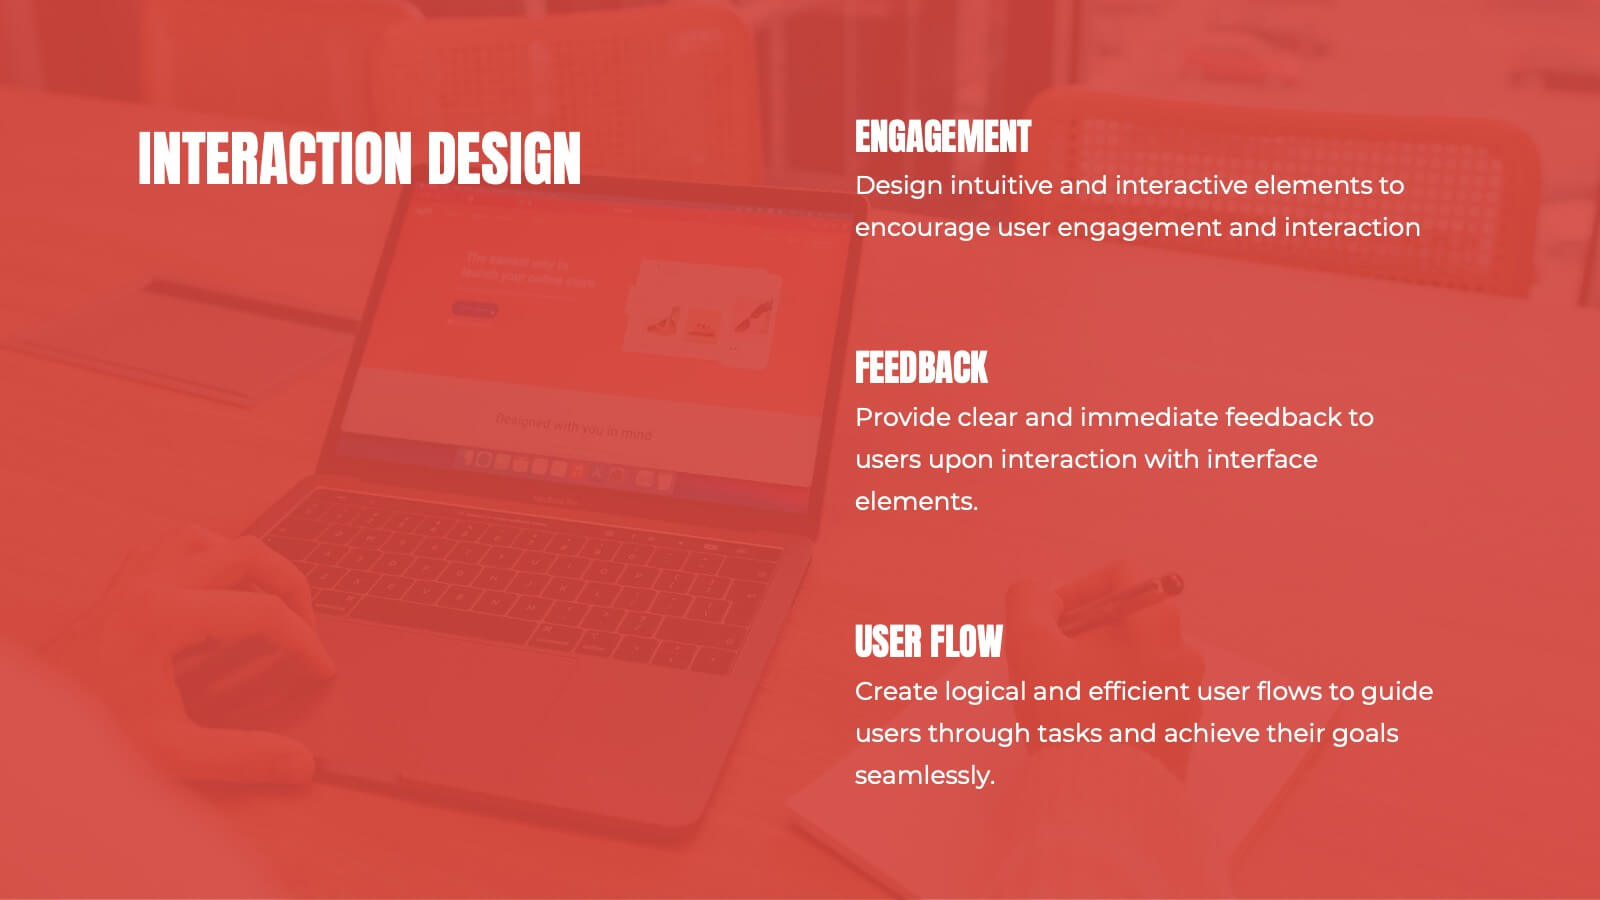
Kismet UX Design Presentation
Dive into the world of design with this stunning presentation template! Perfect for explaining user experience concepts, this template covers everything from wireframes to prototyping. It's designed to captivate your audience with visually engaging slides and clear, concise information. Compatible with PowerPoint, Keynote, and Google Slides for effortless use across platforms.


6 diapositivas
Customer Journey Map Presentation
Visualize the customer experience step-by-step with the Customer Journey Map Presentation. This sleek infographic helps you outline key touchpoints from awareness to post-purchase, making it ideal for marketing strategies, service design, or UX presentations. Fully editable and compatible with PowerPoint, Keynote, and Google Slides.


7 diapositivas
Work From Home Infographic Presentation Template
A Work From Home Infographic is a visual representation of data related to working from home. This infographic can be used as a guide to get you through some of the best opportunities available. Use this template to get the necessary tools to start working from home. Use this infographic to show your audience how many people work from home by adding statistics, tips and interesting facts. This template is designed to effectively communicate complex information in a simple format, making it great for exploring the topic of working from home. This is a perfect way to promote your business!


8 diapositivas
Market Research Survey Analysis Presentation
Present your Market Research Survey Analysis with this visually engaging template, designed for clear data visualization and insights presentation. Featuring an intuitive infographic layout, this template allows you to highlight key survey findings, customer insights, and strategic takeaways. Fully customizable in PowerPoint, Keynote, and Google Slides, you can adjust colors, edit text, and modify icons to align with your business needs.


6 diapositivas
Market Trends Heat Map Visualization Presentation
Analyze market trends with an intuitive heat map infographic. This visualization helps identify patterns, strengths, and risks using color-coded data blocks. Perfect for financial analysis, competitive research, and industry forecasting. Fully customizable and compatible with PowerPoint, Keynote, and Google Slides for seamless integration into your presentations.


10 diapositivas
North America Editable Map Presentation
Transform your regional insights into a visually striking map that highlights data points and key locations across the United States. Ideal for showcasing market reach, demographic trends, or regional performance, this design blends clarity with professionalism. Fully compatible with PowerPoint, Keynote, and Google Slides for effortless editing and use.


6 diapositivas
Measuring User Experience with Smile Ratings Presentation
Visualize customer sentiment with this Smile Rating UX slide. Featuring vertical smile meter graphics with corresponding percentages and descriptions, it’s ideal for product feedback, service evaluations, or usability reports. Clearly distinguish satisfaction levels across three stages or categories. Fully customizable in PowerPoint, Keynote, and Google Slides.


7 diapositivas
Gap Analysis Skills Infographic
Gap analysis in a skills context is a process of evaluating the difference or "gap" between the current skills and competencies of an individual or a team and the desired or required skills for a particular role, project, or goal. This infographic template is a crucial tool for personal and professional development, talent management, and strategic planning within organizations. This captivating visual is designed to help individuals and organizations bridge the skills gap effectively. This infographic serves as a compass, guiding you through the essential steps needed to identify, analyze, and close the skills gaps within your organization.


8 diapositivas
Vision-Oriented Goal Roadmap Presentation
Achieve alignment with the Vision-Oriented Goal Roadmap Presentation. Featuring a clear bullseye target and directional arrows, this layout highlights priority goals and action steps. Perfect for strategic planning, leadership briefings, or team objectives. Easily editable in PowerPoint, Keynote, and Google Slides to match your brand and vision.