


Características


¿Tienes alguna pregunta?
Recomendar


6 diapositivas
Customer Journey Map Presentation
Visualize the customer experience step-by-step with the Customer Journey Map Presentation. This sleek infographic helps you outline key touchpoints from awareness to post-purchase, making it ideal for marketing strategies, service design, or UX presentations. Fully editable and compatible with PowerPoint, Keynote, and Google Slides.


5 diapositivas
Investment Opportunity Business Case
Visualize the value behind your proposal with this key-themed layout, ideal for presenting compelling reasons to invest. Each section highlights a unique point, making it easy to walk stakeholders through critical benefits and insights. Fully editable and compatible with PowerPoint, Keynote, and Google Slides.


5 diapositivas
New Hire Orientation Program
Welcome new employees with confidence using the New Hire Orientation Program Presentation. This step-by-step slide is designed to outline your company’s onboarding journey in five clear, structured stages. With labeled “Step 01” through “Step 05” banners, icon placeholders, and editable text boxes, this template is ideal for HR teams, managers, or team leads introducing company values, processes, or benefits. Available in both full-color and progressive highlight variations, it's fully customizable in PowerPoint, Keynote, and Google Slides.


5 diapositivas
Long-Term Strategy Slide Presentation
Ignite big ideas with a bold, forward-moving layout that makes long-range goals feel inspiring and achievable. This presentation helps you outline future plans, key milestones, and strategic priorities with clarity and visual impact. Easy to edit and fully compatible with PowerPoint, Keynote, and Google Slides.


6 diapositivas
IT Architecture System Infographic
IT architecture, referred to as information technology architecture, is a structured framework that defines how an organization's technology systems, applications, processes, and data interact and work together to support its business goals and objectives. This infographic template visually explains the components and structure of an IT architecture system within an organization. The visuals are included to simplify your technical concepts and guide your viewers through the intricacies of IT. This infographic can be customized to fit the specific needs of different organizations. Compatible with Powerpoint, Keynote, and Google Slides.


5 diapositivas
Defining Project Scope Presentation
Clearly outline project goals with the Defining Project Scope Presentation template. This step-by-step visual guide helps teams map out project objectives, key milestones, and deliverables in an organized manner. Perfect for project managers, business analysts, and consultants looking to present scope definitions effectively. Fully editable in PowerPoint, Keynote, and Google Slides for easy customization.


4 diapositivas
Financial Budget Forecasting Presentation
Predict and manage your financial future with our 'Financial Budget Forecasting' template, perfect for visualizing quarterly budget allocations and expectations. This versatile tool aids in creating clear, concise, and visually engaging financial presentations, and is compatible with PowerPoint, Keynote, and Google Slides, making it a must-have for finance professionals and budget planners.


6 diapositivas
Growth Chart Infographic
A growth chart is a visual representation that shows the progress of an individual's growth over time. This infographic template is a visual representation that illustrates the growth and progress of various elements over time. These infographic charts are important tools to monitor growth patterns and help detect any potential issues. This growth chart infographic helps convey trends and insights in a clear and engaging manner. This template is compatible with Powerpoint, Keynote, and Google Slides. Allowing you to keep the design clean, easy to understand, and aligned with the message you want to convey.


5 diapositivas
Revenue and Cost Breakdown Presentation
Present your financial insights with clarity using this 4-point revenue and cost analysis layout. Ideal for summarizing earnings, expenses, or budget comparisons. The circular icon design keeps information clean and engaging. Fully customizable in Canva, PowerPoint, or Google Slides to fit your brand’s data and presentation needs.


6 diapositivas
12-Month Business Timeline Presentation
Jump into a year of planning with a crisp, colorful layout that makes every month feel organized and actionable. This presentation helps you map goals, deadlines, and initiatives across all four quarters, offering a clear structure for business planning and progress tracking. Fully compatible with PowerPoint, Keynote, and Google Slides.


5 diapositivas
Healthcare Services and Medical Systems Presentation
Visualize your healthcare processes with this hexagonal layout designed for medical topics. Each section highlights key service areas, ideal for presenting hospital systems, diagnostics, or treatment paths. With five editable steps, it's perfect for health professionals, researchers, or medical trainers using PowerPoint, Keynote, or Google Slides.


7 diapositivas
Risk Prevention and Safety Management Presentation
Elevate your organization's approach to hazard awareness with our 'Risk Prevention and Safety Management' presentation template. Designed to aid in illustrating essential safety measures and risk management tactics, this template is a must-have for training sessions and workshops. Fully compatible with PowerPoint, Keynote, and Google Slides, it's ideal for ensuring workplace safety and compliance.


4 diapositivas
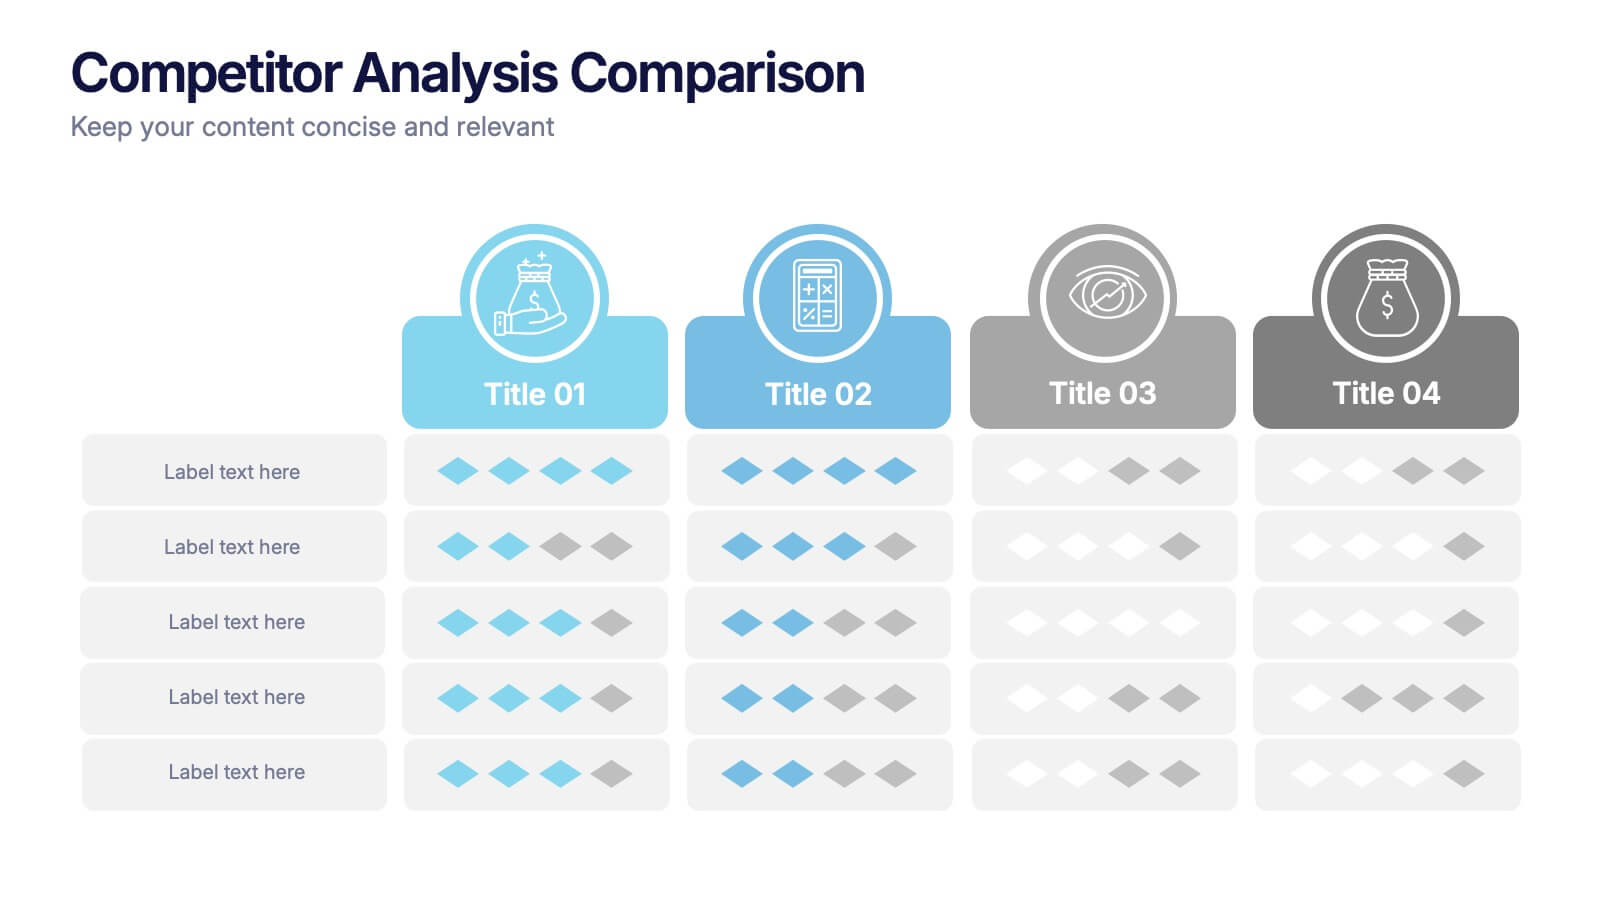
Competitor Analysis Comparison Presentation
Quickly evaluate strengths and weaknesses across your market landscape with this Competitor Analysis Comparison Presentation. Featuring clean tables, icons, and rating visuals, it's ideal for highlighting where your brand stands out. Fully editable in PowerPoint, Keynote, and Google Slides.


7 diapositivas
Skills Gap Report Infographic
A skills gap analysis is a systematic assessment of the difference between the skills or competencies that an individual, a team, or an organization currently possess and the skills they need to meet specific objectives or requirements. This infographic template is meticulously designed to present a deep analysis of the skills gap within an organization or industry, offering solutions and pathways to cultivate a skilled workforce. Compatible with Powerpoint, Keynote, and Google Slides. Highlight the skills that are in high demand, providing a clear understanding of where the gap exists.


6 diapositivas
Stock Market Predictions Infographic
Stock market predictions refer to attempts to forecast the future performance of stock prices and overall market trends. This infographic template visually presents insights and predictions about the future performance of the stock market, based on various indicators and factors. This template involves evaluating a company's financial health, earnings, revenue, assets, liabilities, and management to determine its intrinsic value. Fully customizable and compatible with Powerpoint, Keynote, and Google Slides. You can choose a color palette that conveys the stock market and professionalism, typically using shades of blue and red.


4 diapositivas
Project Planning in Four Steps Presentation
Streamline your workflow with the Project Planning in Four Steps presentation. This structured slide layout simplifies task organization, milestone tracking, and goal-setting into a clear, four-step process. Perfect for business strategies, project management, and team collaboration. Fully customizable and compatible with PowerPoint, Keynote, and Google Slides for effortless integration.


7 diapositivas
Time Management Goal Infographic
Time management is the process of organizing and planning how to divide your time between specific activities effectively and efficiently to achieve desired goals or outcomes. This infographic template is designed to empower you in mastering time, optimizing productivity, and seizing the day. This infographic provides a visually striking way to illustrate time management strategies, tips, and hacks for anyone looking to make the most of their time. Fully customizable and compatible with Powerpoint, Keynote, and Google Slides. This showcases time-bound tasks, emphasizing the importance of setting deadlines and managing tasks within periods.