


Características


¿Tienes alguna pregunta?
Recomendar


7 diapositivas
Six Sigma Project Infographic
Six Sigma is a data-driven methodology and quality improvement approach that aims to eliminate defects and reduce variation in processes. This infographic template is a visual representation of the Six Sigma methodology, which is a data-driven approach used by organizations to improve their processes and reduce defects. The infographic aims to explain the key concepts and steps involved in the Six Sigma process in a clear and concise manner. It is designed to help individuals understand the methodology and its benefits, and can be used as a reference tool for Six Sigma practitioners and those interested in process improvement.


21 diapositivas
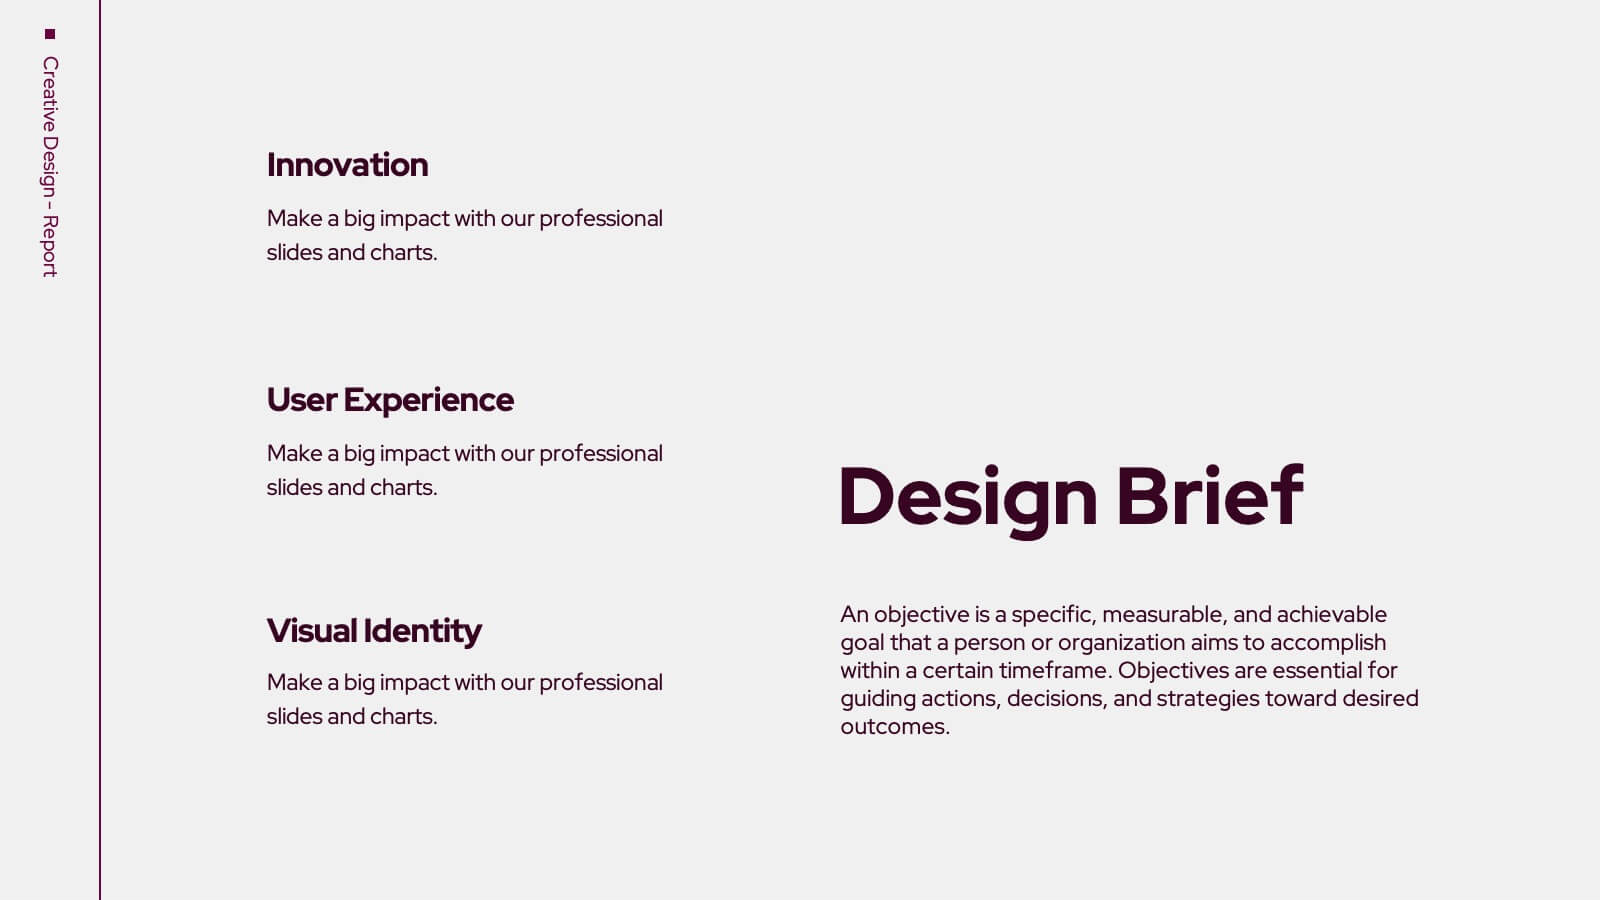
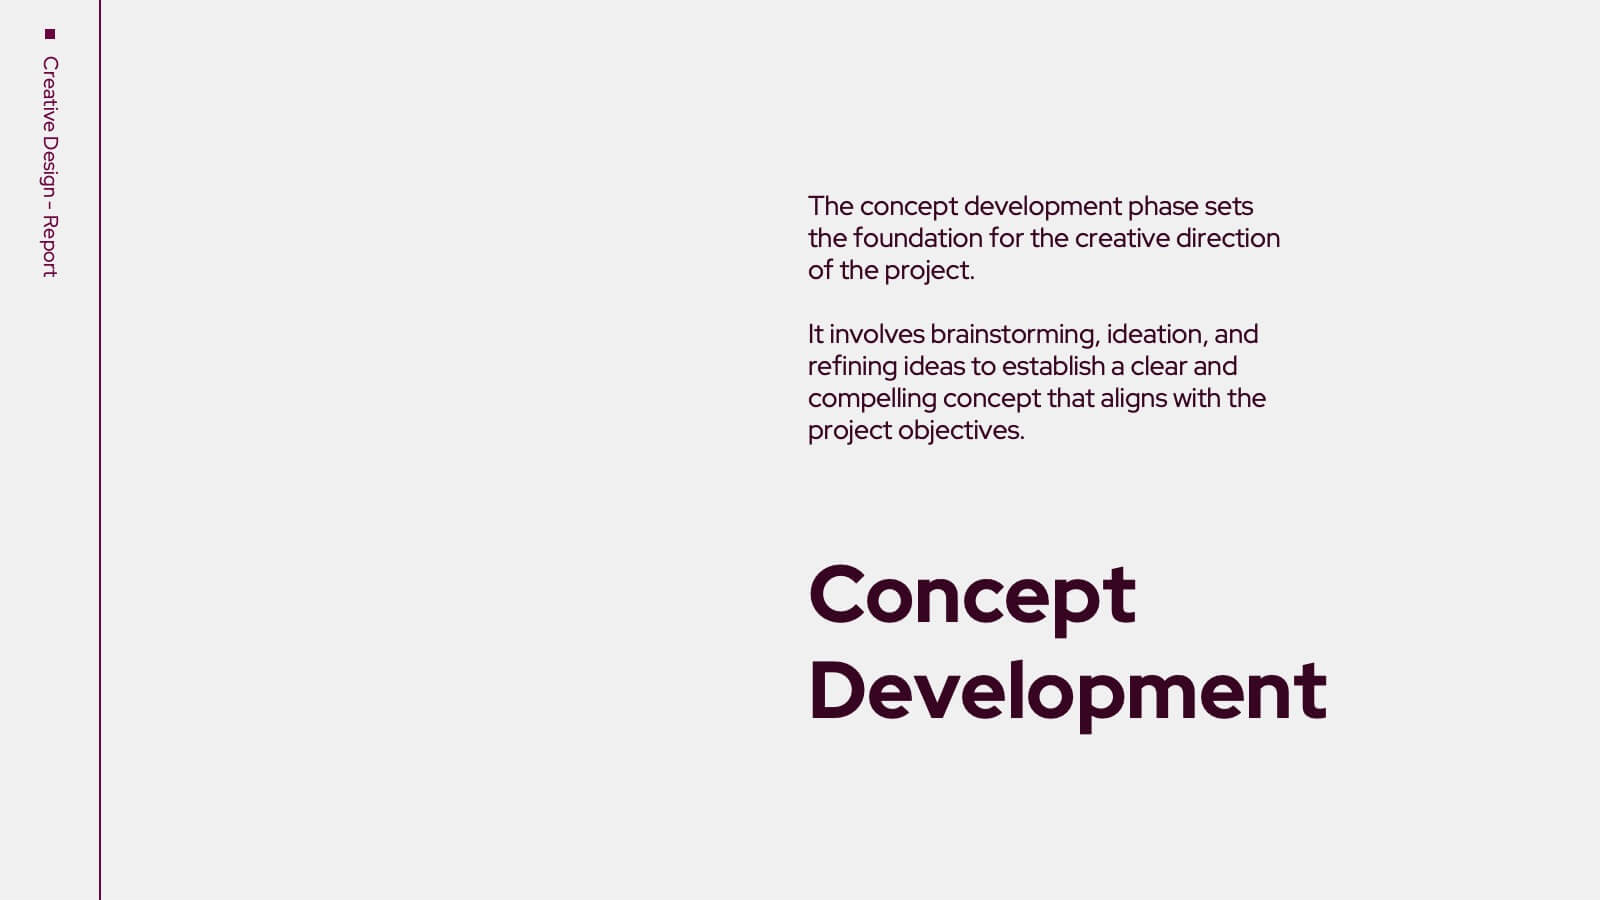
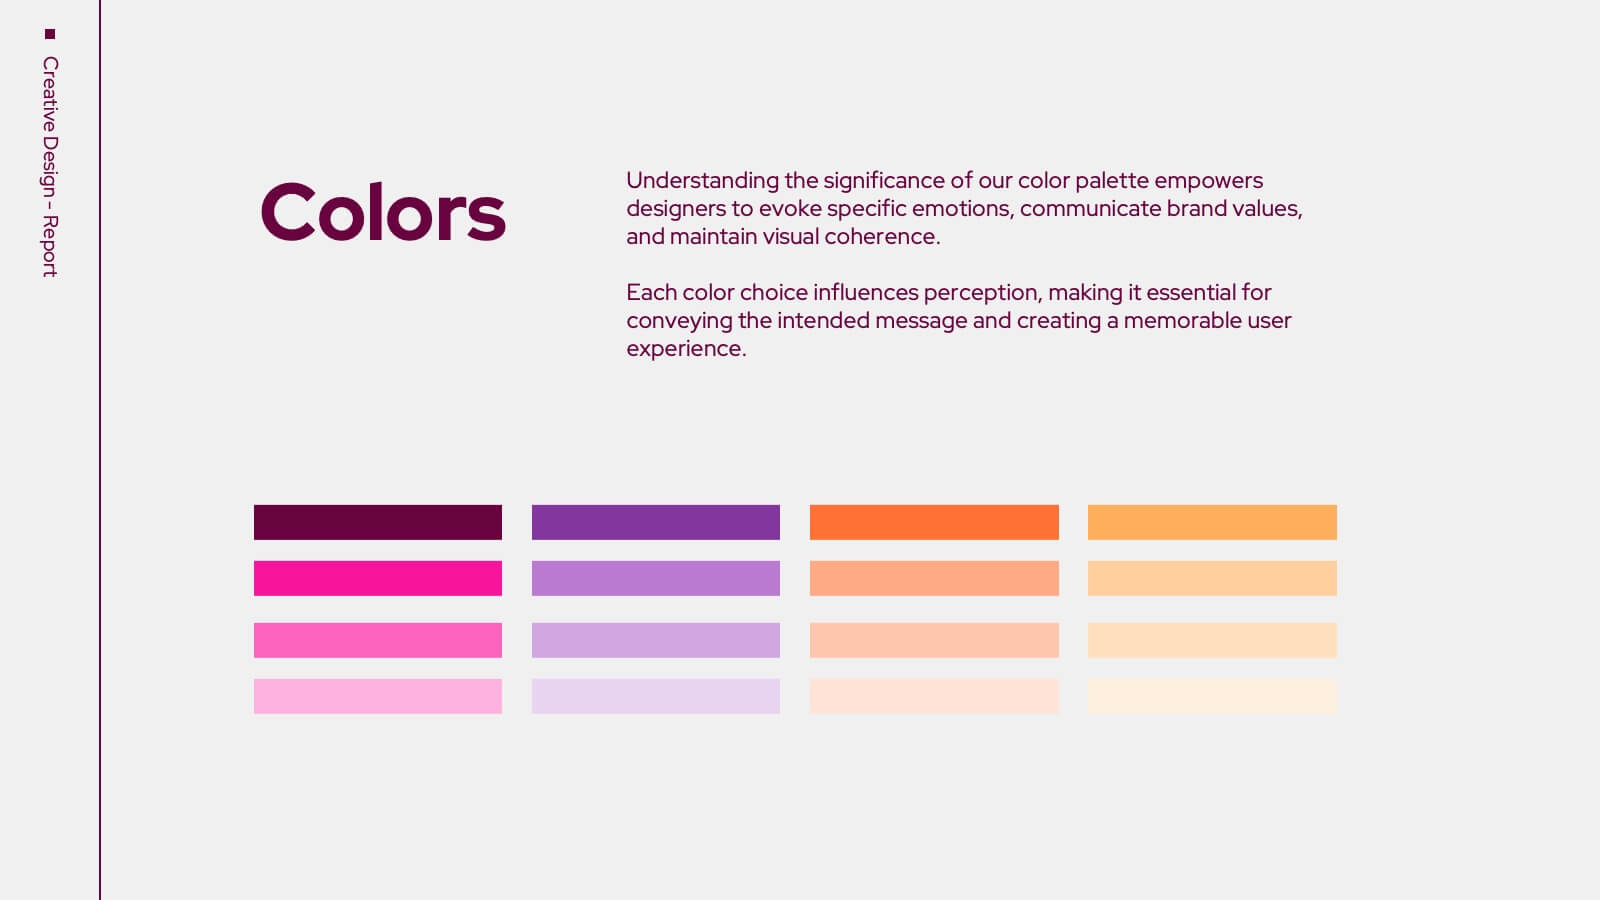
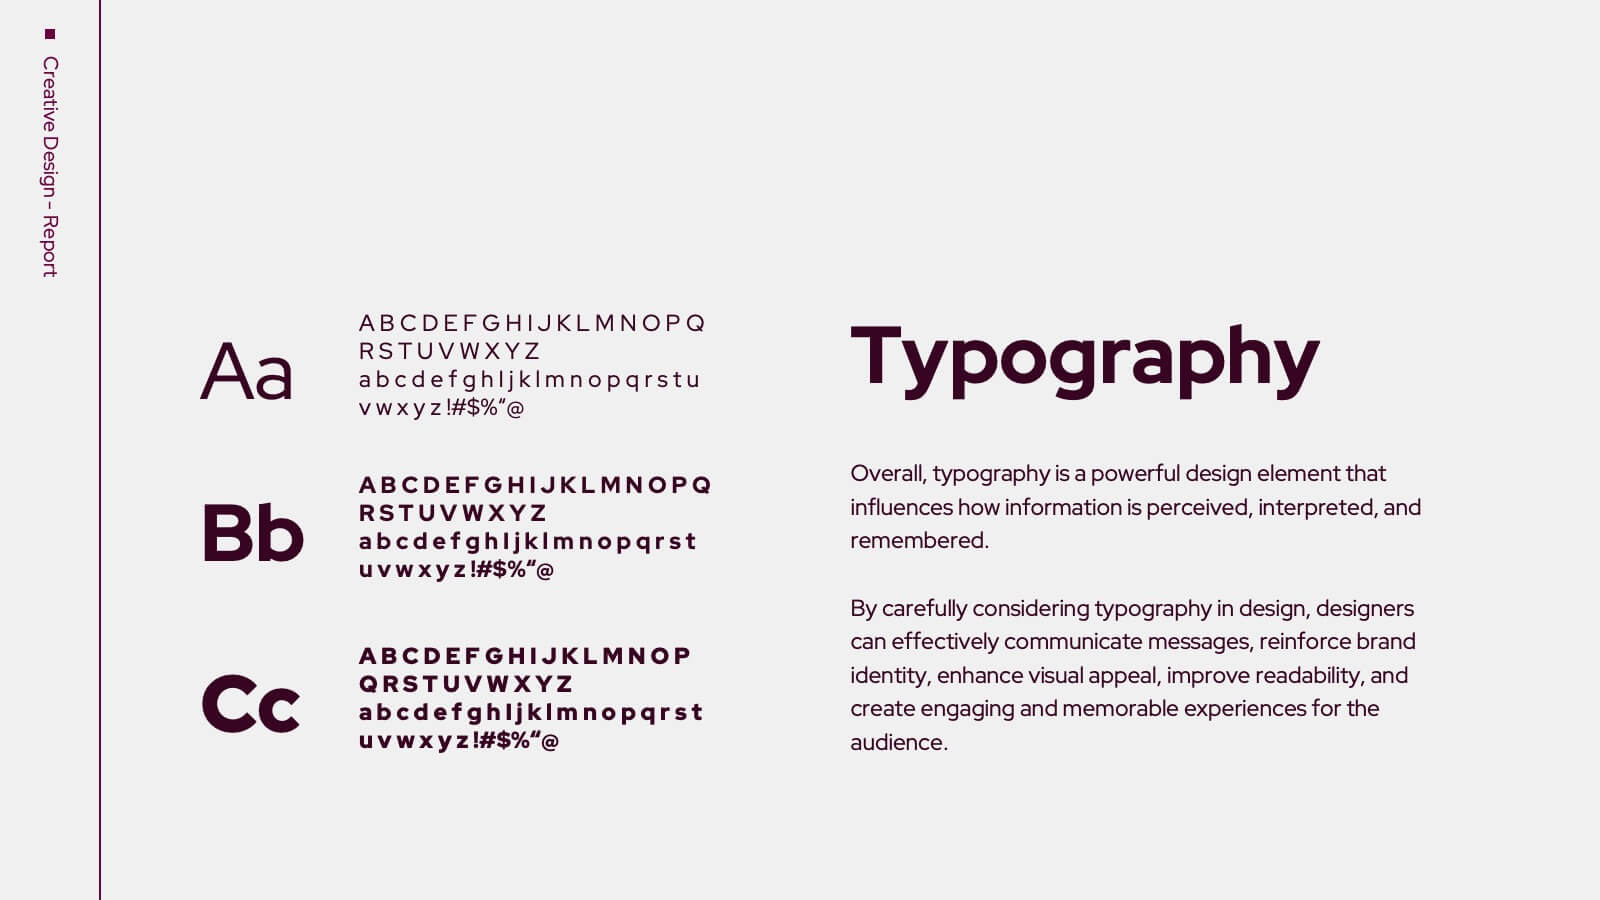
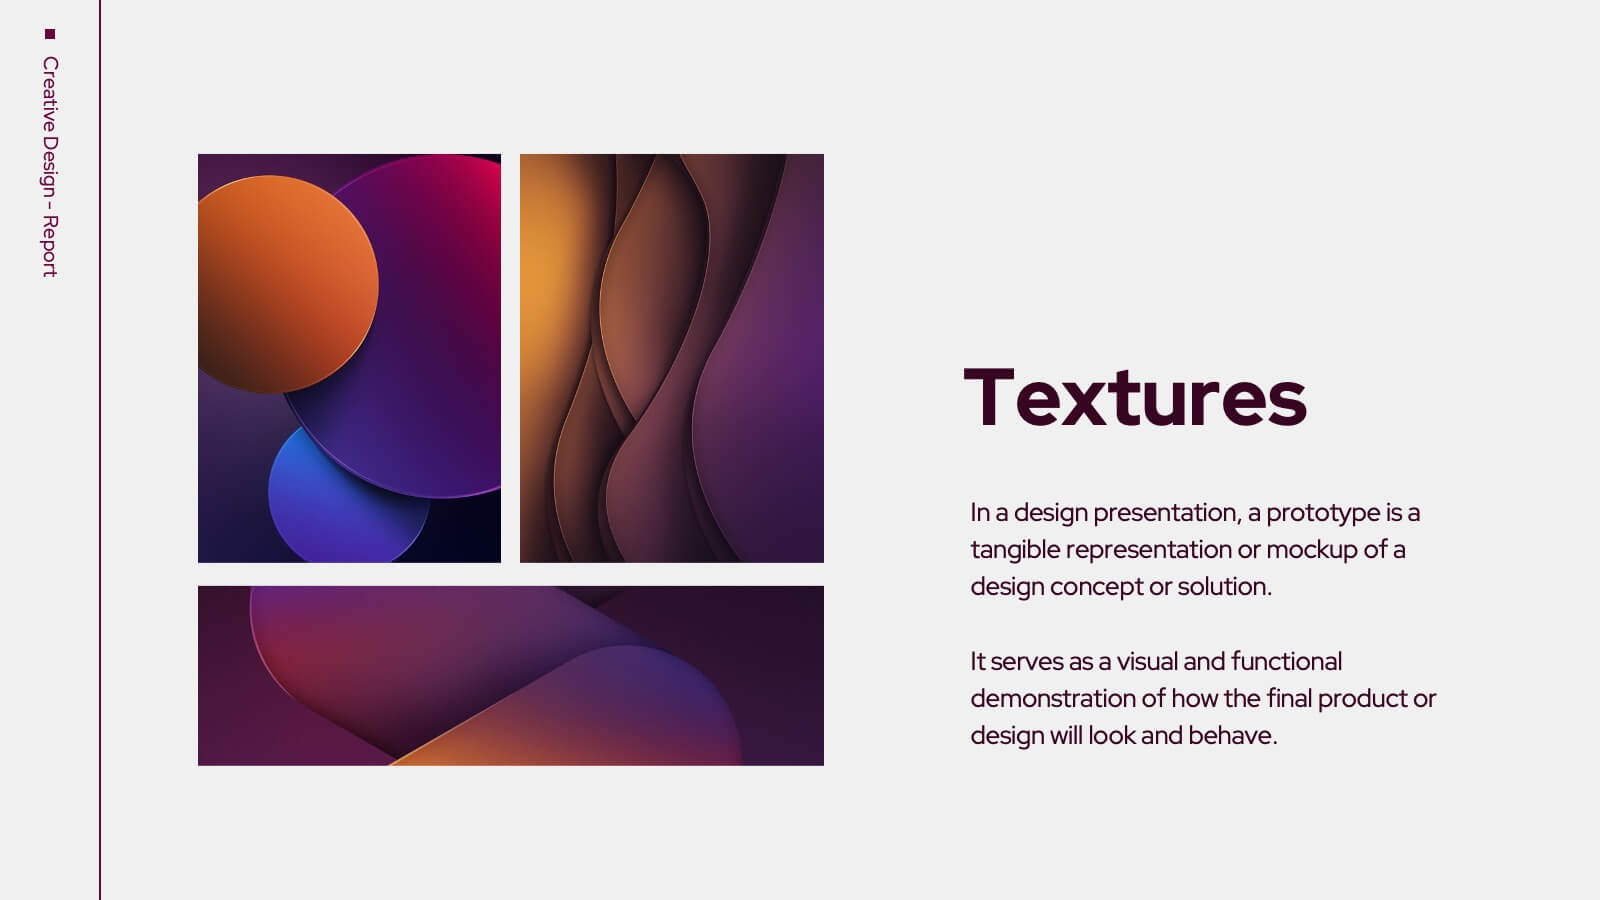
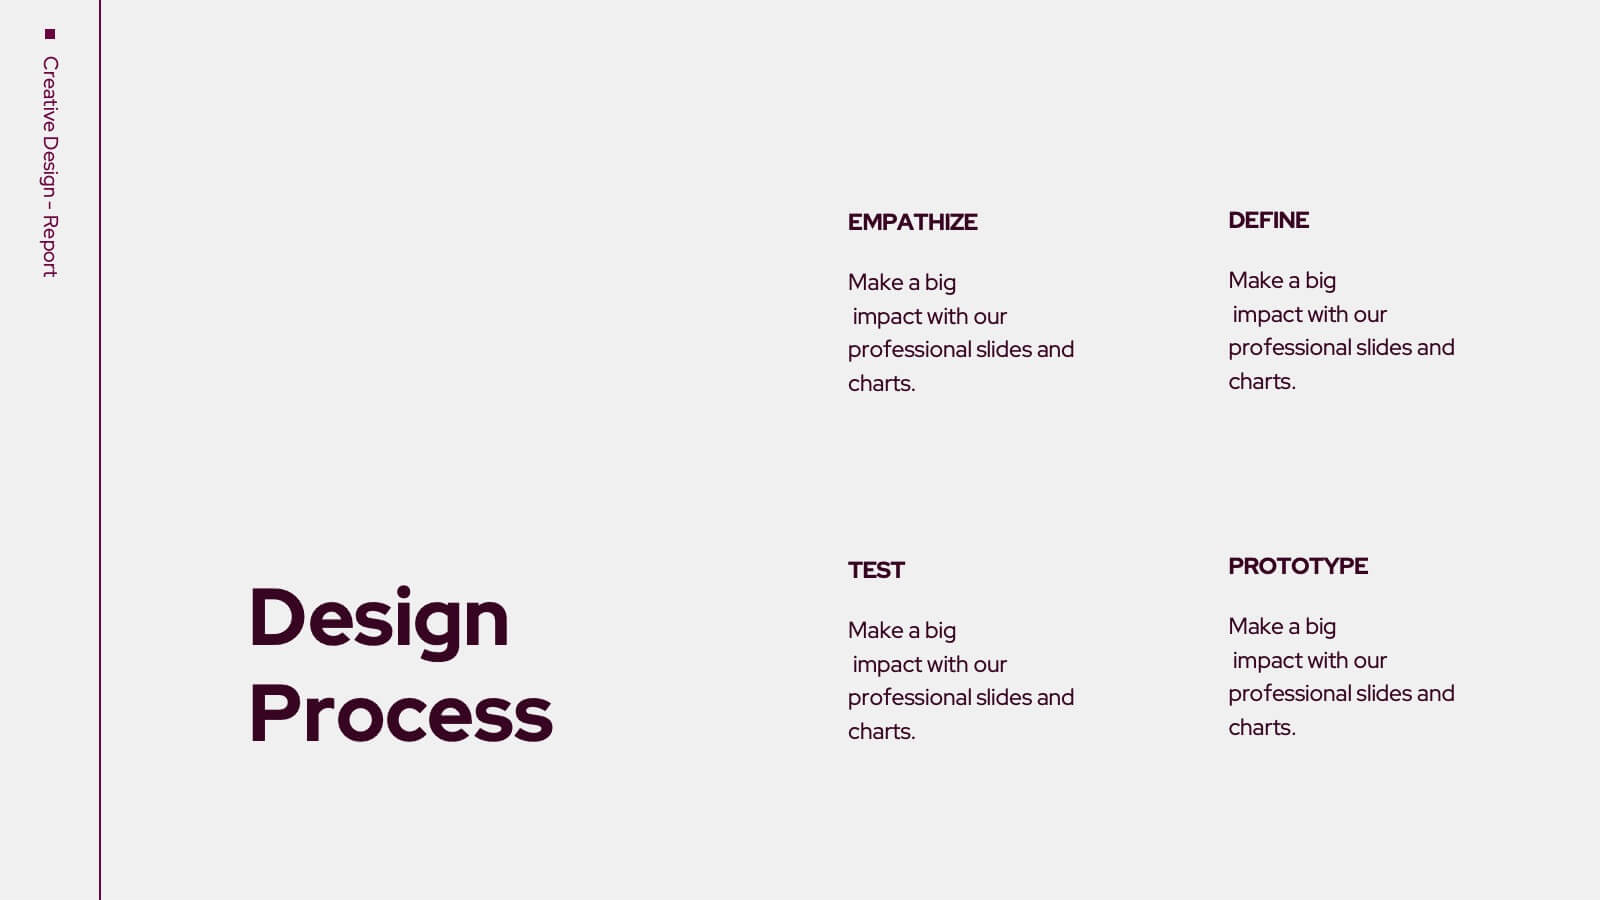
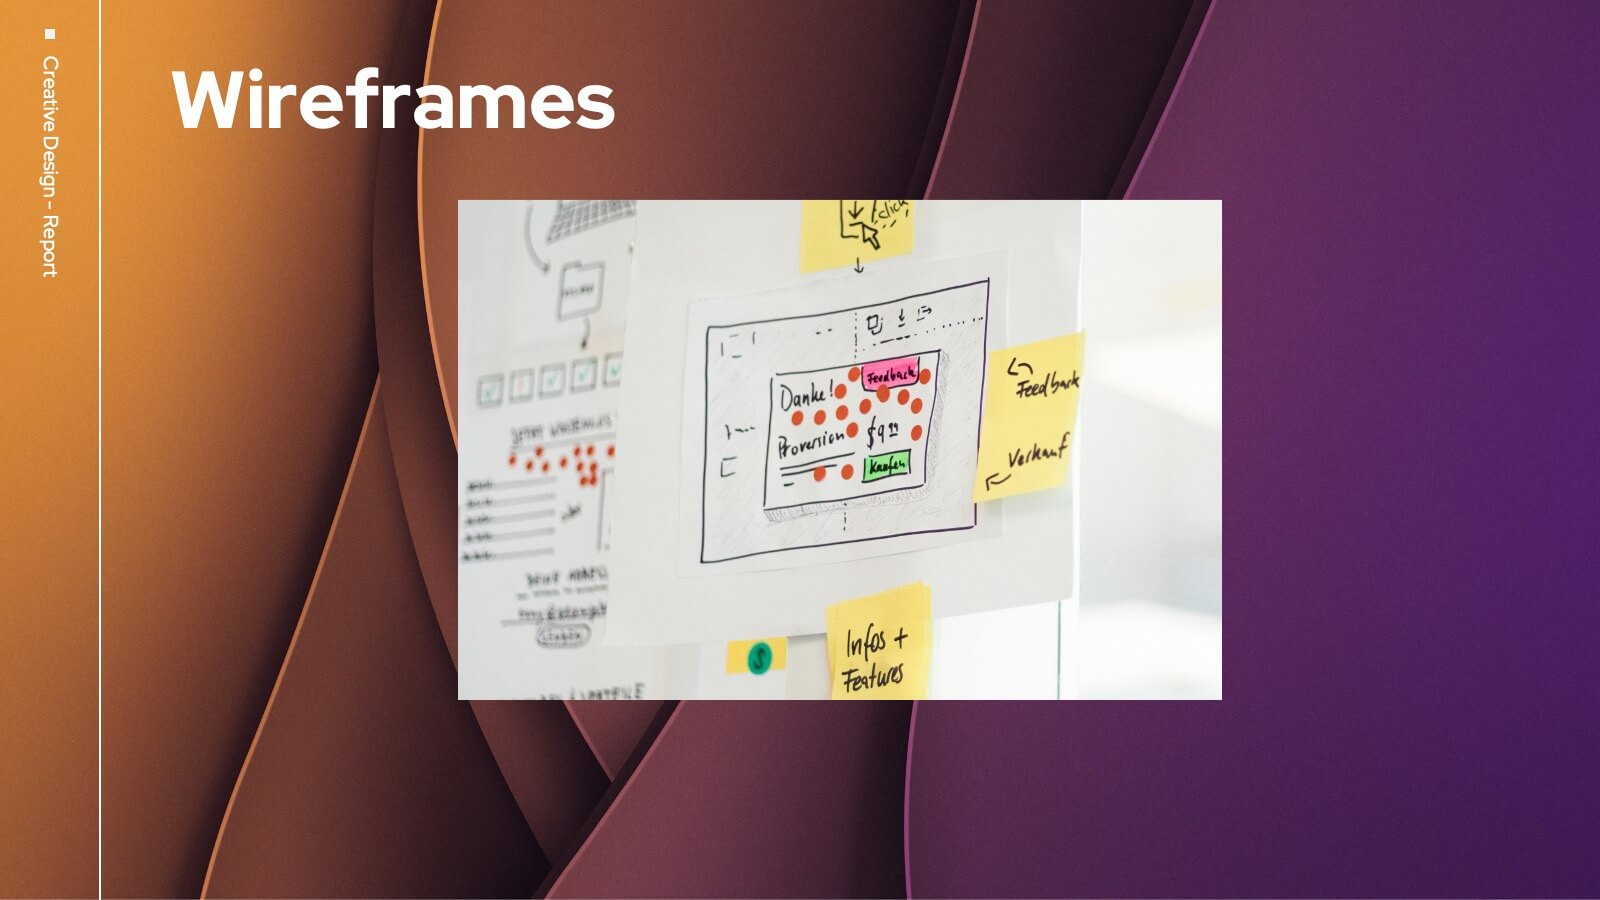
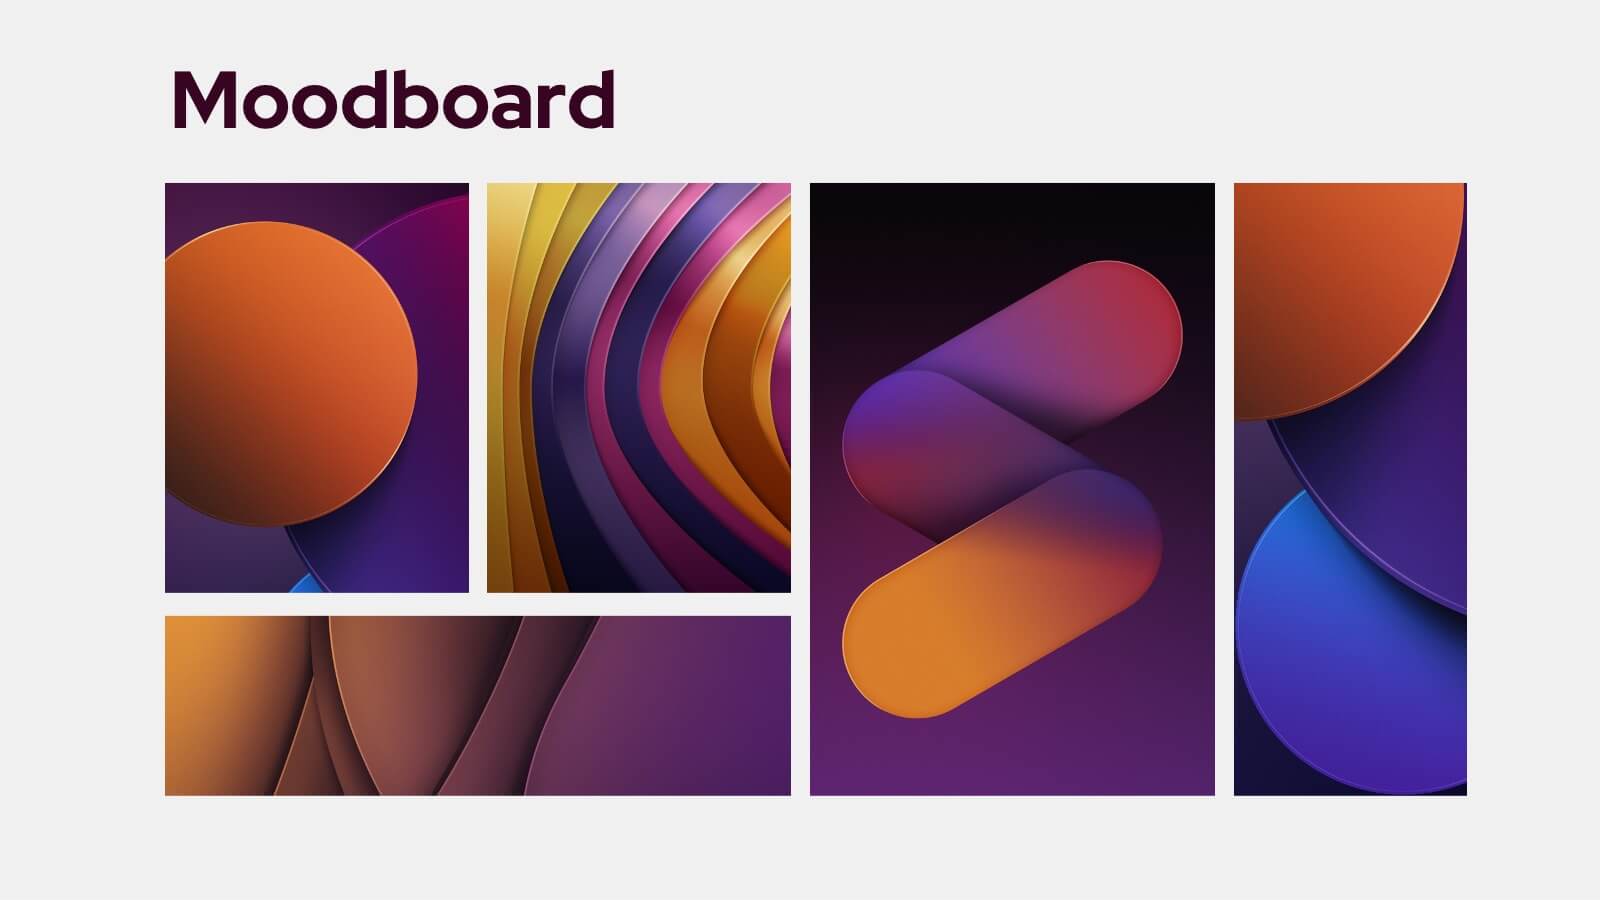
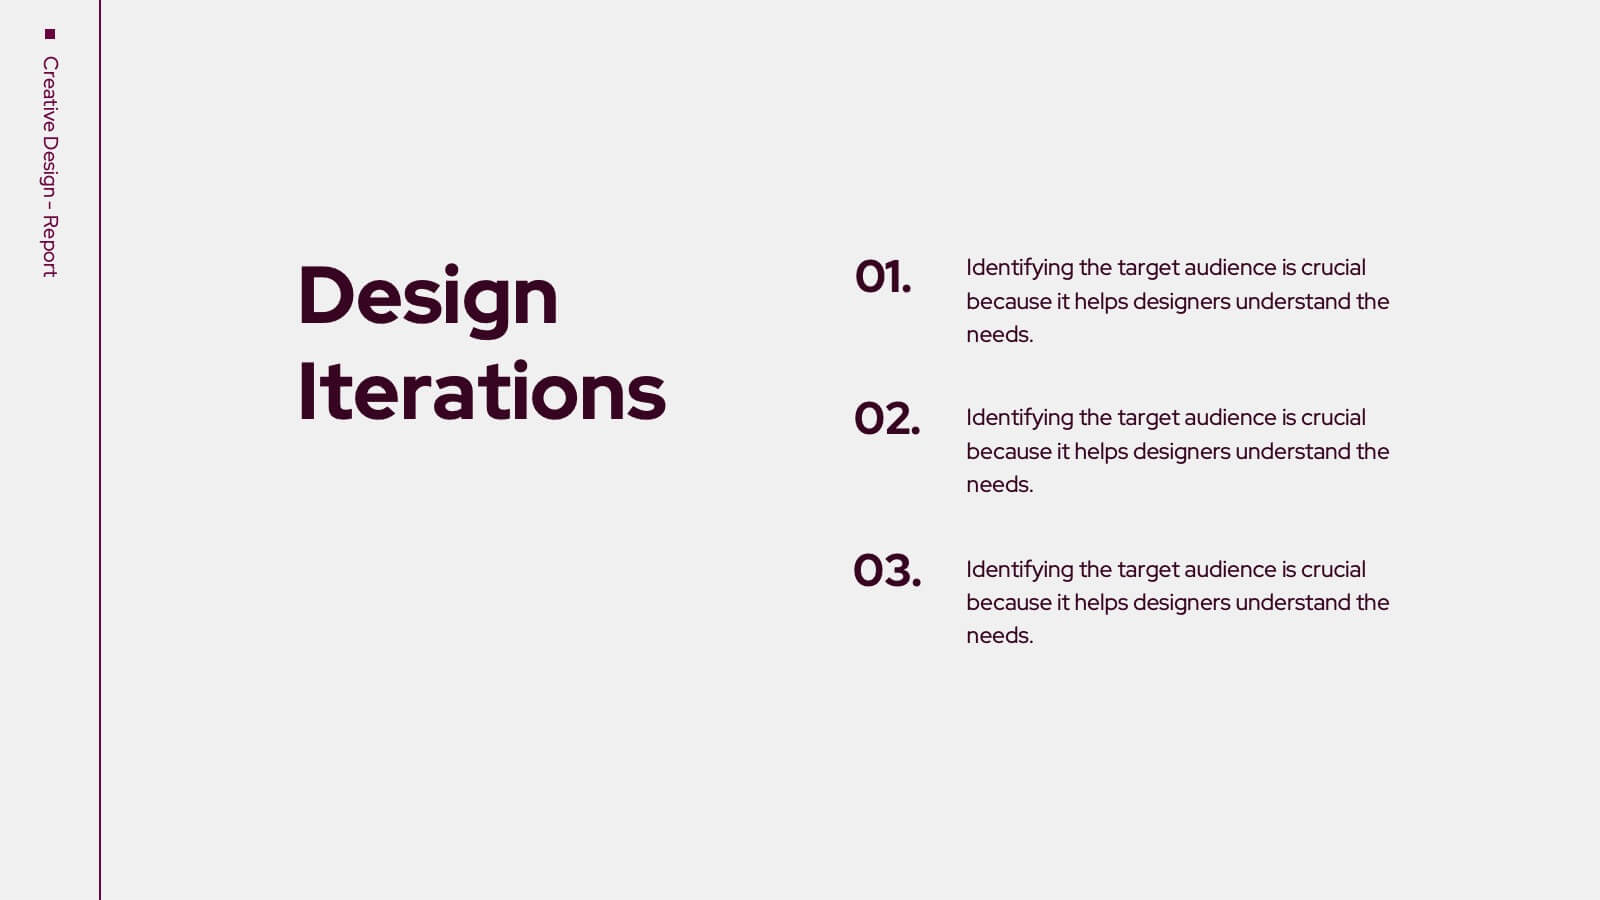
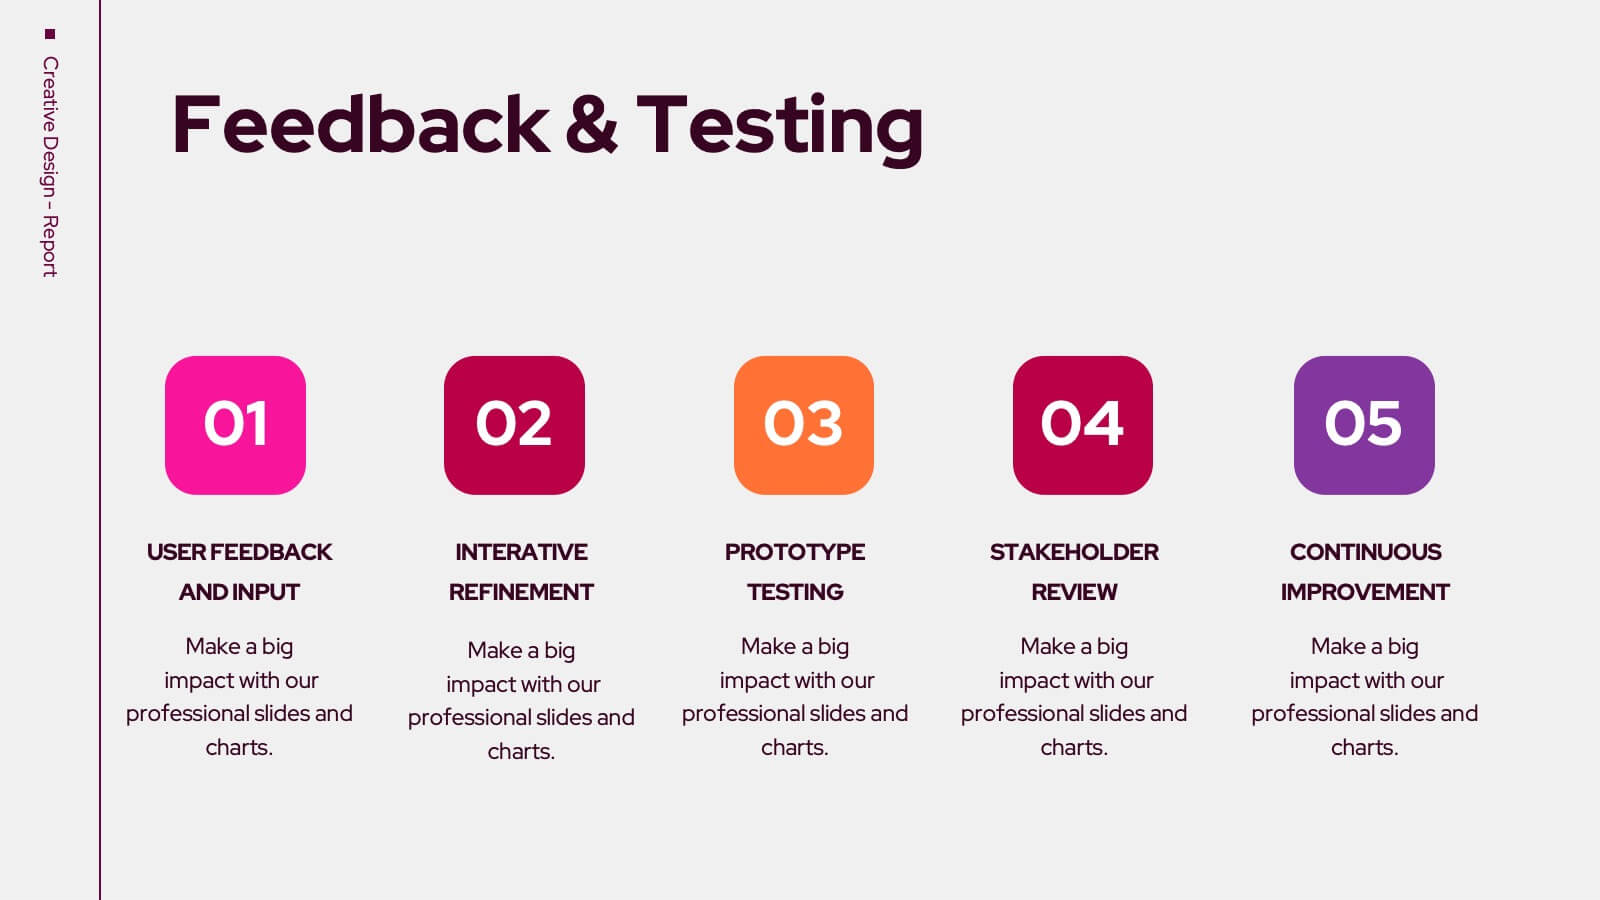
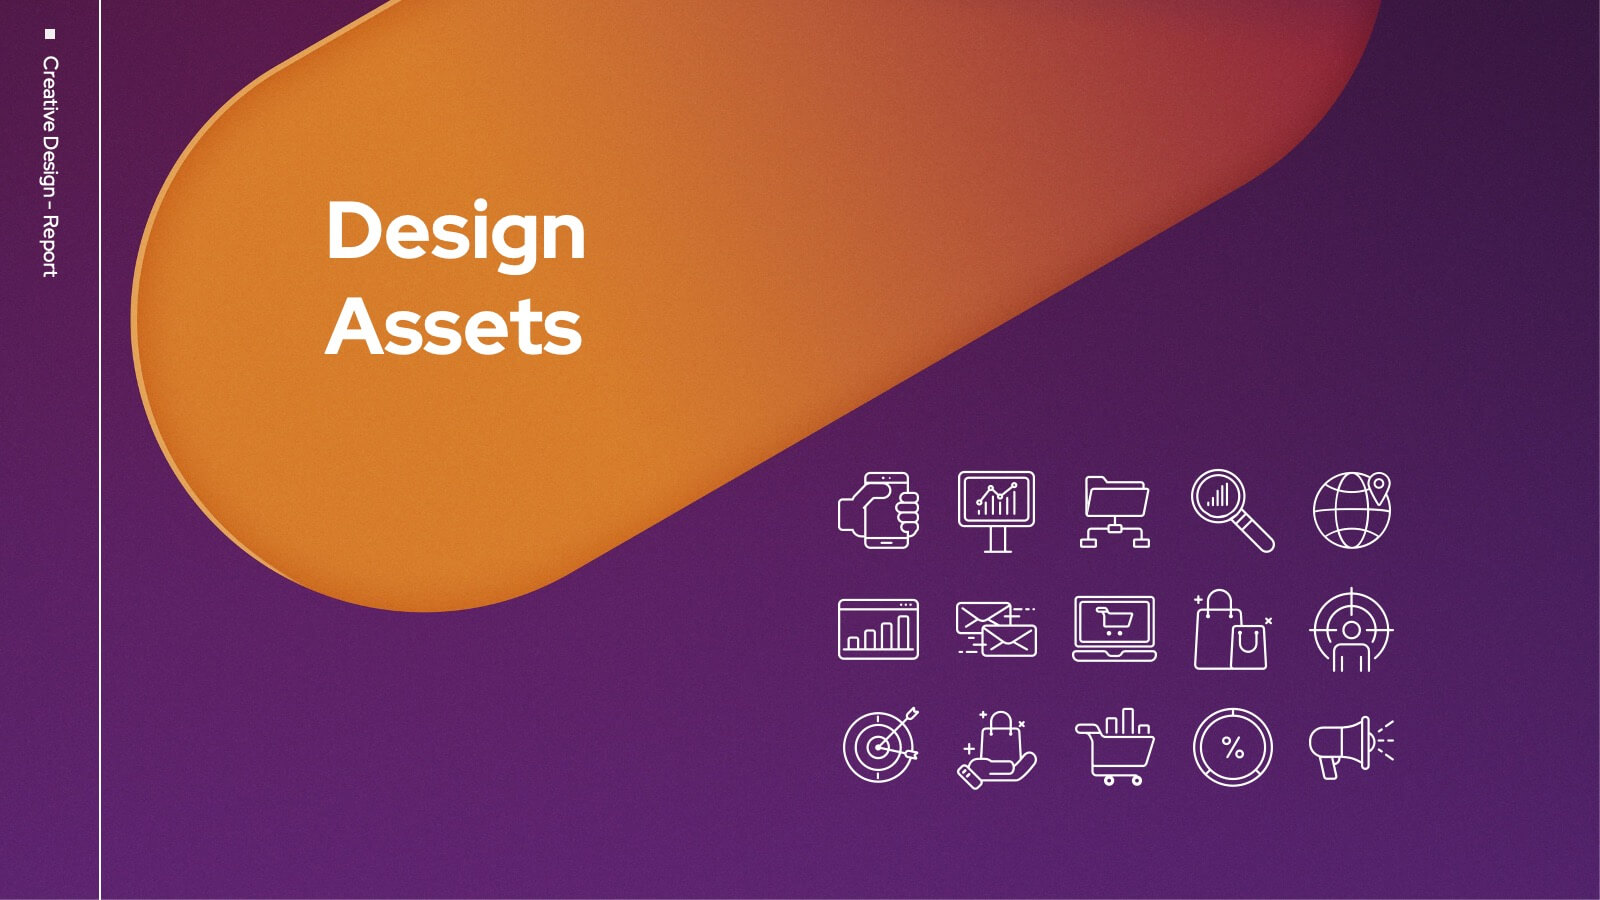
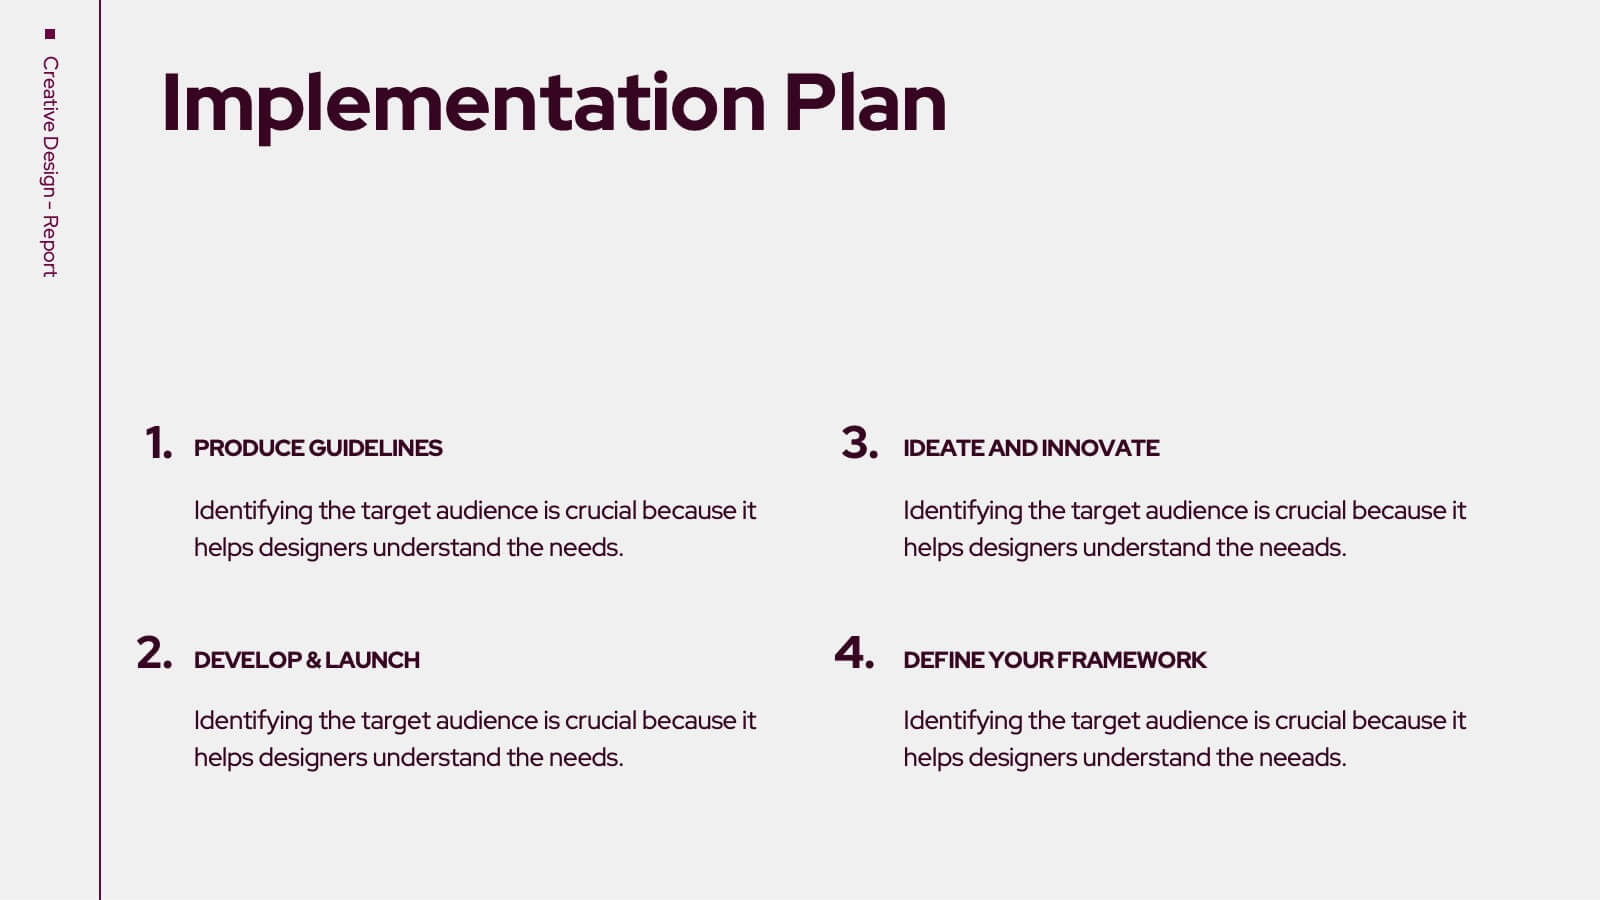
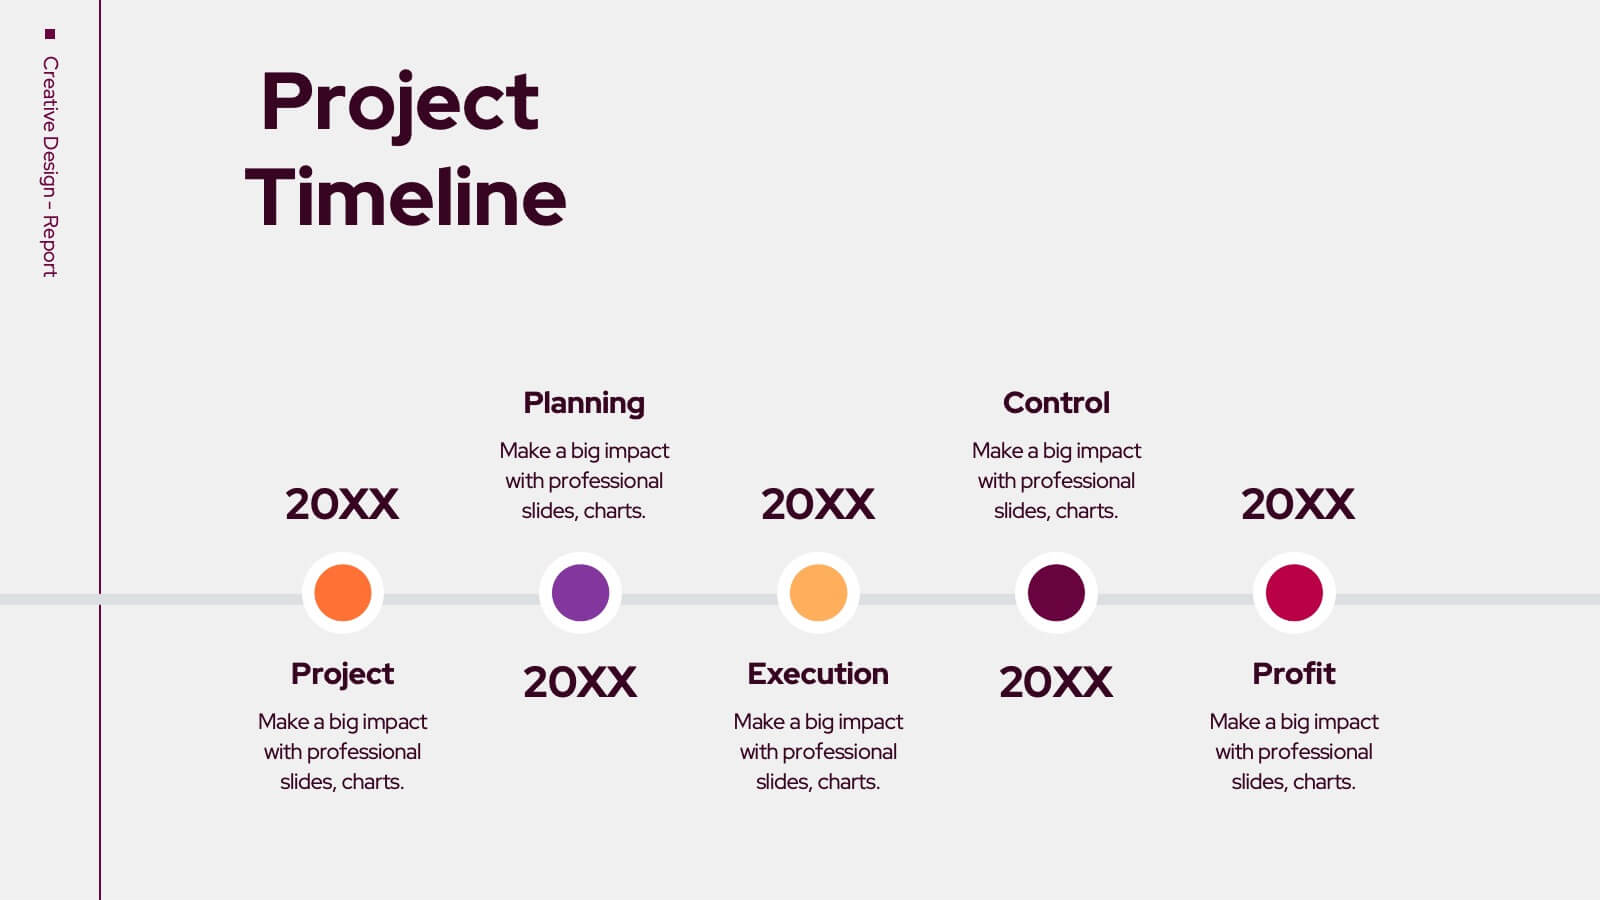
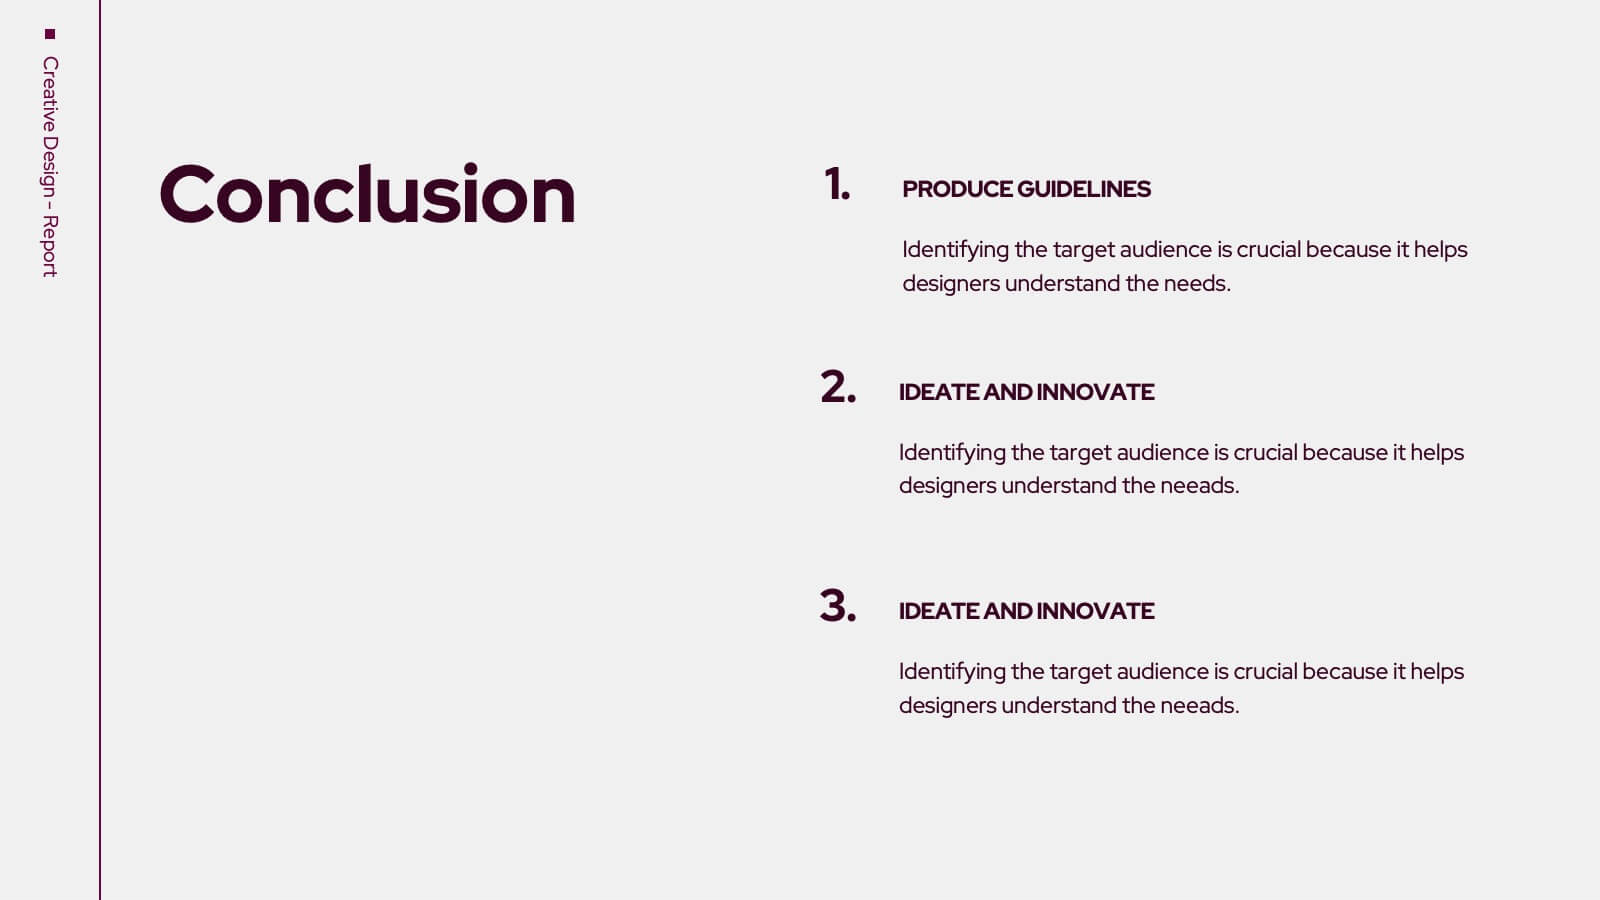
Trojan Creative Design Report Presentation
Unleash your creativity with this striking Trojan-inspired presentation template! Ideal for showcasing your design projects, this presentation enables you to highlight key concepts, inspirations, and visual elements effectively. Its engaging layout ensures your ideas shine through, captivating your audience. Compatible with PowerPoint, Keynote, and Google Slides for seamless presentations.


5 diapositivas
Education Jobs Infographics
Education Jobs encompass a wide range of roles and responsibilities focused on providing education, training, and support to learners of all ages. This template is designed to showcase the diverse range of careers available in the education sector. Use this template to inform and inspire individuals interested in pursuing a career in education, whether as teachers, administrators, counselors, researchers, or other specialized roles. With its visually engaging design and comprehensive information, this template will help your audience navigate the world of education jobs and make informed career decisions.


4 diapositivas
Team Collaboration Strategy
Illustrate cross-functional teamwork with this visually engaging slide. Featuring color-coded team clusters, it's perfect for showcasing group dynamics, collaborative workflows, or project responsibilities. Use this diagram to break down organizational units, collaboration models, or department contributions. Fully editable in PowerPoint, Keynote, and Google Slides.


7 diapositivas
Enterprise Governance Infographics
A Governance Infographic provides information about the principles and practices of governance, particularly in the context of organizations or institutions. This governance template can be used to cover a wide range of topics related to governance, including organizational structures, decision-making processes, risk management, compliance, and ethical standards. You can use this to include information on the roles and responsibilities of different stakeholders, such as board members, executives, and employees, as well as the policies and procedures that govern their interactions.


8 diapositivas
Brainstorming Visualization
Spark creativity with the Brainstorming Visualization Presentation—a dynamic diagram built to energize your ideation process. Featuring a lightning bolt cloud as the central symbol, this layout radiates out to four key thought nodes, each with space to highlight insights, solutions, or topics. Ideal for team ideation, strategic planning, or mind mapping. Fully editable in PowerPoint, Keynote, and Google Slides.


5 diapositivas
SWOT Matrix Diagram Presentation
Showcase key business insights with this SWOT Matrix Diagram Presentation. This clear 4-quadrant layout helps visualize your organization's Strengths, Weaknesses, Opportunities, and Threats, making it ideal for strategic planning, competitor analysis, or internal reviews. Each section includes icons and editable text placeholders for easy customization. Fully compatible with PowerPoint, Keynote, and Google Slides.


6 diapositivas
Conversion Funnel Stages Overview Presentation
Visualize user journeys with clarity using the Conversion Funnel Stages Overview Presentation. This funnel diagram template breaks down key conversion phases—from awareness to decision—into distinct, color-coded stages. Ideal for marketing reports, sales strategies, or product demos. Fully editable in PowerPoint, Google Slides, and Canva.


2 diapositivas
Business Self-Introduction Presentation
Introduce yourself with confidence using this Business Self-Introduction Slide. Perfect for networking, team meetings, and professional presentations, this template features a modern layout with a dynamic photo cutout, engaging visuals, and structured text areas. Fully customizable for PowerPoint, Keynote, and Google Slides, you can adjust colors, fonts, and content to reflect your personal or business identity.


4 diapositivas
Simple RACI Matrix Overview Presentation
Bring instant clarity to every role with a clean, puzzle-style layout designed to map responsibilities without confusion. This presentation helps teams outline who leads, supports, approves, and stays informed in any project, turning tasks into a simple visual grid. Fully editable and compatible with PowerPoint, Keynote, and Google Slides.

20 diapositivas
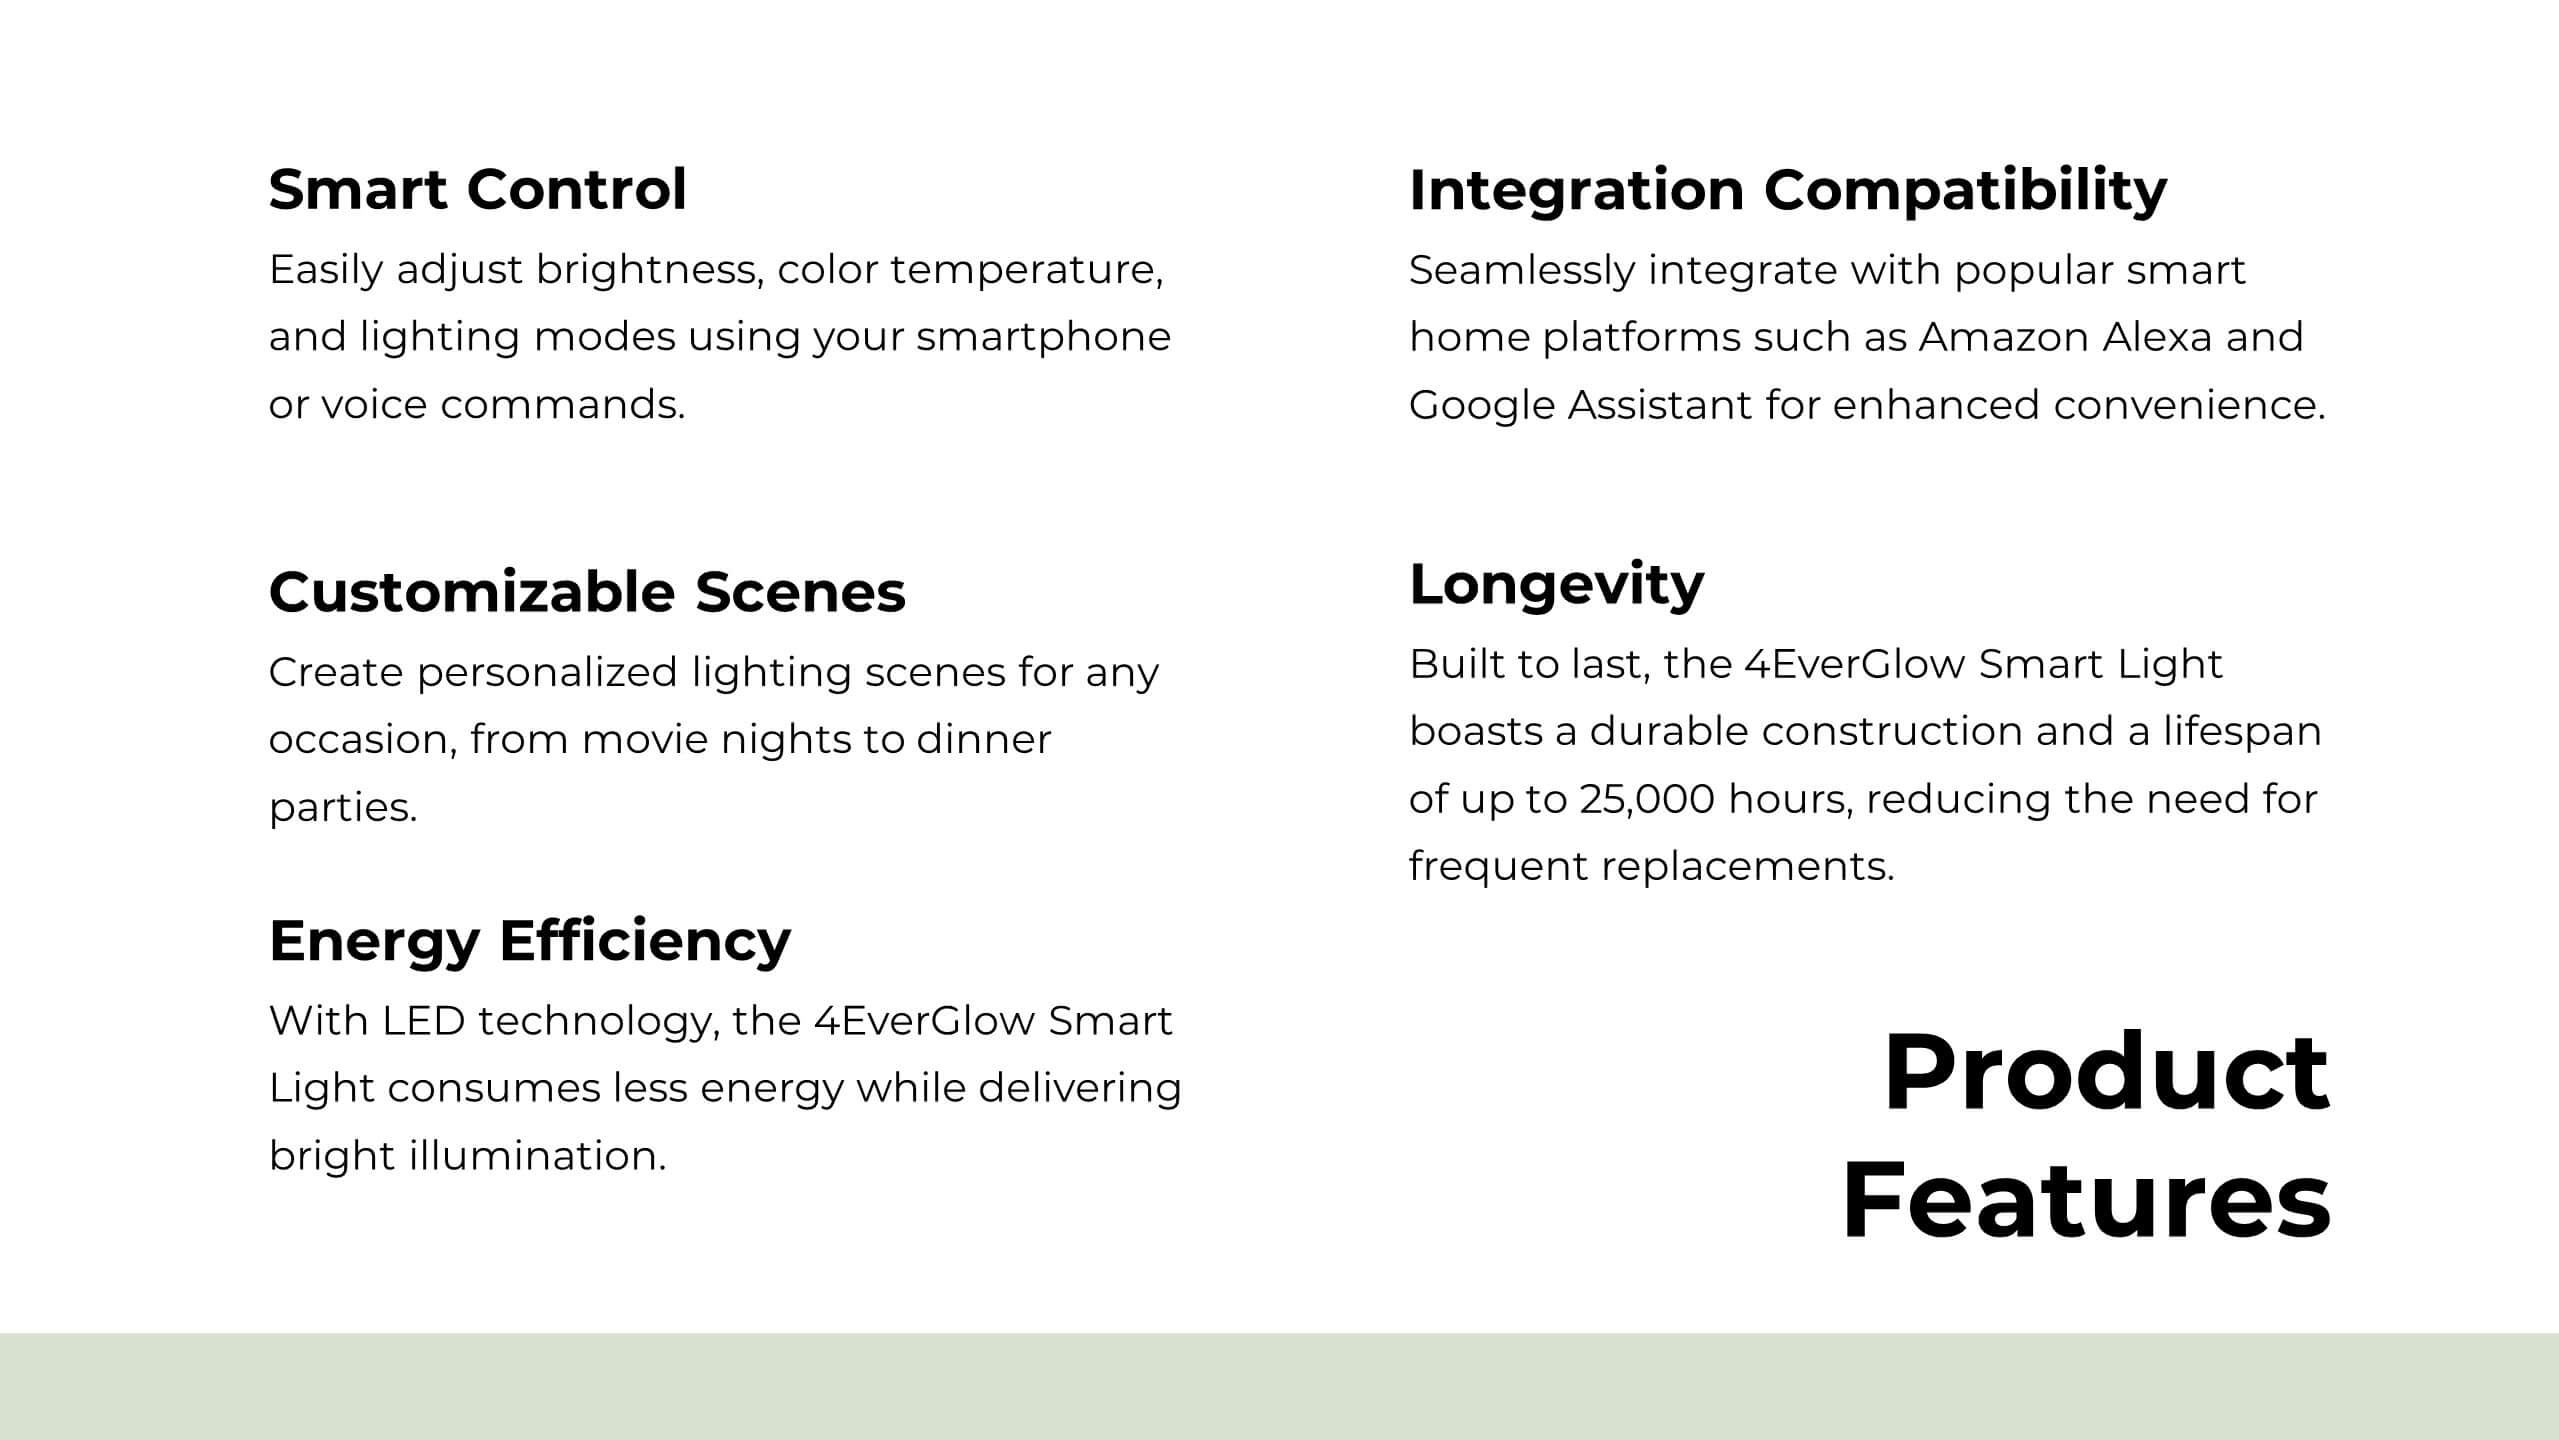
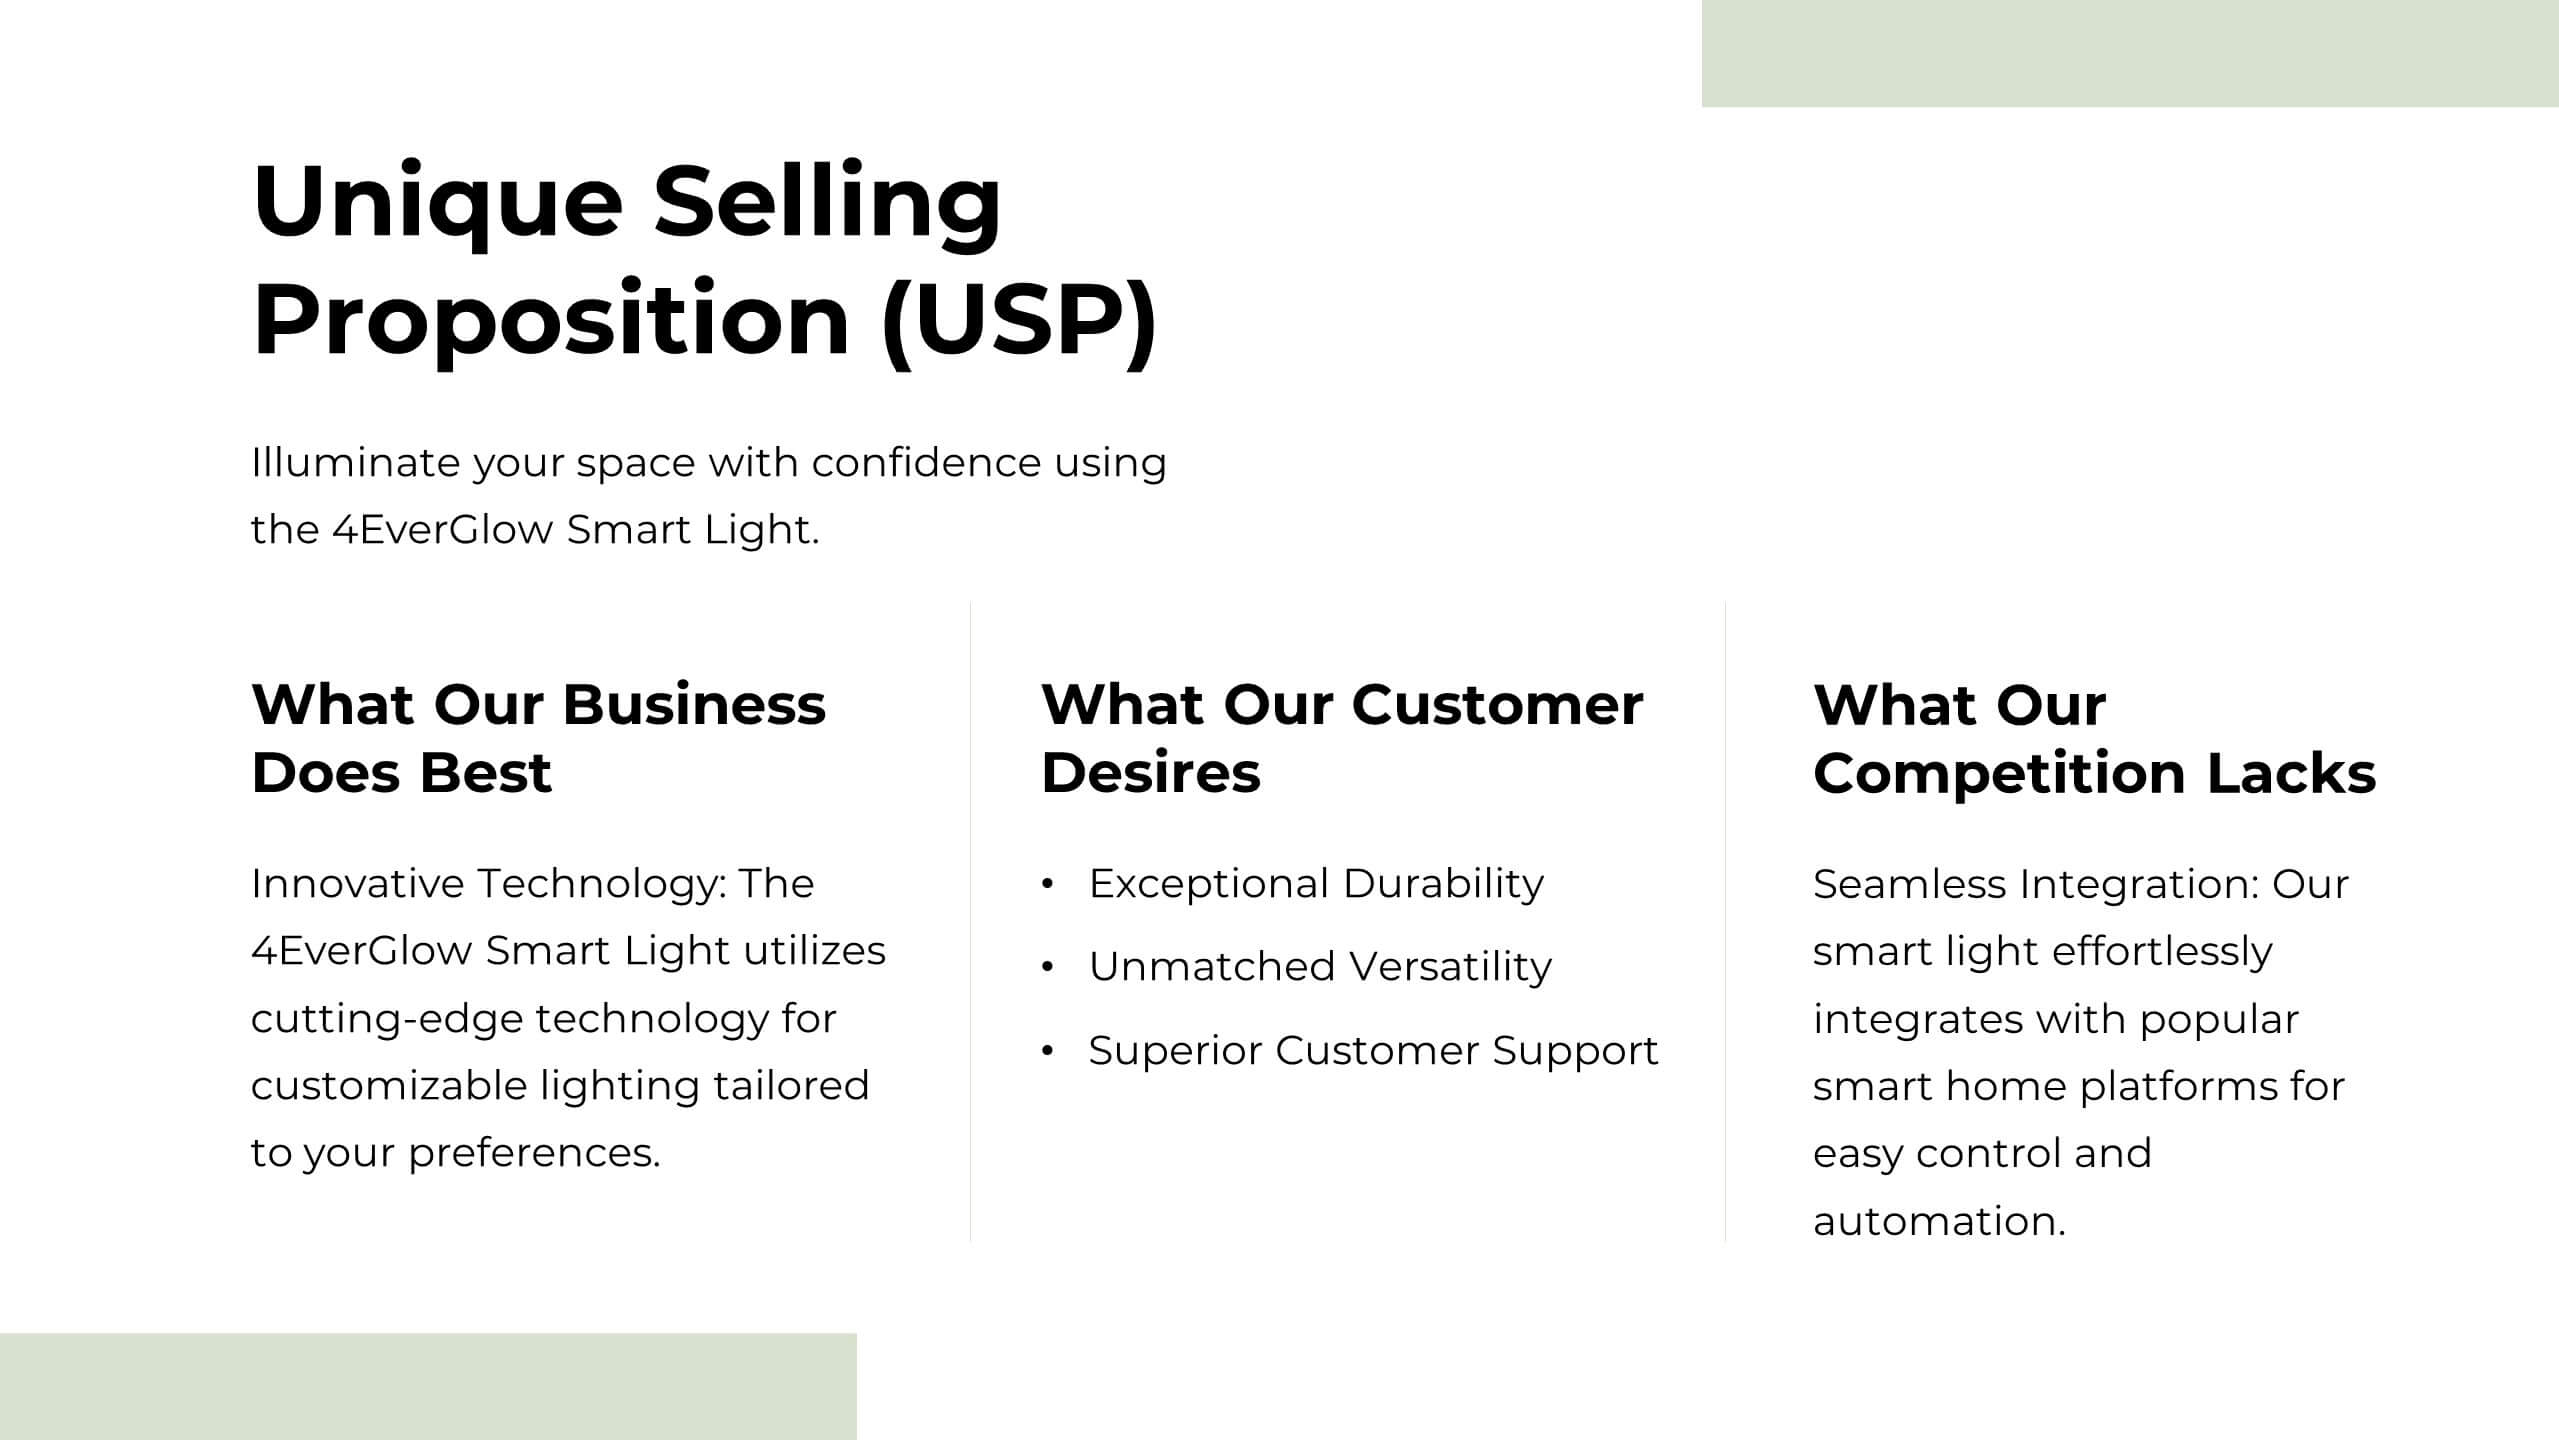
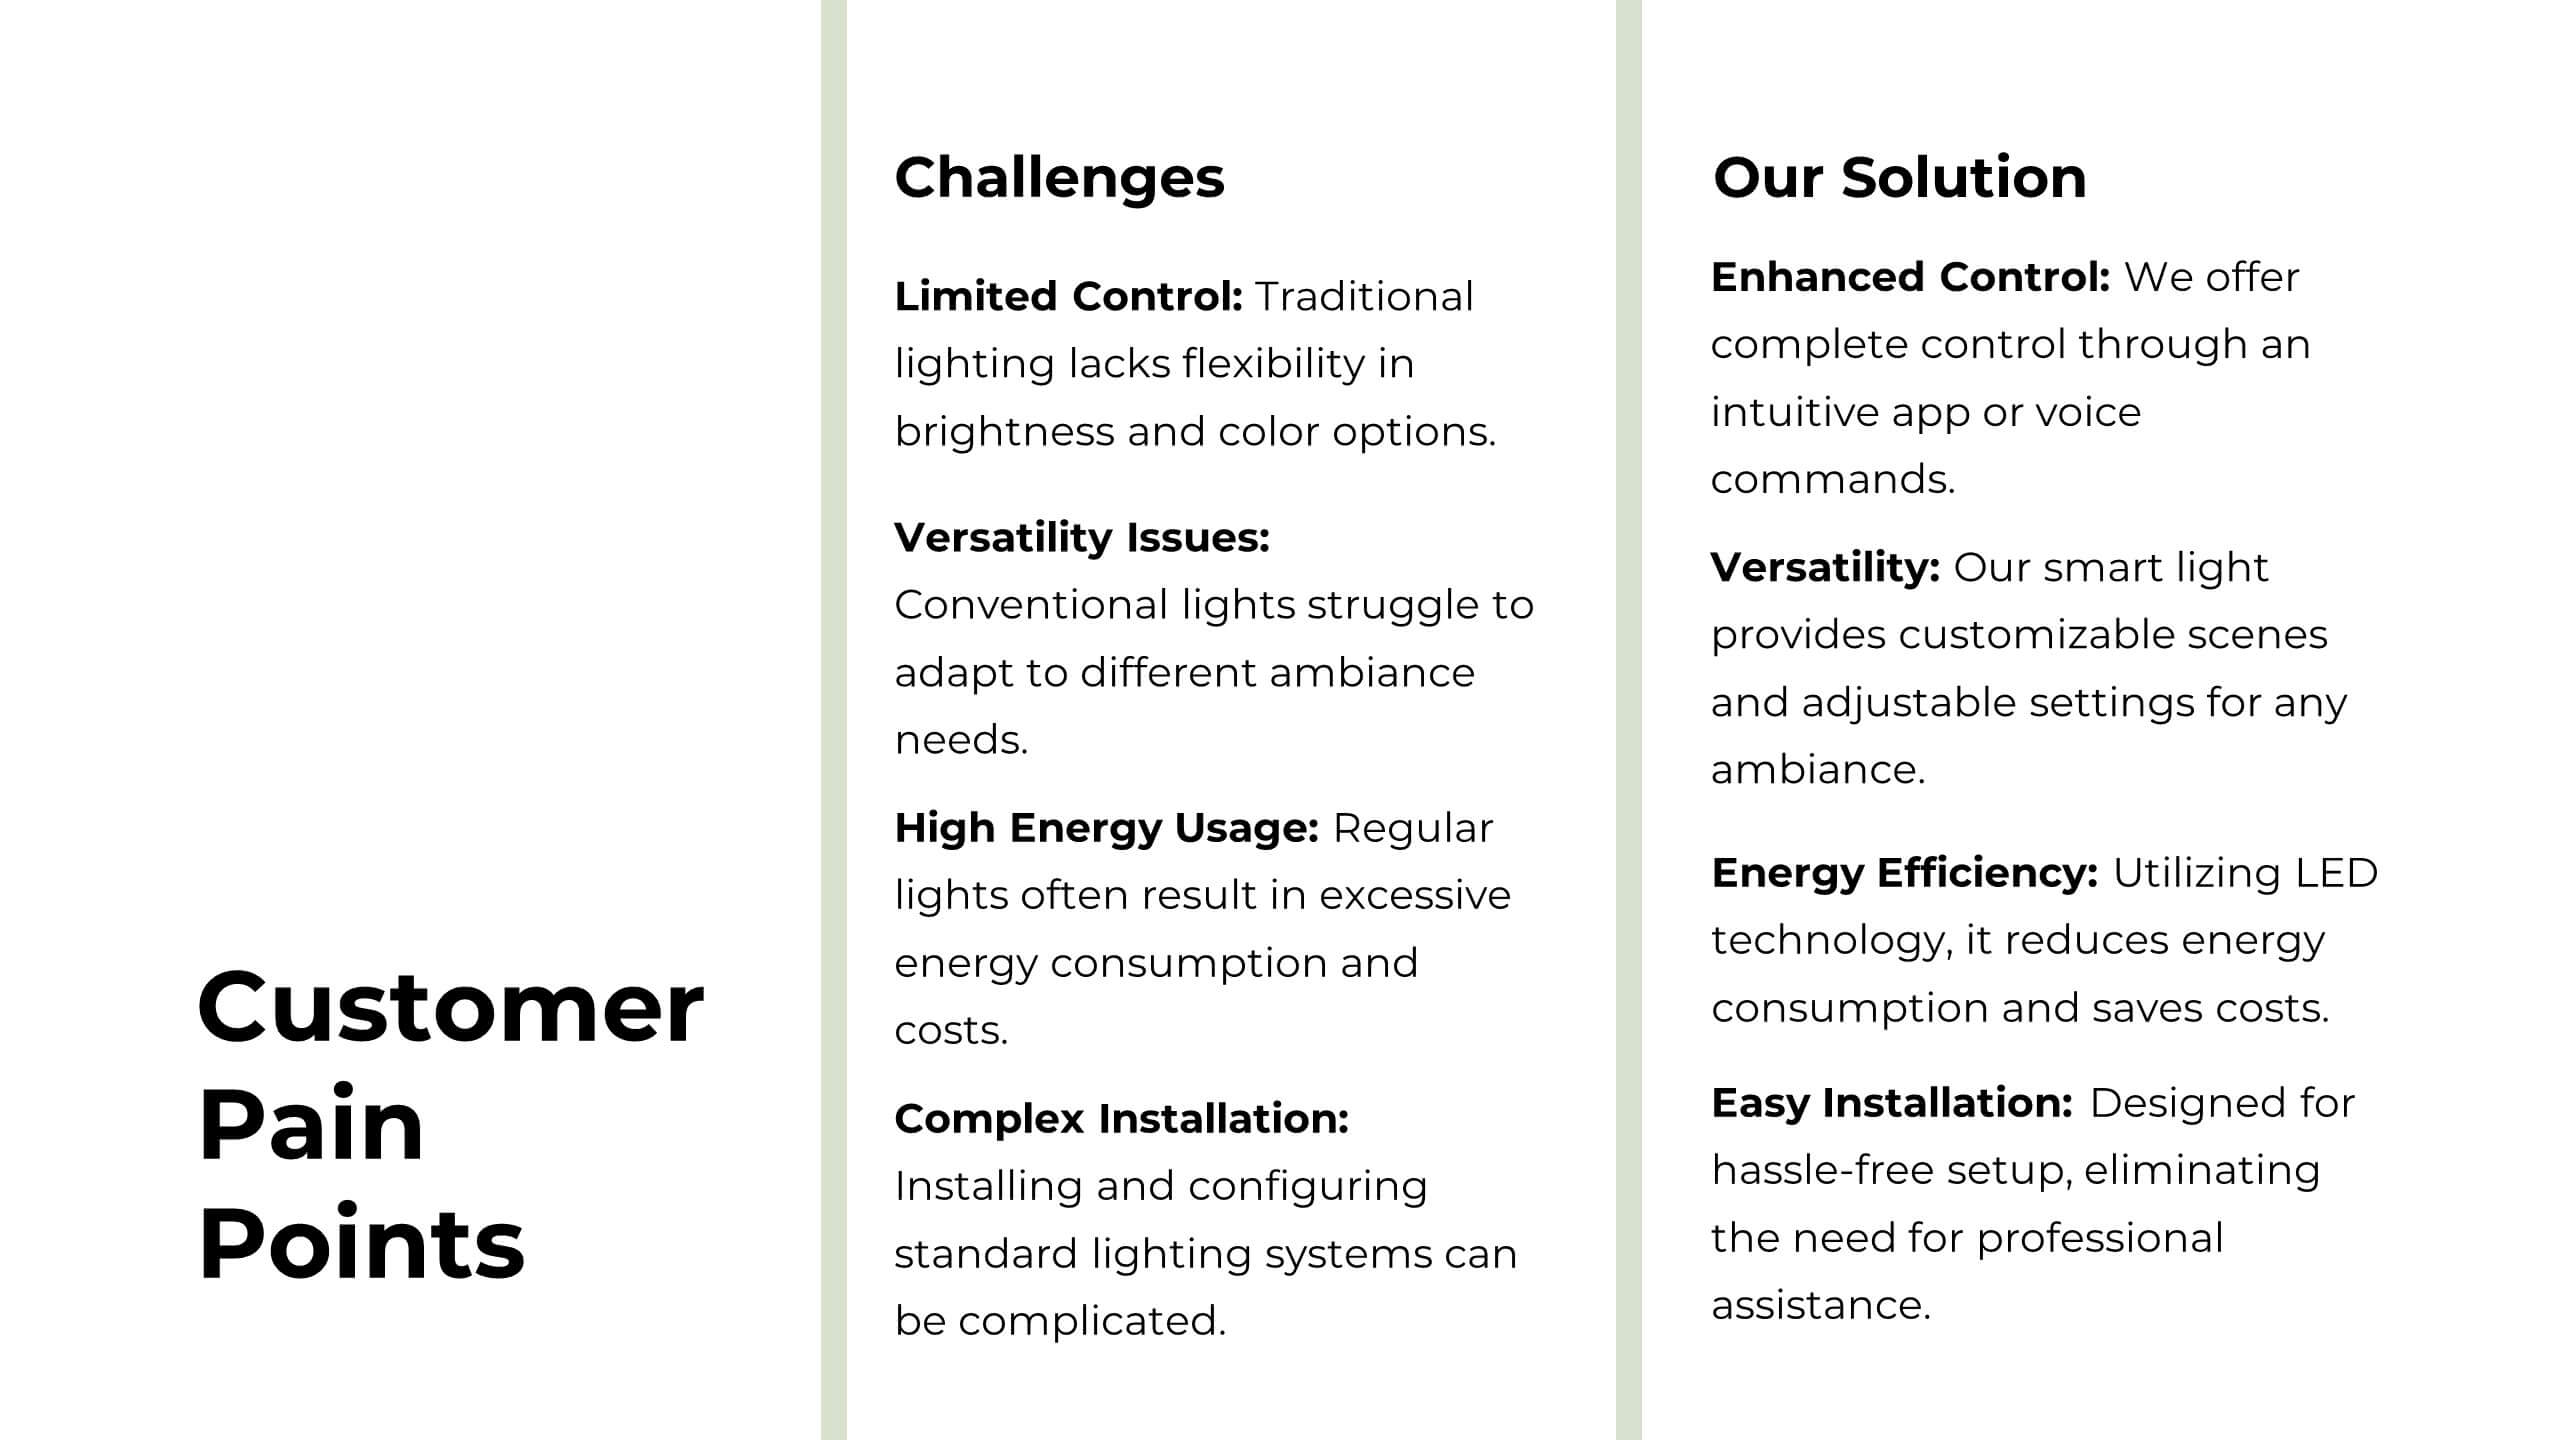
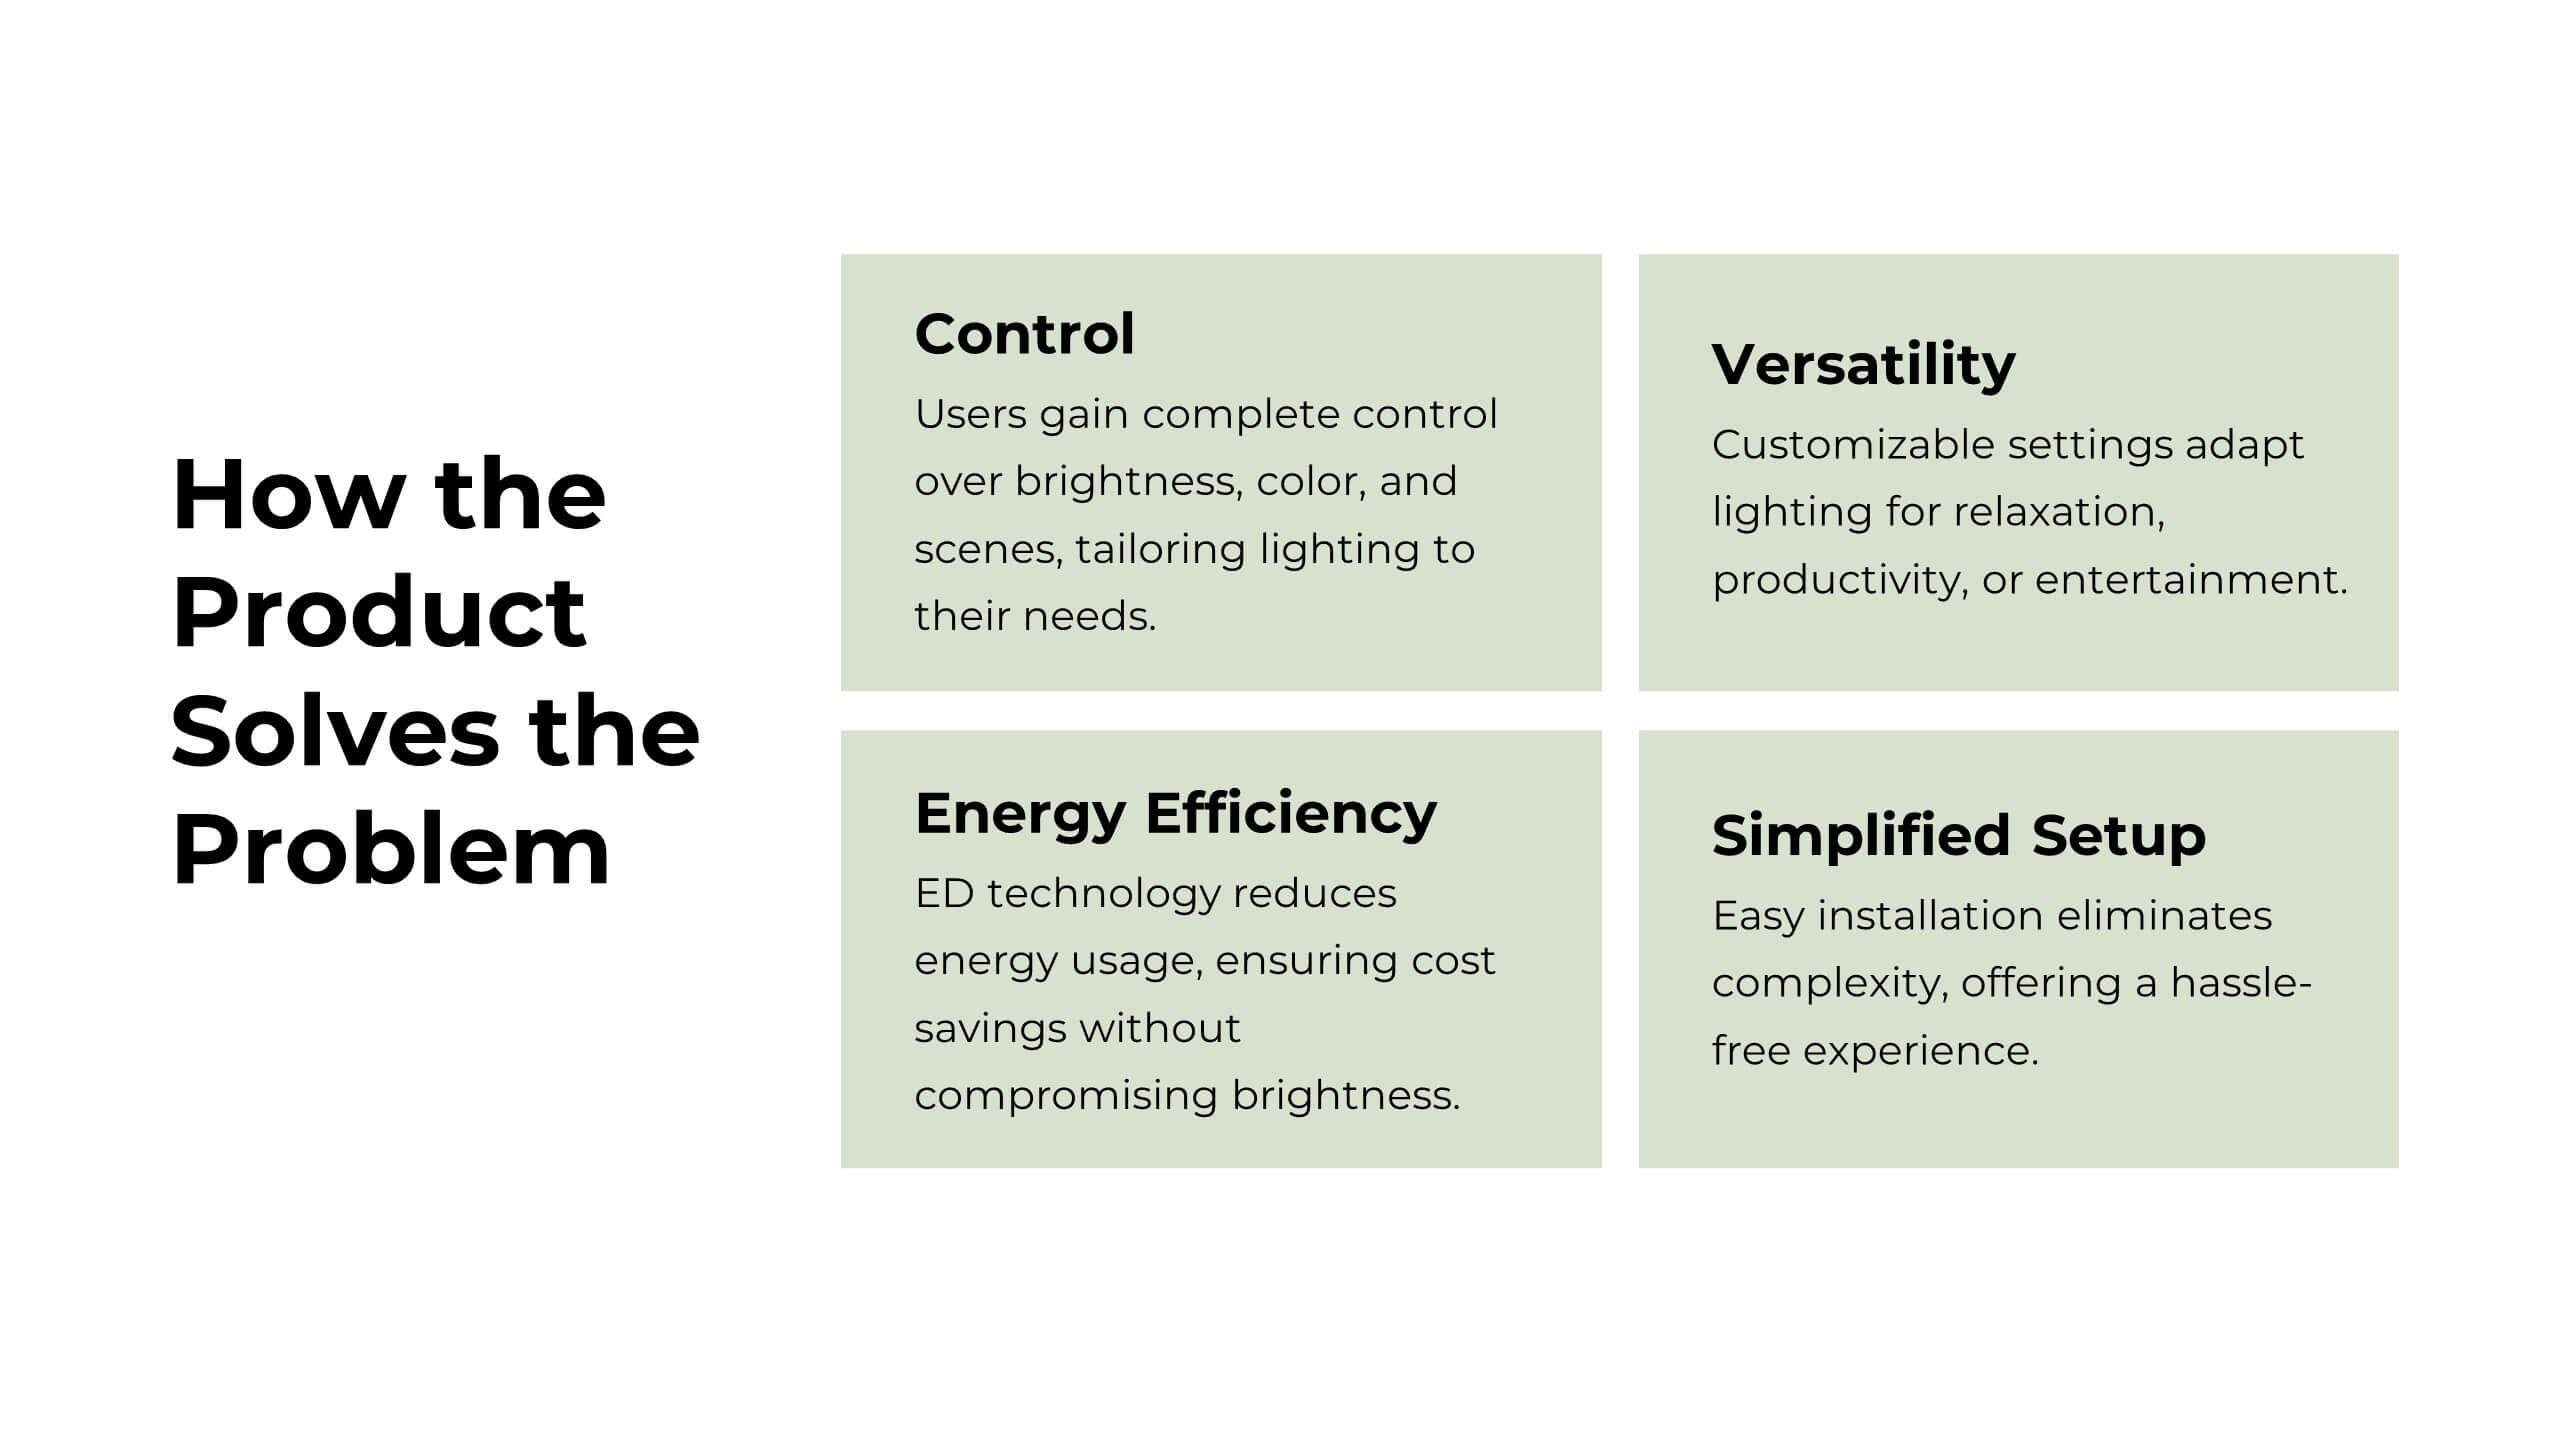
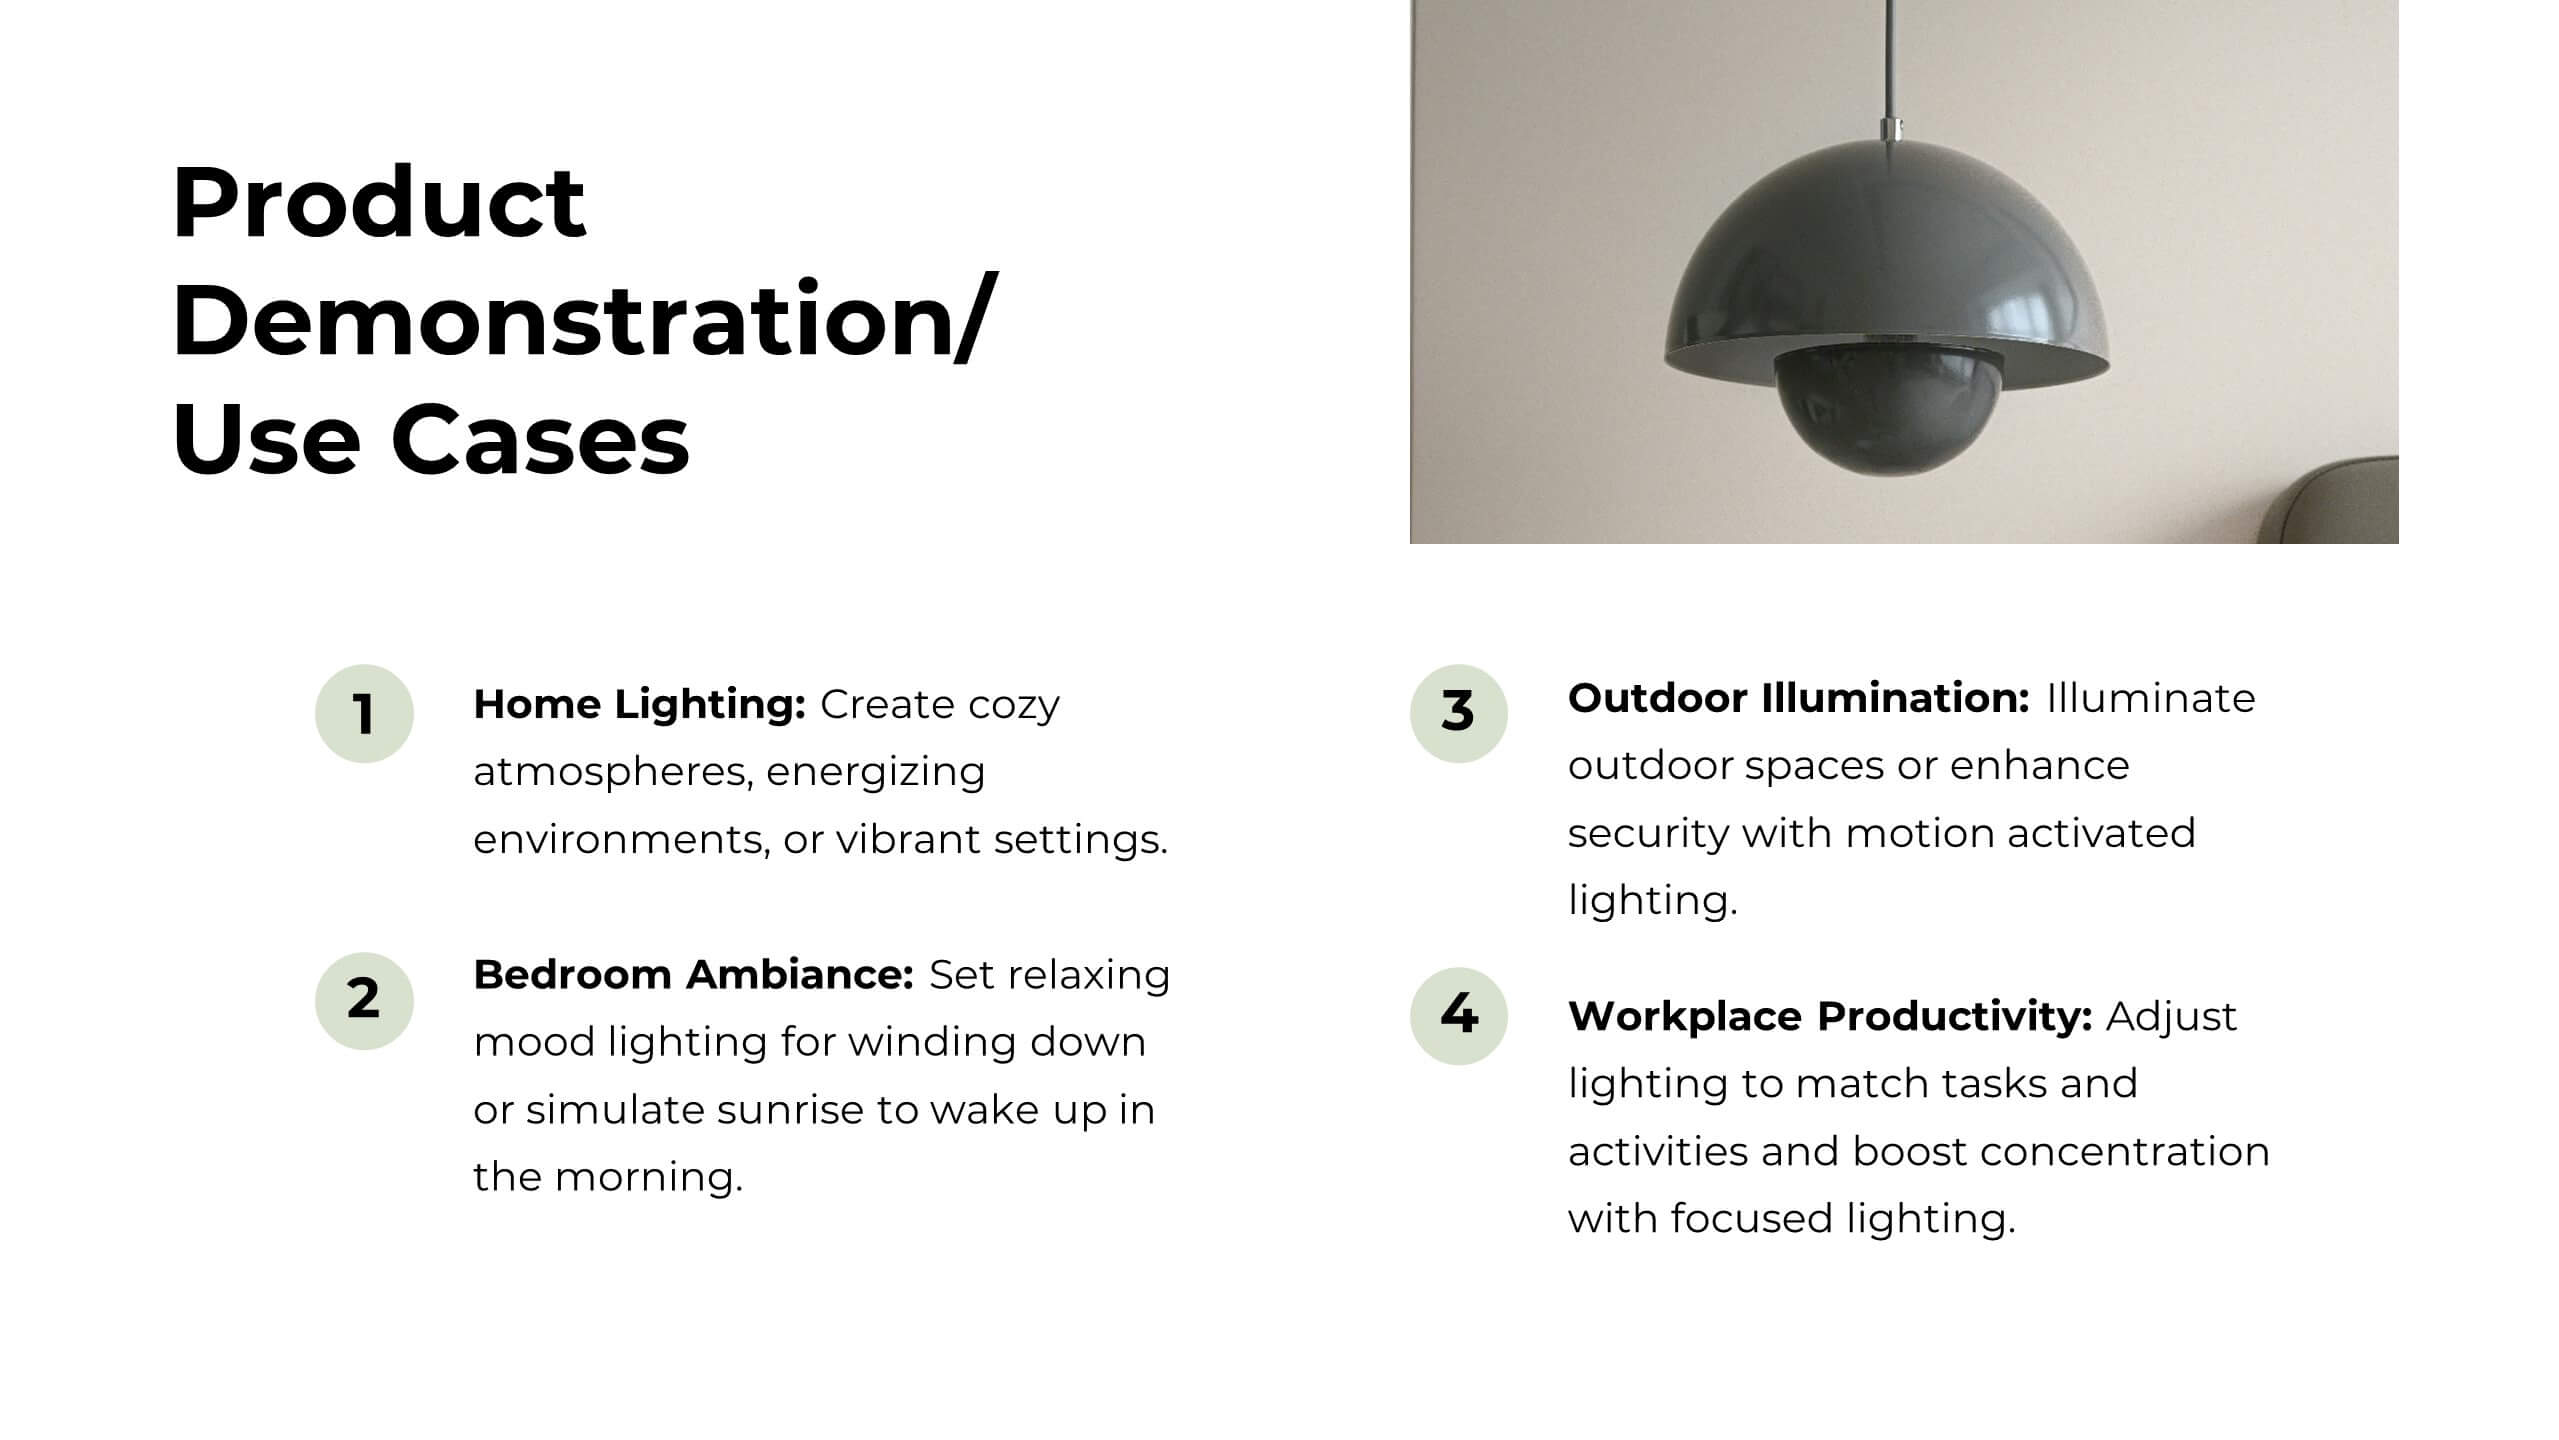
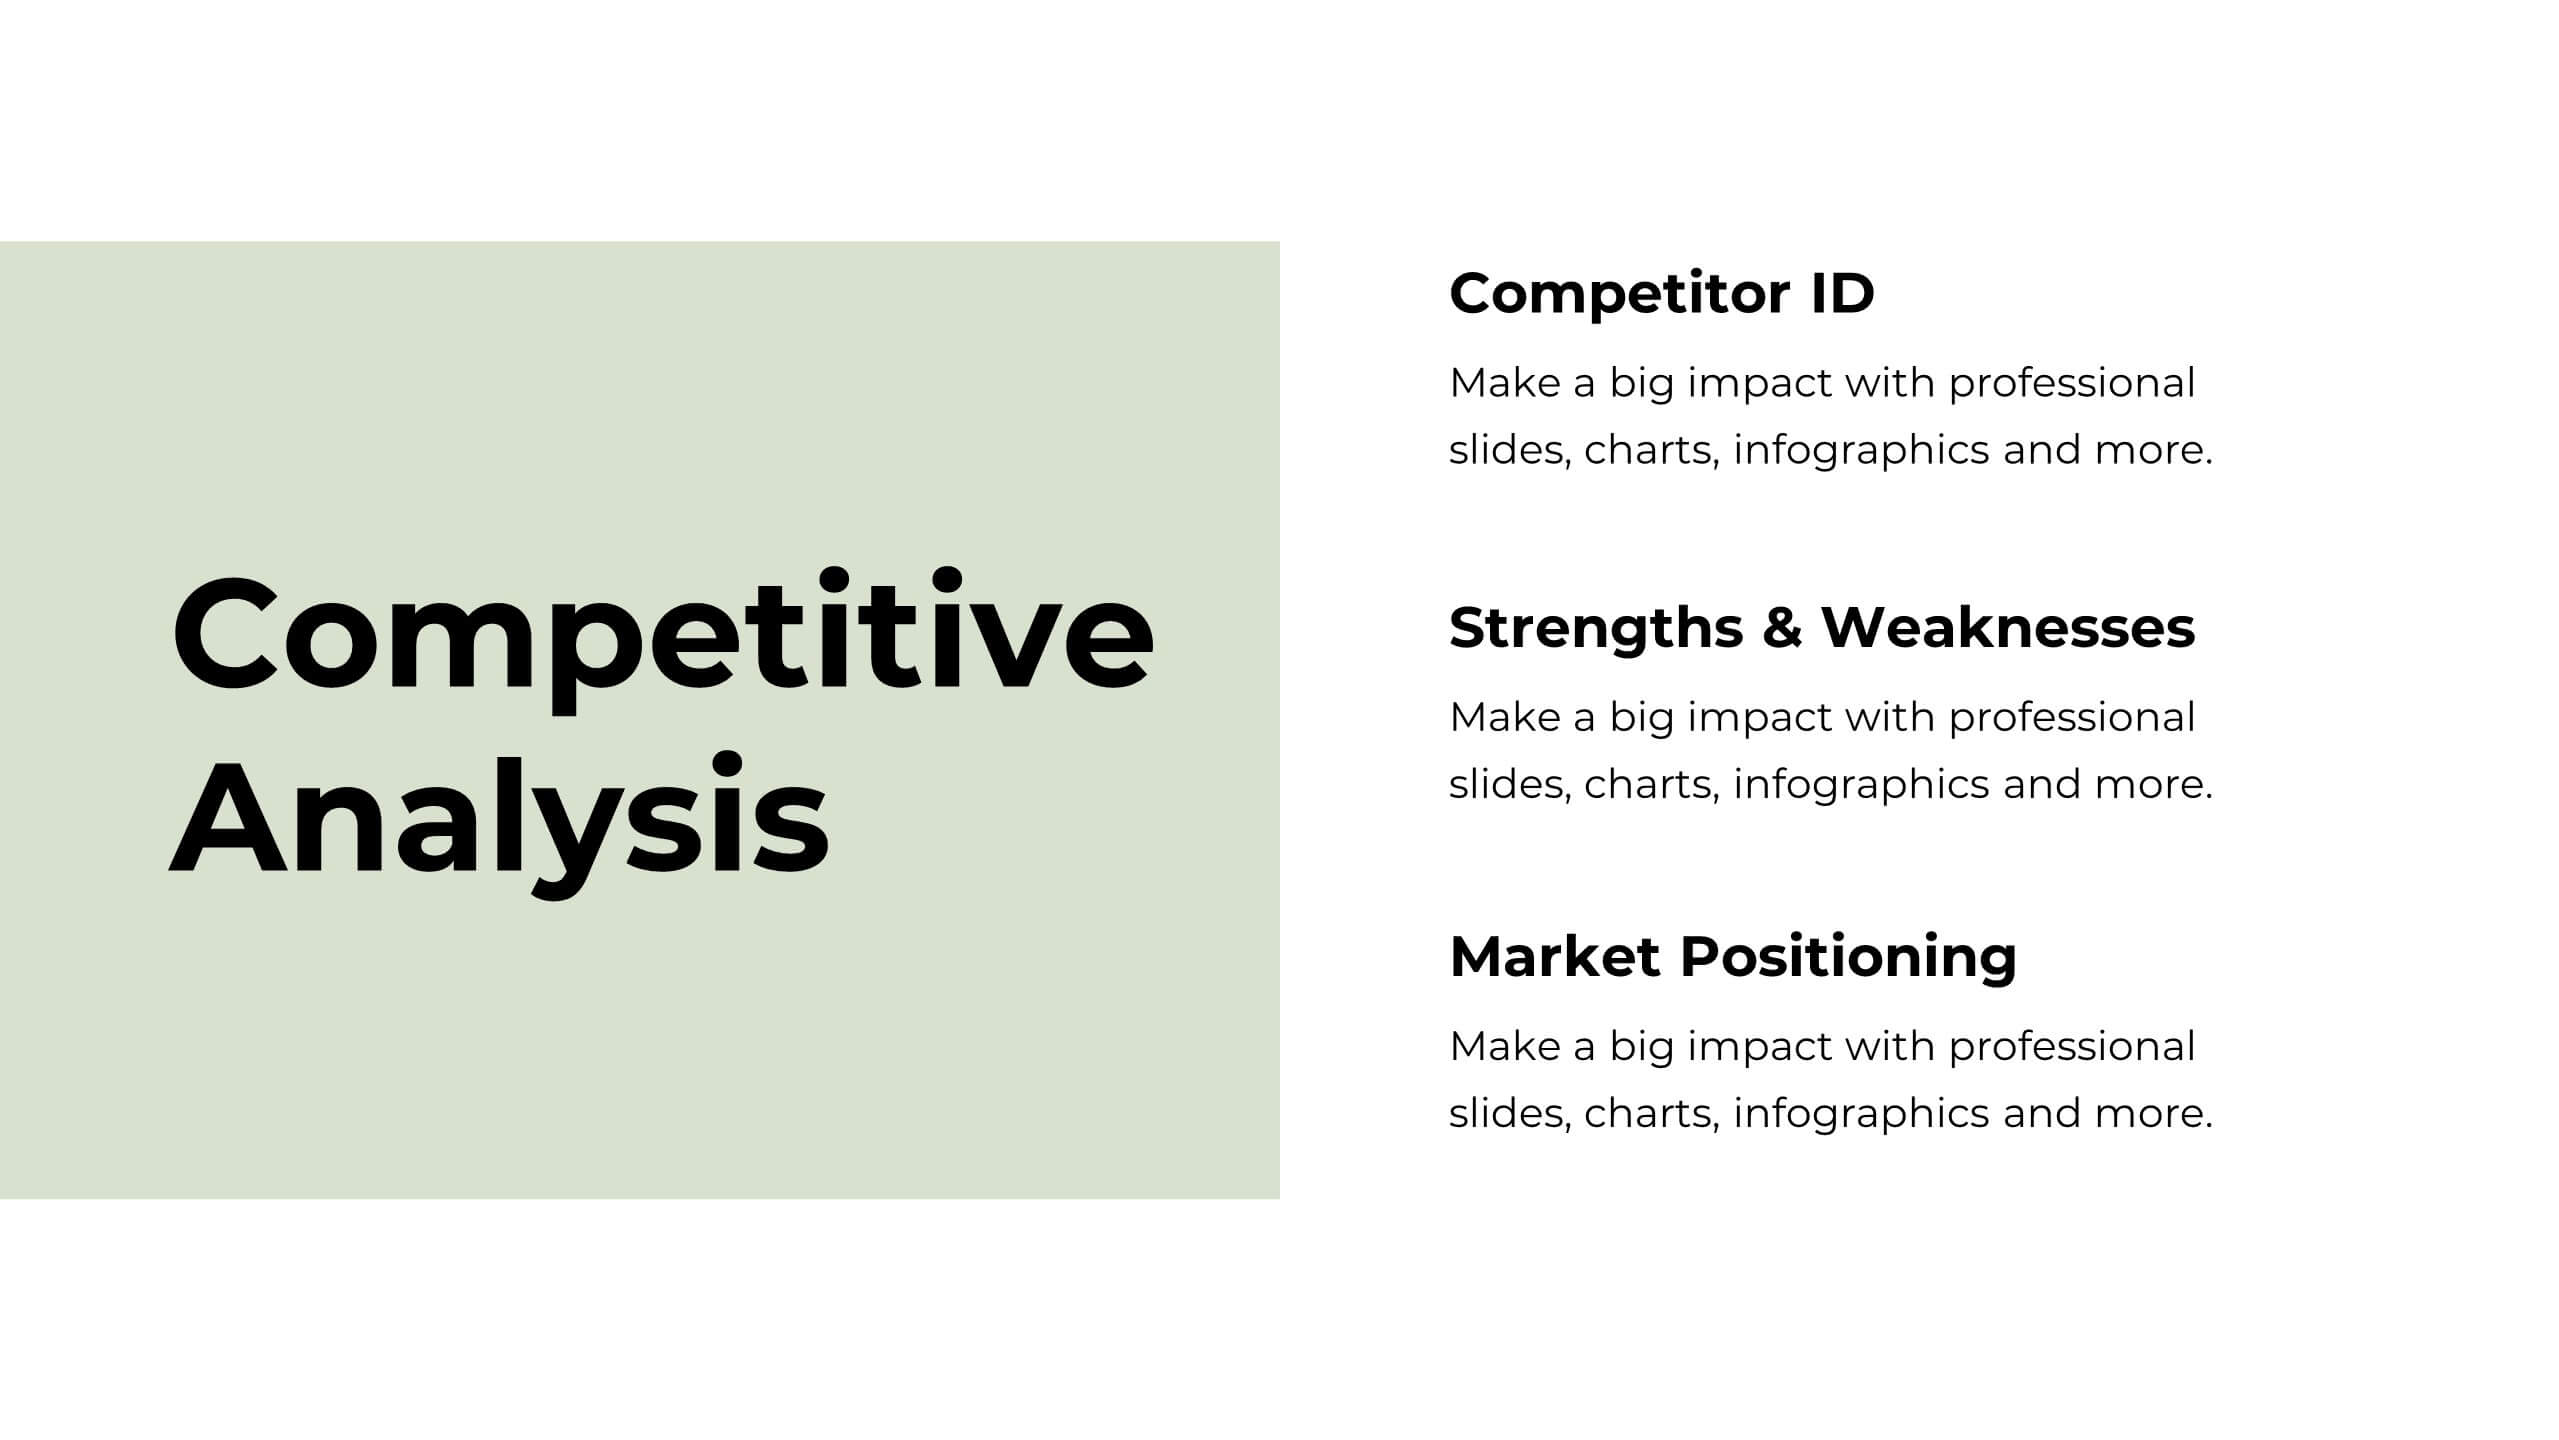
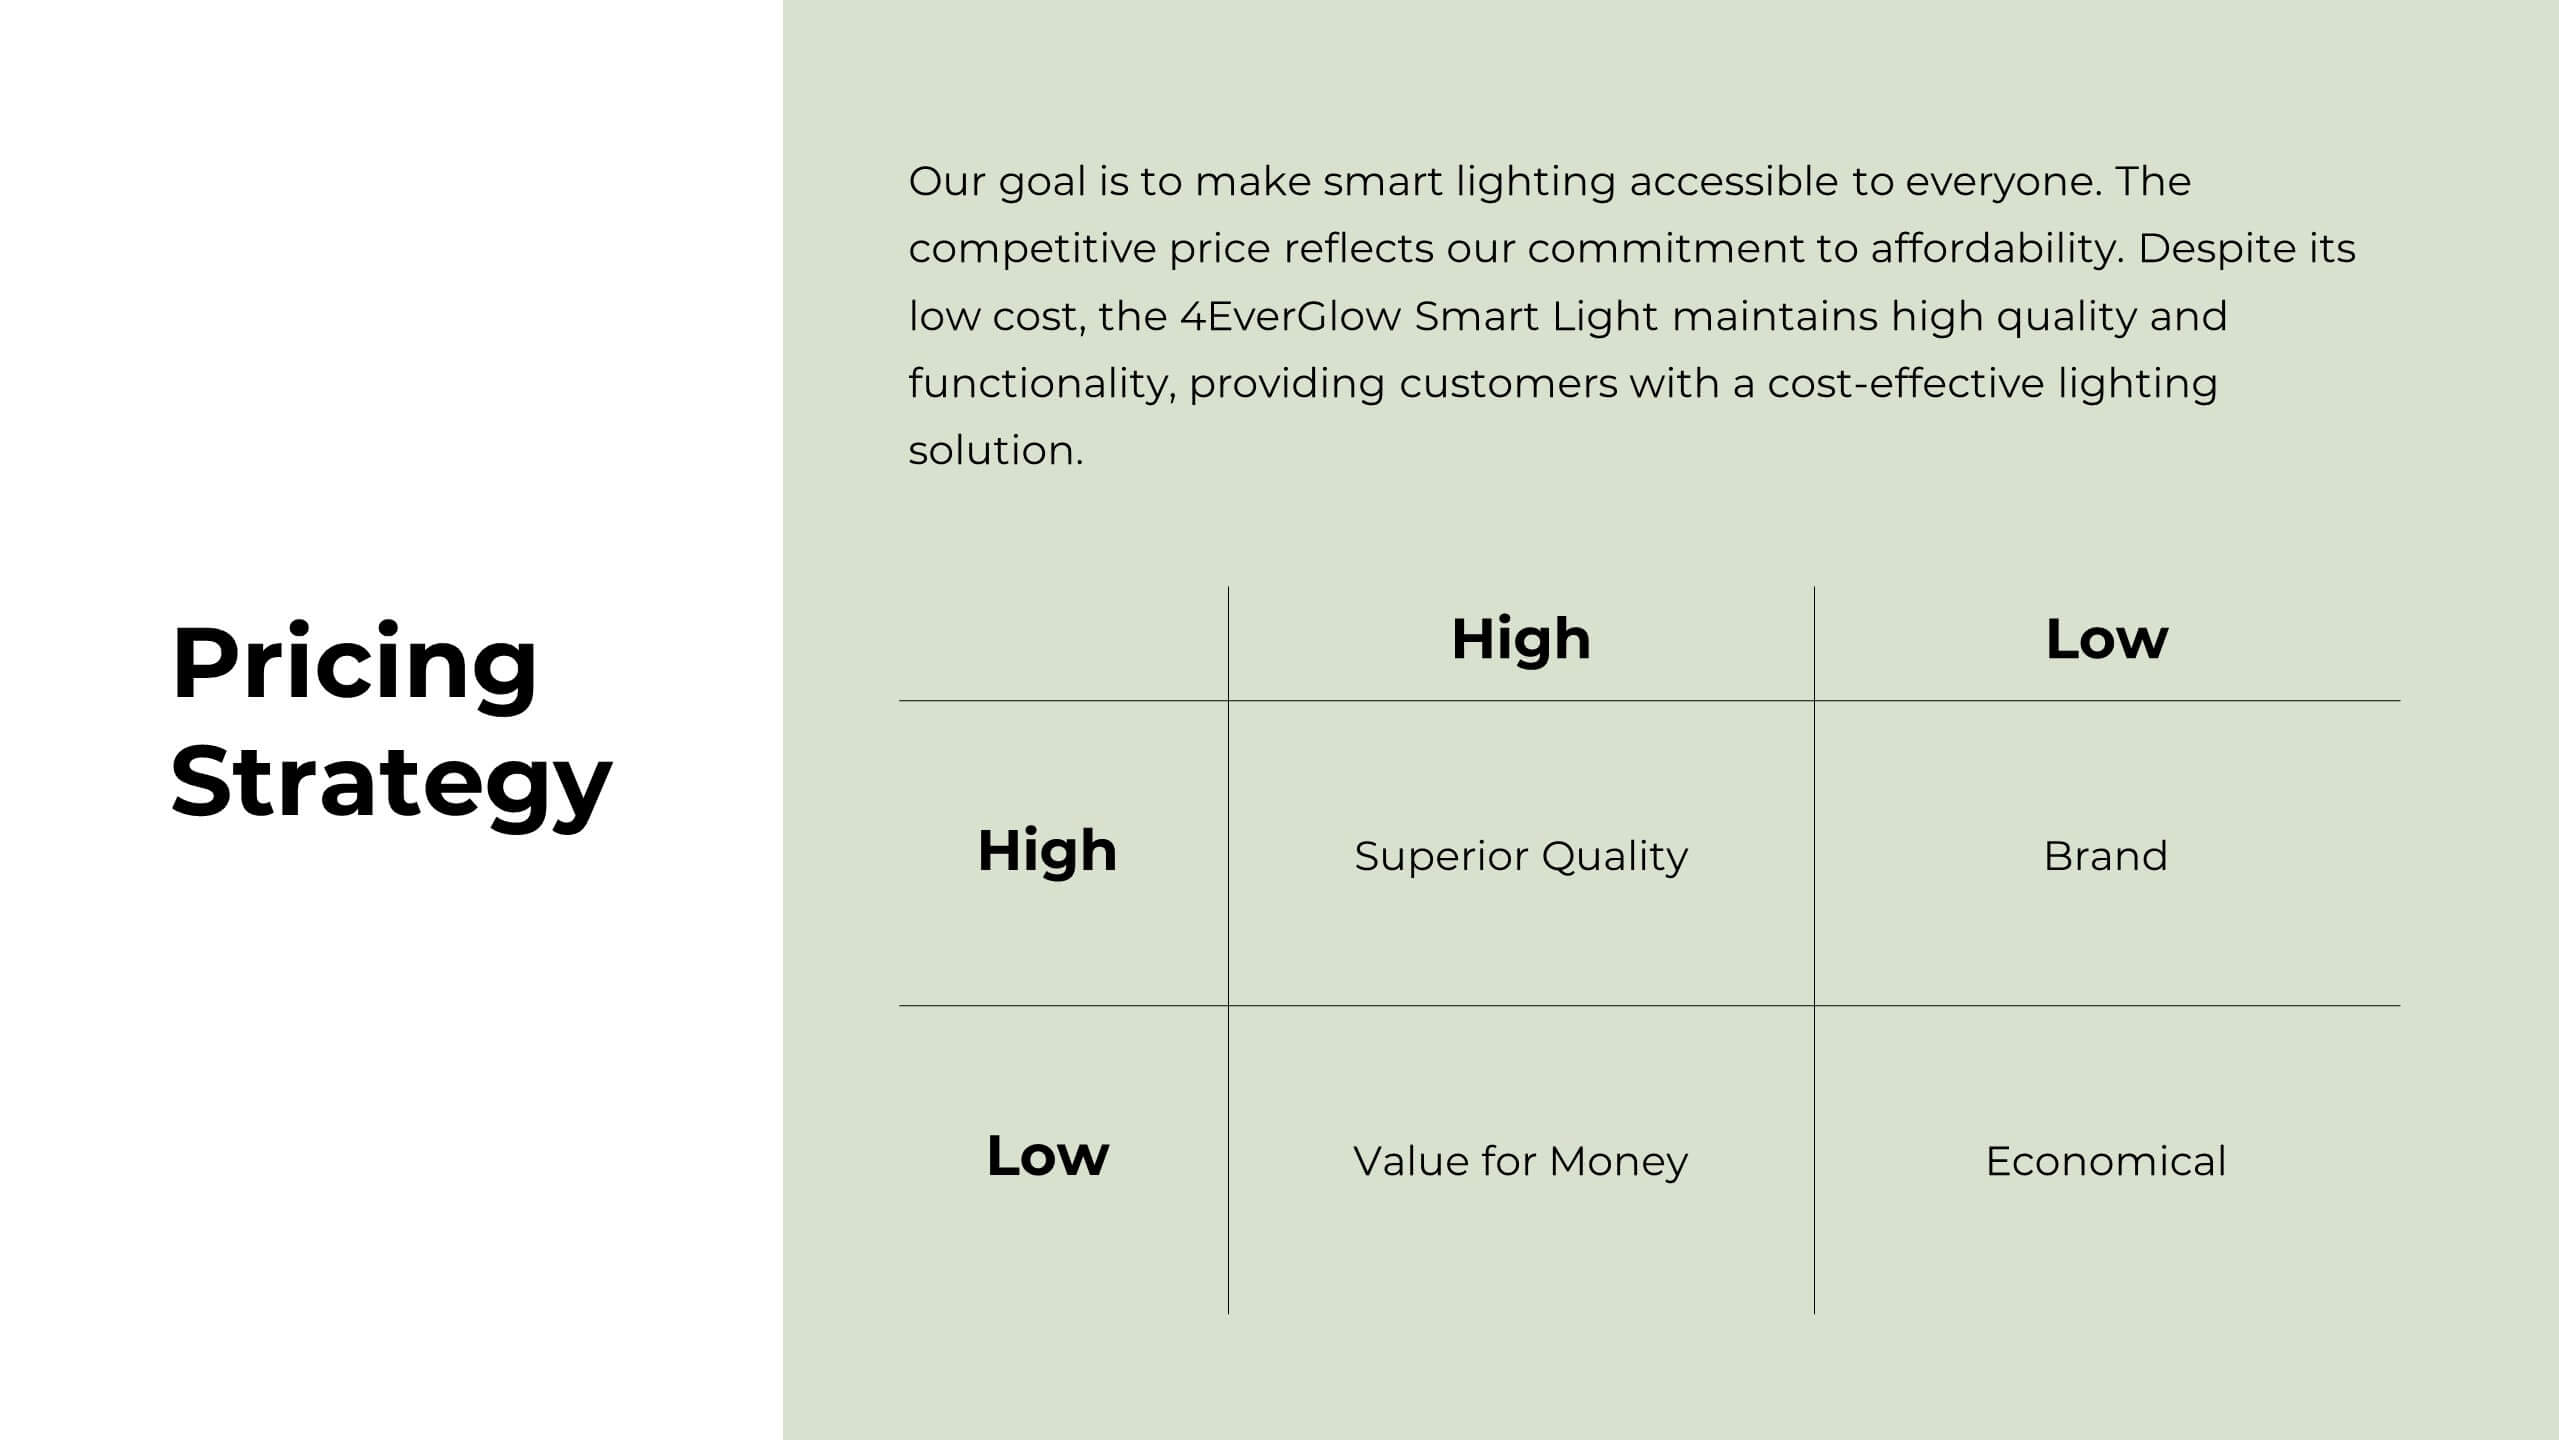
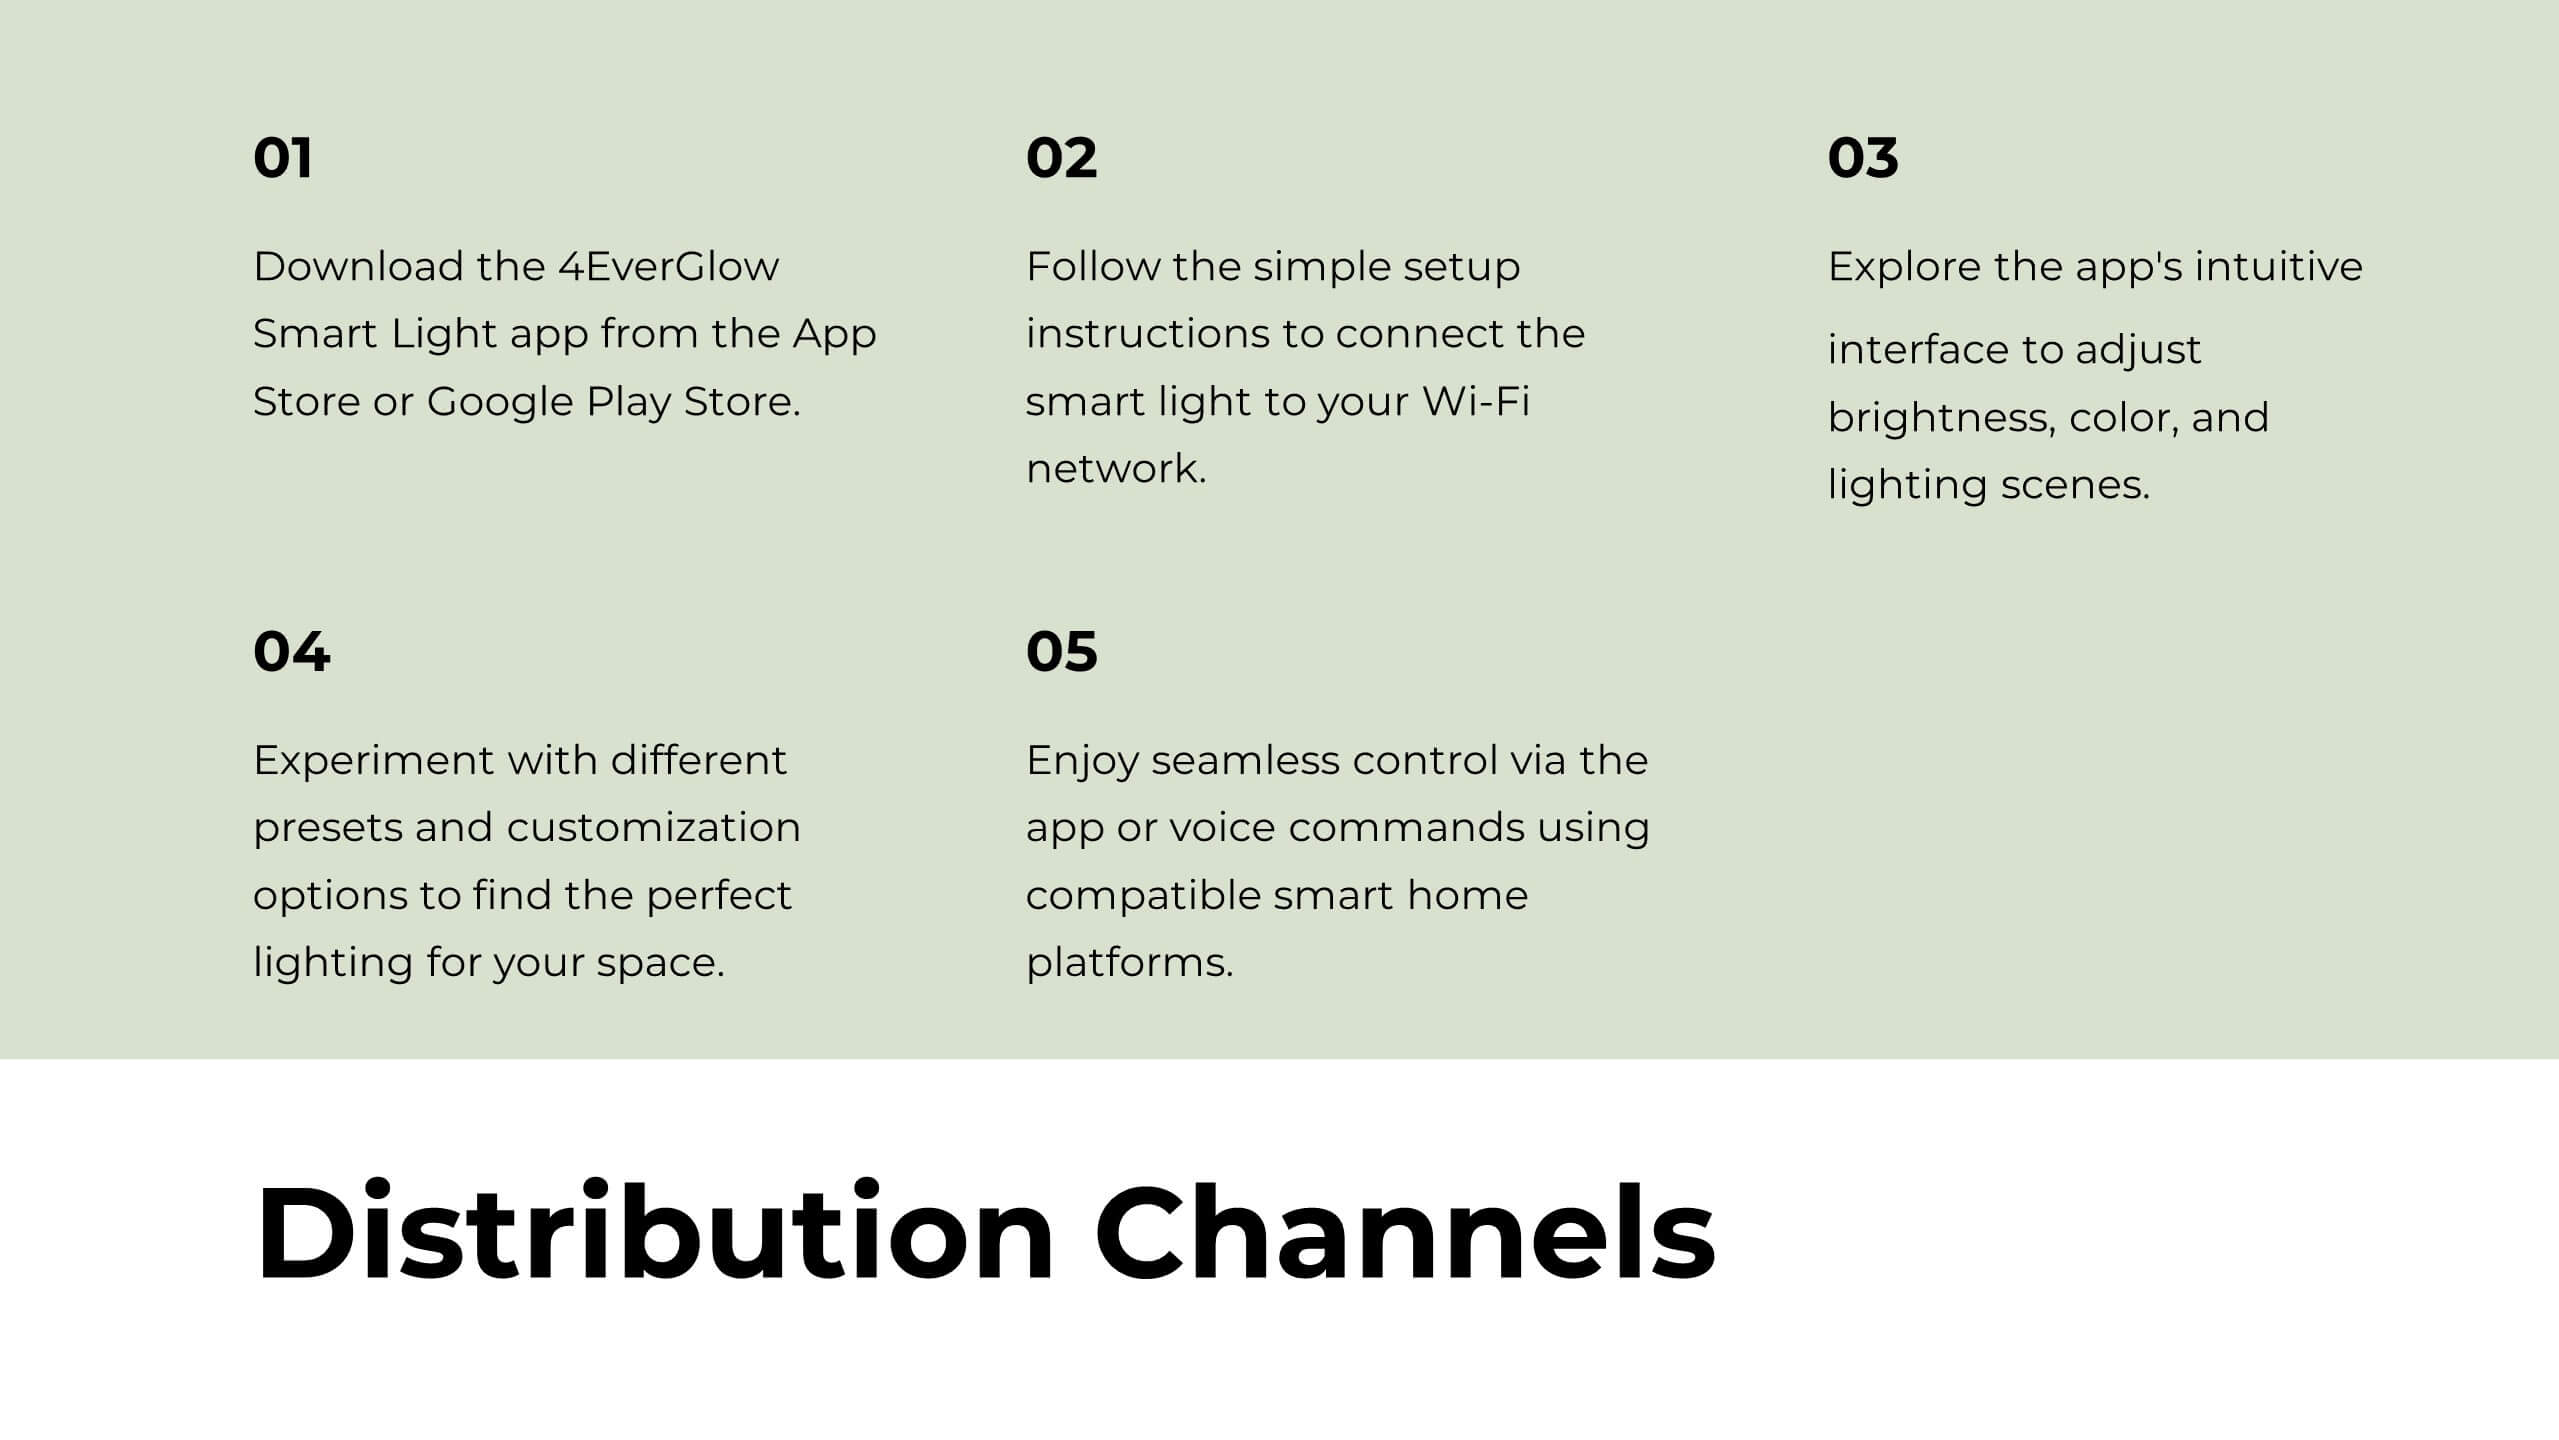
Glint Product Launch Presentation
Develop your product with confidence using this detailed product development plan template! Perfect for outlining features, market analysis, and competitive advantages. Ensure your team's efforts are aligned and maximize the impact of your product launch. Compatible with PowerPoint, Keynote, and Google Slides, it’s your ideal companion for successful product development.


6 diapositivas
Business Risk Mitigation Framework Presentation
Visualize and communicate your risk management strategies with this two-part puzzle-style framework. Ideal for showcasing problems and solutions, action plans, or risk-response workflows. Clean and modern layout enhances clarity. Fully editable in PowerPoint, Keynote, and Google Slides—perfect for business continuity planning, operational strategy, and stakeholder presentations.


5 diapositivas
Feedback Collection Strategy Presentation
Engage your audience with a dynamic visual that simplifies how feedback is gathered and turned into meaningful action. This presentation helps illustrate communication loops, data flow, and process improvements with clarity and style. Fully editable and compatible with PowerPoint, Keynote, and Google Slides for seamless customization and professional delivery.


6 diapositivas
Next Steps Outline for Project Teams Presentation
Keep your team aligned and motivated with a clear visual roadmap that outlines every upcoming milestone. Perfect for presenting project phases, workflow updates, or strategic goals, this slide ensures everyone knows what’s next. Fully compatible with PowerPoint, Keynote, and Google Slides for seamless editing and presentation versatility.


4 diapositivas
Types of Cloud Services Presentation
Turn technical concepts into clear, engaging visuals with this sleek and modern template. Perfect for showcasing digital platforms, cloud solutions, and service models, it helps you simplify complex data while maintaining a professional tone. Fully editable and compatible with PowerPoint, Keynote, and Google Slides for easy customization.


6 diapositivas
Market Share Analysis Pie Chart
Clearly communicate competitive positioning with this market share pie chart layout. Ideal for showcasing data segments such as revenue splits, customer base percentages, or geographic market distribution. Each pie chart highlights a distinct insight, with editable text and values. Compatible with PowerPoint, Keynote, and Google Slides.


5 diapositivas
Health Awareness Campaign Presentation
Bright and uplifting, this slide brings awareness to important health causes through a clean ribbon-focused layout that’s easy to read and visually engaging. It helps present key messages, statistics, or campaign steps clearly while keeping the design calm and supportive. Fully compatible with PowerPoint, Keynote, and Google Slides.