


Características


¿Tienes alguna pregunta?
Recomendar


6 diapositivas
5-Step SEO Marketing Funnel Presentation
Ignite your marketing story with a bold, flowing visual that makes every step feel purposeful and easy to follow. This presentation breaks down each stage of the SEO funnel, helping you explain strategy, performance, and conversion paths with clarity. Fully compatible with PowerPoint, Keynote, and Google Slides.


4 diapositivas
School Curriculum Overview Presentation
Present your academic plan with this creative curriculum overview layout. Featuring intersecting pencil graphics, it visually organizes four key subjects or areas of focus. Perfect for teachers, school administrators, or education consultants. Fully customizable in PowerPoint, Keynote, and Google Slides to match any educational level or institutional branding.


7 diapositivas
Academic Year Schedule and Class Structure Presentation
Organize your school week with clarity using the Academic Year Schedule and Class Structure Presentation. Perfect for teachers, school coordinators, and academic planners, this timetable slide helps map out subjects and activities across days and periods. Fully customizable in PowerPoint, Keynote, Google Slides, and Canva for seamless editing.


22 diapositivas
Bona Advertising Agency Proposal Presentation
Present your agency’s vision with confidence using this sleek advertising proposal template. It covers everything from market analysis and strategy development to campaign execution and client testimonials. Ideal for securing new partnerships, it’s compatible with PowerPoint, Keynote, and Google Slides for a polished, professional presentation.


8 diapositivas
Effective Team Building Model Presentation
Visualize your strategy for collaboration with the Effective Team Building Model Presentation. This layered block layout is perfect for illustrating step-by-step frameworks, progressive strategies, or hierarchical team development stages. Clean, modern, and color-coded for clarity, it's ideal for internal planning, training, or leadership presentations. Fully editable in PowerPoint, Keynote, Canva, and Google Slides.


5 diapositivas
Leadership and Workforce Culture
Inspire growth from the ground up with this bold, step-by-step visual that captures the journey of leadership and team development. From culture-building to individual progress, this layout helps you illustrate each stage clearly and confidently. Fully compatible with PowerPoint, Keynote, and Google Slides.


5 diapositivas
Property Investment Analysis
Visualize property performance, investment comparisons, or growth strategies using this colorful building-height layout. Ideal for real estate agents, financial consultants, and property developers seeking to present tiered data clearly. Fully customizable in PowerPoint, Keynote, and Google Slides.


10 diapositivas
South America Business Development Growth Map Presentation
Showcase business growth insights with this South America-focused development map. Featuring vibrant bar-style columns aligned with country highlights, this layout helps visualize economic potential, investment zones, and performance indicators. Perfect for regional strategy presentations, market analysis, and expansion proposals. Fully editable for PowerPoint, Keynote, and Google Slides compatibility.


26 diapositivas
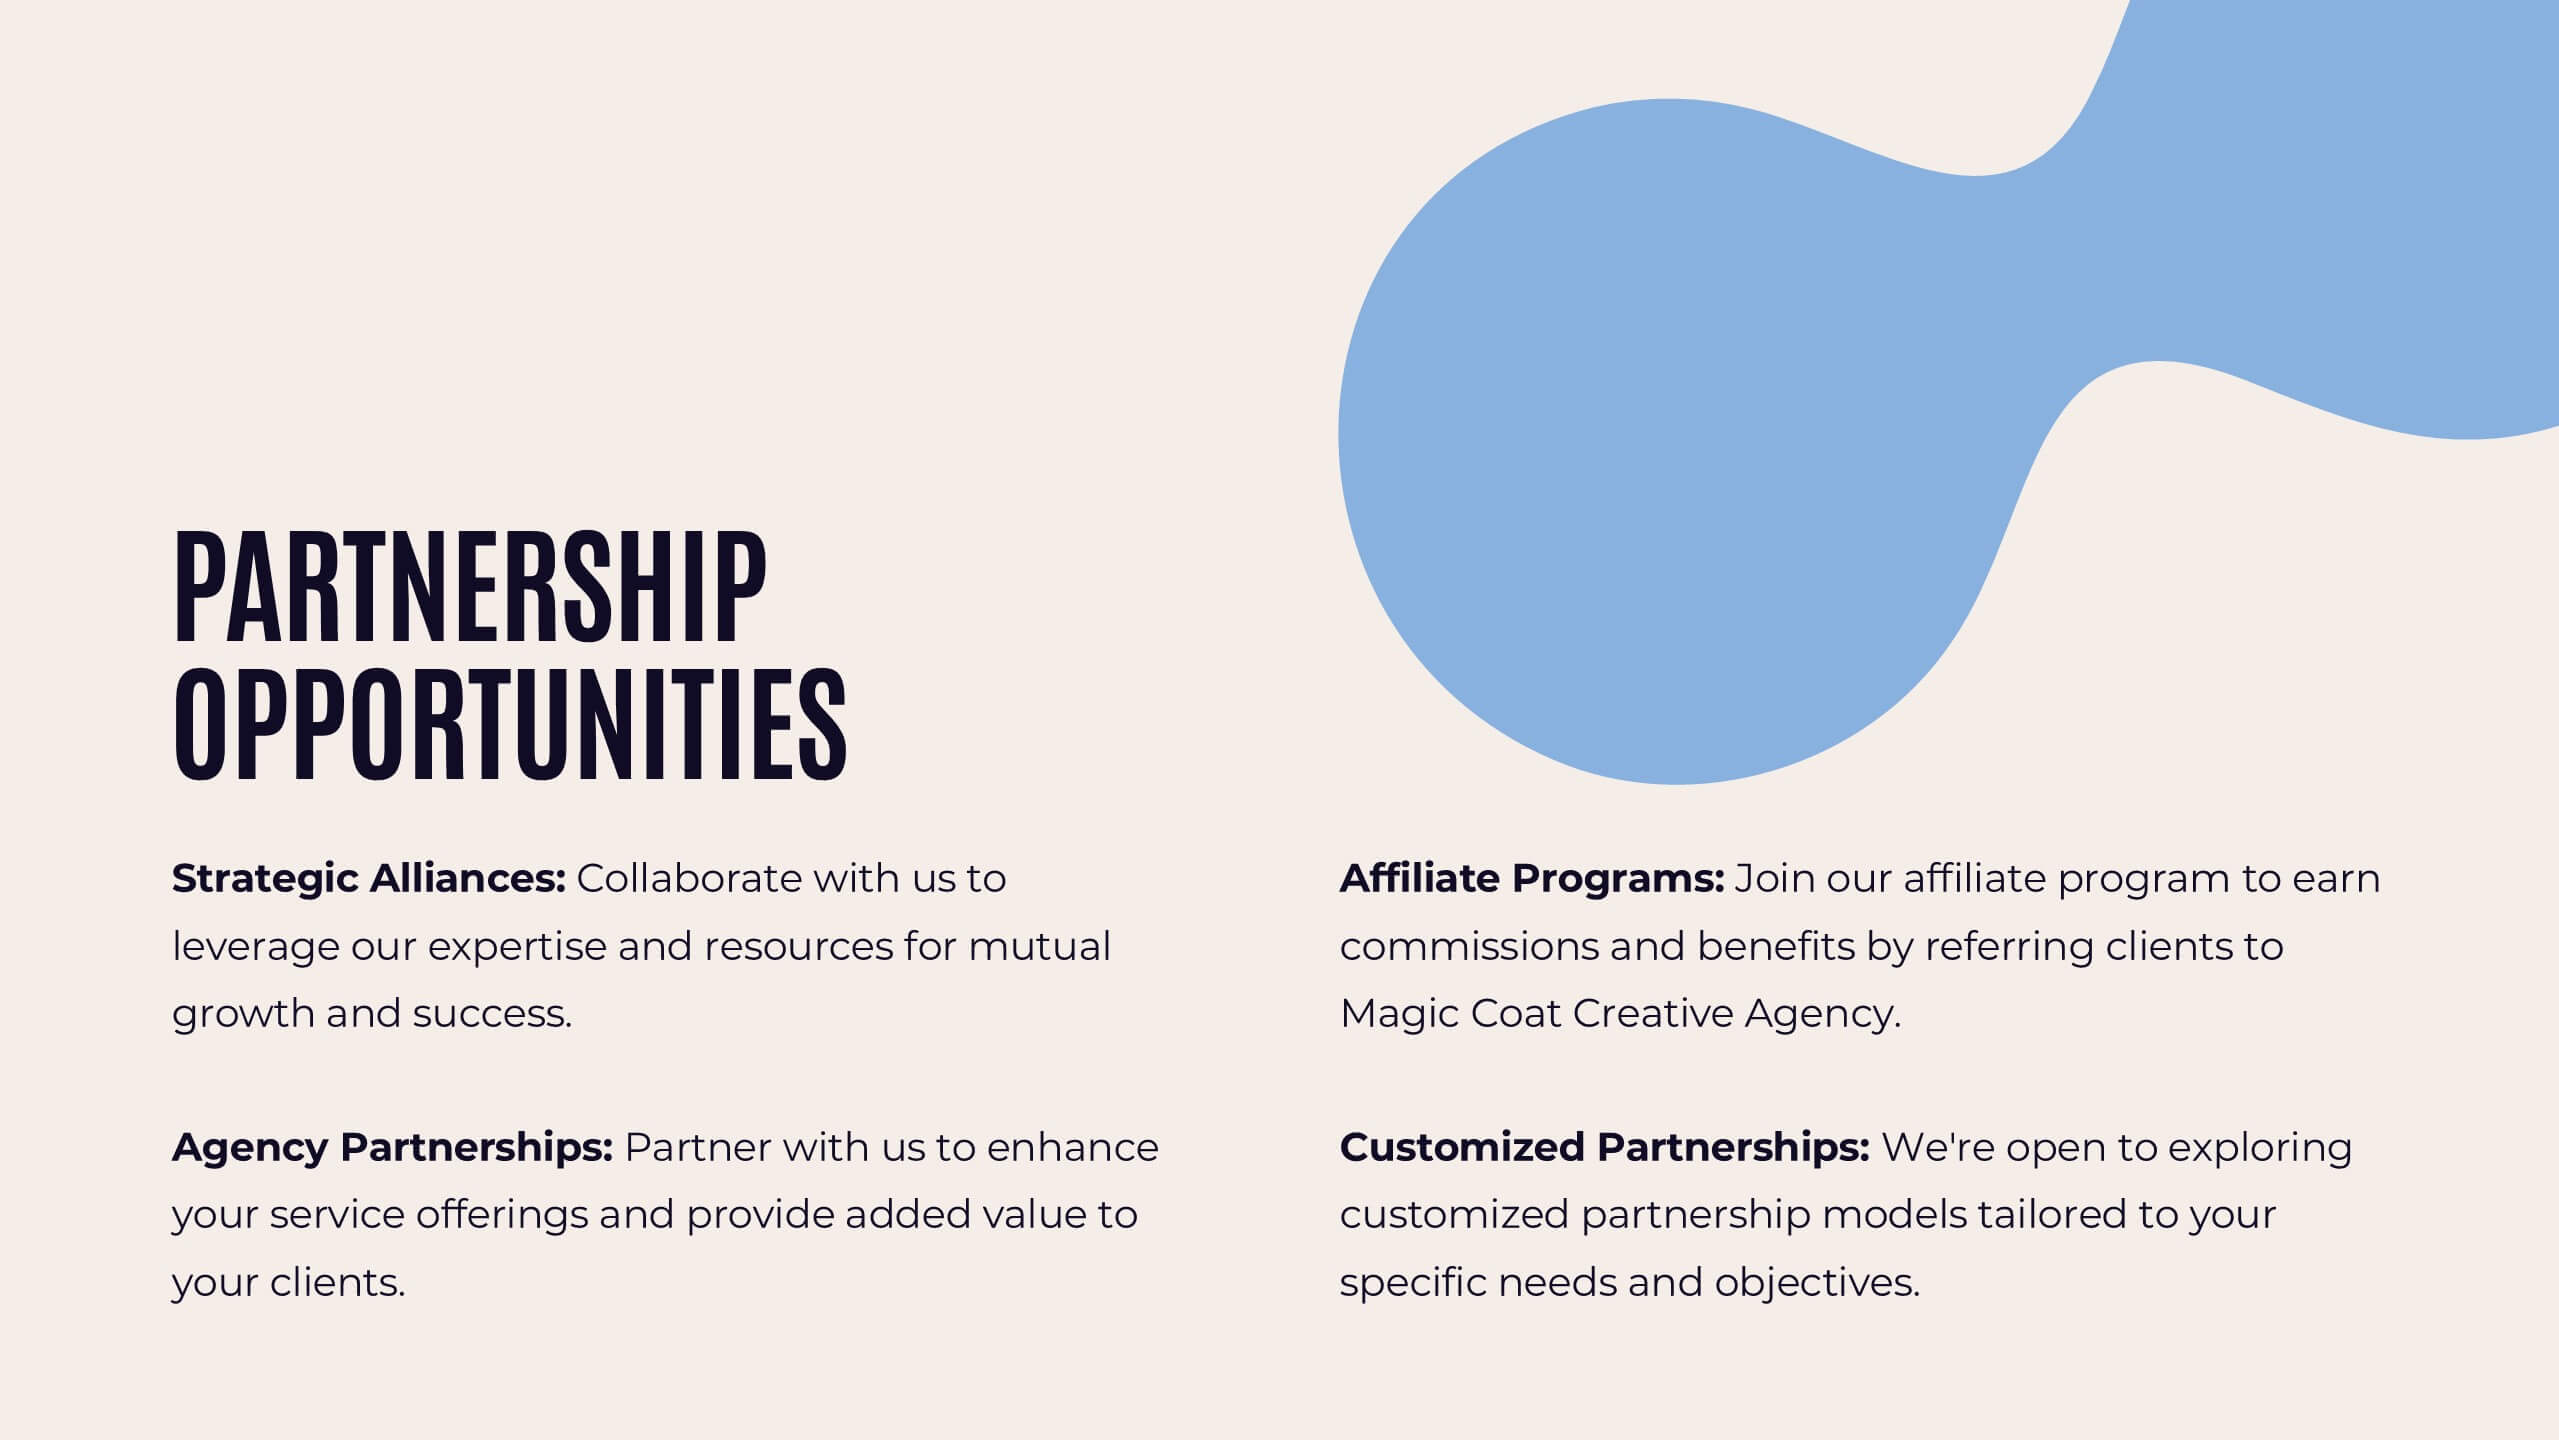
Orion Creative Agency Pitch Deck Presentation
The Orion Creative Agency Portfolio is a visually stunning and comprehensive presentation template designed to showcase your agency's unique strengths and achievements. The first slide sets the tone with a clean and modern design, perfect for capturing your audience's attention. Following the introduction, the template takes you through an impressive journey of client success stories, highlighting the impact and value your agency brings to the table. The industry trend analysis and competitive landscape sections offer a deep dive into the market, positioning your agency as a leader in the field. You'll also find dedicated slides for your approach, creative process, and campaign execution, ensuring every detail of your agency's methodology is presented clearly. Testimonials and partnership opportunities add credibility, while the future outlook and social impact initiatives highlight your agency's forward-thinking and commitment to positive change. This template is fully compatible with PowerPoint, Keynote, and Google Slides, making it an ideal choice for any agency presentation.


6 diapositivas
Breast Cancer Effects Infographic
Breast Cancer Awareness Month, is an annual international health campaign organized by various organizations to raise awareness about breast cancer, highlight the importance of early detection and treatment, and provide support for those affected by the disease. This infographic template is a visual representation that provides information about the various effects and impacts of breast cancer on individuals' health, well-being, and daily lives. This infographic can be used to raise awareness, educate, and support individuals who are affected by breast cancer, as well as their families and communities.


5 diapositivas
Behavioral Psychology in the Workplace Presentation
Boost employee engagement and team dynamics with the Behavioral Psychology in the Workplace Presentation. This slide deck is designed to help HR leaders, managers, and consultants visualize psychological insights that shape workplace behavior. Use it to present motivation theories, behavioral models, or communication styles. Fully editable in Canva, PowerPoint, Google Slides, and Keynote.


6 diapositivas
Executive Summary of Findings Presentation
Summarize your key insights with clarity using this Executive Summary of Findings slide. Designed with a centered target icon and surrounding data points, it’s ideal for spotlighting major conclusions. Fully editable in PowerPoint, Keynote, and Google Slides.


5 diapositivas
Eco-Friendly Practices Implementation Presentation
Brighten your message with a clean, circular design that maps out every green initiative step-by-step. This visual template illustrates key eco-conscious actions, helping you present sustainable practices with ease. Perfect for environmental reports, team strategies, or policy pitches. Fully compatible with PowerPoint, Keynote, and Google Slides for flexible editing.


6 diapositivas
IT Architecture System Infographic
IT architecture, referred to as information technology architecture, is a structured framework that defines how an organization's technology systems, applications, processes, and data interact and work together to support its business goals and objectives. This infographic template visually explains the components and structure of an IT architecture system within an organization. The visuals are included to simplify your technical concepts and guide your viewers through the intricacies of IT. This infographic can be customized to fit the specific needs of different organizations. Compatible with Powerpoint, Keynote, and Google Slides.


5 diapositivas
Business Hierarchy Pyramid Presentation
Present your business structure or priorities with clarity using our "Business Hierarchy Pyramid Presentation" template. This infographic elegantly segments different layers or levels within your organization, project, or planning strategy, with a pyramid design that visually emphasizes the foundational to advanced stages. Each level of the pyramid is distinctly colored and labeled, allowing you to easily insert key points or data relevant to each segment. Ideal for corporate presentations, strategic meetings, and management training, this template ensures your key concepts are organized and clearly communicated. Compatible with PowerPoint, Keynote, and Google Slides, it integrates effortlessly into your professional toolkit.


6 diapositivas
Targeted Segment Analysis and Mapping Presentation
Highlight your market focus with the Targeted Segment Analysis and Mapping Presentation. This circular layout is perfect for breaking down five audience segments, using subtle icons and visual emphasis for clarity. Ideal for marketers, strategists, and business analysts presenting niche targeting. Fully editable in Canva, PowerPoint, Keynote, and Google Slides.


5 diapositivas
DMAIC Six Sigma Framework
Visualize process improvement with this clear and structured DMAIC Six Sigma slide. Perfect for business analysts, quality teams, and project managers, it highlights each phase—Define, Measure, Analyze, Improve, and Control—in a streamlined format. Fully editable in PowerPoint, Keynote, and Google Slides.