


Características


¿Tienes alguna pregunta?
Recomendar


6 diapositivas
Business Structure Outline Presentation
Visualize your company’s framework with this modern business structure slide. Perfect for showcasing team roles, departments, or organizational functions, it helps simplify complex relationships into a clear overview. Easily editable in Canva, PowerPoint, and Google Slides—ideal for presentations, planning sessions, or onboarding new employees with a professional, easy-to-follow design.


5 diapositivas
Sustainable Fashion Infographics
Sustainable fashion, also known as eco-fashion or ethical fashion, is an approach to clothing and accessories that aims to minimize the negative environmental and social impacts of the fashion industry. These vertical templates are designed to raise awareness about sustainable practices in the fashion industry. They aim to educate viewers about the environmental and social impacts of fast fashion and highlight the importance of adopting sustainable fashion choices. The template incorporates relevant statistics and facts about the fashion industry's impact on the environment and society. Compatible with Powerpoint, Keynote, and Google Slides.


8 diapositivas
End-to-End Project Lifecycle Management Presentation
Visualize each phase of your project lifecycle with this clean, circular flow layout. Ideal for showcasing planning, execution, and delivery stages in a structured loop. Each segment is fully editable to match your content. Compatible with PowerPoint, Google Slides, and Keynote for effortless customization and professional results.


7 diapositivas
Modern Education Infographic
Immerse yourself in the evolving world of learning with our Modern Education Infographic. With a crisp white canvas, the design incorporates an energizing mix of orange, the trust-building hue of blue, and a dash of passionate red. This template boasts modern infographics, bespoke icons, and versatile image placeholders, offering a visual guide to contemporary educational methods, tools, and trends. Precision-made for Powerpoint, Keynote, or Google Slides. Ideal for educators, curriculum developers, edtech startups, or any professional keen on showcasing the transformation in learning techniques.


11 diapositivas
Company Team Meeting Presentation
Bring your team together with our dynamic Company Team Meeting presentation template. Designed for clarity and engagement, this template sets the stage for productive discussions, from weekly roundups to strategic planning sessions. It begins with a vibrant cover slide that sets an upbeat tone for the meeting, followed by a clear agenda to keep your discussion on track. With slides tailored for talking points, updates, upcoming events, and deadlines, it helps you streamline the flow of information. The template includes sections for announcements and feedback, encouraging open dialogue. Ground rules are laid out to foster a respectful and collaborative environment, while the progress and challenges slides are perfect for a transparent review of the company's status and addressing any hurdles head-on with practical solutions. This template, adaptable to PowerPoint, Keynote, and Google Slides, not only captures attention with its colorful design but also reinforces team cohesion and focus on common goals. Use it to energize your team meetings and ensure everyone leaves aligned and motivated.


26 diapositivas
Cryptocurrency Technology Presentation
The foundation of cryptocurrency technology is the blockchain, cryptocurrency has the potential to transform the way we think about money and financial transactions, and it continues to evolve. With this template present the latest information on cryptocurrency and the emerging blockchain technologies. This features a variety of high-quality slides in many formats. Whether you want them to be edited on Keynote, PowerPoint, or google sheets this template has everything you need to make the most out of your presentation. Get creative and add your own style with this presentation template!


8 diapositivas
Meeting Agenda Presentation
Streamline your meeting agendas with our "Meeting Agenda Presentation" template. This design features a central node linked to four key points, each representing a separate agenda item, ensuring a clear and organized discussion flow. Color-coded segments aid in visually distinguishing between topics, making it easy for participants to follow and engage. Ideal for team meetings, project updates, and strategic discussions, this template enhances communication and efficiency. Its intuitive layout keeps your sessions on track and productive. Compatible with PowerPoint, Keynote, and Google Slides, it's an essential tool for any professional aiming to optimize their meeting presentations.


10 diapositivas
Work Schedule Planning Slide
Visualize your team's daily workflow and time management with this clock-style work schedule slide. Perfect for highlighting shift changes, project timelines, or key work intervals. Fully editable and available for PowerPoint, Keynote, and Google Slides to match your project’s branding and scheduling needs.


22 diapositivas
SEO Report Presentation
Optimize your SEO strategies using our comprehensive SEO Report template. It includes sections for keyword performance, market trends, competitor insights, and client feedback. Tailored for digital marketers and SEO specialists, this template supports presentations in PowerPoint, Keynote, and Google Slides.


7 diapositivas
Customer Profile Marketing Infographic
Illuminate your marketing strategy with our finely-tuned customer profile marketing infographic. Bathed in the clarity of white, the trust of blue, the optimism of yellow, and the zest of orange, our template provides a vibrant palette to showcase diverse customer personas. Detailed with insightful infographics, expressive icons, and adaptable image placeholders, it deciphers intricate customer data into an actionable marketing narrative. Exquisitely designed for Powerpoint, Keynote, or Google Slides. A must-have tool for marketers, sales strategists, and businesses looking to tailor their approach to different customer segments. Engage effectively; let every slide refine your audience understanding.


6 diapositivas
State-by-State Business Distribution Map Presentation
Visualize regional performance with this State-by-State Business Distribution Map template. Ideal for showcasing business coverage, sales territories, or demographic trends across the U.S. Each state is color-coded for clarity, with editable text and icons. Fully compatible with PowerPoint, Keynote, and Google Slides—perfect for executives, marketers, or analysts.


3 diapositivas
Governance and Compliance Slide Presentation
Bring structure and clarity to complex corporate processes with this modern triangle-based presentation design. Ideal for showcasing governance principles, compliance strategies, and operational standards, it visually balances accountability and efficiency. Fully editable and compatible with PowerPoint, Keynote, and Google Slides for seamless professional customization.


6 diapositivas
Project Rollout Milestone Timeline Presentation
Visually map out your project phases with the Project Rollout Milestone Timeline Presentation. Featuring a modern cylinder path layout, this slide is perfect for showcasing five key milestones in sequential or strategic order. Ideal for project managers and teams, and fully editable in Canva, PowerPoint, Keynote, and Google Slides.


5 diapositivas
Startup Business Plan Presentation
Launch your ideas with clarity using this Startup Business Plan slide template. The rocket-inspired visual guides your audience through five strategic stages, each labeled with editable icons and titles—perfect for pitching goals, financials, timelines, or key operations. Ideal for entrepreneurs and early-stage companies, this slide is easy to customize in PowerPoint, Keynote, or Google Slides.


6 diapositivas
Organizational Change Management Presentation
Visualize transformation with clarity using this structured slide, perfect for outlining your change roadmap, initiatives, or strategic phases. The layout features six labeled steps with icons and editable text for seamless communication of your process—from awareness to adoption. Ideal for HR leaders, consultants, and operations managers. Fully editable in PowerPoint, Keynote, and Google Slides.


8 diapositivas
Product Showcase on Devices Presentation
Present your features in a sleek, mobile-first layout with the Product Showcase on Devices Presentation. This vertical slide design mimics a smartphone screen, making it ideal for displaying app features, service tiers, or digital tool highlights. Each section is clearly segmented, perfect for comparisons or step-by-step product walkthroughs. Fully editable in PowerPoint, Keynote, Canva, and Google Slides.


21 diapositivas
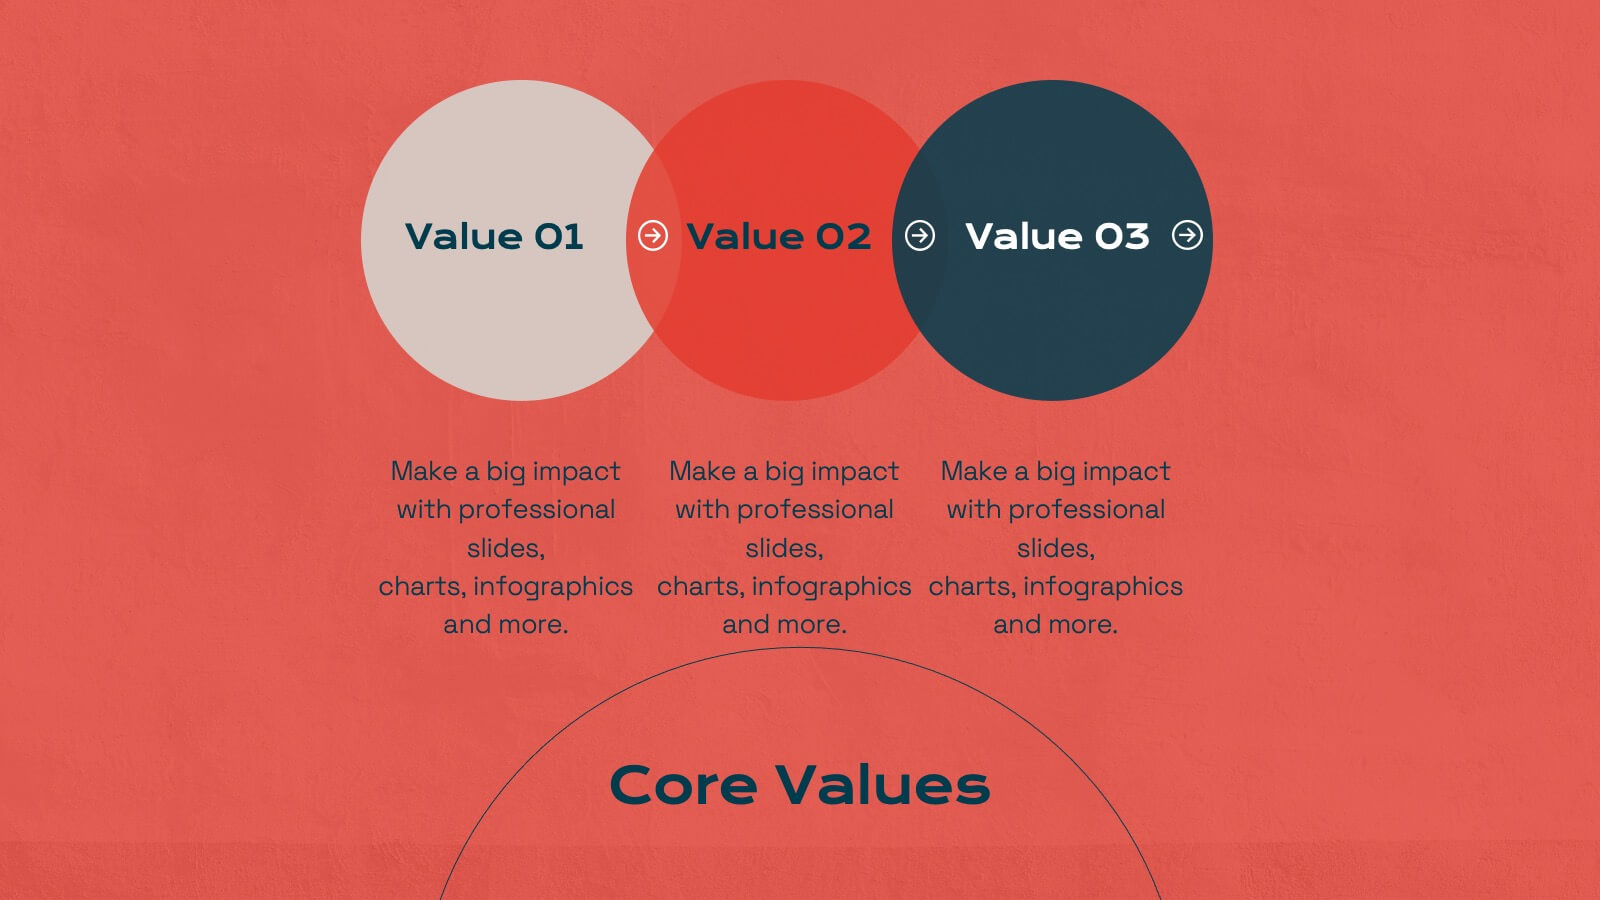
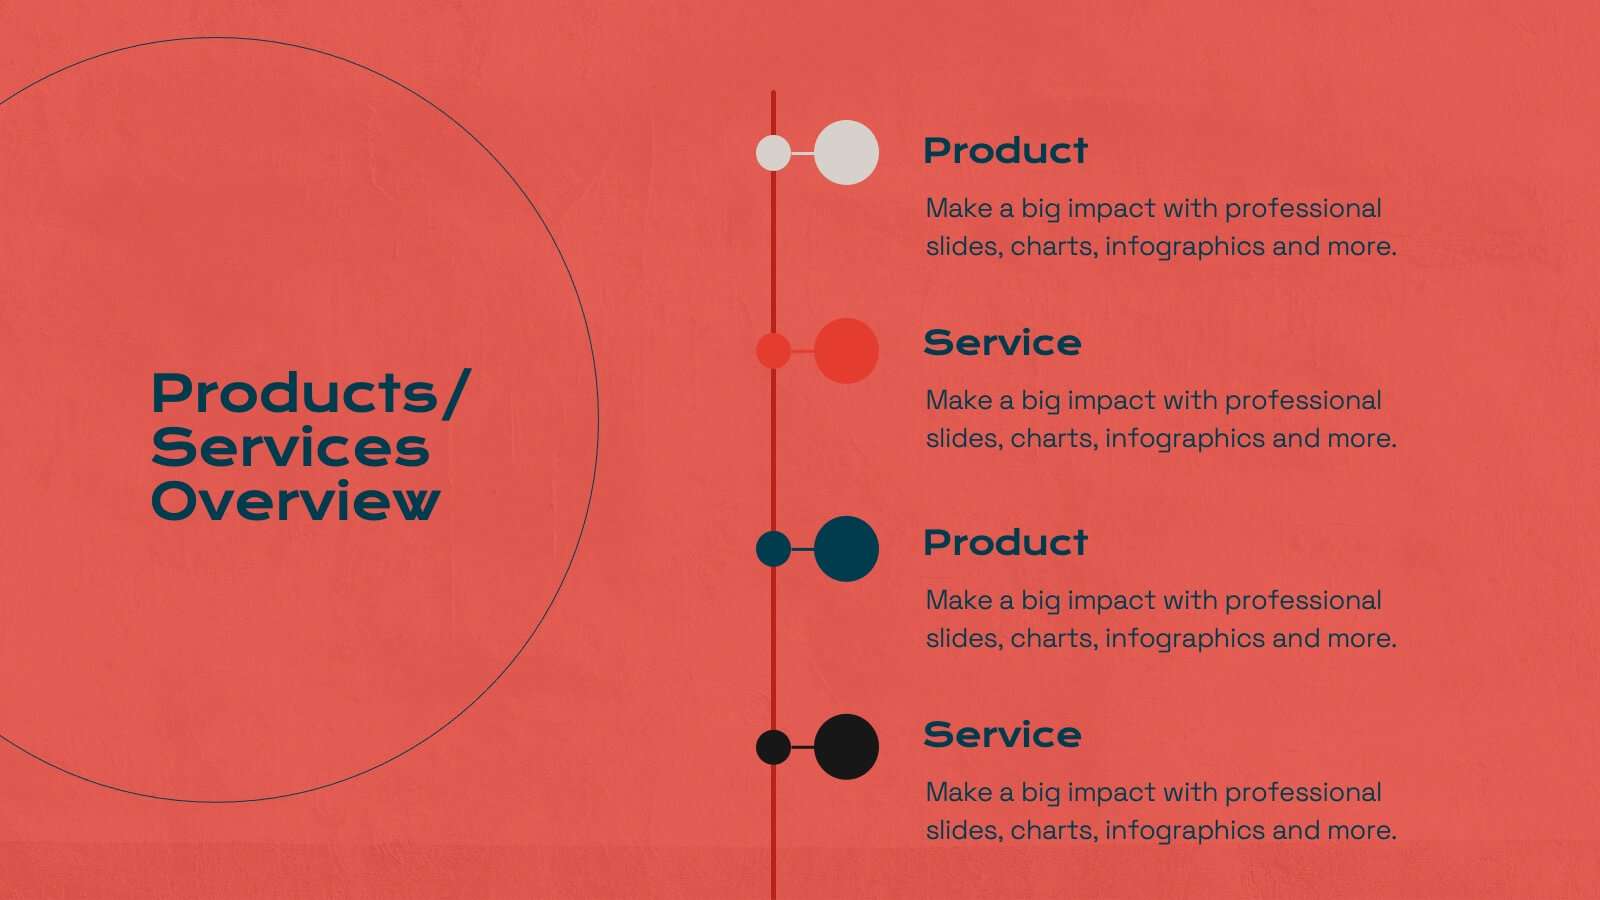
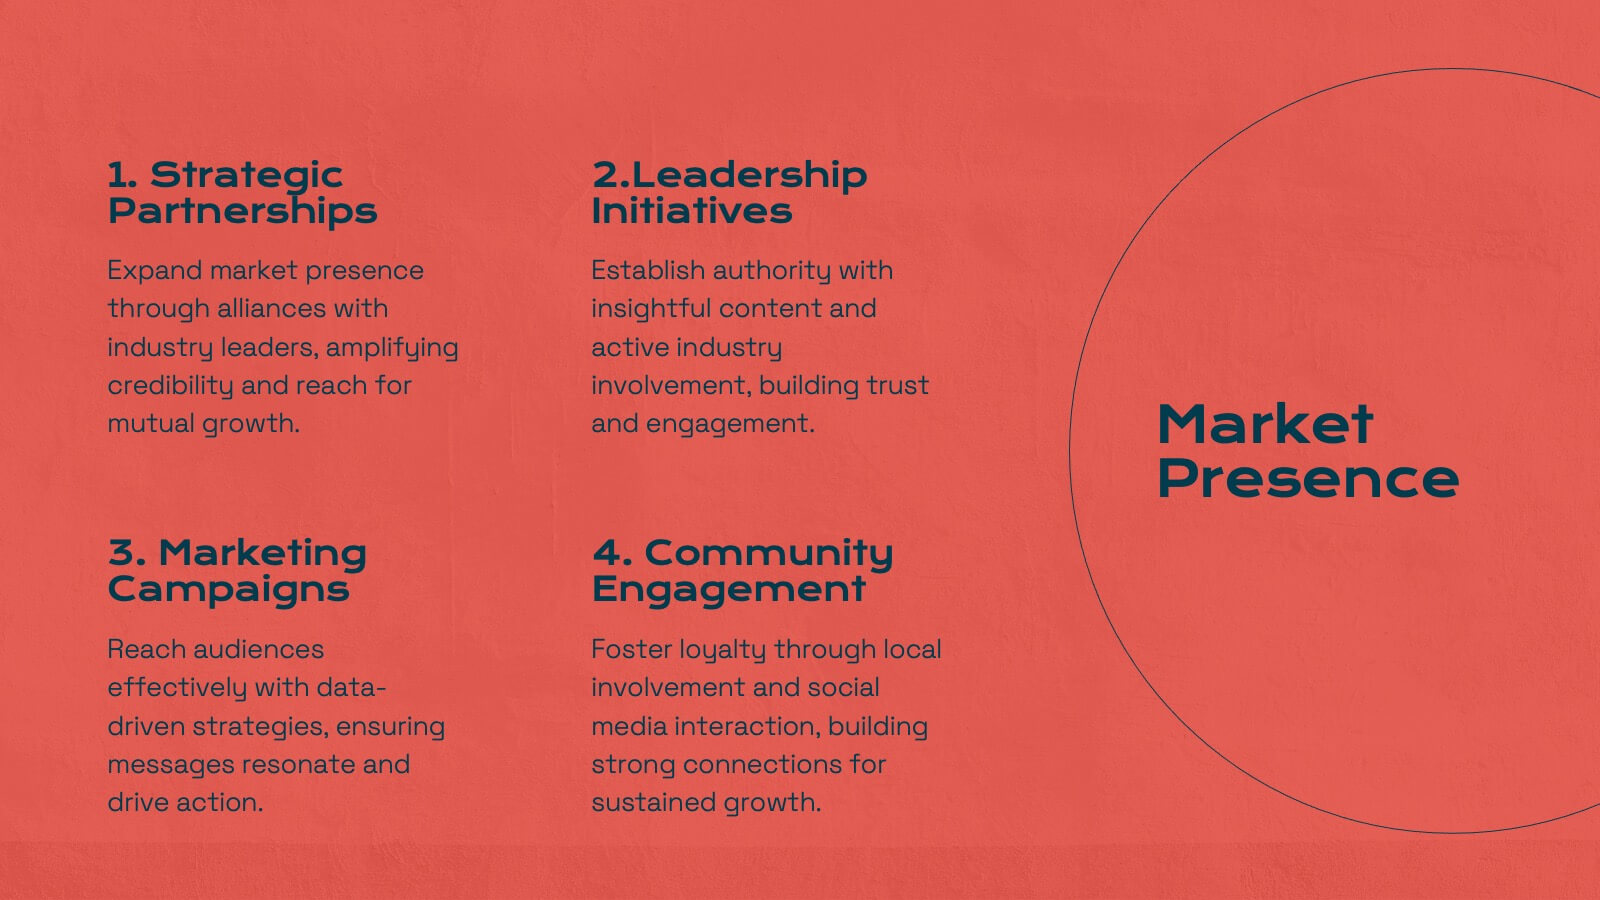
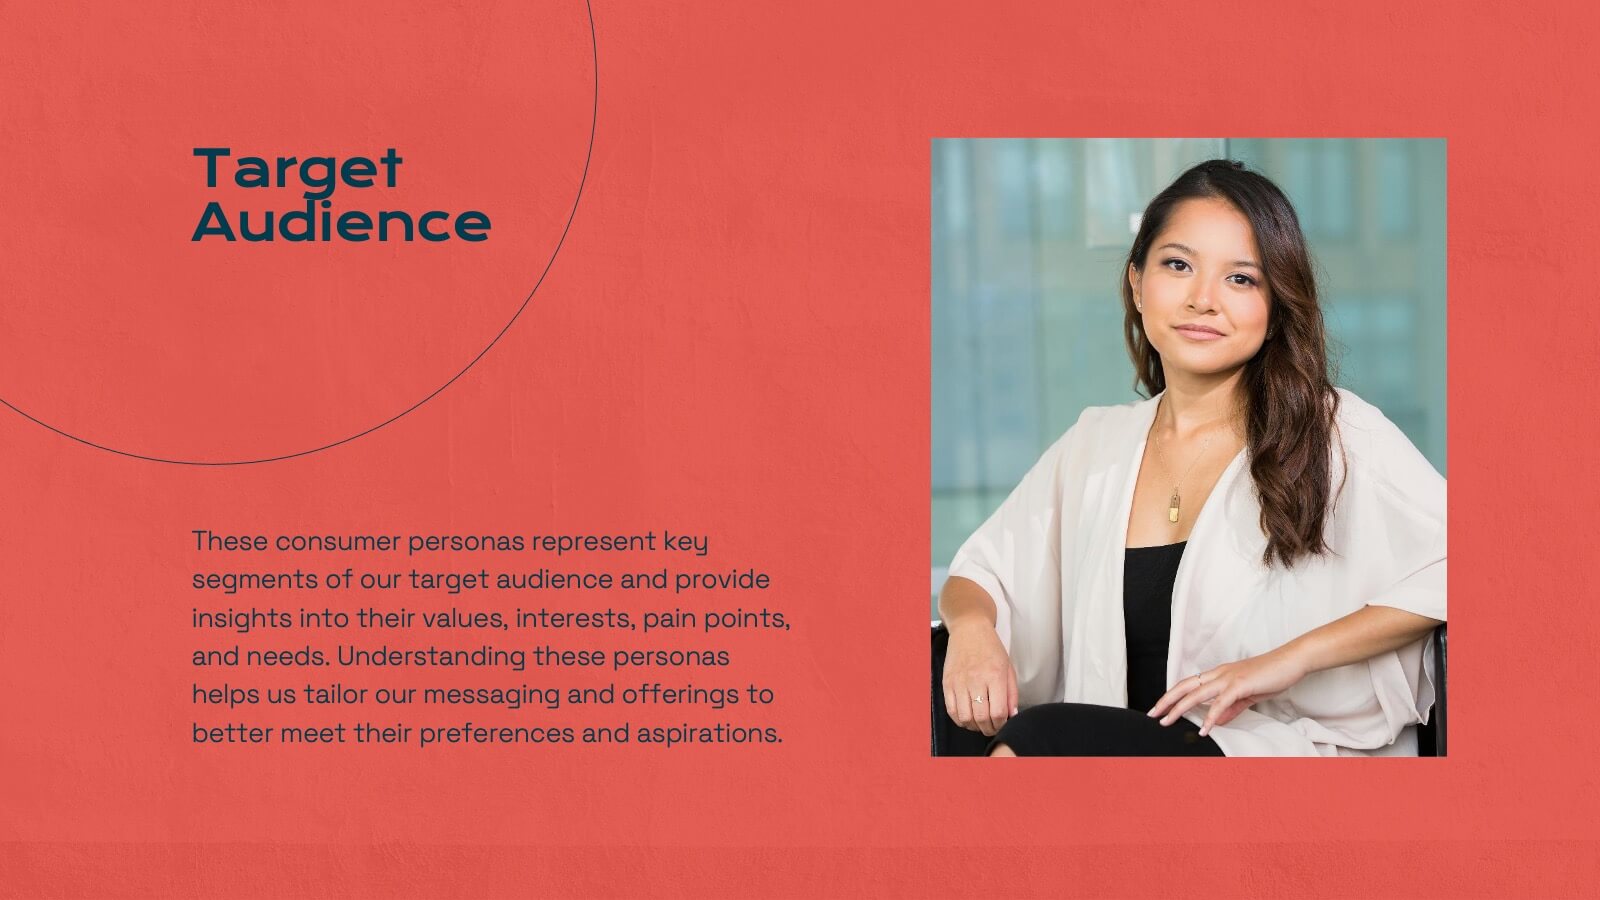
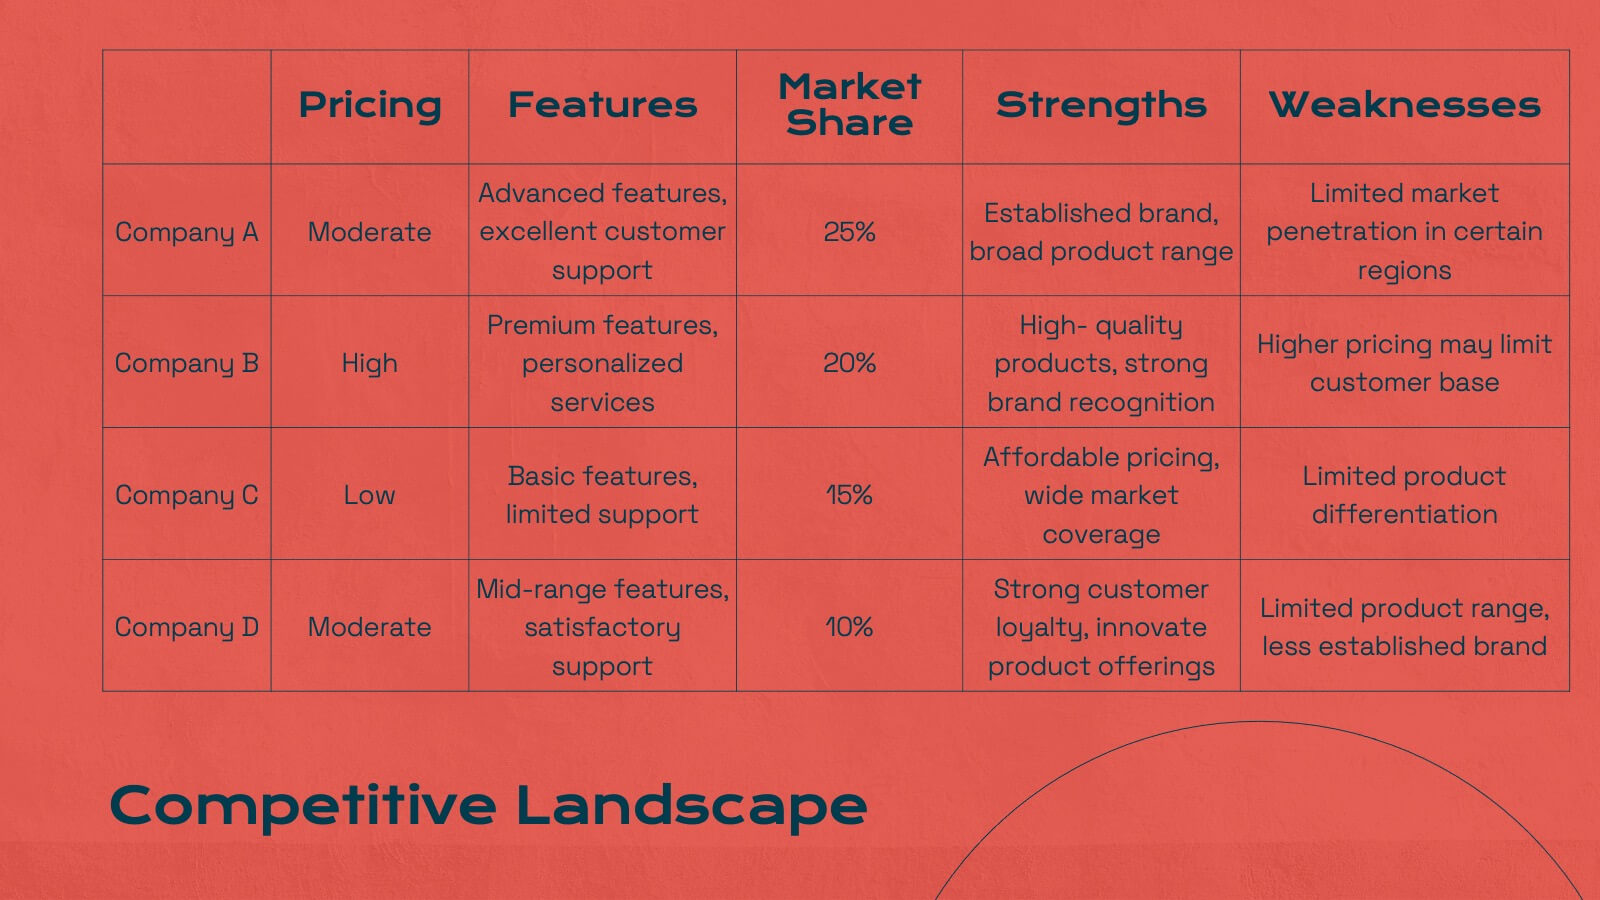
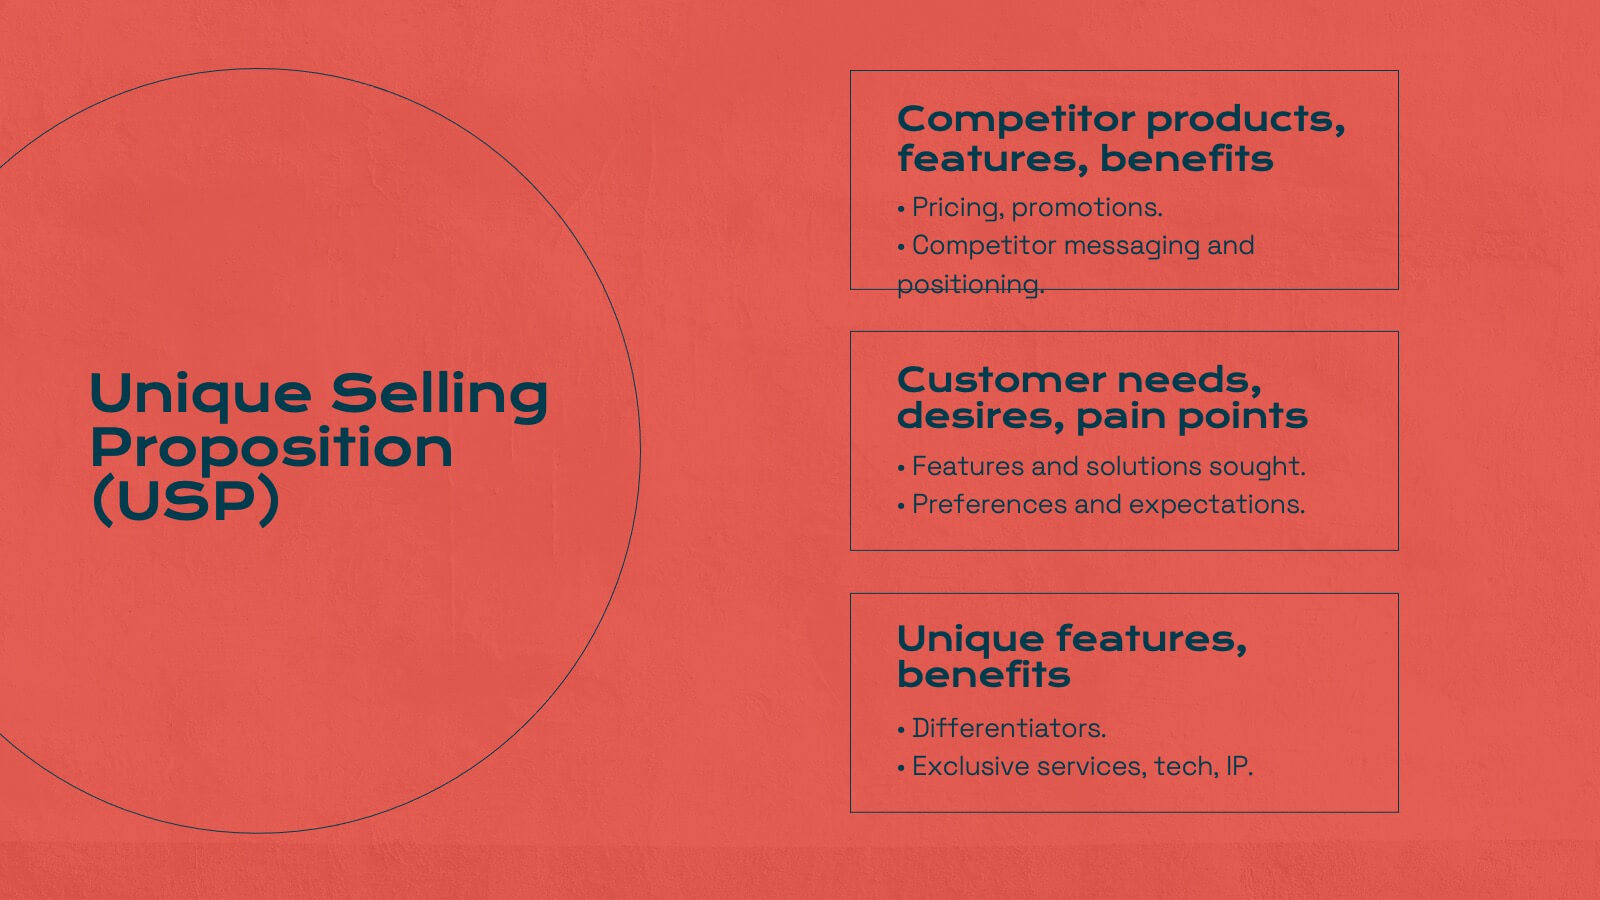
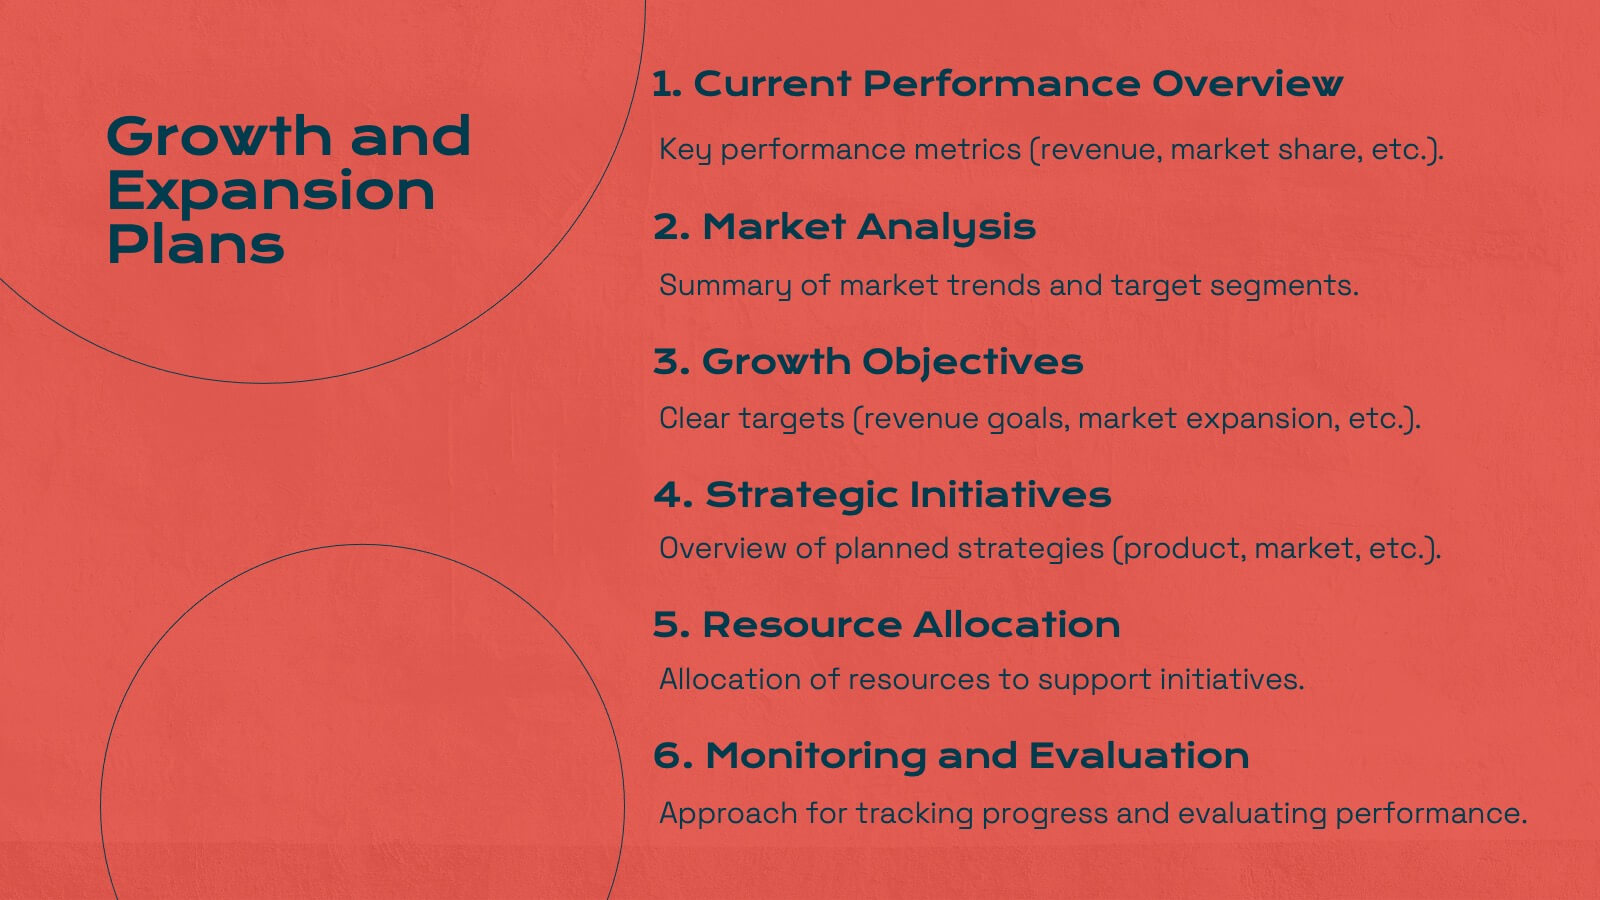
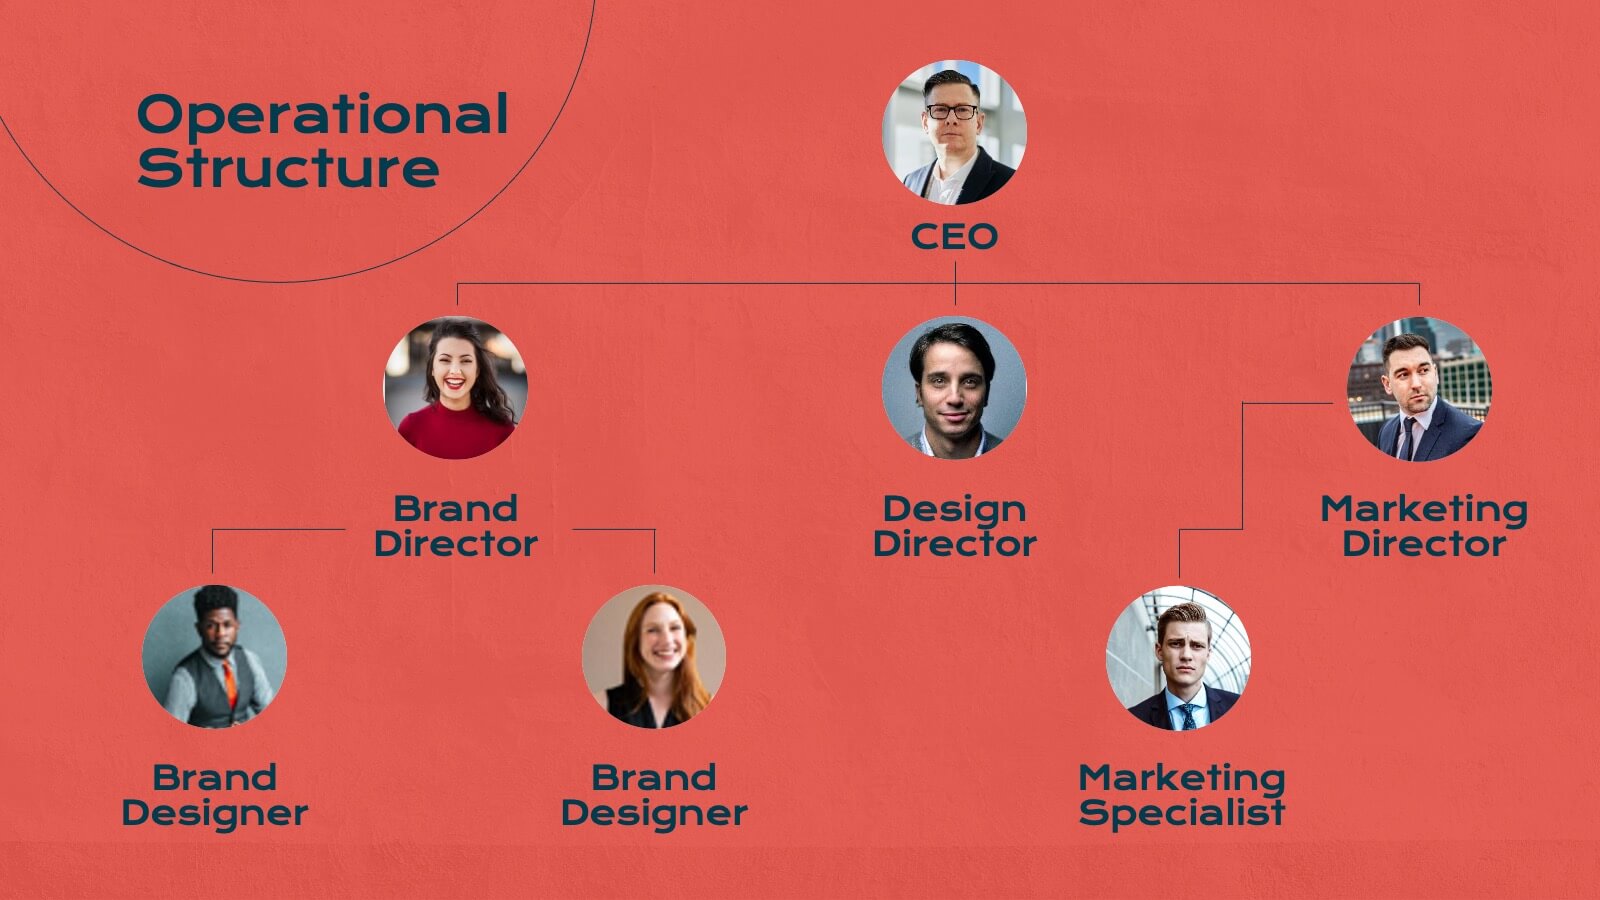
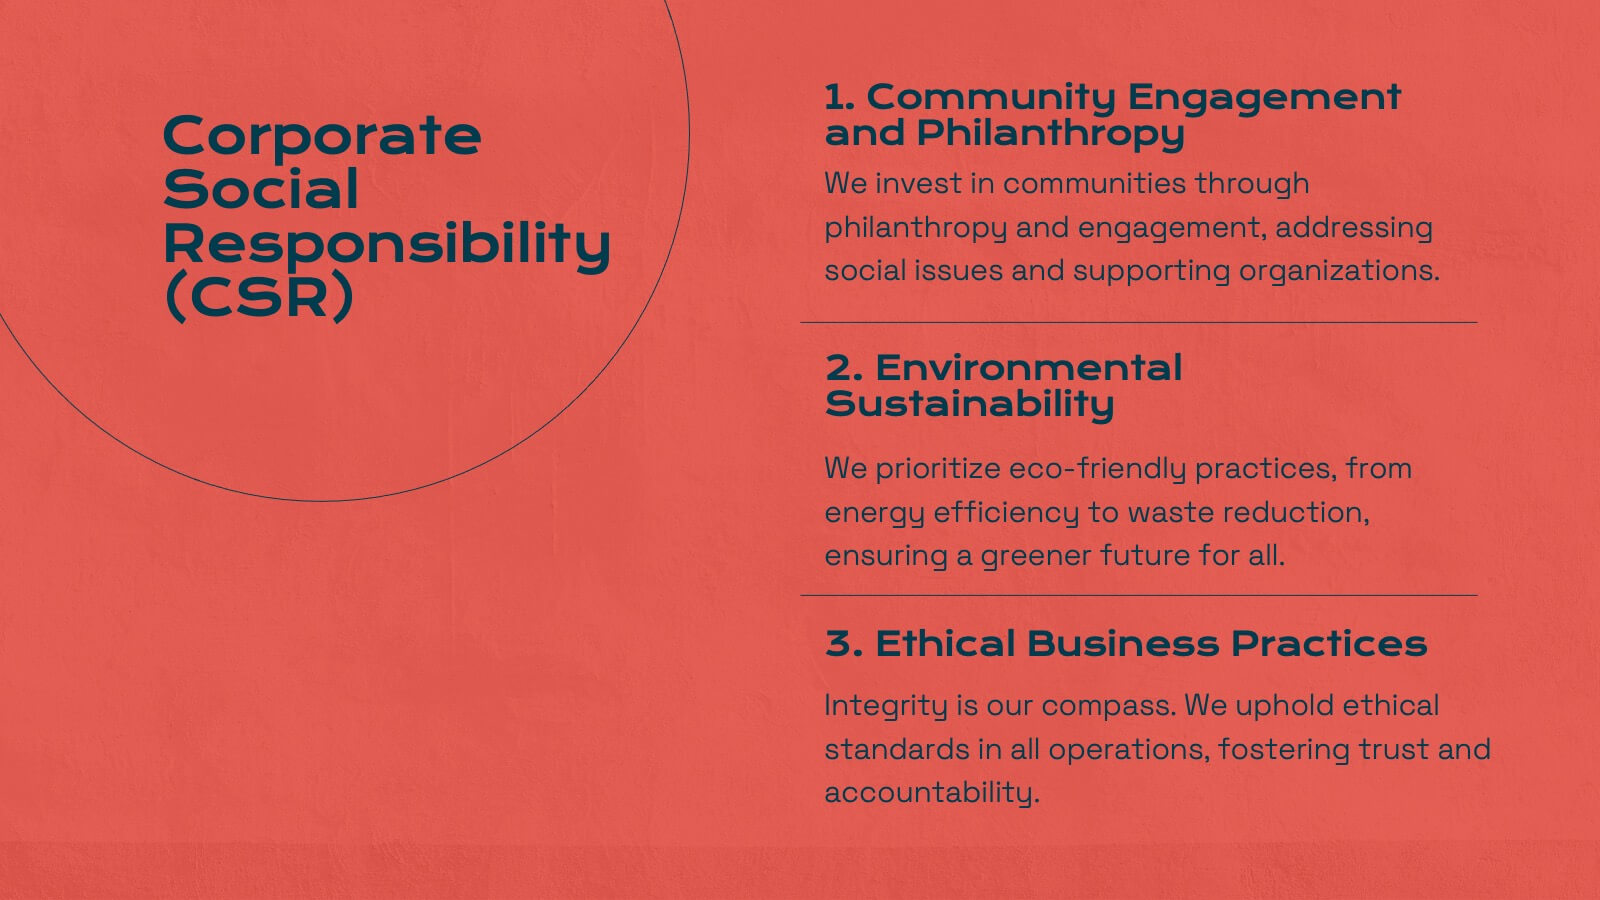
Titan Marketing Research Report Presentation
Energize your marketing research presentations with this bold, vibrant template. Perfect for detailing company history, market presence, and competitive landscapes, it features a striking red design that captures attention. Highlight key insights like target audience, financial highlights, and growth plans to engage your audience. Compatible with PowerPoint, Keynote, and Google Slides, it ensures seamless presentations on any platform.