


Características


¿Tienes alguna pregunta?
Recomendar


22 diapositivas
Nebulark Advertising Agency Proposal Presentation
An engaging proposal template designed for advertising agencies to showcase services, strategy, and client success stories. Features sections for mission, market analysis, creative processes, and partnership opportunities. Fully customizable and compatible with PowerPoint, Keynote, and Google Slides to craft compelling pitches and win over potential clients.


23 diapositivas
Cycladic UX Design Presentation
The Cycladic UX Design Presentation Template is a bold and vibrant choice for showcasing your UX/UI design projects. With its striking pink and black color scheme, this template is designed to grab attention and keep your audience engaged. It covers all essential aspects of UX design, from project overviews and user research to wireframes, prototyping, and UI design principles. Each slide is thoughtfully designed to present your content clearly and effectively, making it ideal for designers who want to highlight their process, showcase their work, and communicate their design thinking.


5 diapositivas
Strategic Growth Next Steps
Highlight your business roadmap with this rocket-themed infographic tailored for strategic growth. Ideal for showcasing step-by-step initiatives or departmental alignment, it features five labeled stages with ample space for insights and icons. Fully editable in PowerPoint, Keynote, and Google Slides—perfect for growth strategy, planning, or vision-setting decks.


6 diapositivas
Business Success Case Study
Showcase your brand's impact with this clean, image-forward case study slide. Designed for storytelling, it outlines the Problem, Solution, and Approach alongside a product image—perfect for client wins, pitch decks, and brand storytelling. Fully customizable in PowerPoint, Keynote, and Google Slides.


10 diapositivas
Corporate Law Slide Deck Presentation
Bring balance and clarity to your corporate presentations with this sleek, professional layout designed to simplify complex legal or business concepts. Ideal for illustrating compliance frameworks, policy comparisons, or decision-making strategies, it combines precision with visual appeal. Fully compatible with PowerPoint, Keynote, and Google Slides for effortless editing and customization.


26 diapositivas
Thadd Presentation Template
Thadd presents your business in a professional light. The bold fonts and colors make for a clean, professional aesthetic that won't distract from your message. It features a strong horizontal identity that instantly communicates your brand. Charts, timelines and easy to edit text give this template an edge over the competition. It comes with easy to edit text and images, making changing content a breeze. It makes for a great business tool for companies who want to get their message across without wasting time on graphics and design. Invest in your future and download this template today.


22 diapositivas
Aurorafrost Project Timeline Presentation
A sleek timeline-focused presentation template that showcases project overviews, objectives, deliverables, and milestones. Perfect for tracking budgets, resource allocation, stakeholder analysis, and quality assurance plans. Includes modern layouts for seamless planning and execution. Fully editable for a range of industries, compatible with PowerPoint, Keynote, and Google Slides for polished results.


6 diapositivas
Business Milestone Timeline Presentation
Showcase key achievements and future goals with the Business Milestone Timeline Presentation. This visually engaging template allows you to highlight crucial company events, project phases, or strategic plans in a clear, structured format. Ideal for corporate reporting, business growth tracking, and investor presentations. Fully customizable and compatible with PowerPoint, Keynote, and Google Slides.


10 diapositivas
Teamwide Business Implementation Plan Presentation
Visualize your implementation roadmap with this team-focused progress slide. Featuring circular avatars, percentage bars, and milestone titles, it’s ideal for highlighting departmental progress or execution timelines. Fully editable in PowerPoint, Keynote, and Google Slides—perfect for internal updates, leadership reviews, or showcasing collaborative performance across business functions.


21 diapositivas
Mythspire Market Research Presentation
This market research template offers a clean design for presenting objectives, data collection, analysis, and findings. Perfect for showcasing research methodologies, visualizations, and actionable recommendations. Fully customizable and ideal for business or academic presentations. Compatible with PowerPoint, Keynote, and Google Slides.


5 diapositivas
5-Year Strategic Roadmap Slide Presentation
Take your audience on a dynamic journey with a flowing, milestone-based layout that makes long-term planning feel clear and engaging. This presentation helps you map out goals, priorities, and key initiatives across five years with structure and clarity. Ideal for strategy meetings and planning sessions. Fully compatible with PowerPoint, Keynote, and Google Slides.


23 diapositivas
Agency Portfolio Presentation
Elevate your creative agency's presentation with this Agency Portfolio template. It highlights your best projects, core competencies, client testimonials, and unique services. Ideal for showcasing a professional portfolio, it’s compatible with PowerPoint, Keynote, and Google Slides, facilitating a dynamic and engaging presentation experience.


6 diapositivas
Top Priorities Business List Presentation
Streamline your workflow with this structured priorities list template. Designed for business professionals, it visually organizes key tasks, helping teams focus on top objectives efficiently. With a clean and modern design, it's ideal for strategic planning, productivity tracking, and project management. Fully compatible with PowerPoint, Keynote, and Google Slides.
3 diapositivas
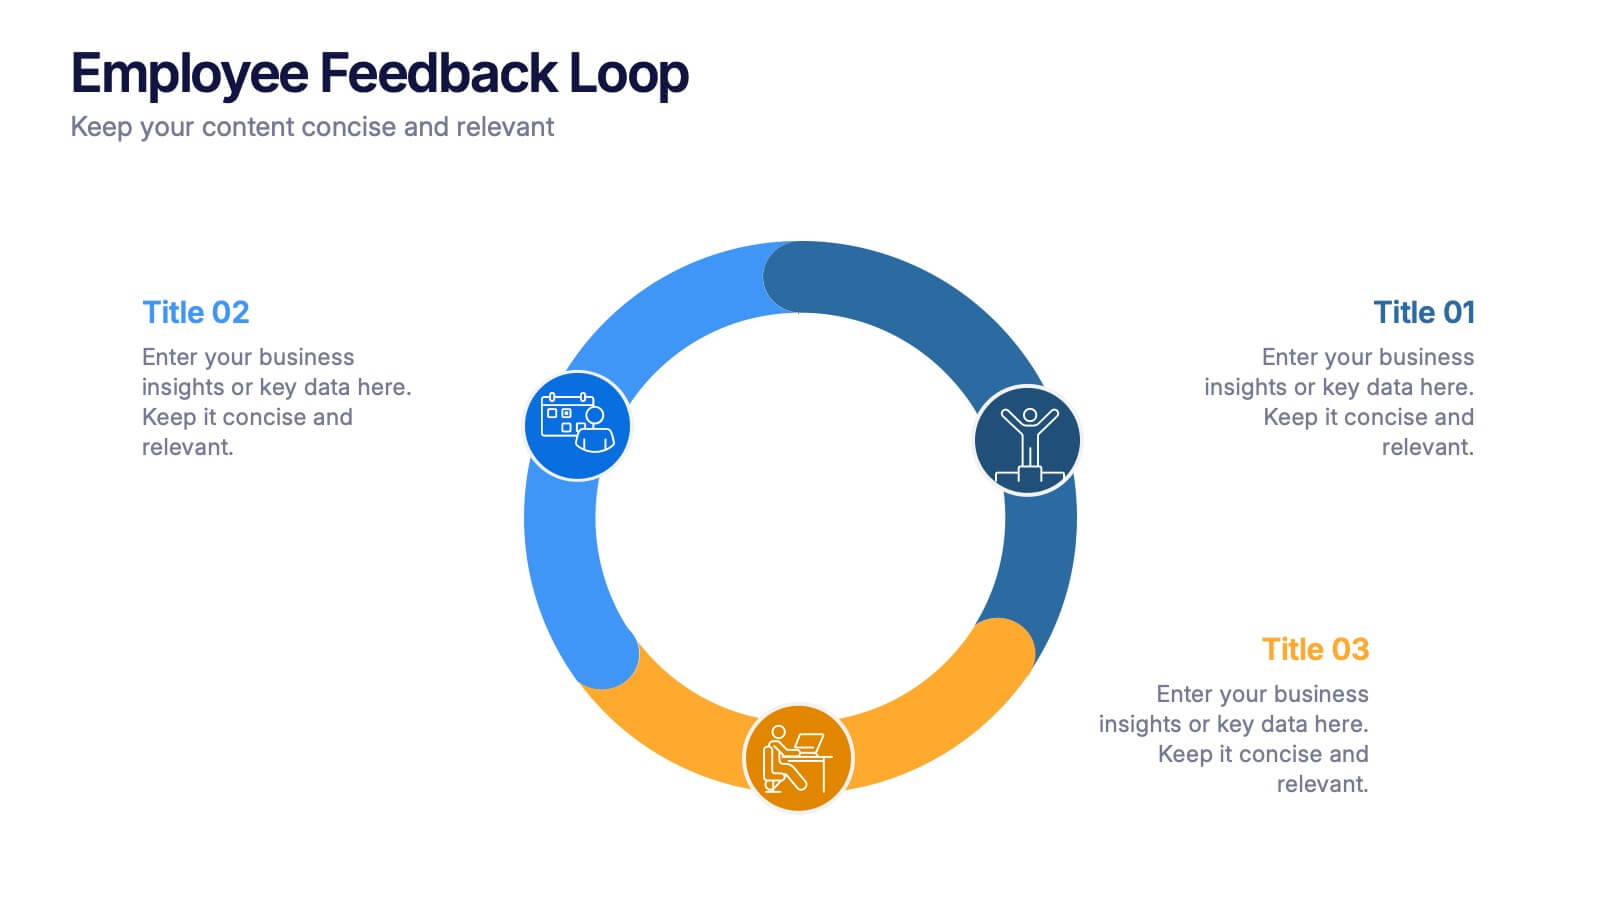
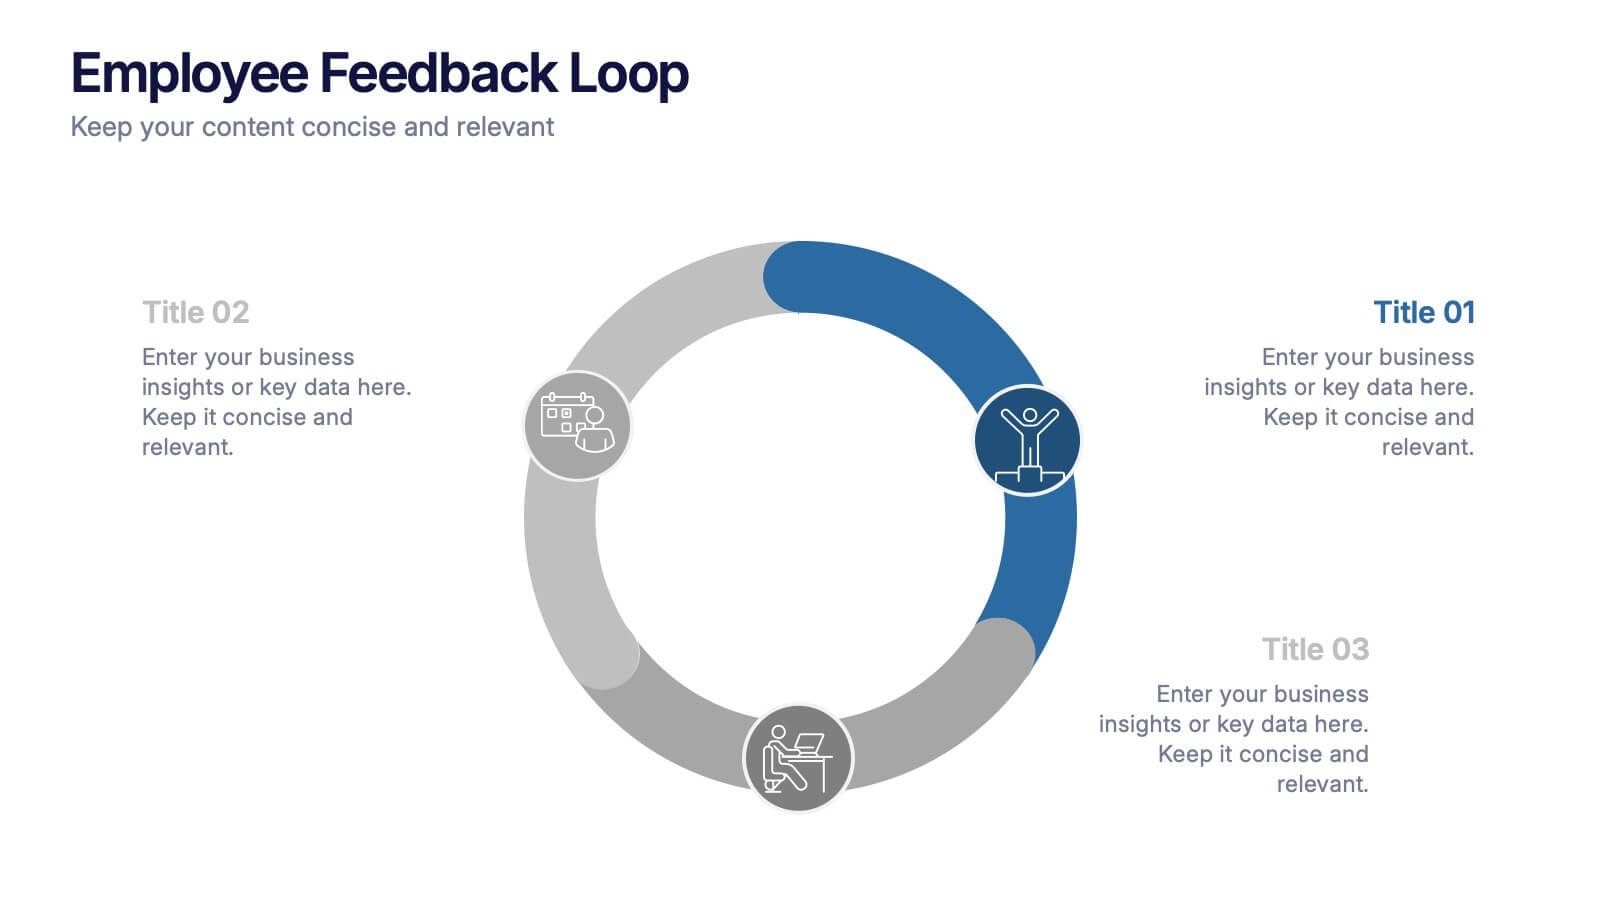
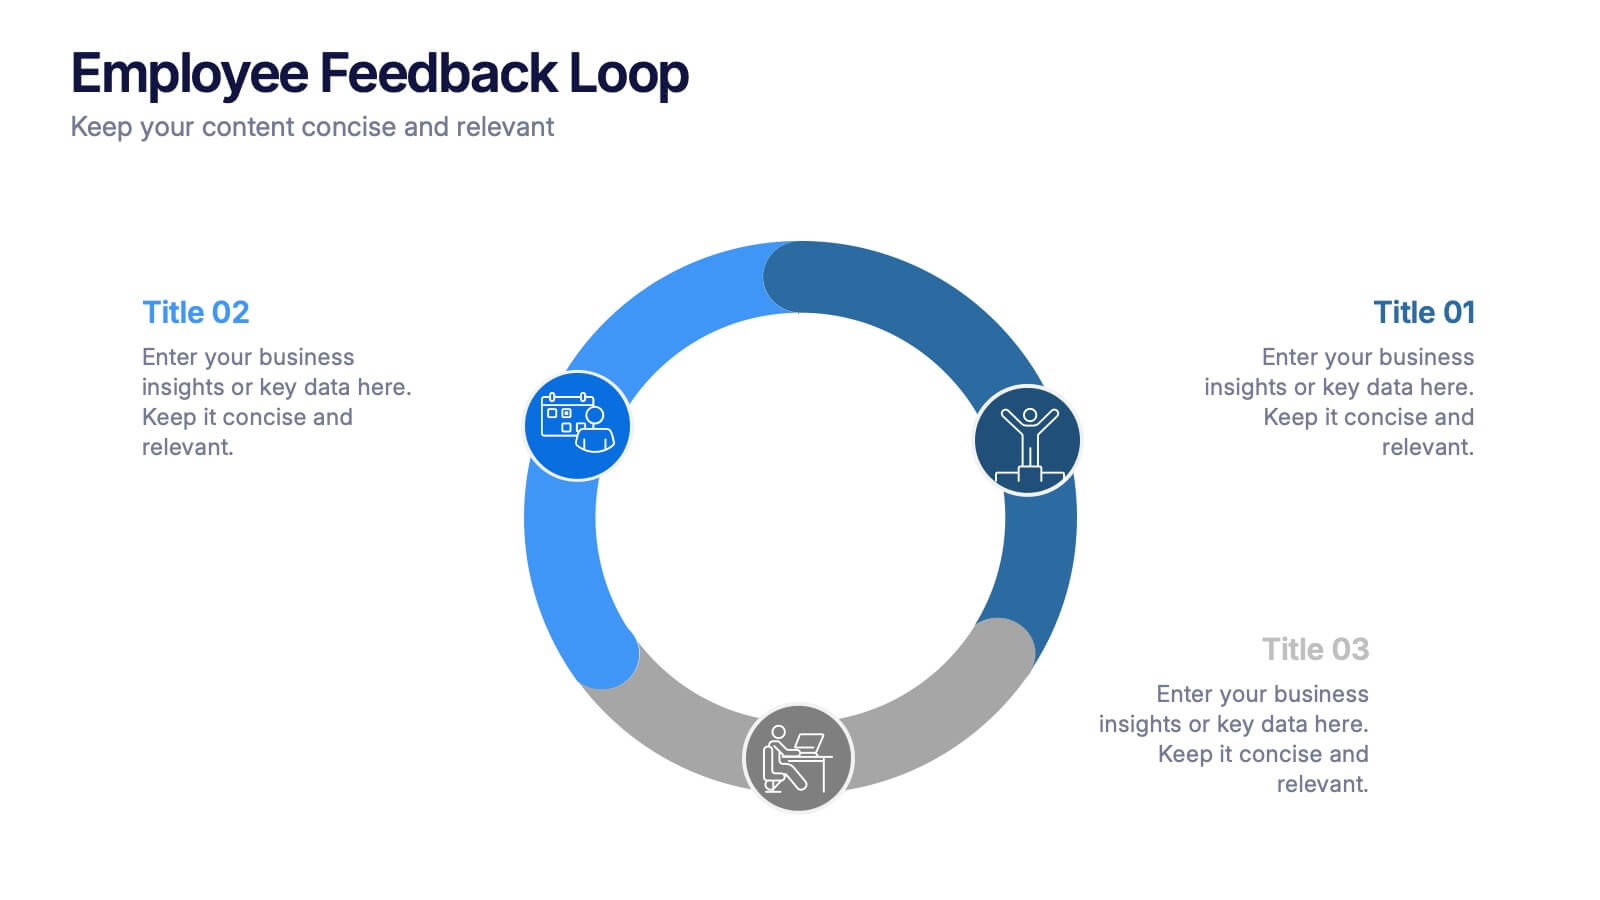
Employee Feedback Loop Presentation
Keep your team connected and continuously improving with this engaging presentation design. Ideal for showcasing communication strategies, feedback cycles, and performance insights, it helps visualize the process of collecting and acting on employee input. Fully customizable and compatible with PowerPoint, Keynote, and Google Slides for effortless, professional presentations.


6 diapositivas
Customer Needs and Segmentation Profile Presentation
Pinpoint what truly drives your audience with the Customer Needs and Segmentation Profile Presentation. This template helps you clearly map customer motivations, preferences, and pain points through segmented icons and visuals. Ideal for marketers and business analysts. Fully editable in Canva, PowerPoint, or Google Slides for easy customization.


5 diapositivas
Online Learning Strategy Slides Presentation
Transform your virtual training ideas into visually engaging lessons with this dynamic presentation. Ideal for educators and online course creators, it helps structure digital learning strategies with clarity and purpose. Clean visuals make complex plans easy to follow. Fully compatible with PowerPoint, Keynote, and Google Slides for effortless customization.


6 diapositivas
Team Leadership and Management
Foster stronger collaboration with this team-focused circular diagram. Designed to showcase six key areas of team leadership, this template is perfect for outlining communication, goal-setting, delegation, performance, feedback, and development strategies. Ideal for managers, trainers, and HR professionals. Fully customizable in PowerPoint, Keynote, and Google Slides.