


Características


¿Tienes alguna pregunta?
Recomendar


12 diapositivas
5 Steps Timeline Template
Visualize your project's progress with our vibrant "5 Steps Timeline Template." This infographic template guides you through the years 2030 to 2070, with colorful, distinct markers for each milestone. Ideal for long-term planning, each slide offers a clear path forward, ensuring your goals are both visual and attainable. Compatible with PowerPoint, Keynote, and Google Slides, this template is perfect for professionals eager to showcase their strategic vision in a memorable way.


4 diapositivas
Decision Analysis Framework Presentation
Make every choice smarter with this structured and visually balanced template designed to showcase options, outcomes, and key insights. Ideal for strategy meetings or data-driven reports, it helps you present decisions with confidence and clarity. Fully editable and compatible with PowerPoint, Keynote, and Google Slides for seamless customization.


5 diapositivas
Vaccine Myths Infographic
Vaccine Myths are false or misleading claims about vaccines that can contribute to vaccine hesitancy and misinformation. These infographic templates are designed to debunk common misconceptions and myths surrounding vaccines. These visually appealing and informative templates are ideal for healthcare professionals, educators, and organizations aiming to promote accurate information about vaccines and combat vaccine hesitancy. These infographics aim to educate and empower individuals to make informed decisions about vaccination and contribute to public health efforts. Compatible with Powerpoint, Keynote, and Google Slides.


5 diapositivas
USA Demographic Map Presentation
Visualize regional insights effortlessly with this USA Demographic Map Presentation. Featuring editable color-coded state maps and matching infographic sections, this template is ideal for presenting population data, customer distribution, or market segmentation. Fully compatible with PowerPoint, Keynote, and Google Slides.


7 diapositivas
Business People Infographic Presentation Template
This Business People infographic template is perfect for a business handbook, corporate presentation and briefing. This template is designed with subtle colors and textures, the clean layout makes it easy to highlight important data and the many components that can be used for different purposes. This is a great, clean and simple way for you to display all the information about your business. This infographic can effectively communicate complex information in a simple and easy-to-understand format, making it an ideal medium for exploring the topic of business people and the business world.


4 diapositivas
SEO Keyword Planning and Ranking Goals Presentation
Stand out in the crowded digital space with bold visuals that simplify complex strategies! This infographic presentation helps you break down SEO keyword planning and ranking goals into clear, layered steps using a funnel format that’s intuitive and professional. Perfect for SEO agencies, marketers, and digital strategists aiming to communicate data-driven insights effectively. Compatible with PowerPoint, Keynote, and Google Slides.


5 diapositivas
Breast Cancer Awareness Day
Raise awareness and educate with this visually impactful Breast Cancer Awareness Day template. Featuring circular infographic elements styled in a breast tissue-inspired layout, this slide design is ideal for campaigns, health education, corporate wellness events, and social initiatives. Each section can be customized with key data, statistics, or actionable messages. Fully editable in PowerPoint, Keynote, and Google Slides.


5 diapositivas
Small Business Plan Presentation
The "Small Business Plan Presentation" template is designed to visually articulate the essential elements of a business strategy effectively. This infographic employs 3D block graphics in varied colors to denote different sections of a business plan, such as market analysis, operations, marketing strategies, and financial projections. Each block is labeled clearly, facilitating an easy understanding and discussion of each business aspect. Ideal for entrepreneurs and small business owners, this template aids in presenting complex information in a straightforward, organized format during meetings with stakeholders or potential investors, ensuring key points are communicated clearly and professionally.


5 diapositivas
Healthcare Innovations and Medical Trends Presentation
Showcase breakthroughs and progress with the Healthcare Innovations and Medical Trends Presentation. This slide features a stylized heart icon with segmented color highlights tied to four labeled icons—perfect for visualizing trends, solutions, or stages in care. Fully editable in Canva, PowerPoint, Keynote, and Google Slides for easy customization.


6 diapositivas
Wellness Program and Health Strategy Presentation
Bring your strategy to life with this clean and creative visual! This presentation template uses a six-part flower design to help you showcase your wellness goals, health strategies, or program pillars with clarity and balance. It’s fully editable and works perfectly in PowerPoint, Keynote, and Google Slides for flexible customization.


22 diapositivas
Nimbus Project Milestones Report Presentation
This project plan template offers a modern, vibrant design that clearly outlines key project components, including problem statements, objectives, deliverables, timelines, and risk management. It’s perfect for teams looking to present a comprehensive project overview. Compatible with PowerPoint, Keynote, and Google Slides for impactful presentations with a polished look!


21 diapositivas
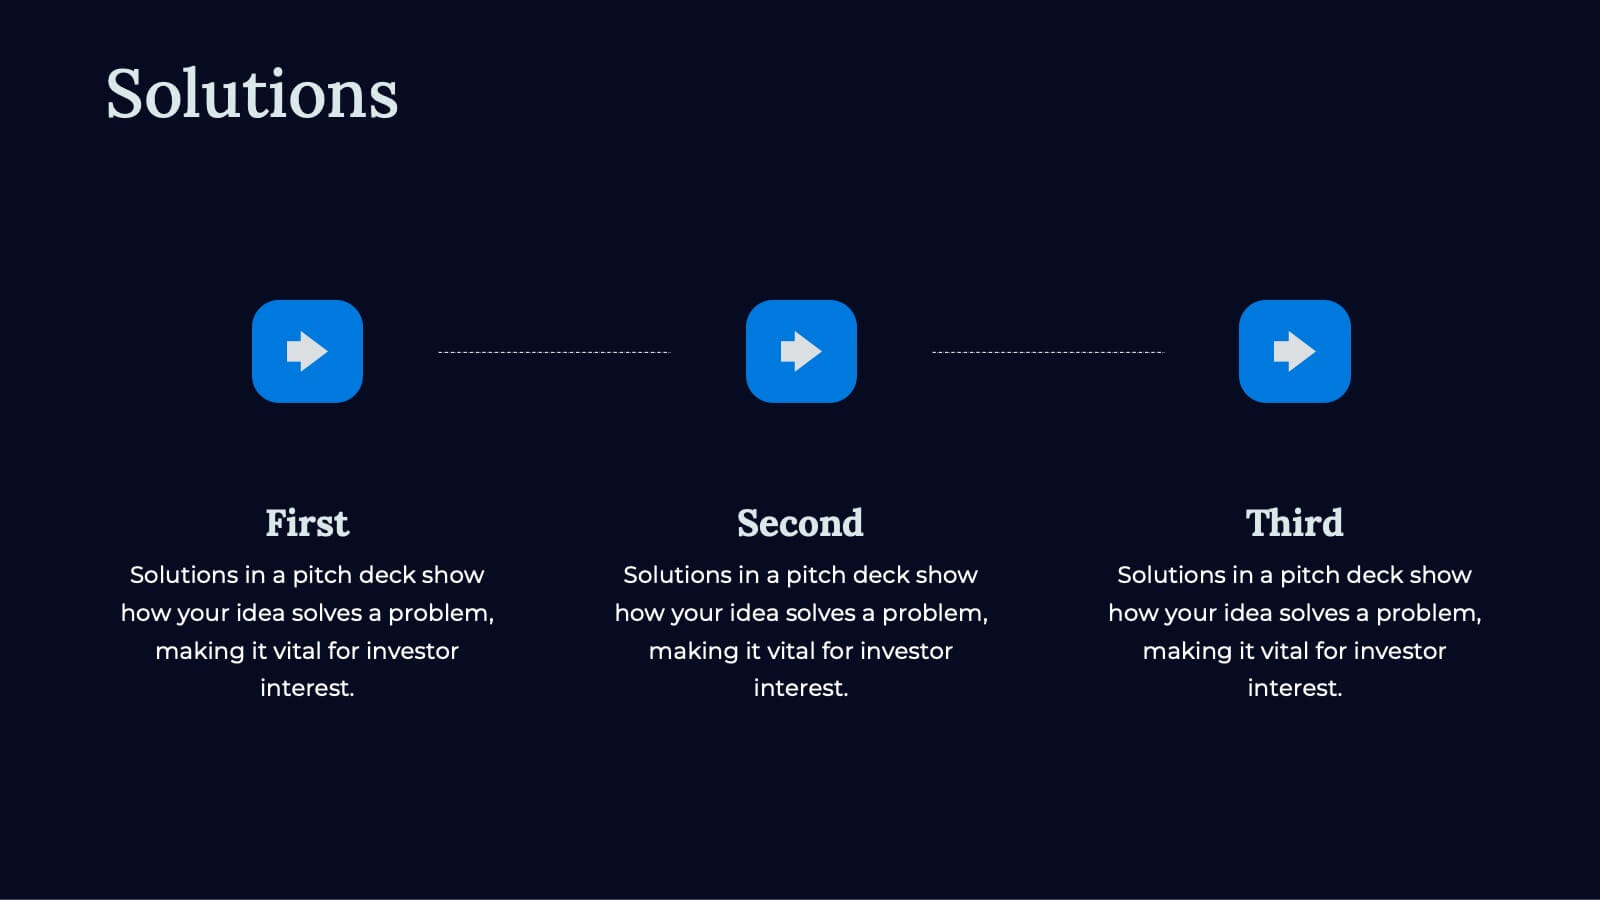
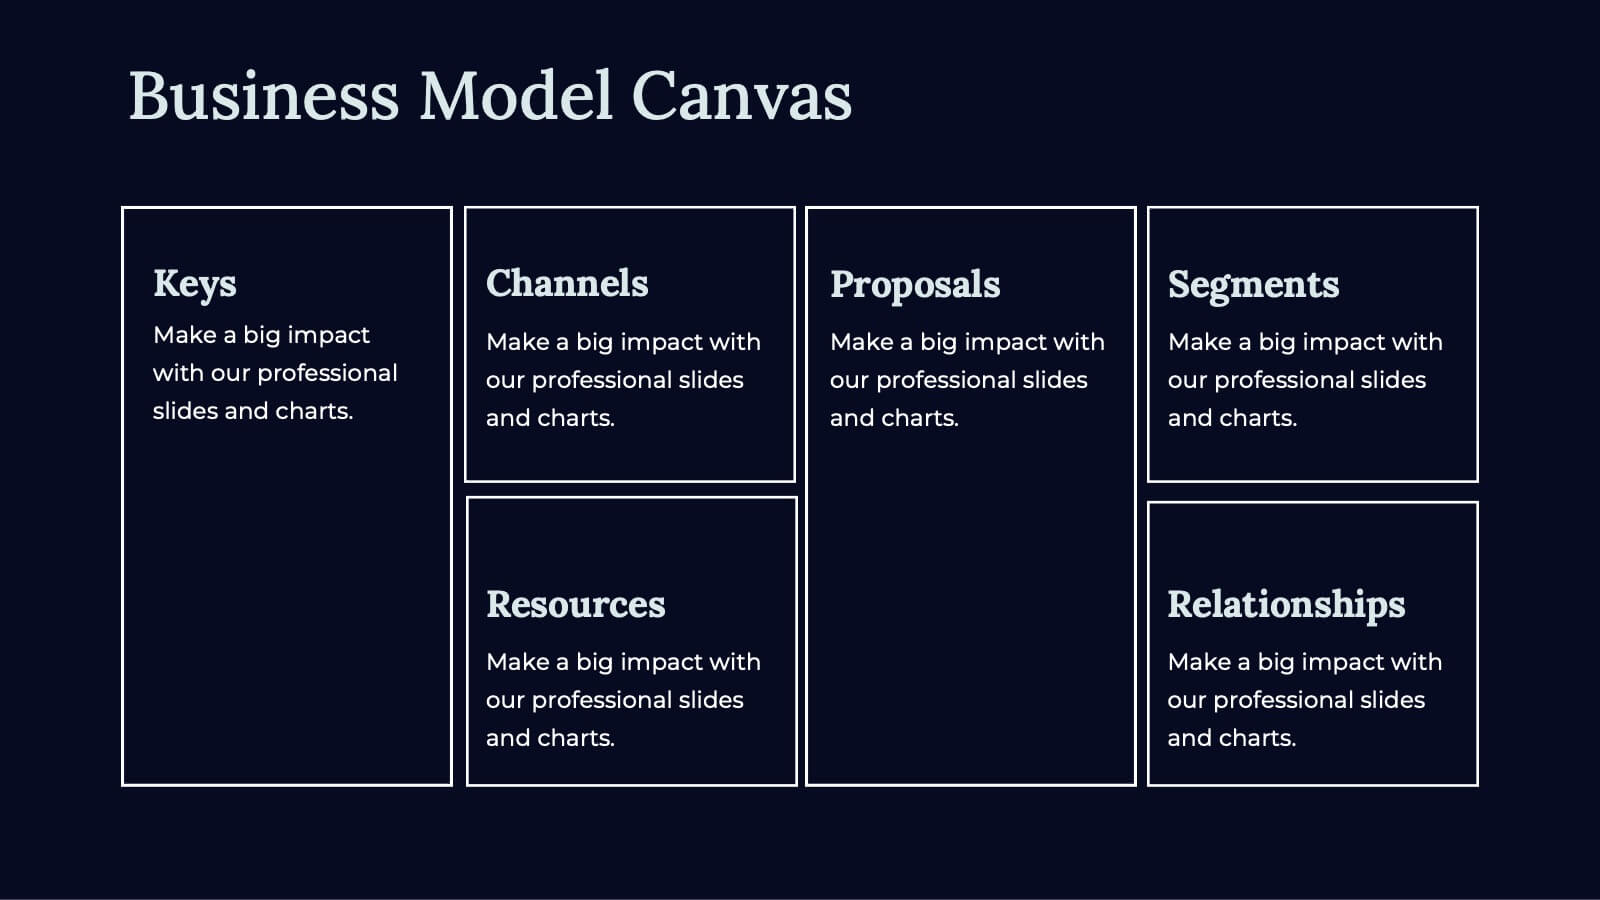
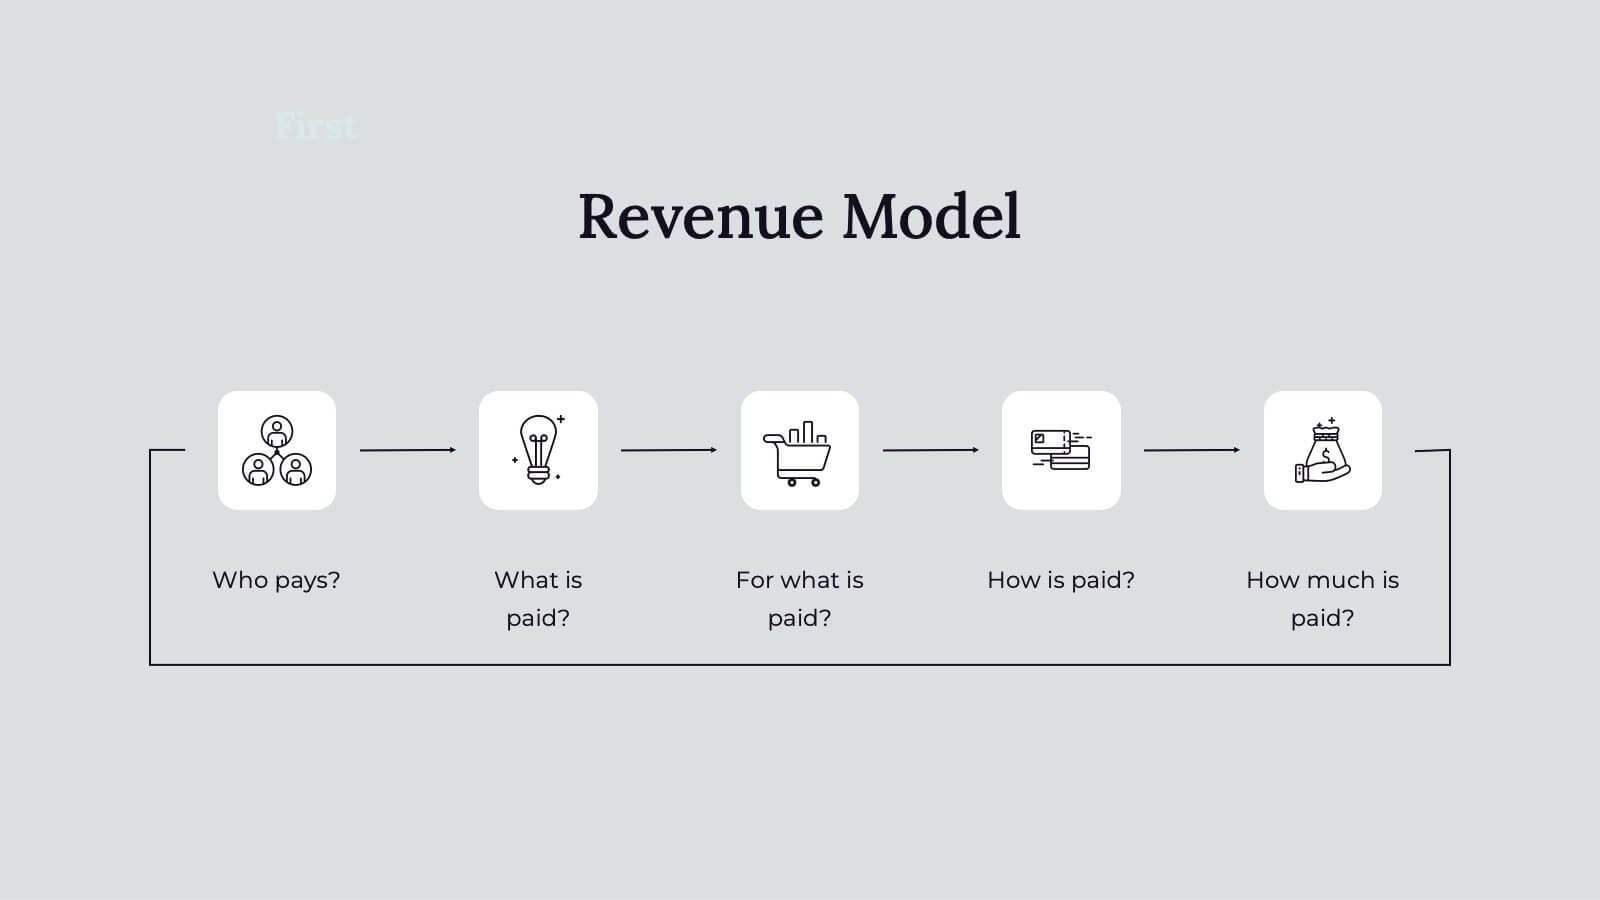
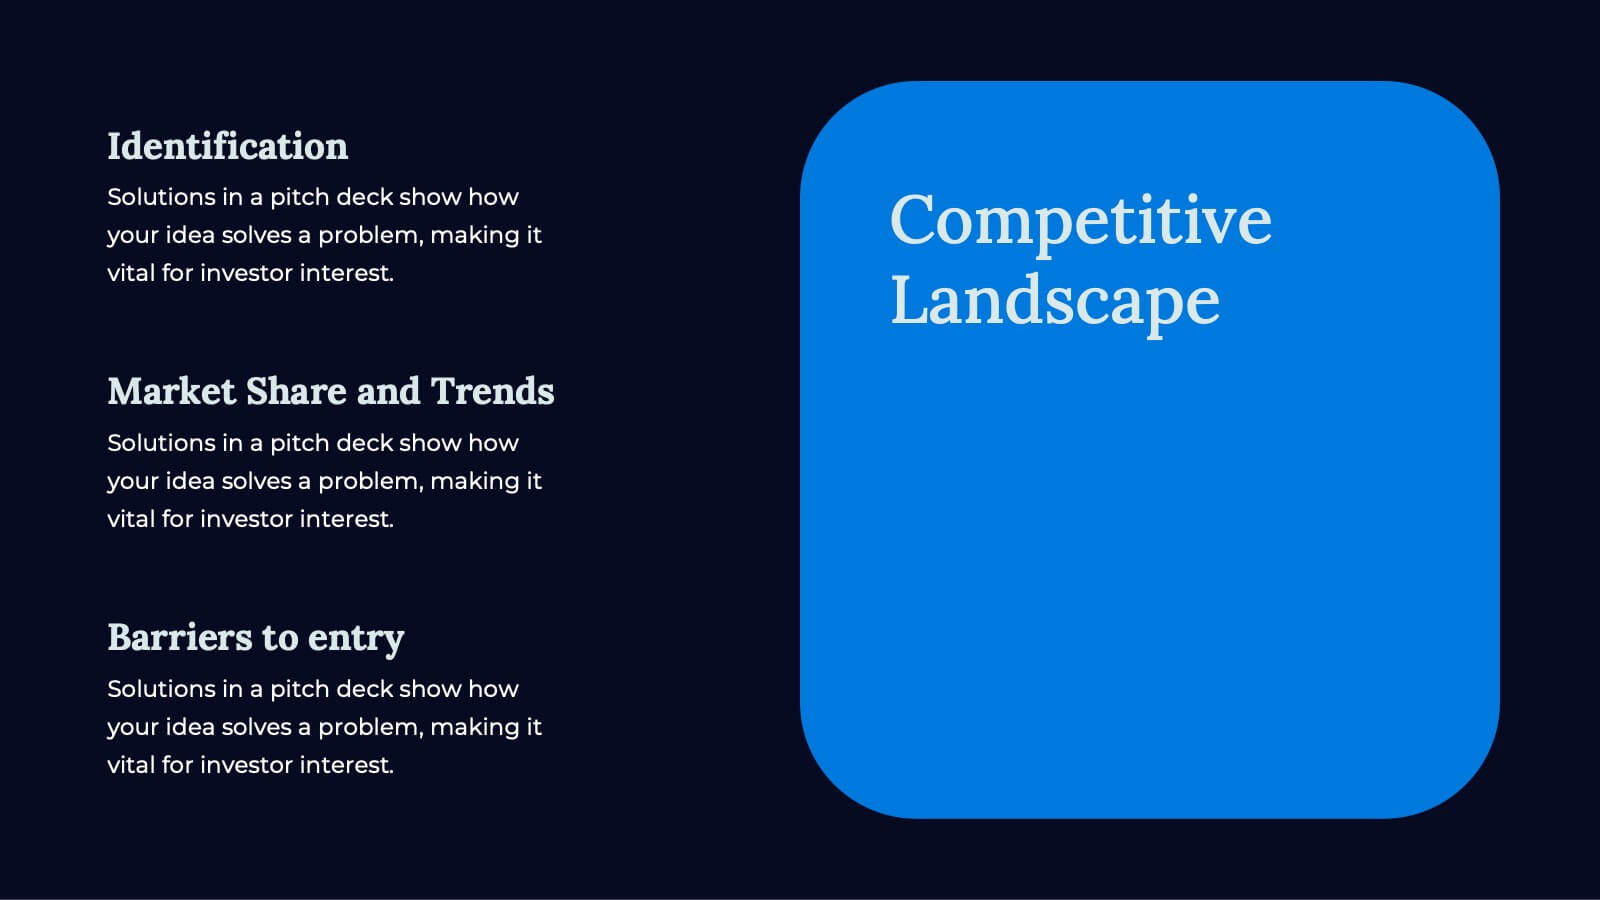
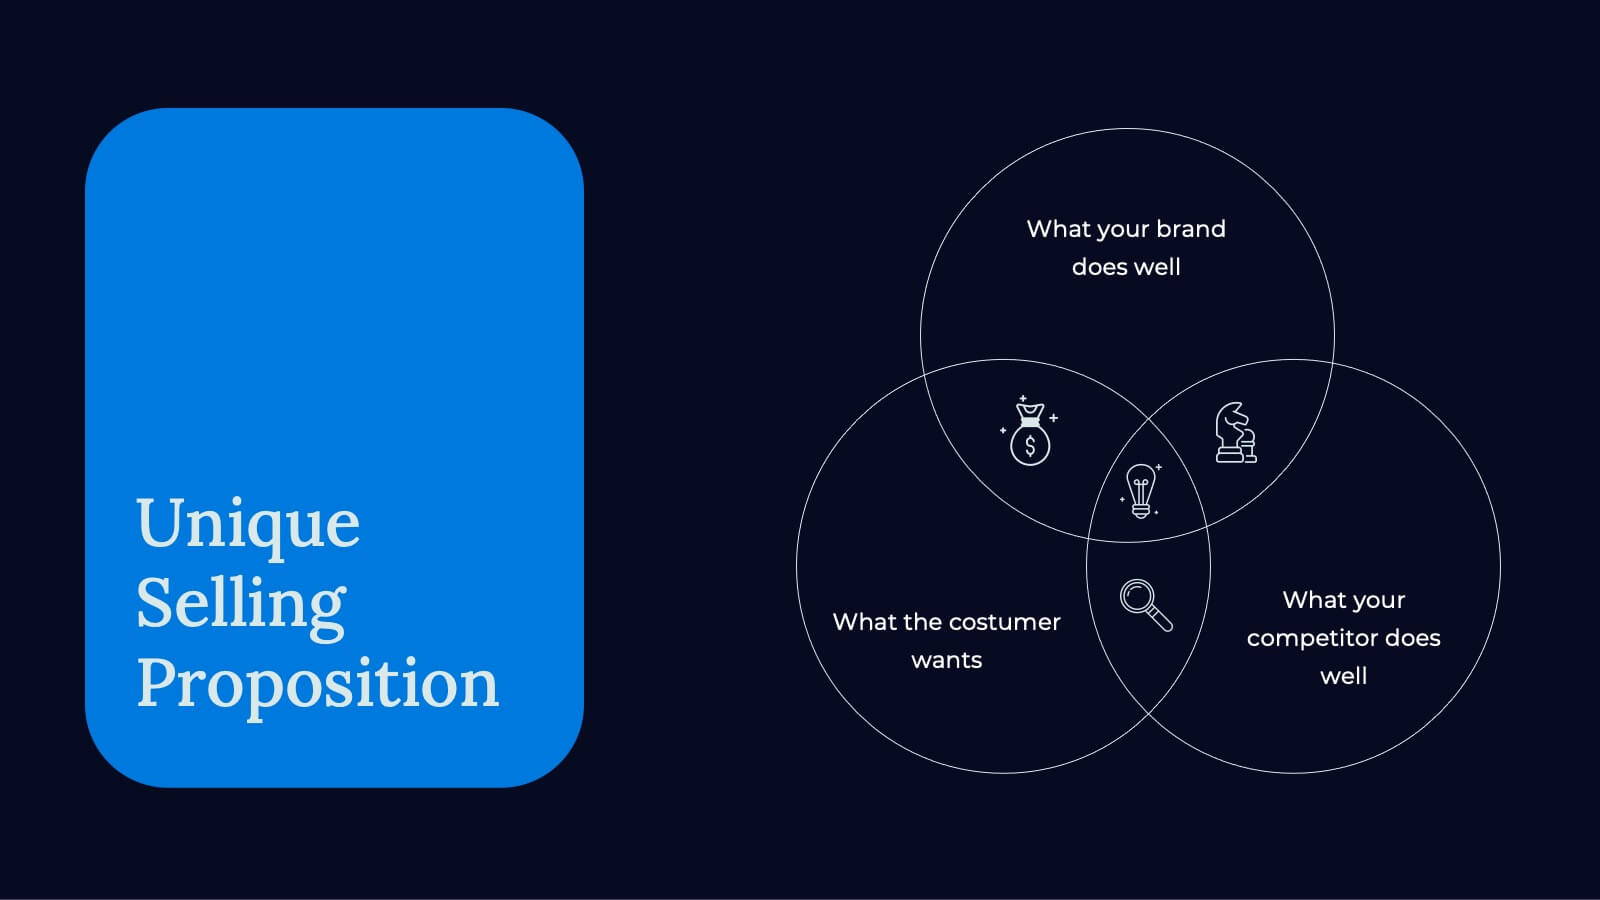
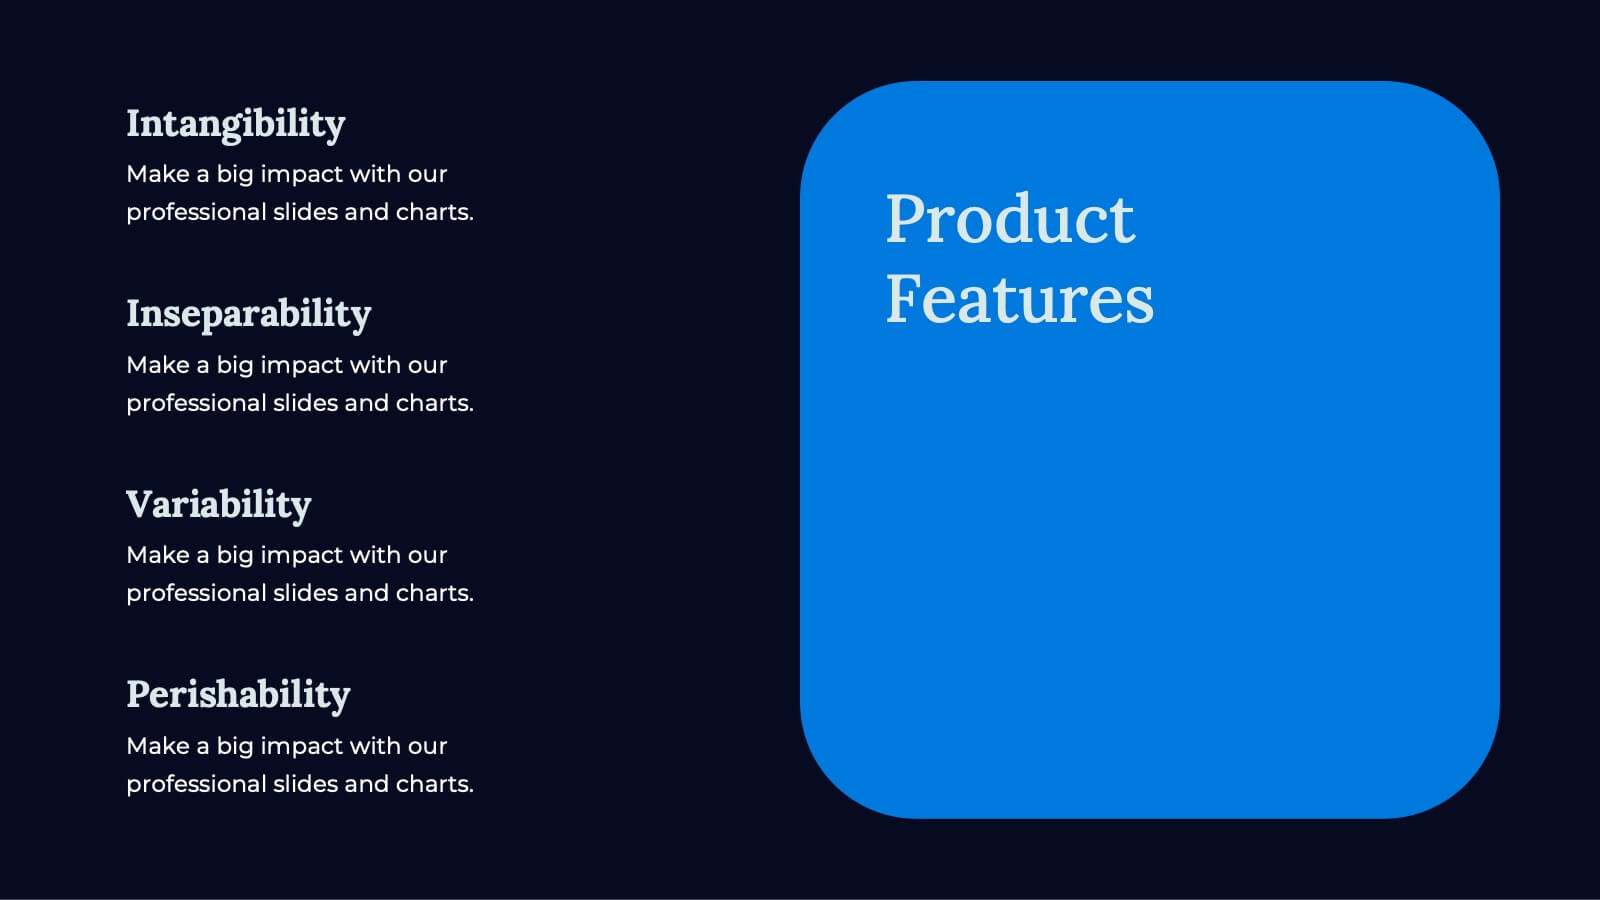
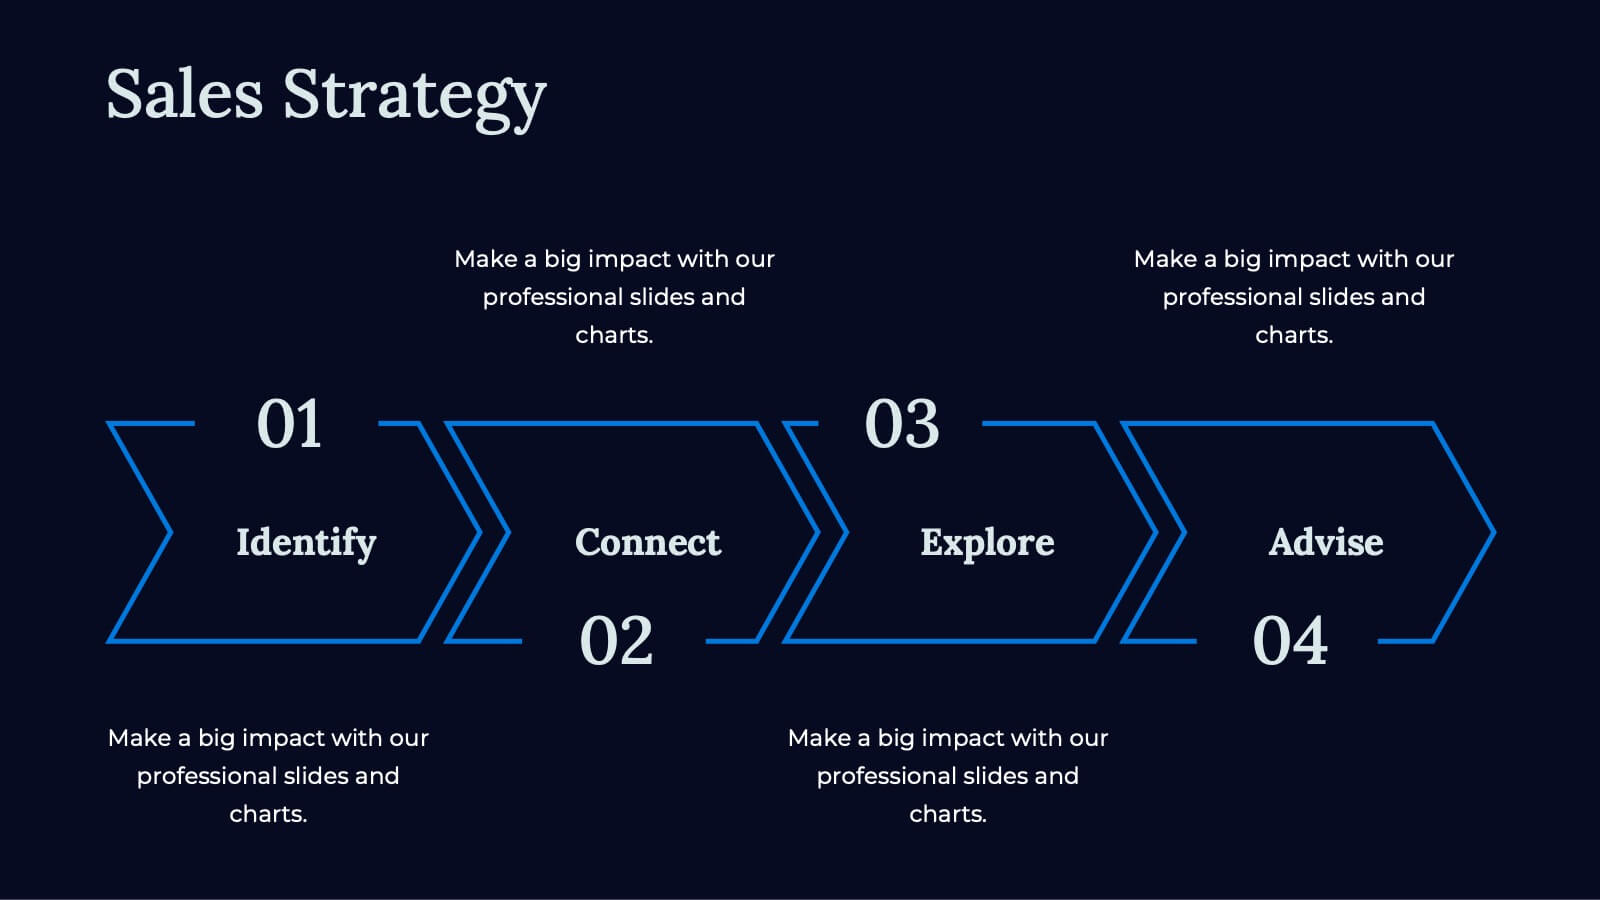
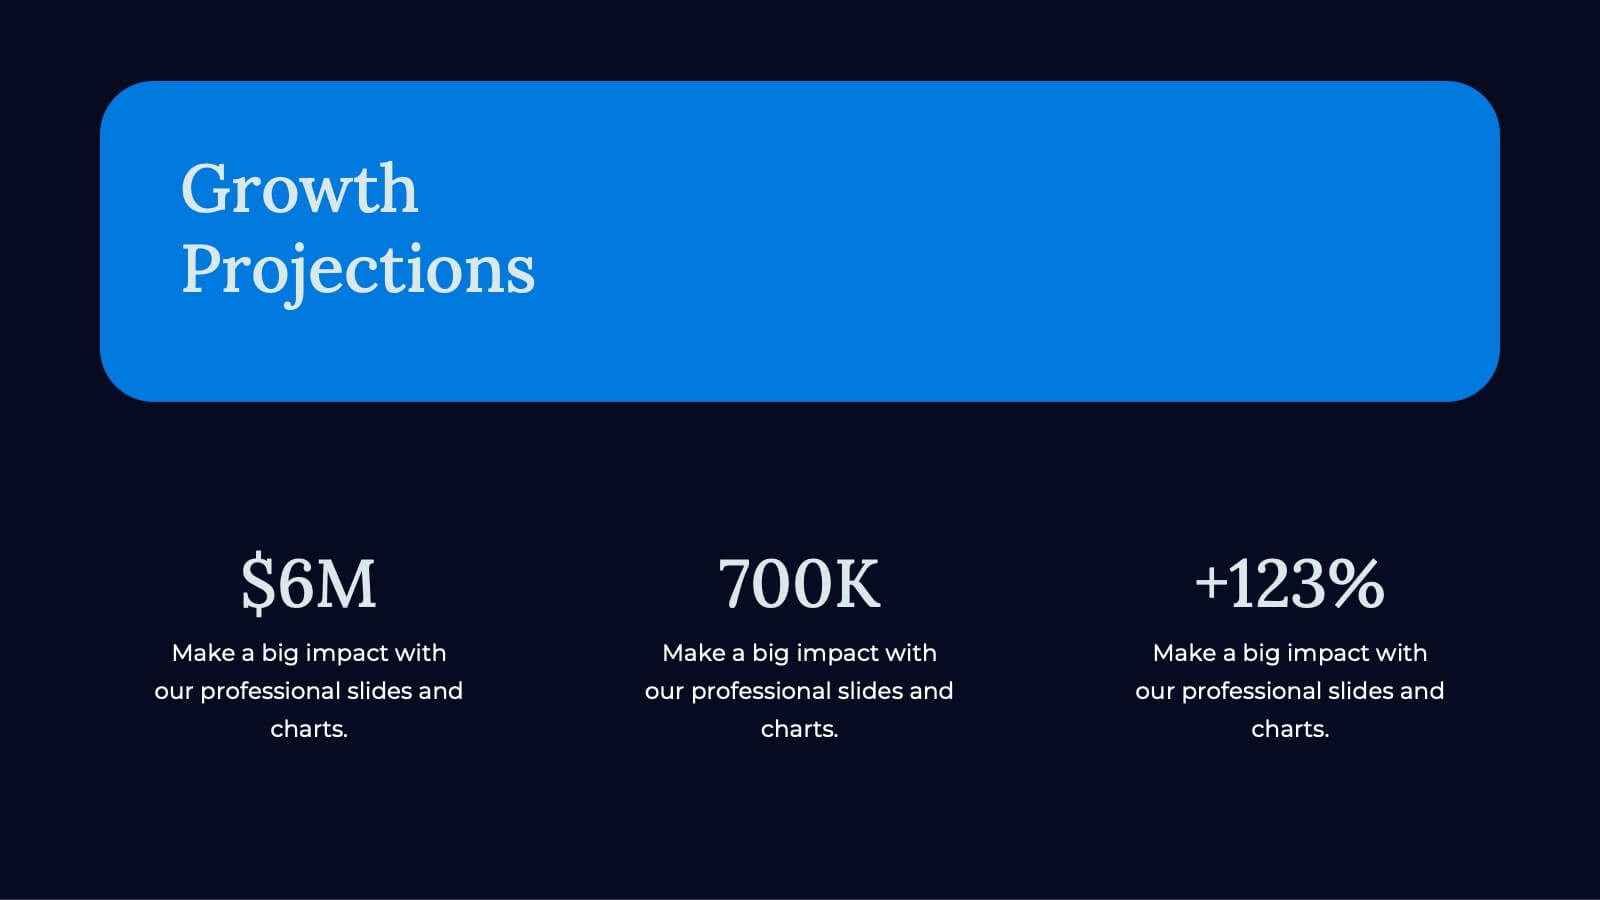
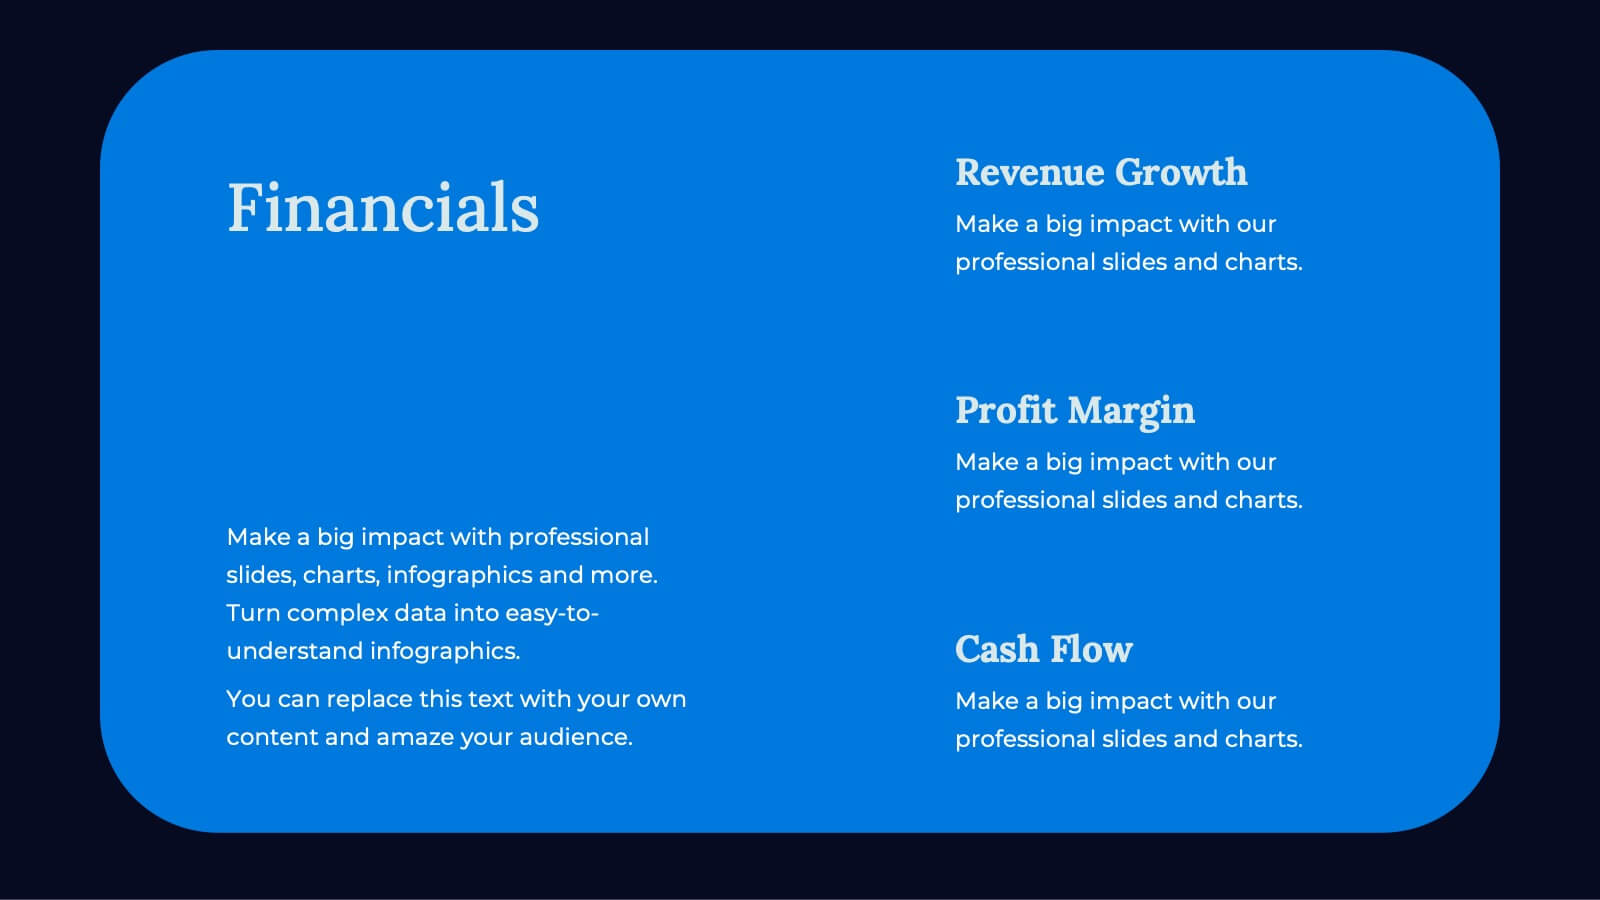
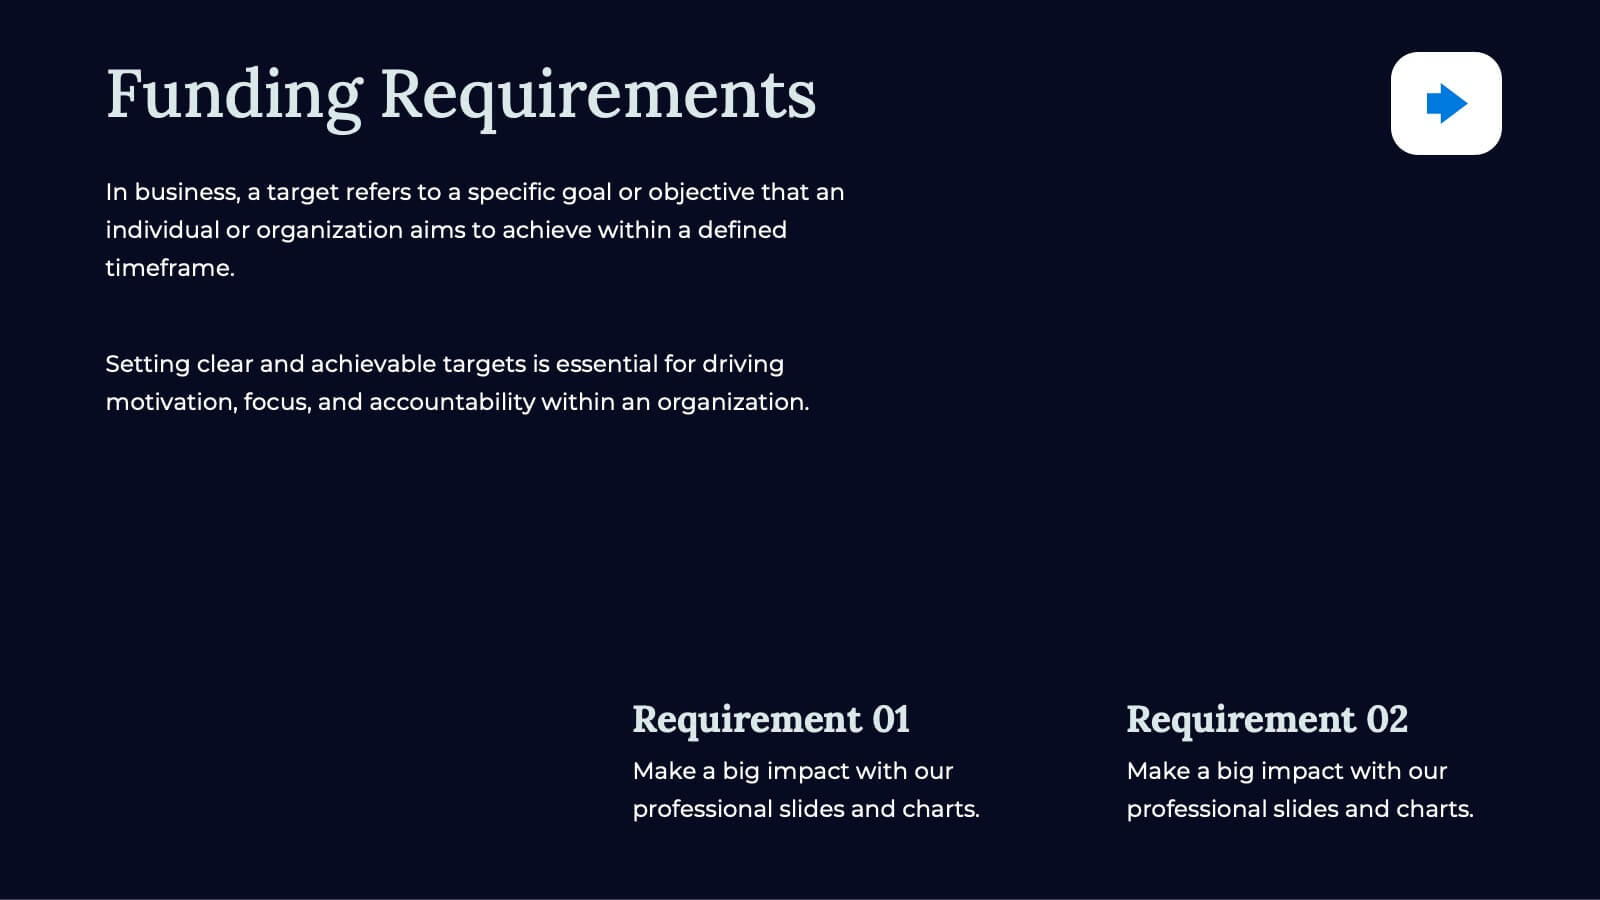
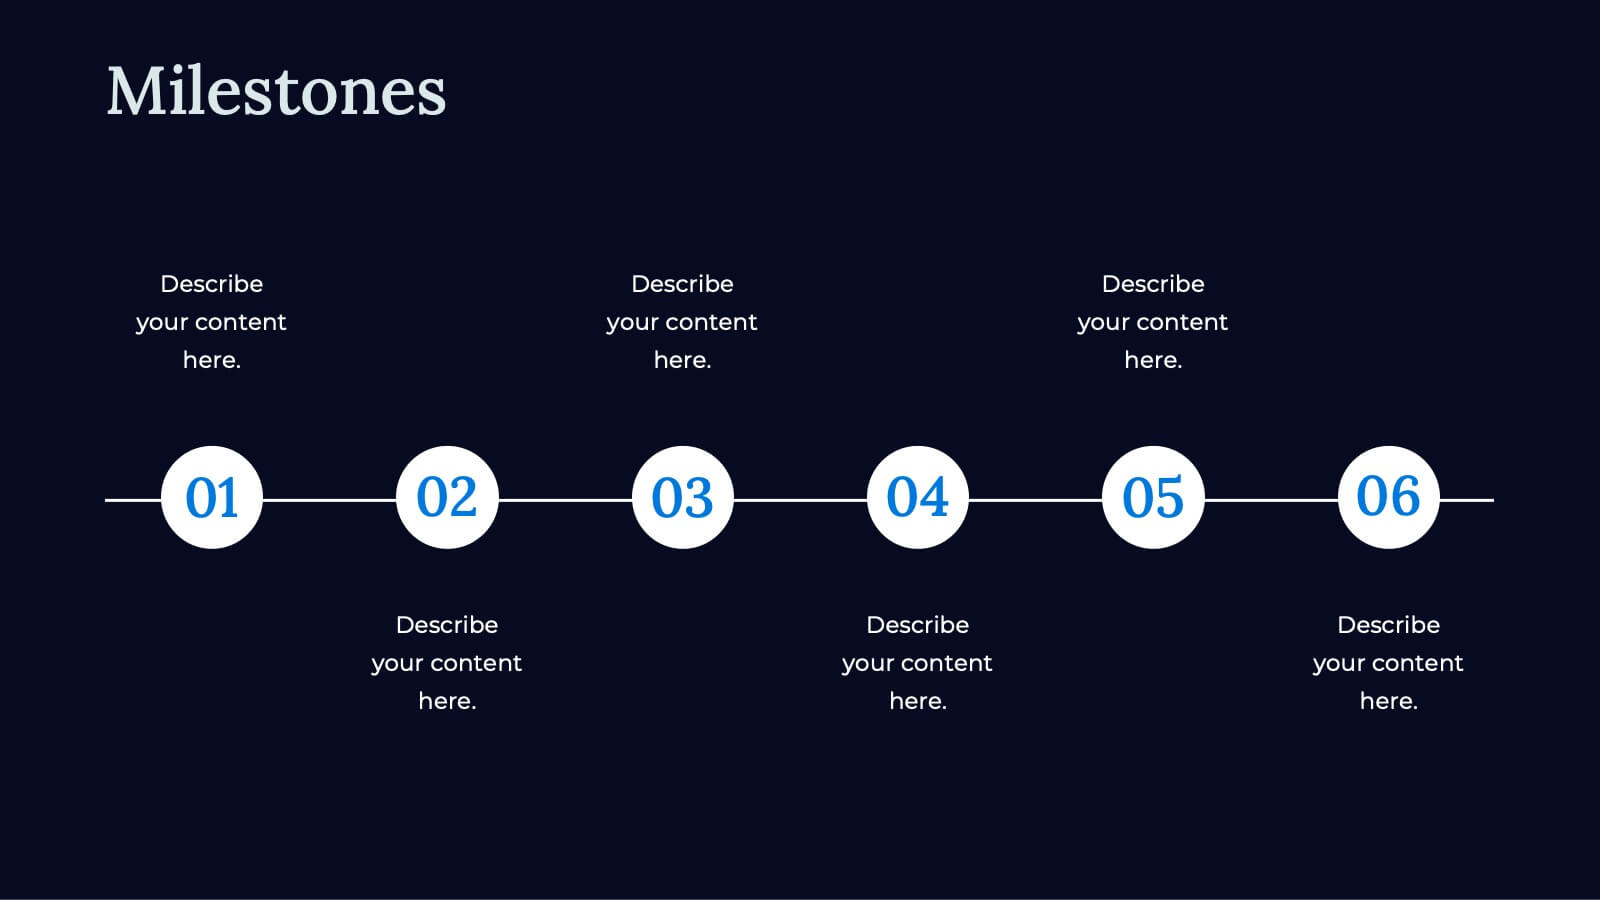
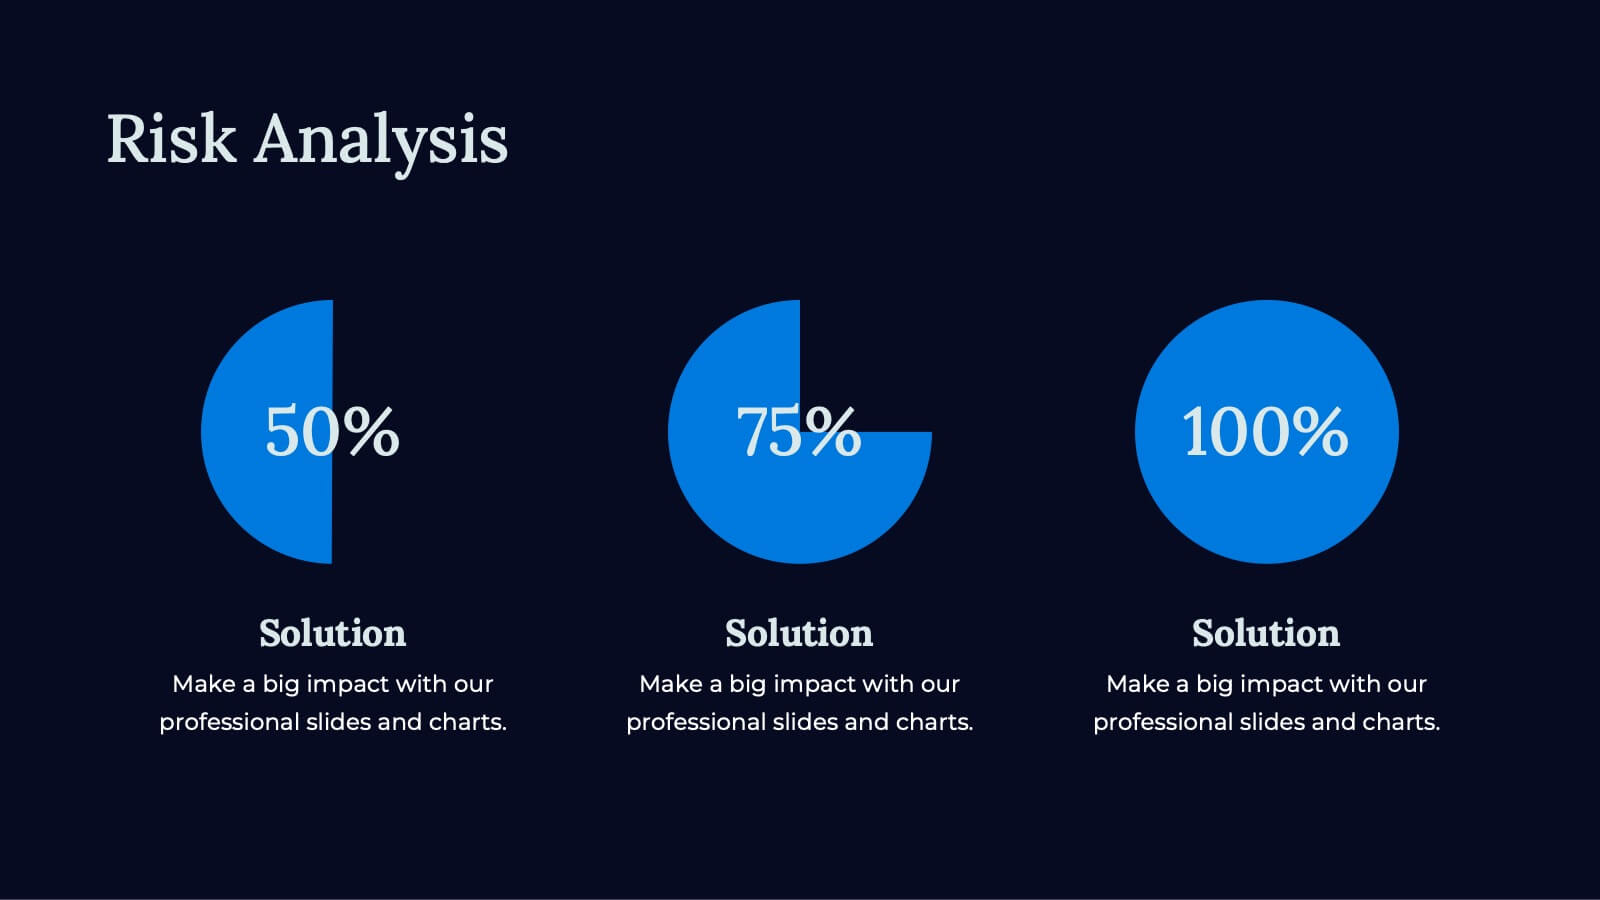
Apex Business Idea Pitch Deck Presentation
Craft powerful business pitch decks with this sleek template. Present your company overview, problem statement, solutions, and market opportunity. Showcase your business model, revenue model, competitive landscape, and unique selling proposition. Perfect for highlighting financials, growth projections, and funding requirements. Compatible with PowerPoint, Keynote, and Google Slides. Impress investors and stakeholders with clear, concise, and visually appealing presentations.


5 diapositivas
Organizational Tree Model
Present team structures or company hierarchies with ease using this Organizational Tree Model slide. With five clearly defined roles branching from a central trunk, it’s perfect for visualizing leadership flow, reporting lines, or role responsibilities. Fully editable in PowerPoint, Keynote, and Google Slides.


7 diapositivas
Geometric Series Infographic
Geometric series have various applications in mathematics, physics, engineering, economics, and other fields. Get ready for a joyful expedition into the world of numbers, shapes, and patterns with our geometric series infographic. This template is a celebration of mathematical elegance, presented with a burst of enthusiasm to make learning a delightful adventure. This is fully customizable and compatible with Powerpoint, Keynote, and Google Slides. This allows you to paint a vivid picture by relating geometric series to real-life scenarios. Showcase how these mathematical visuals resonates in unexpected places.


6 diapositivas
Corporate Profiles Layout Presentation
Bring your business story to life with a clean, modern layout that makes every detail feel polished and professional. This presentation is designed to showcase company highlights, key services, and essential profile information with clarity and impact. Fully editable and easy to customize in PowerPoint, Keynote, and Google Slides.


3 diapositivas
Project Status Report Overview Presentation
Bring clarity to your progress updates with this clean, easy-to-read template designed to track milestones, performance, and project goals at a glance. Ideal for team meetings and executive summaries, it turns data into visual insight. Fully compatible with PowerPoint, Keynote, and Google Slides for effortless customization and presentation.


4 diapositivas
Funding & Investor Startup Presentation
Present your investment strategy with clarity and impact using this triangle diagram slide. Ideal for showcasing the relationship between key funding stages, investor types, or business milestones, this layout offers a clean structure with labeled nodes (A, B, C) and supporting icons. Fully editable in PowerPoint, Keynote, and Google Slides for seamless customization.