


Características


¿Tienes alguna pregunta?
Recomendar


5 diapositivas
Dealing With Cyberbullying Infgraphics
Cyberbullying refers to the act of using digital communication platforms such as social media, instant messaging, online forums, or email to harass, intimidate, or harm others. This infographic template is designed to raise awareness about cyberbullying and provide guidance on how to effectively deal with it. This template aims to educate individuals, parents, educators, and organizations about the impact of cyberbullying and empower them to prevent and address this issue. This template can be used by schools, community organizations, or online safety advocates to raise awareness about cyberbullying, and foster a safer online environment.


4 diapositivas
Problem-Solving Puzzle Diagram Presentation
The "Problem-Solving Puzzle Diagram Presentation" template effectively showcases a creative approach to illustrating complex problem-solving strategies. Each piece of the puzzle represents a unique aspect of the solution process, encouraging viewers to consider how different components fit together to achieve a successful outcome. The diagram uses contrasting colors to differentiate between the sections clearly, making it easy for the audience to follow along and understand the interconnections. This template is perfect for business analysts, project managers, or any professional involved in strategic planning and problem-solving. It's designed to facilitate discussions in workshops, meetings, or team collaborations where visual aids can enhance comprehension and engagement in developing solutions.


4 diapositivas
Country-Specific Data World Map Presentation
Visually highlight regional data insights with this sleek Country-Specific Data World Map slide. Designed for clarity and impact, this layout lets you present four key statistics or findings alongside a pinpointed global map. Each percentage and title is customizable—ideal for business growth, research, or market penetration analysis. Clean design ensures your message stands out. Fully editable and compatible with PowerPoint, Keynote, and Google Slides.


4 diapositivas
Soft Watercolor Background Slides Presentation
Add a soft, elegant touch to your presentation with this Soft Watercolor Background Slides Presentation. Designed with gentle gray brushstroke textures and clean, modern layout, it's perfect for conveying ideas clearly while maintaining visual appeal. Ideal for creative, wellness, or professional topics. Fully editable in PowerPoint, Google Slides, and Canva.


8 diapositivas
Business Framework Strategy
Simplify your strategy breakdown with this layered, step-by-step infographic. Ideal for presenting three core pillars or stages of a business model, this layout highlights each section with a bold letter identifier (A, B, C), vivid icons, and space for supporting content. Fully editable in PowerPoint, Keynote, and Google Slides.


7 diapositivas
Balance Sheet and Profit Overview Presentation
Give your financial summary a clean, modern look with the Balance Sheet and Profit Overview Presentation. This slide offers a dual-column layout with icons and space for six key financial metrics or business insights—ideal for summarizing assets, liabilities, profits, and more. Easily editable in Canva, PowerPoint, and Google Slides.


6 diapositivas
Milestones Technologies Infographics
Highlight significant milestones in technology with our Milestones Technologies infographic template. This template is fully compatible with popular presentation software like PowerPoint, Keynote, and Google Slides, allowing you to easily customize it to showcase pivotal moments and achievements in the world of technology. The Milestones Technologies infographic template offers a visually engaging platform to chronicle and celebrate key technological advancements, innovations, and breakthroughs throughout history. Whether you're a tech enthusiast, educator, or simply interested in technological progress, this template provides a user-friendly canvas to create informative presentations and educational materials. Deepen your appreciation for the impact of technology with this SEO-optimized Milestones Technologies infographic template, thoughtfully designed for clarity and ease of use. Customize it to highlight milestones across various fields, from computing and telecommunications to space exploration and biotechnology, making it a valuable resource for sharing the history of technology with your audience. Start crafting your personalized infographic today to explore the remarkable journey of technological progress.


6 diapositivas
Hierarchy Level Infographic
Hierarchy level, also known as organizational hierarchy or hierarchical structure, refers to the arrangement of individuals and positions within an organization based on authority, responsibility, and reporting relationships. This infographic template helps to explain the different levels of hierarchy within an organization or a particular system. It is designed to provide a clear and concise overview of the hierarchical structure, allowing viewers to understand the relationships and roles of individuals at each level. This template is compatible with Powerpoint, Keynote, and Google Slides.


6 diapositivas
Business Task Checklist Presentation
Bring order and focus to your workflow with a clean, structured layout that tracks progress and priorities at a glance. Ideal for project updates, task planning, or performance reviews, this presentation makes organization effortless. Fully compatible with PowerPoint, Keynote, and Google Slides for easy customization and professional use.


12 diapositivas
Investment Strategy Presentation
The "Investment Strategy Presentation" template is designed for effectively mapping out and displaying various investment strategies. It uses a multi-colored light bulb graphic, which symbolizes ideas and innovation in investment planning, making it visually appealing and easy to understand. Each segment of the light bulb is labeled with letters A through F, representing different aspects or phases of an investment strategy that can be tailored to specific objectives or points of discussion. This format helps in presenting complex financial data or strategies in a straightforward manner that can be easily grasped by audiences, making it an ideal choice for financial analysts, investors, or corporate strategy meetings.


23 diapositivas
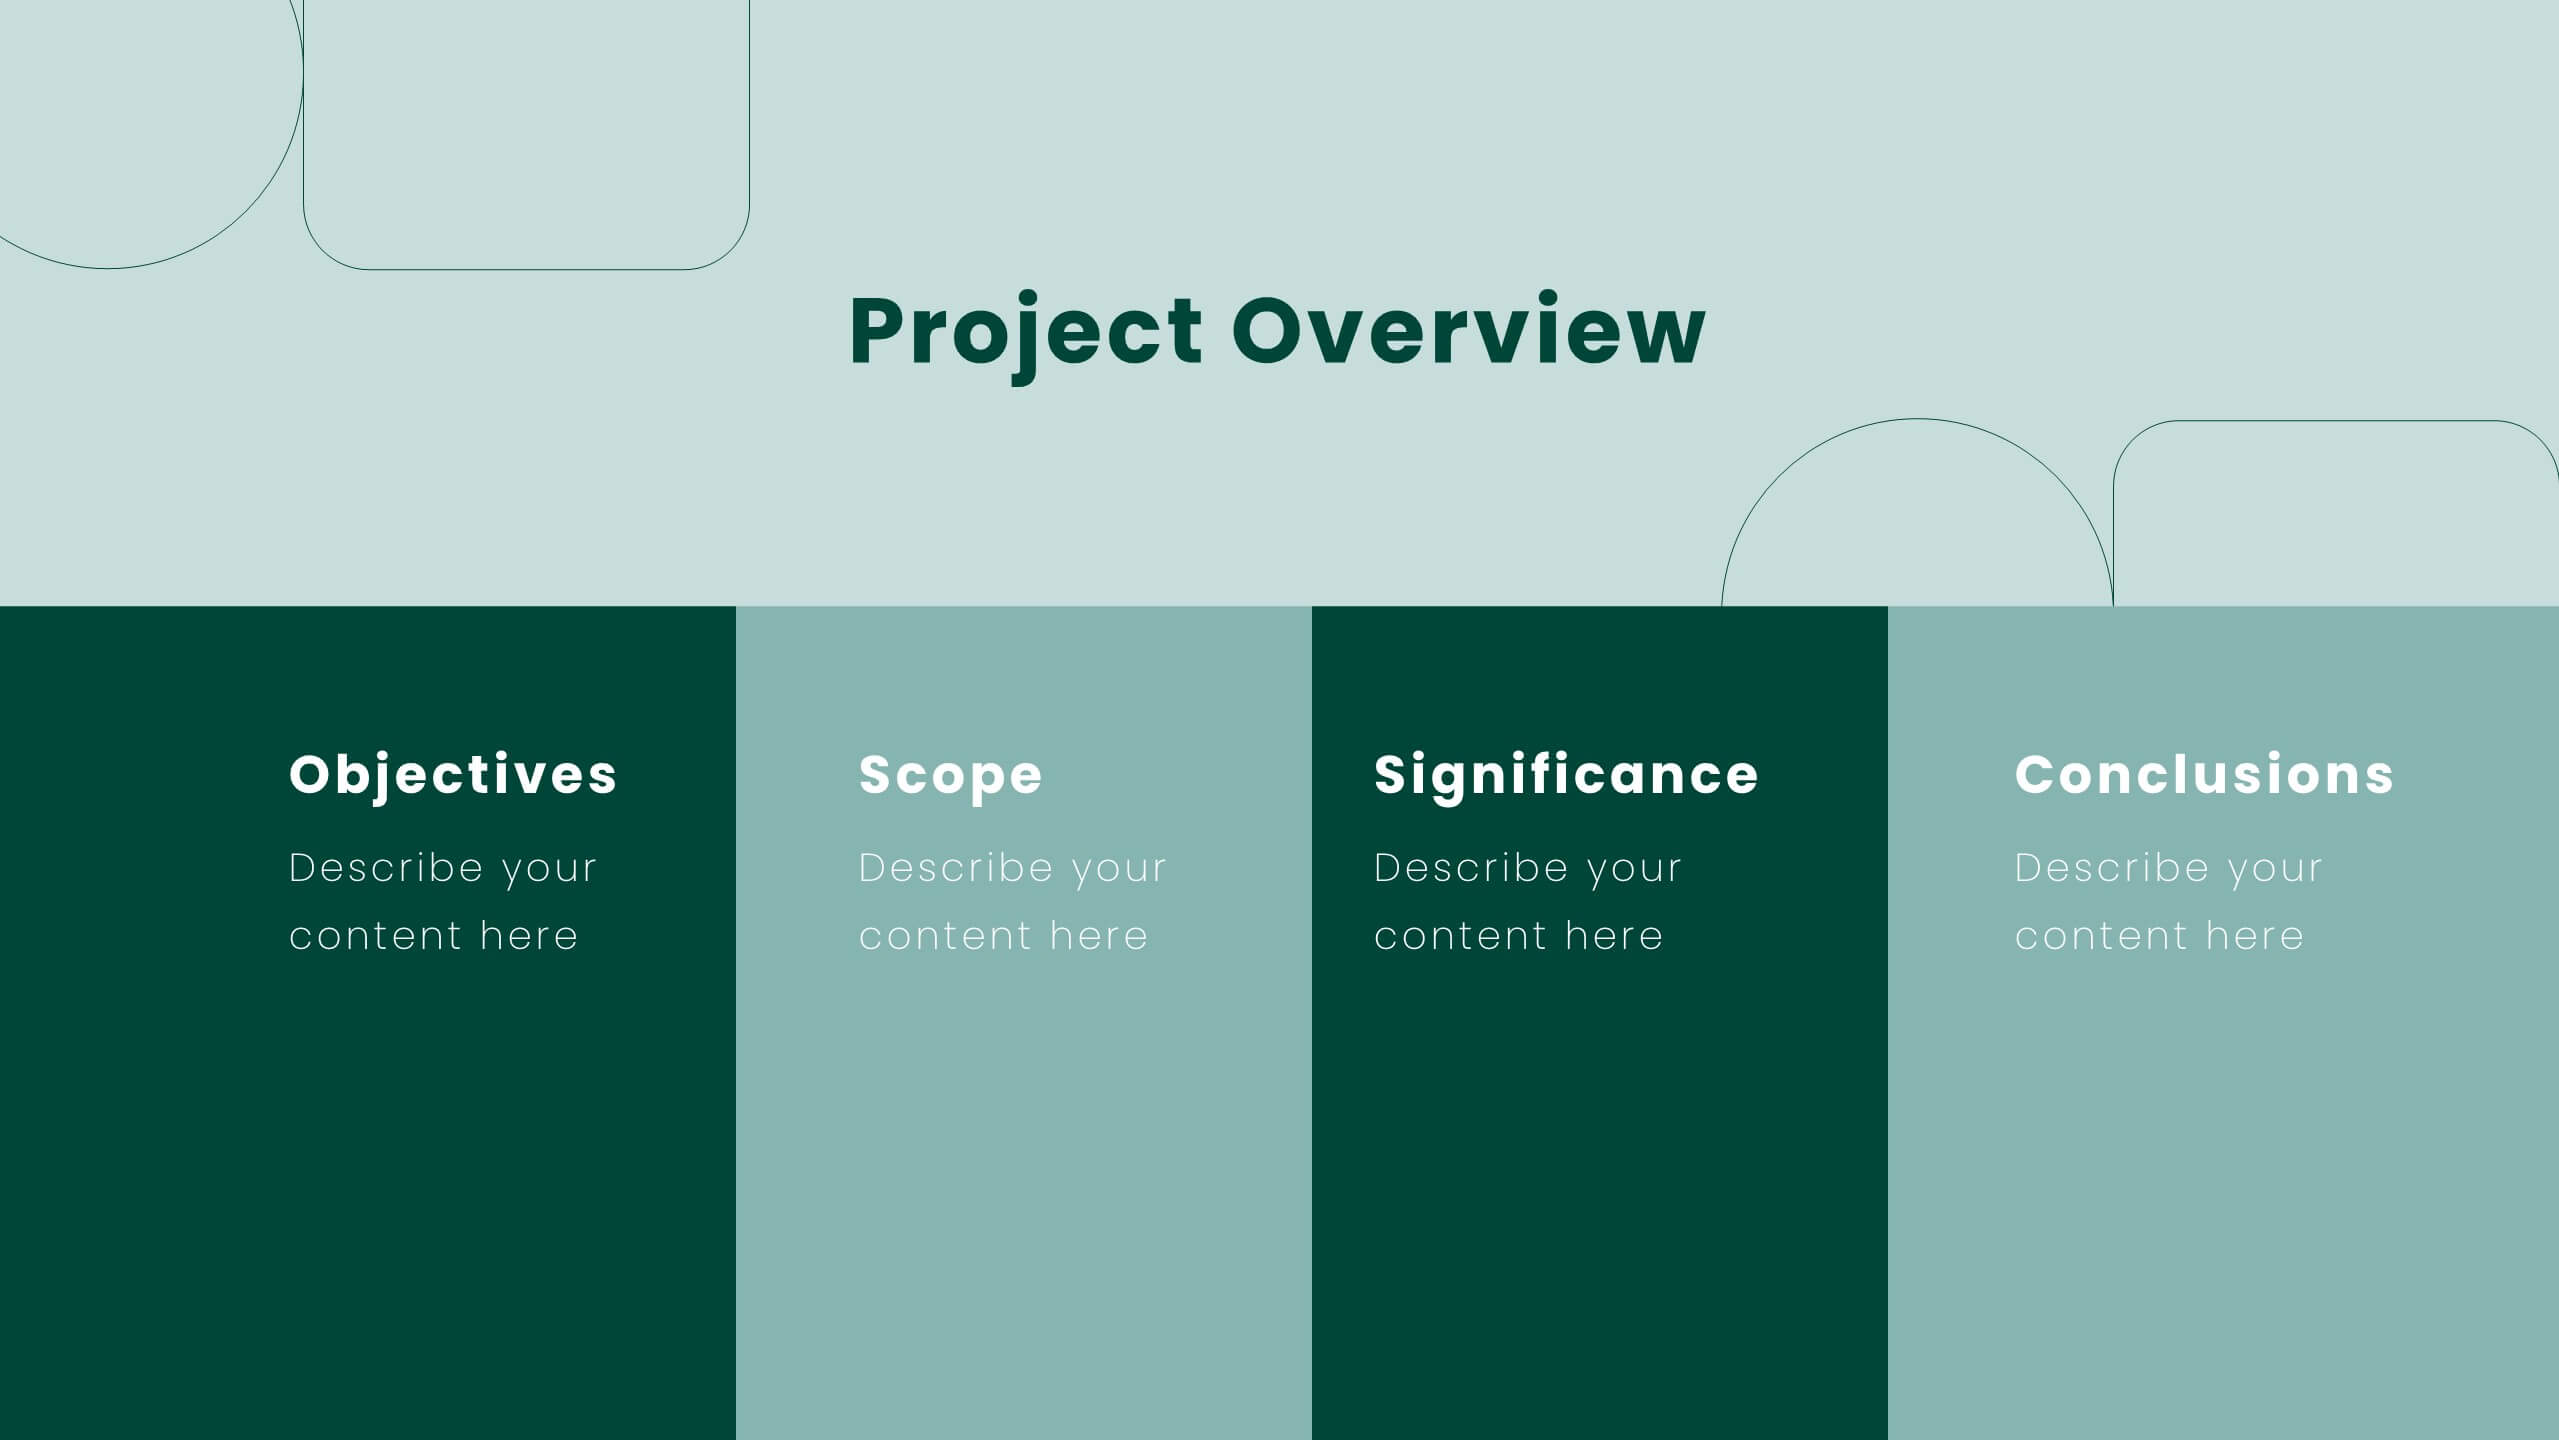
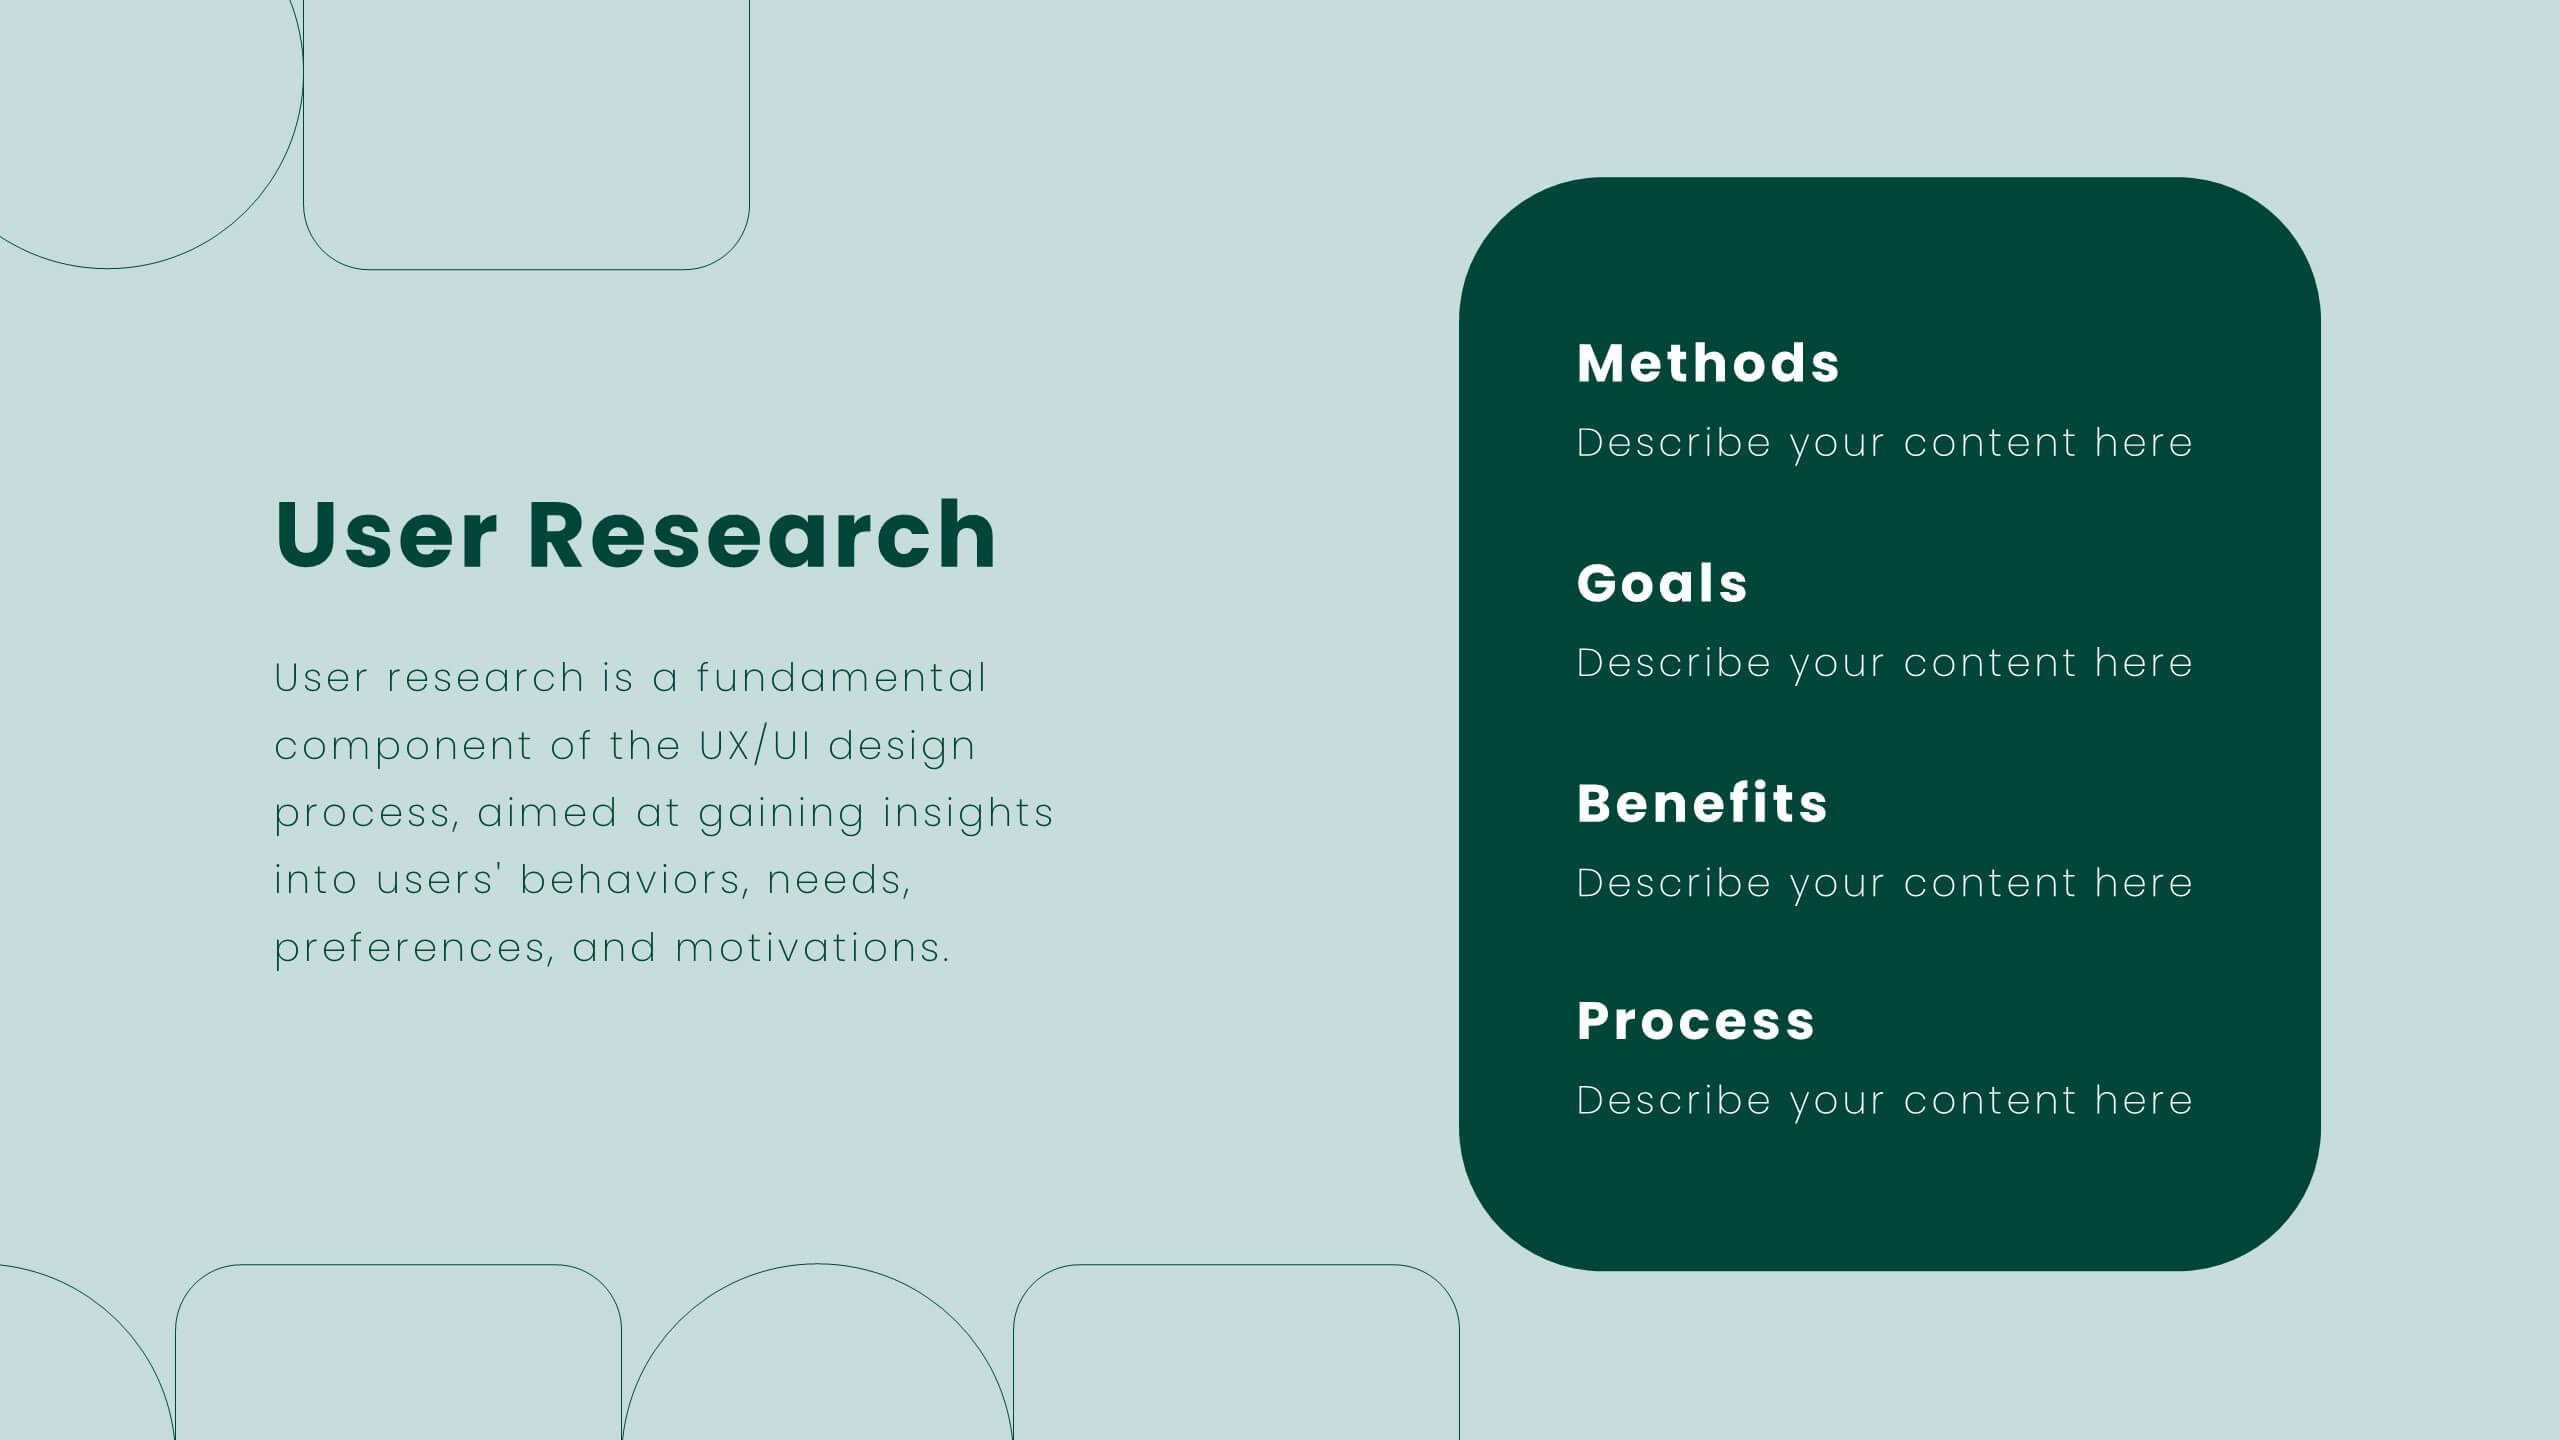
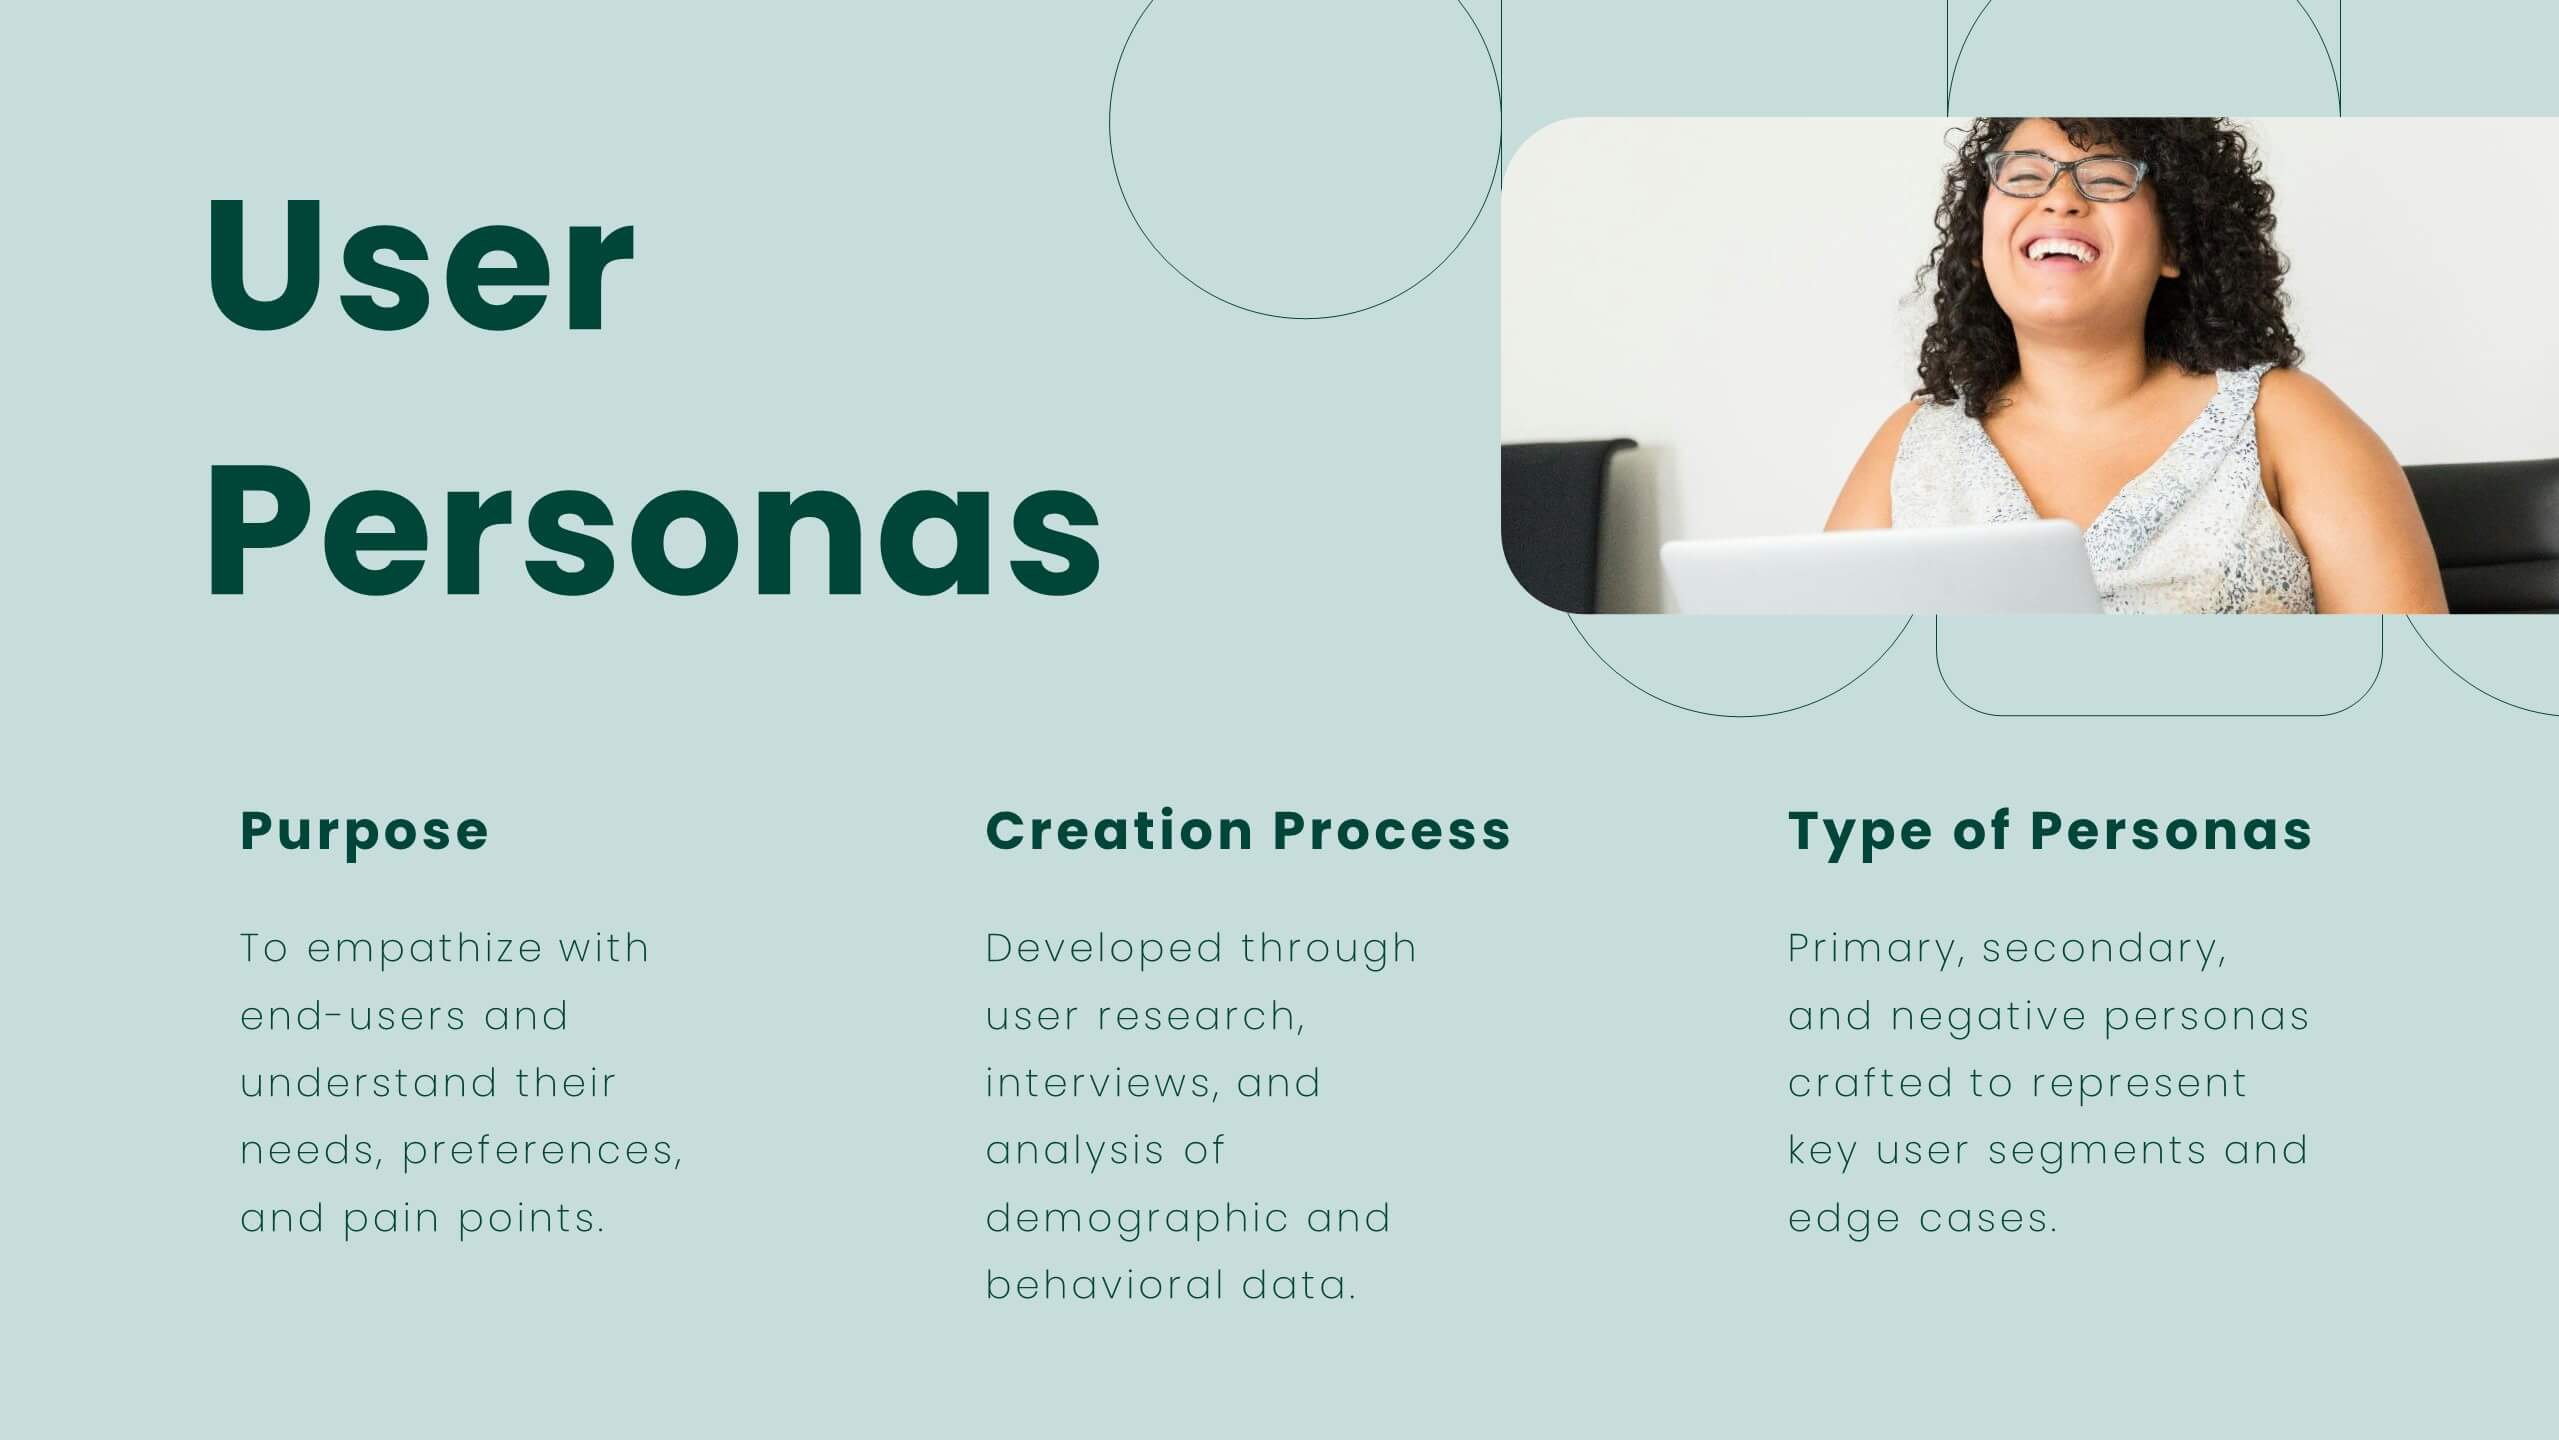
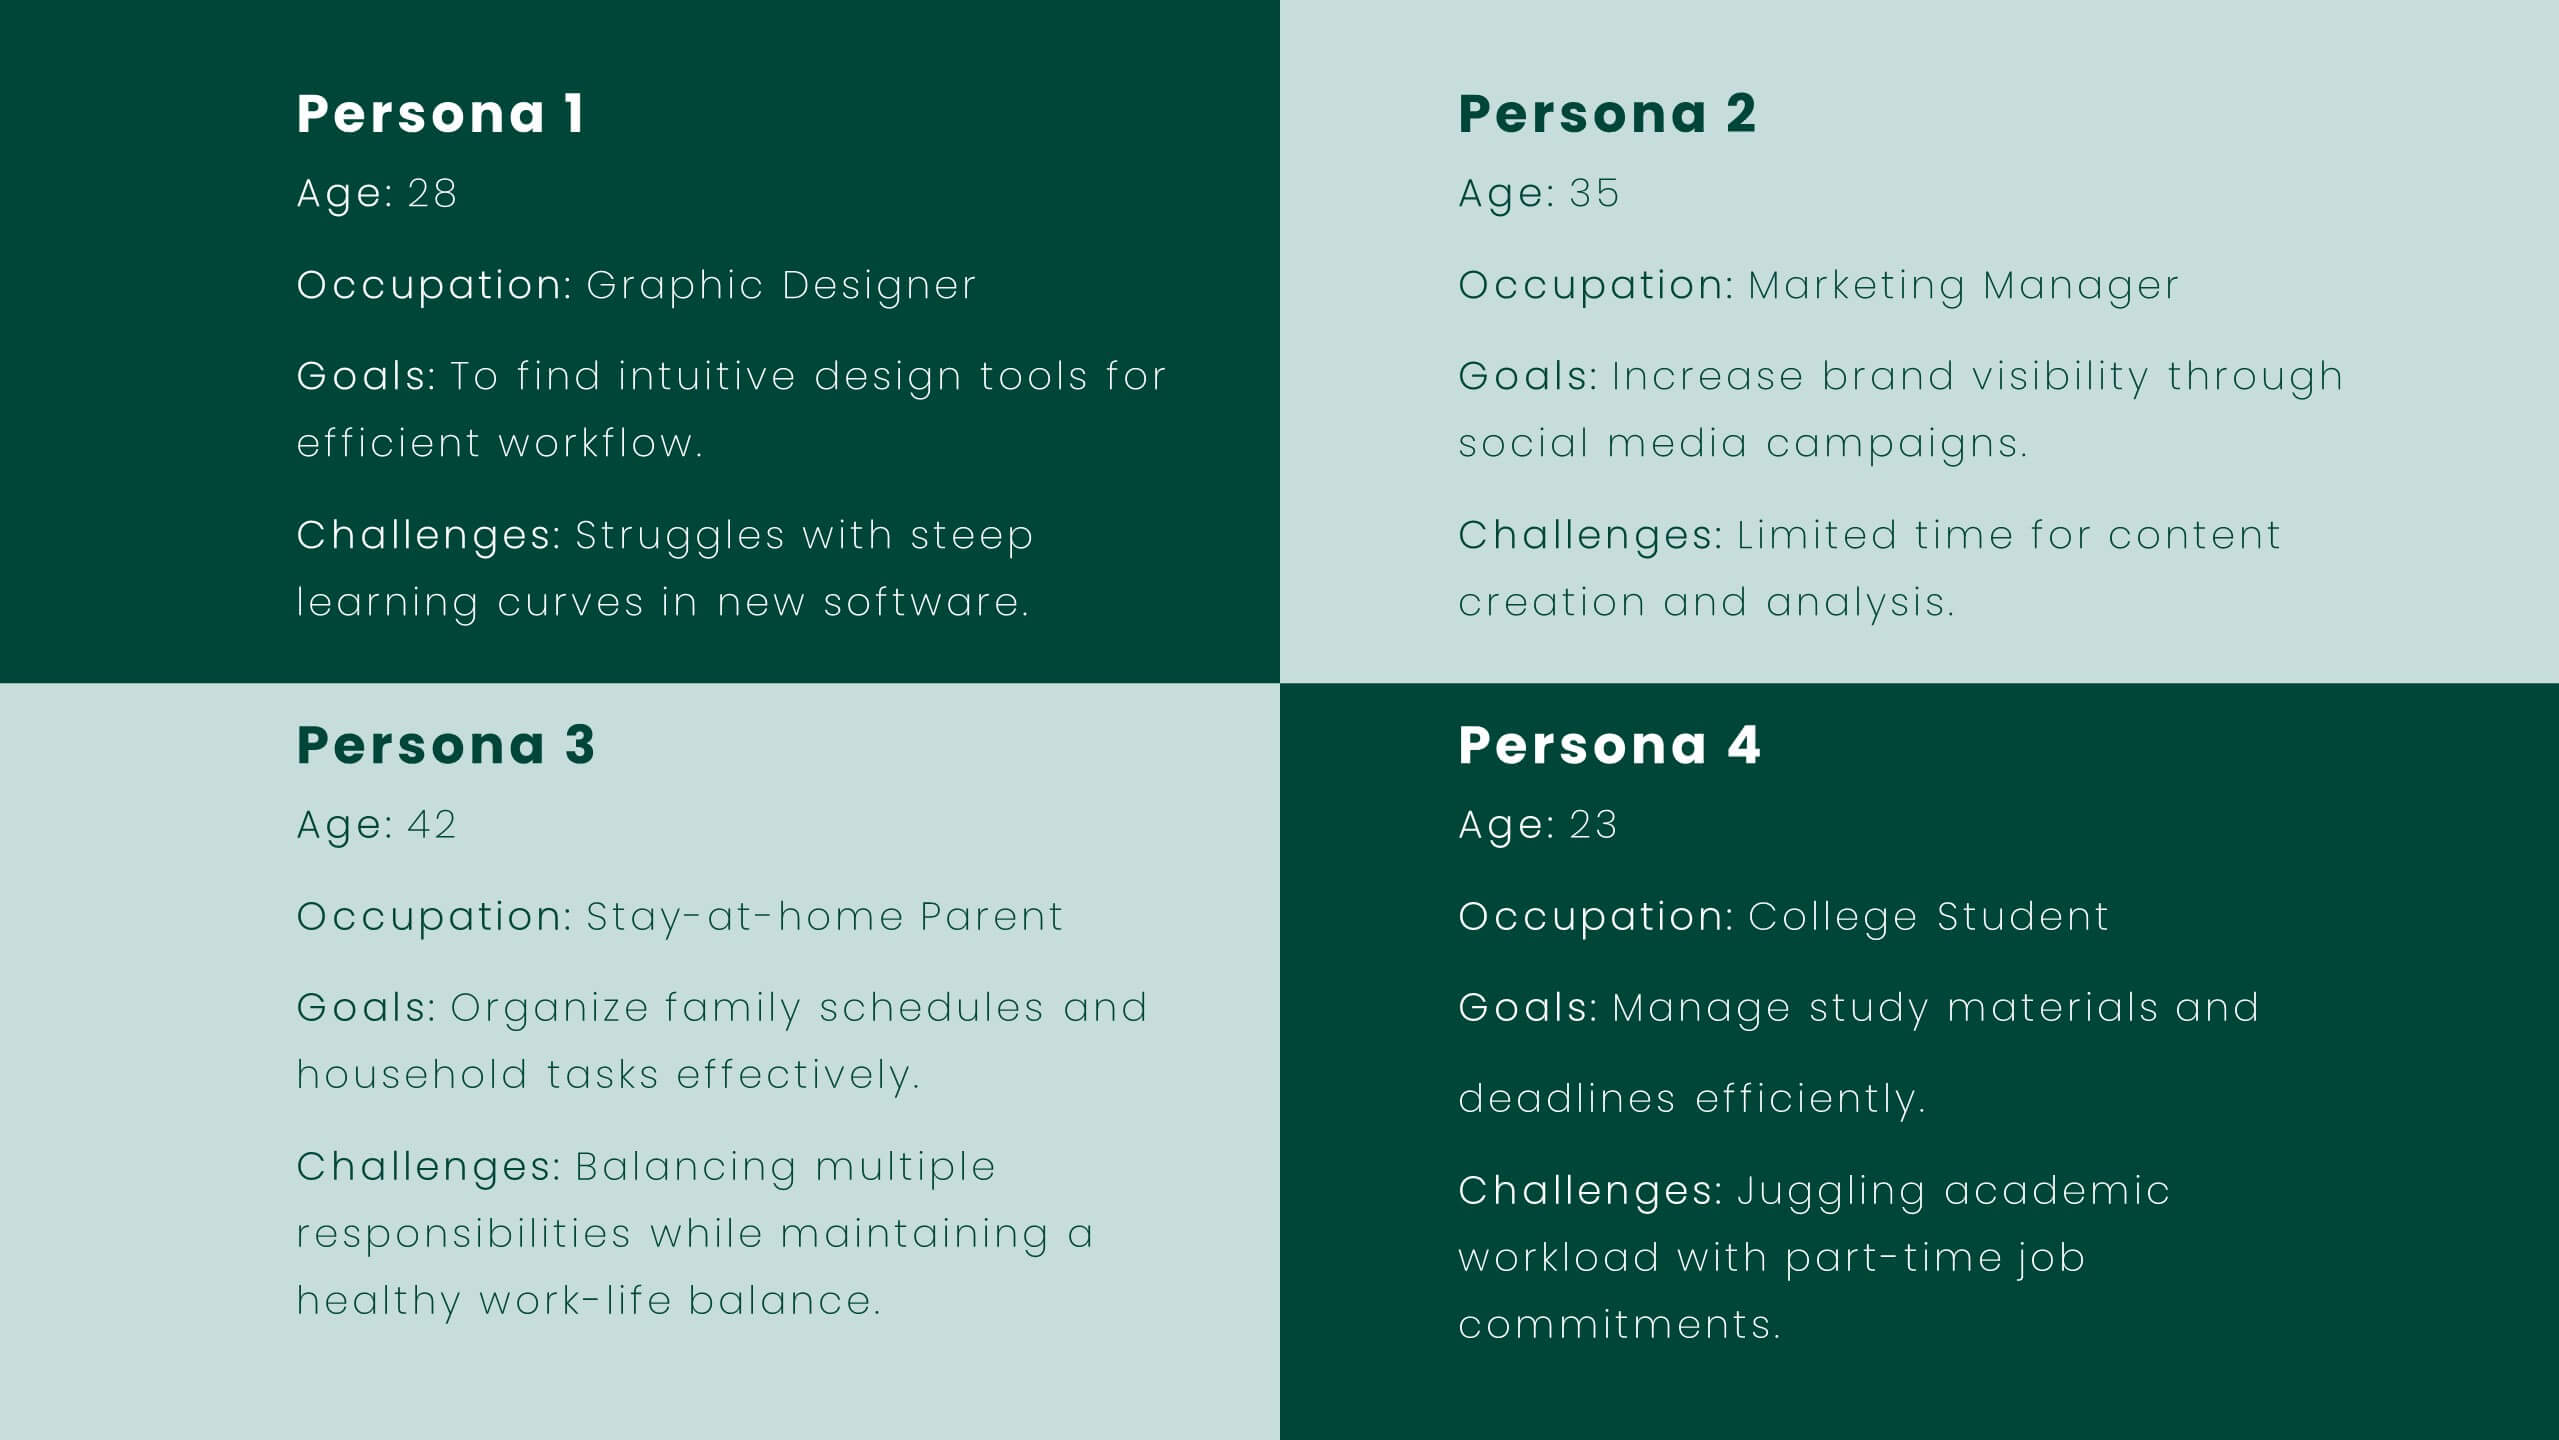
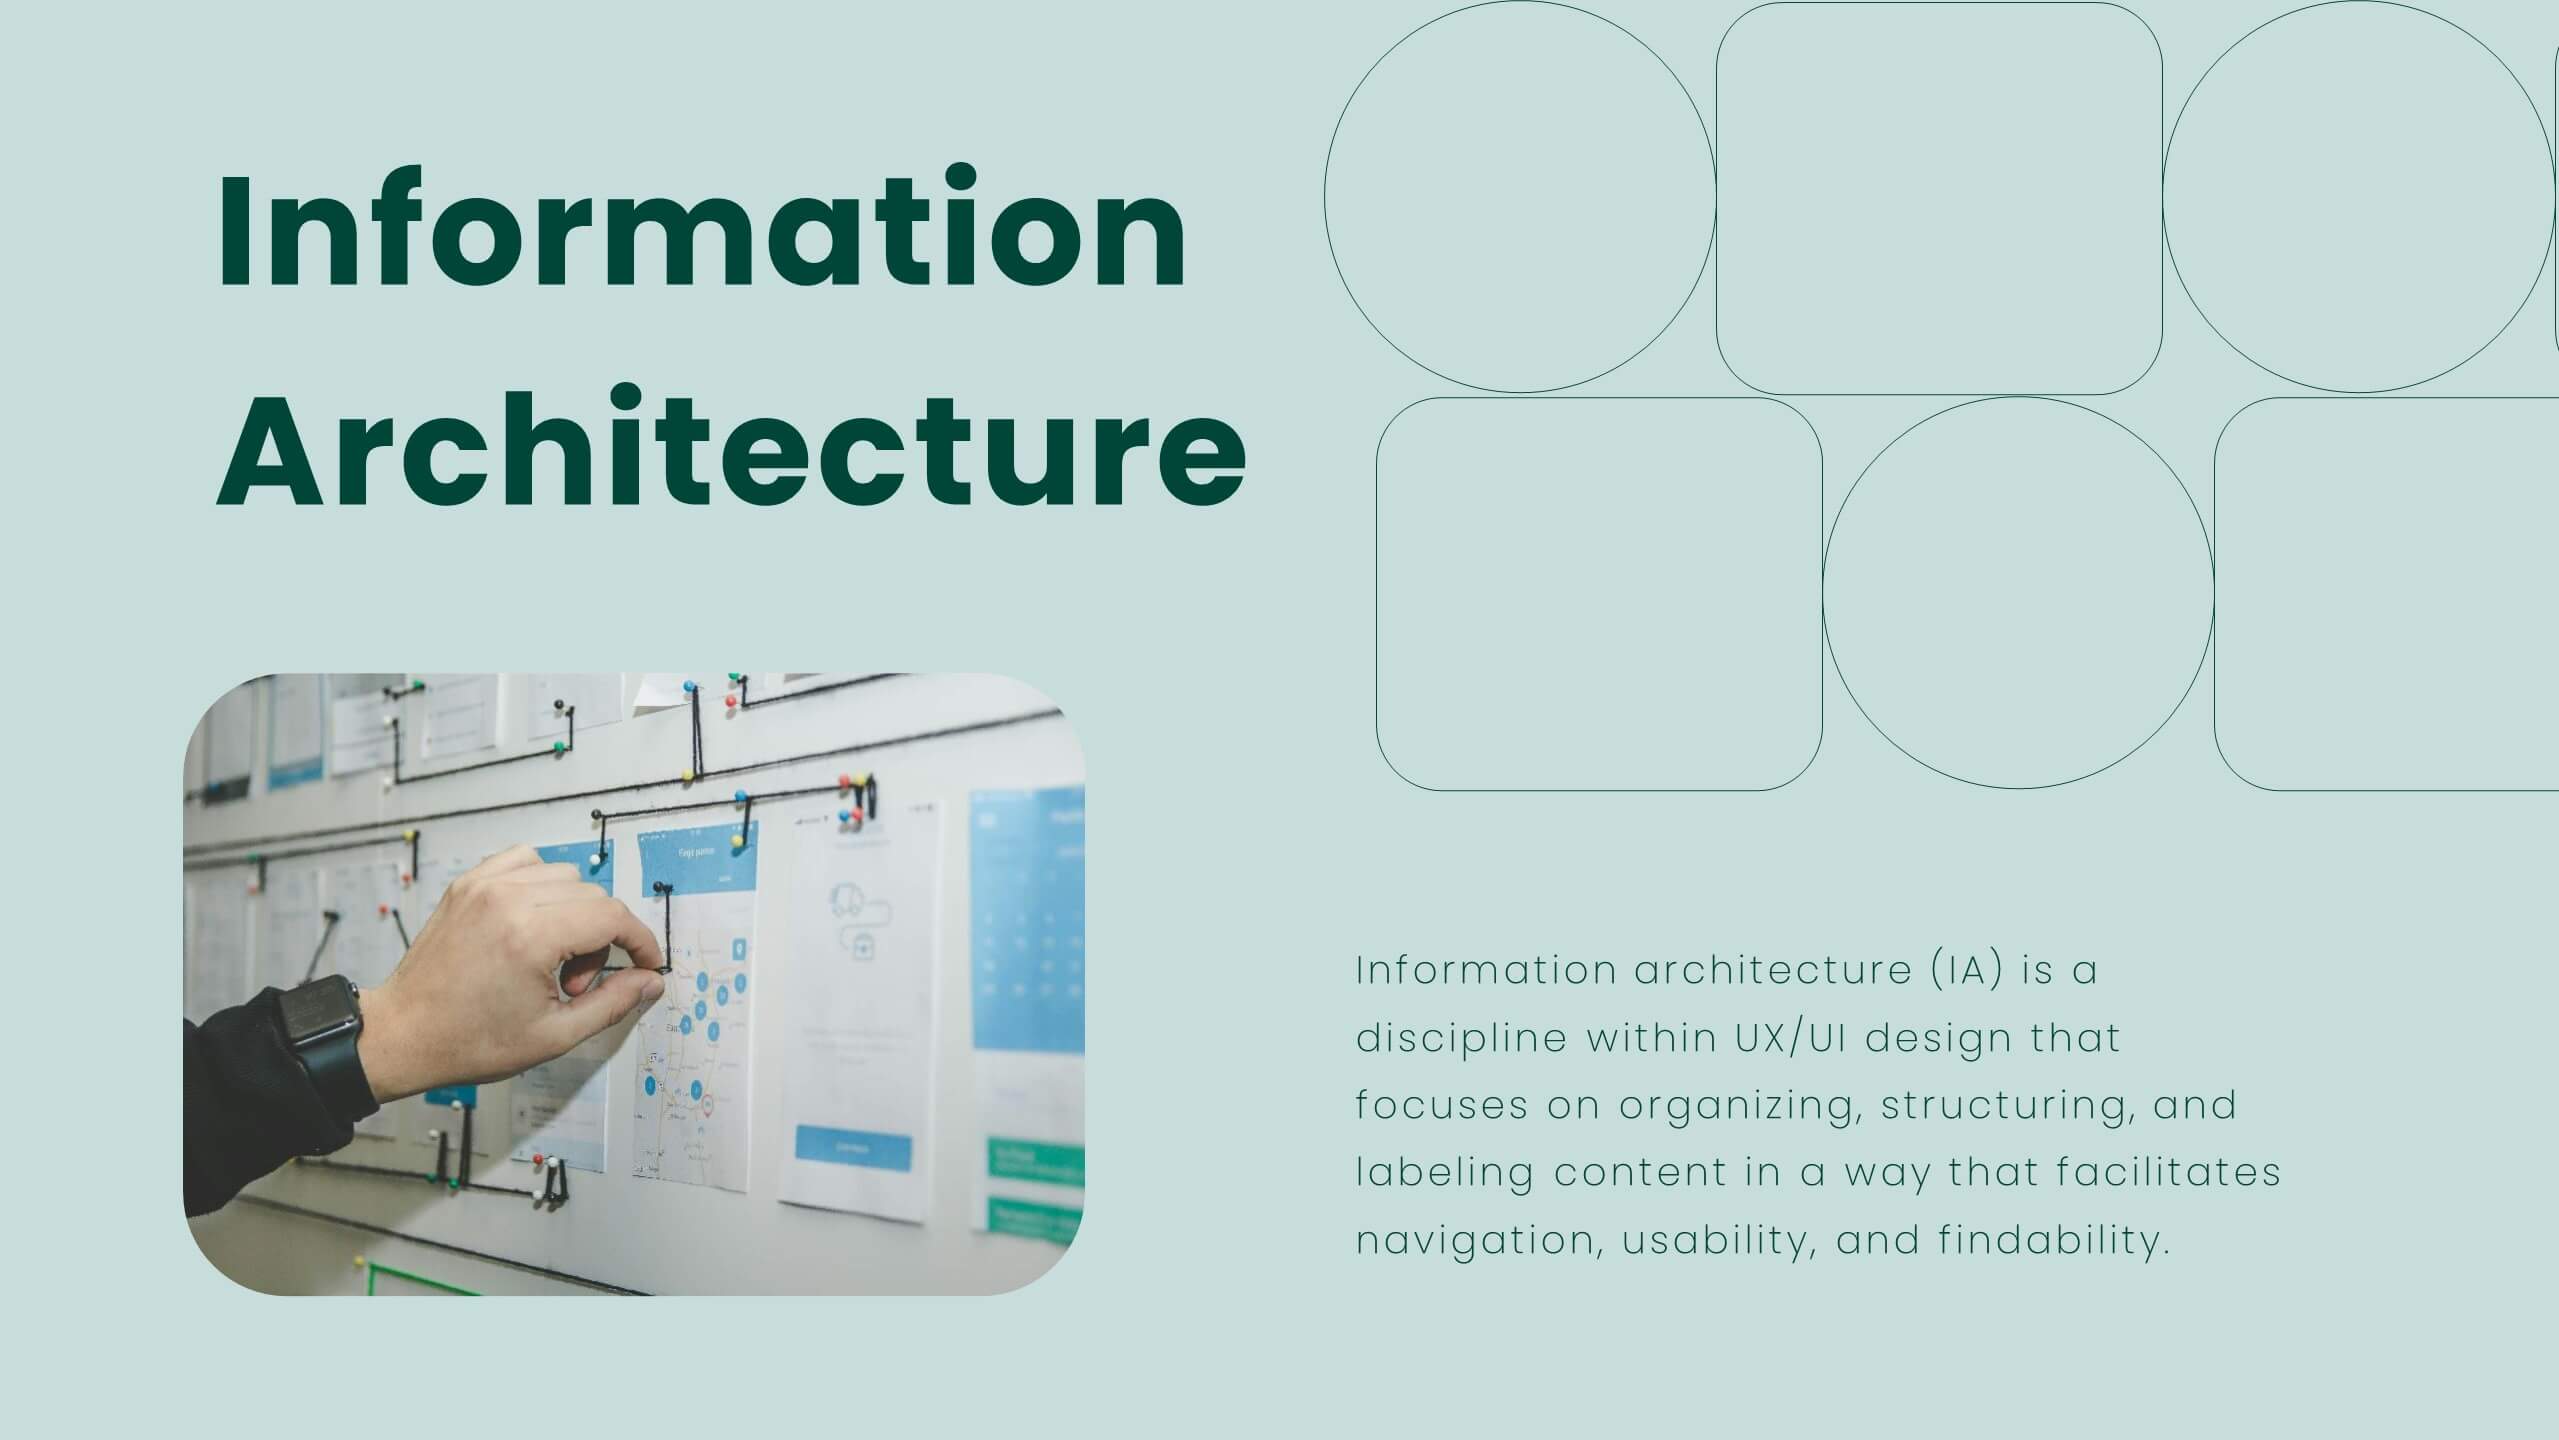
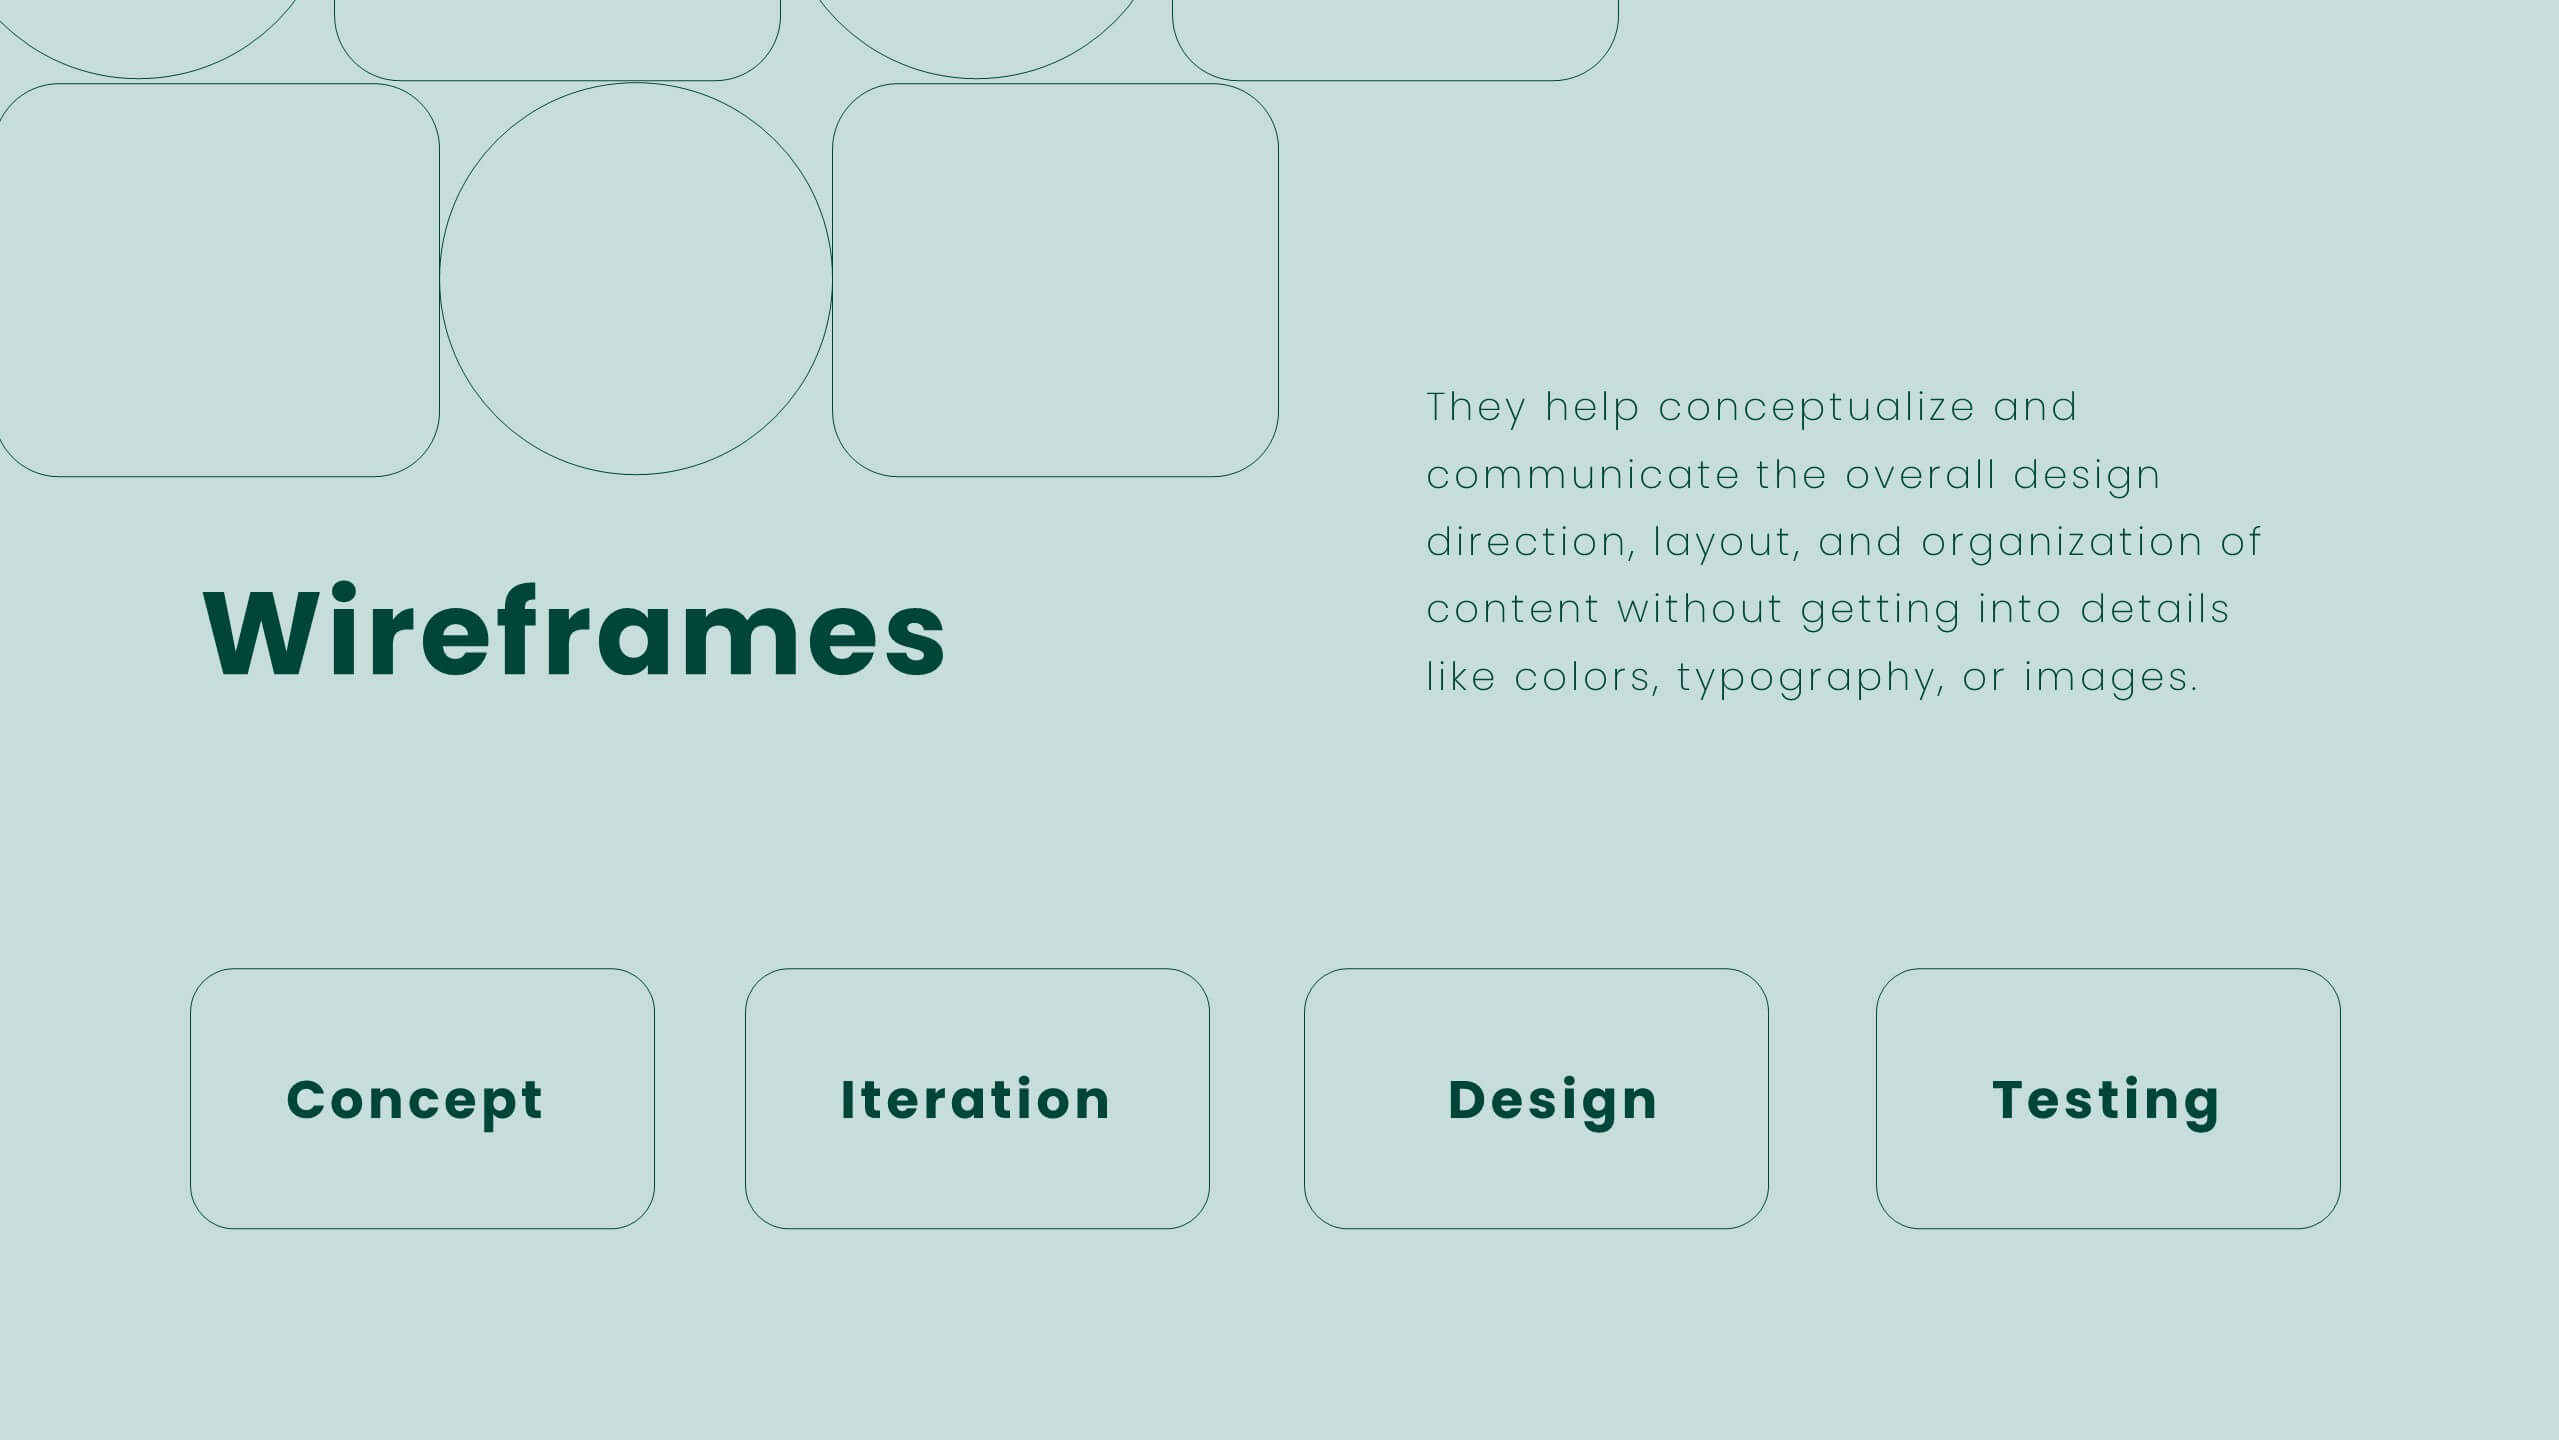
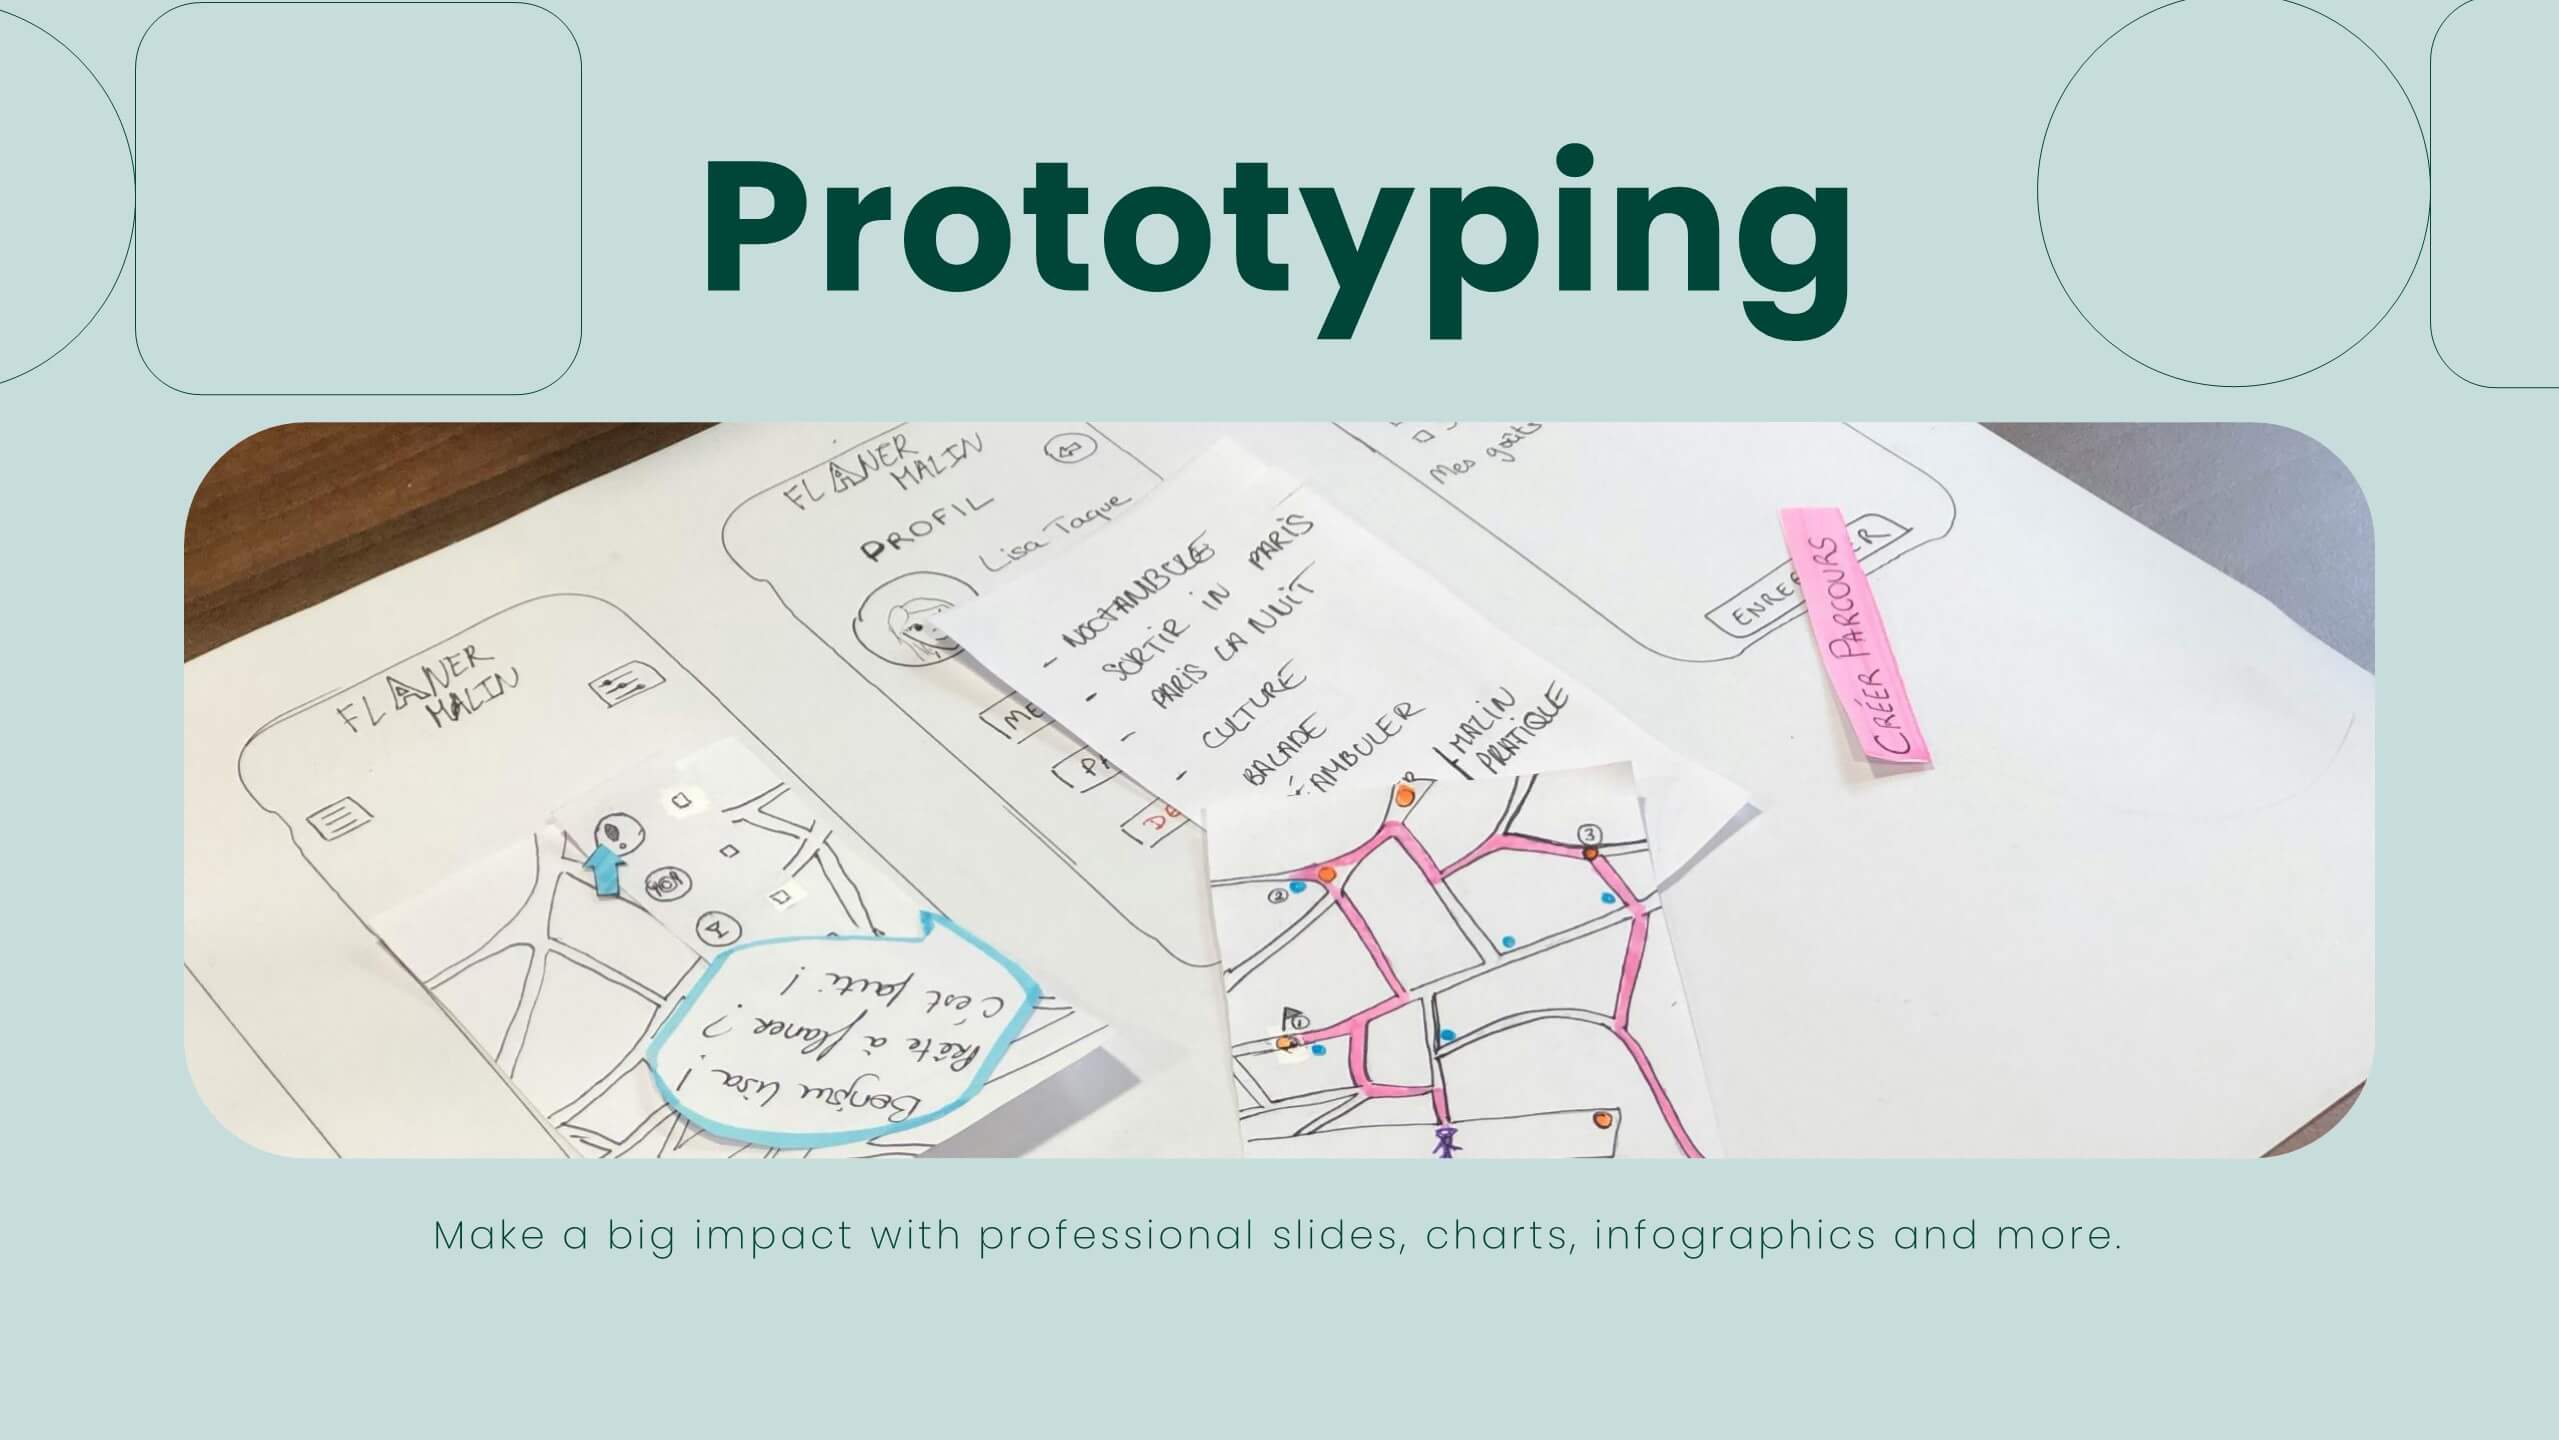
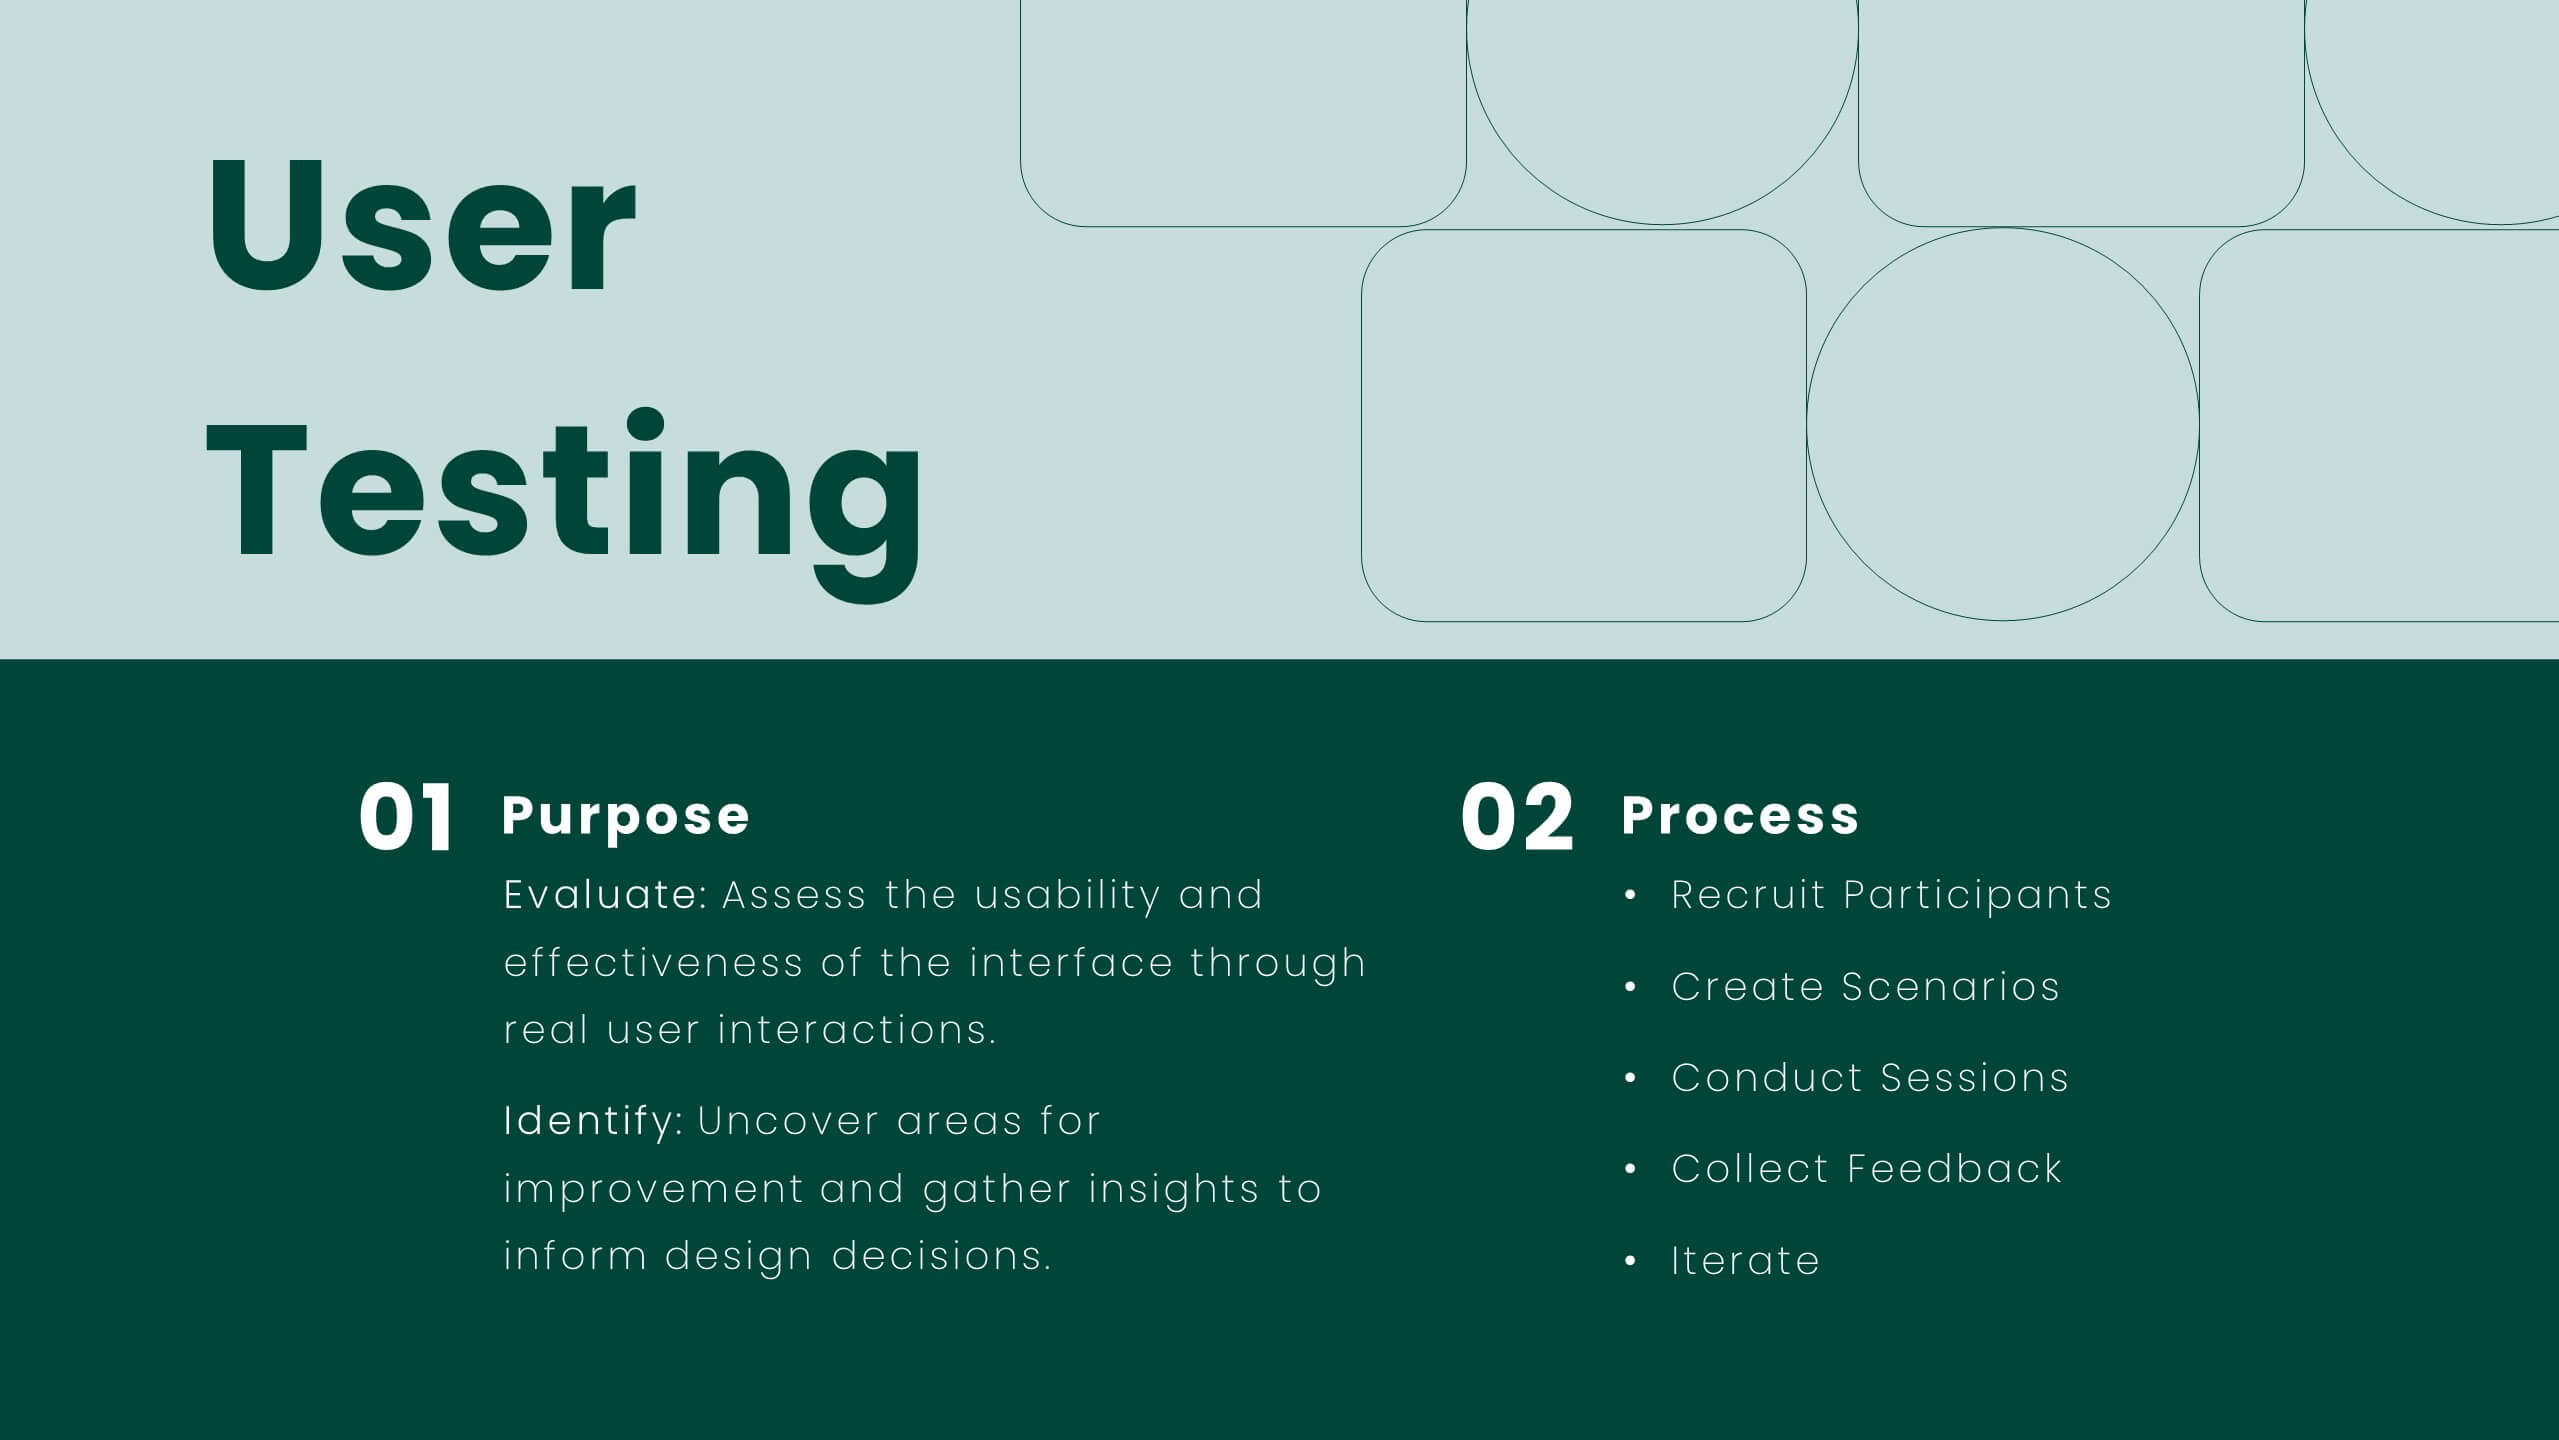
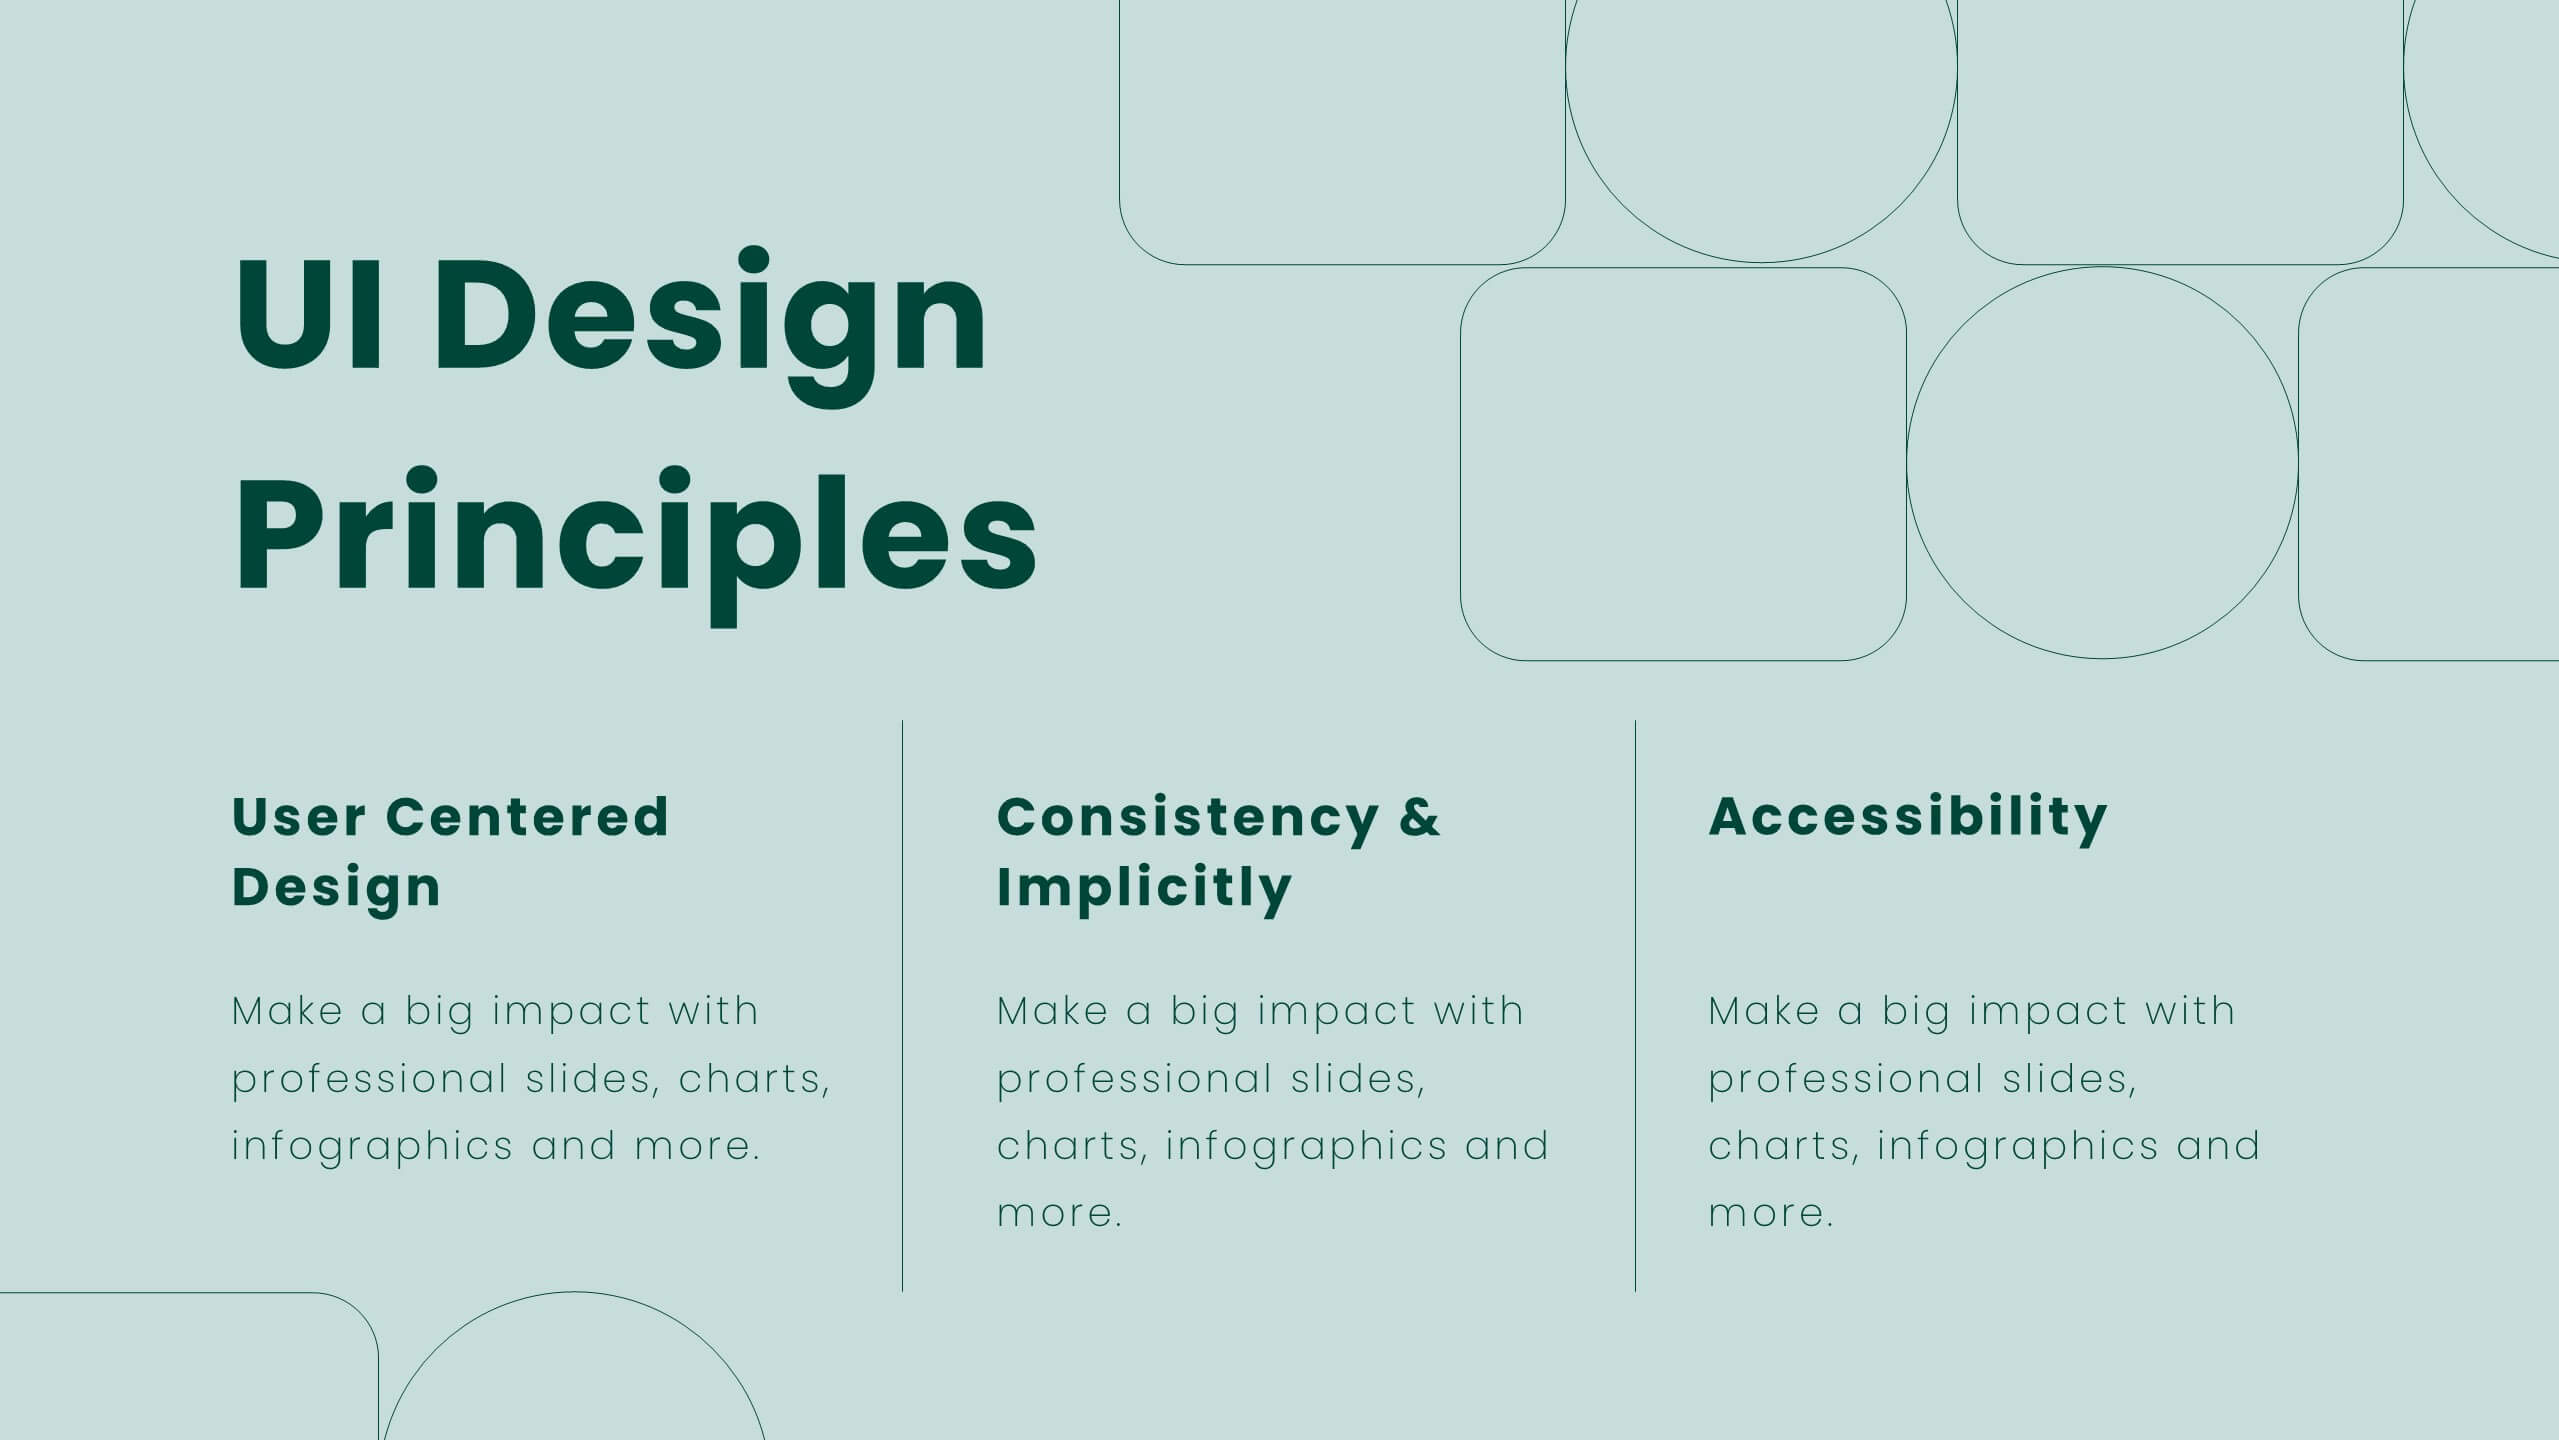
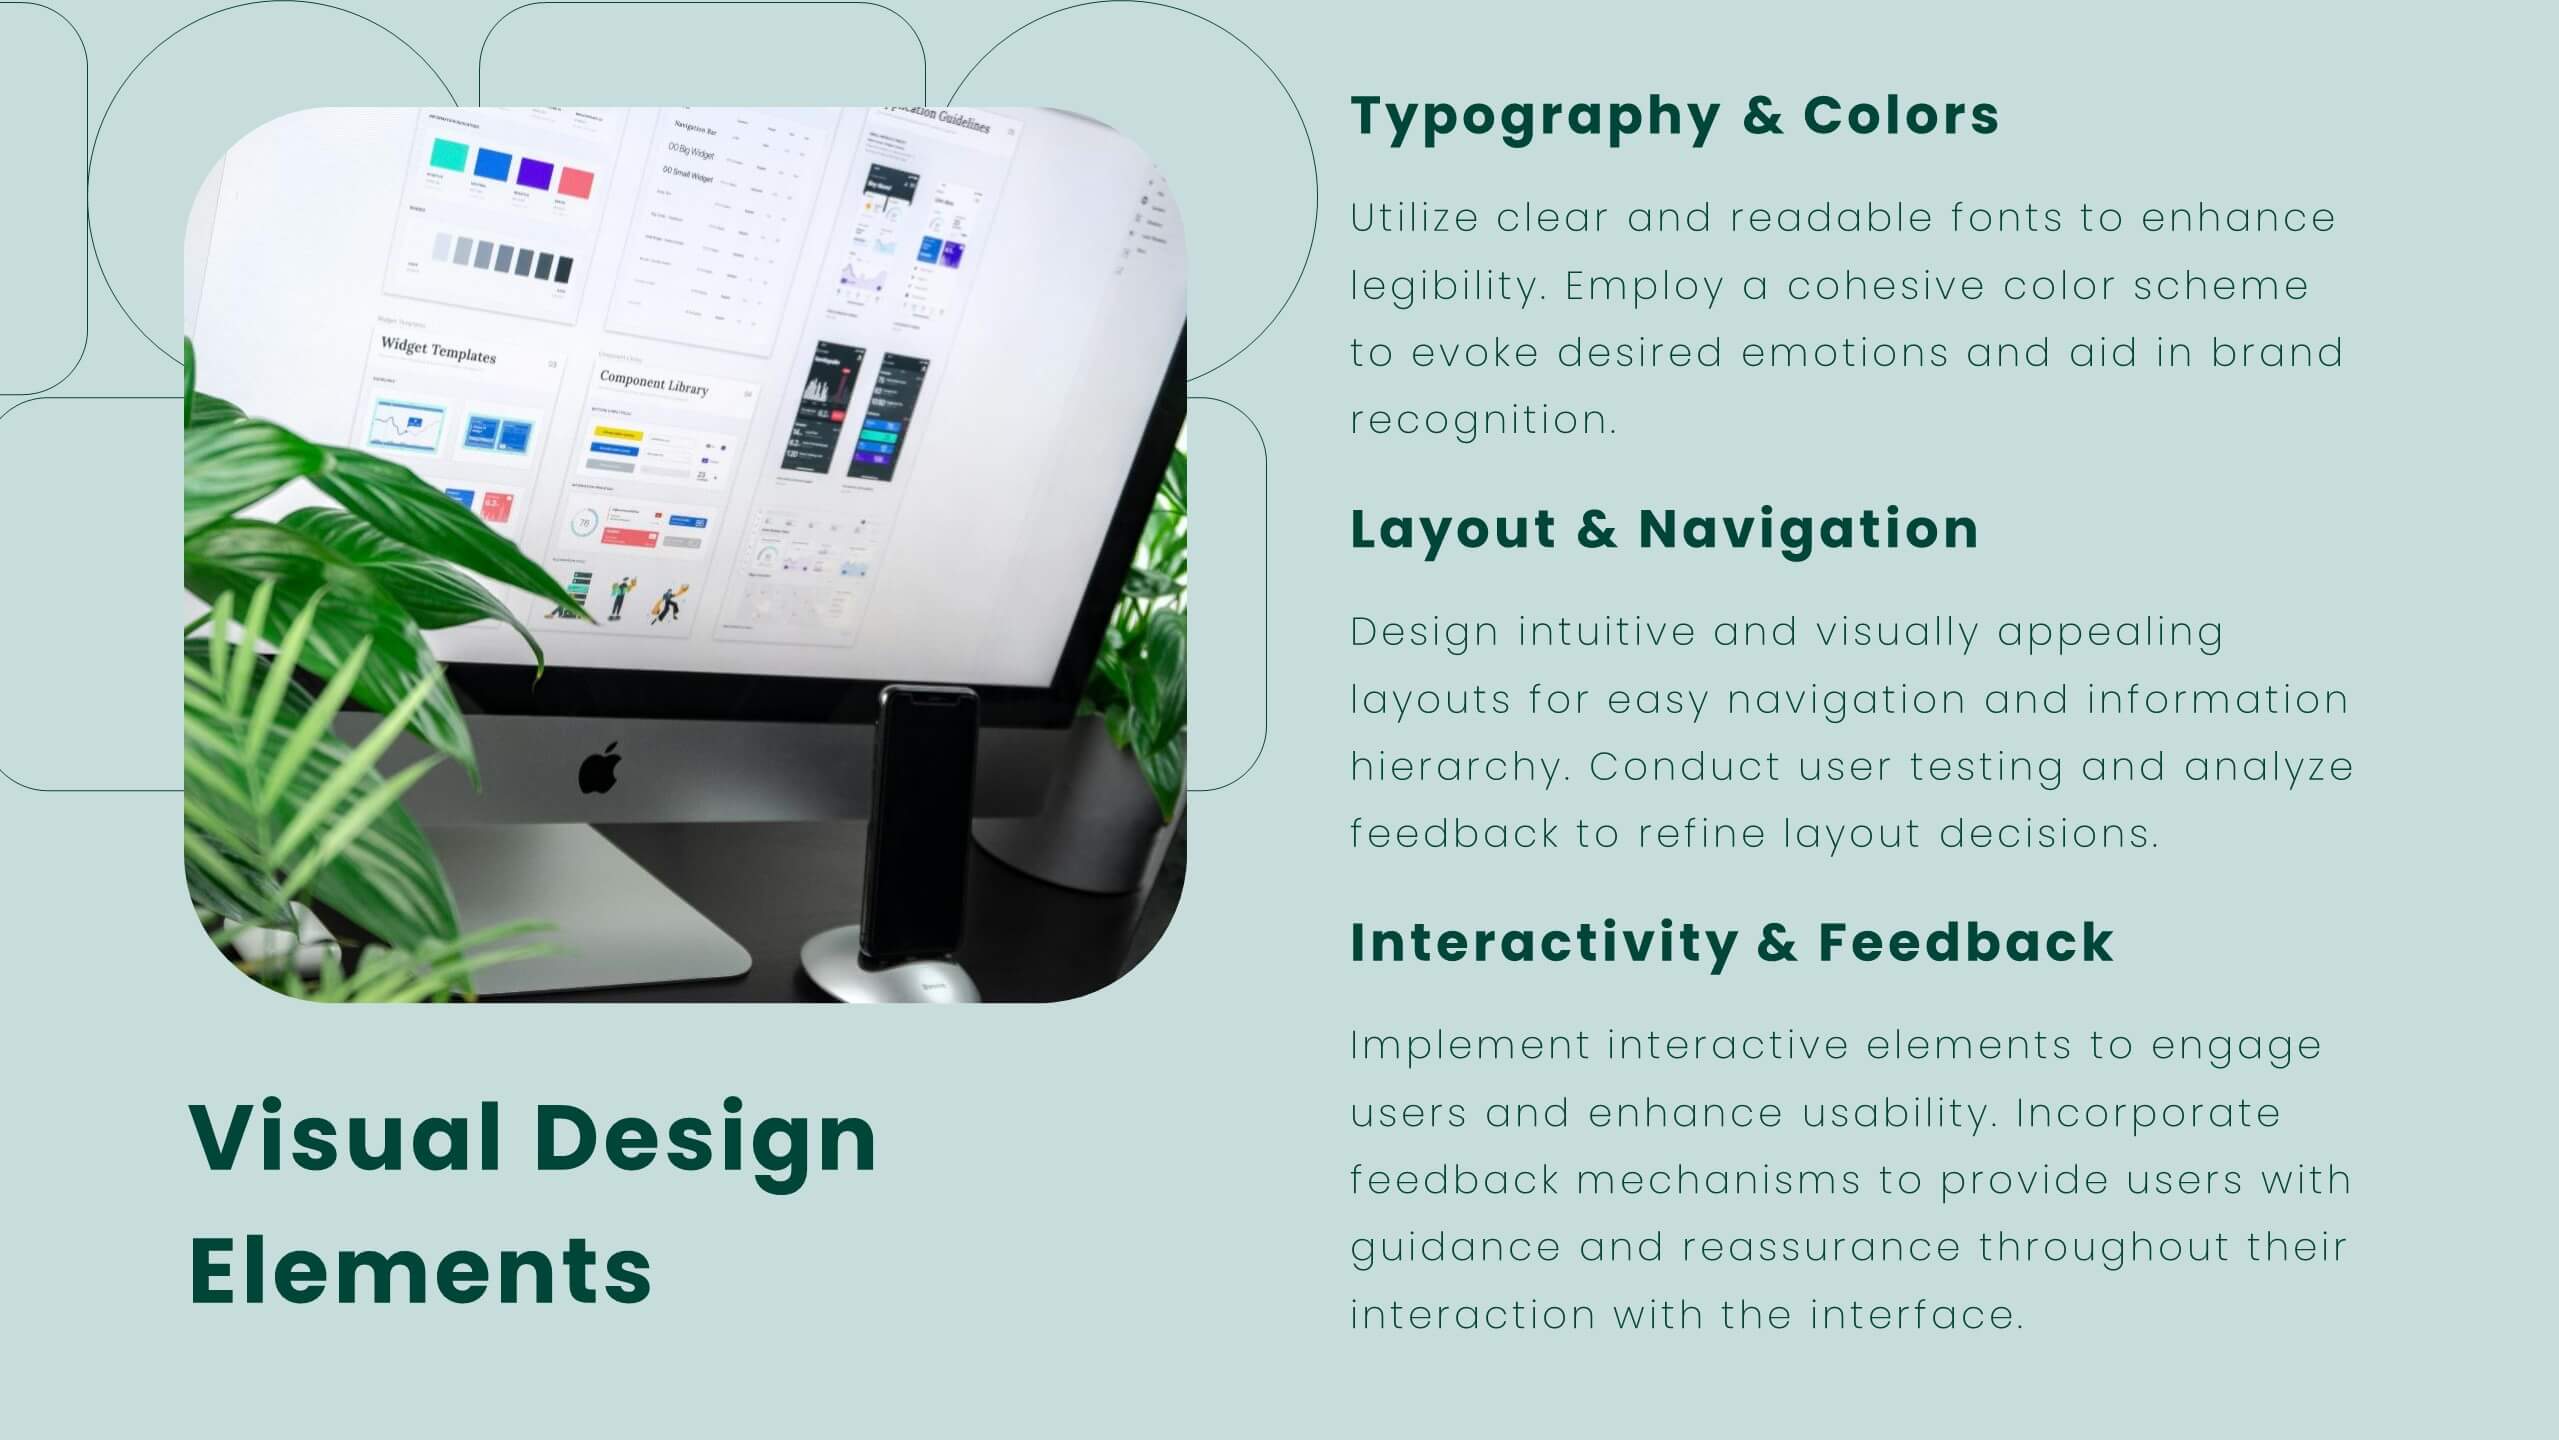
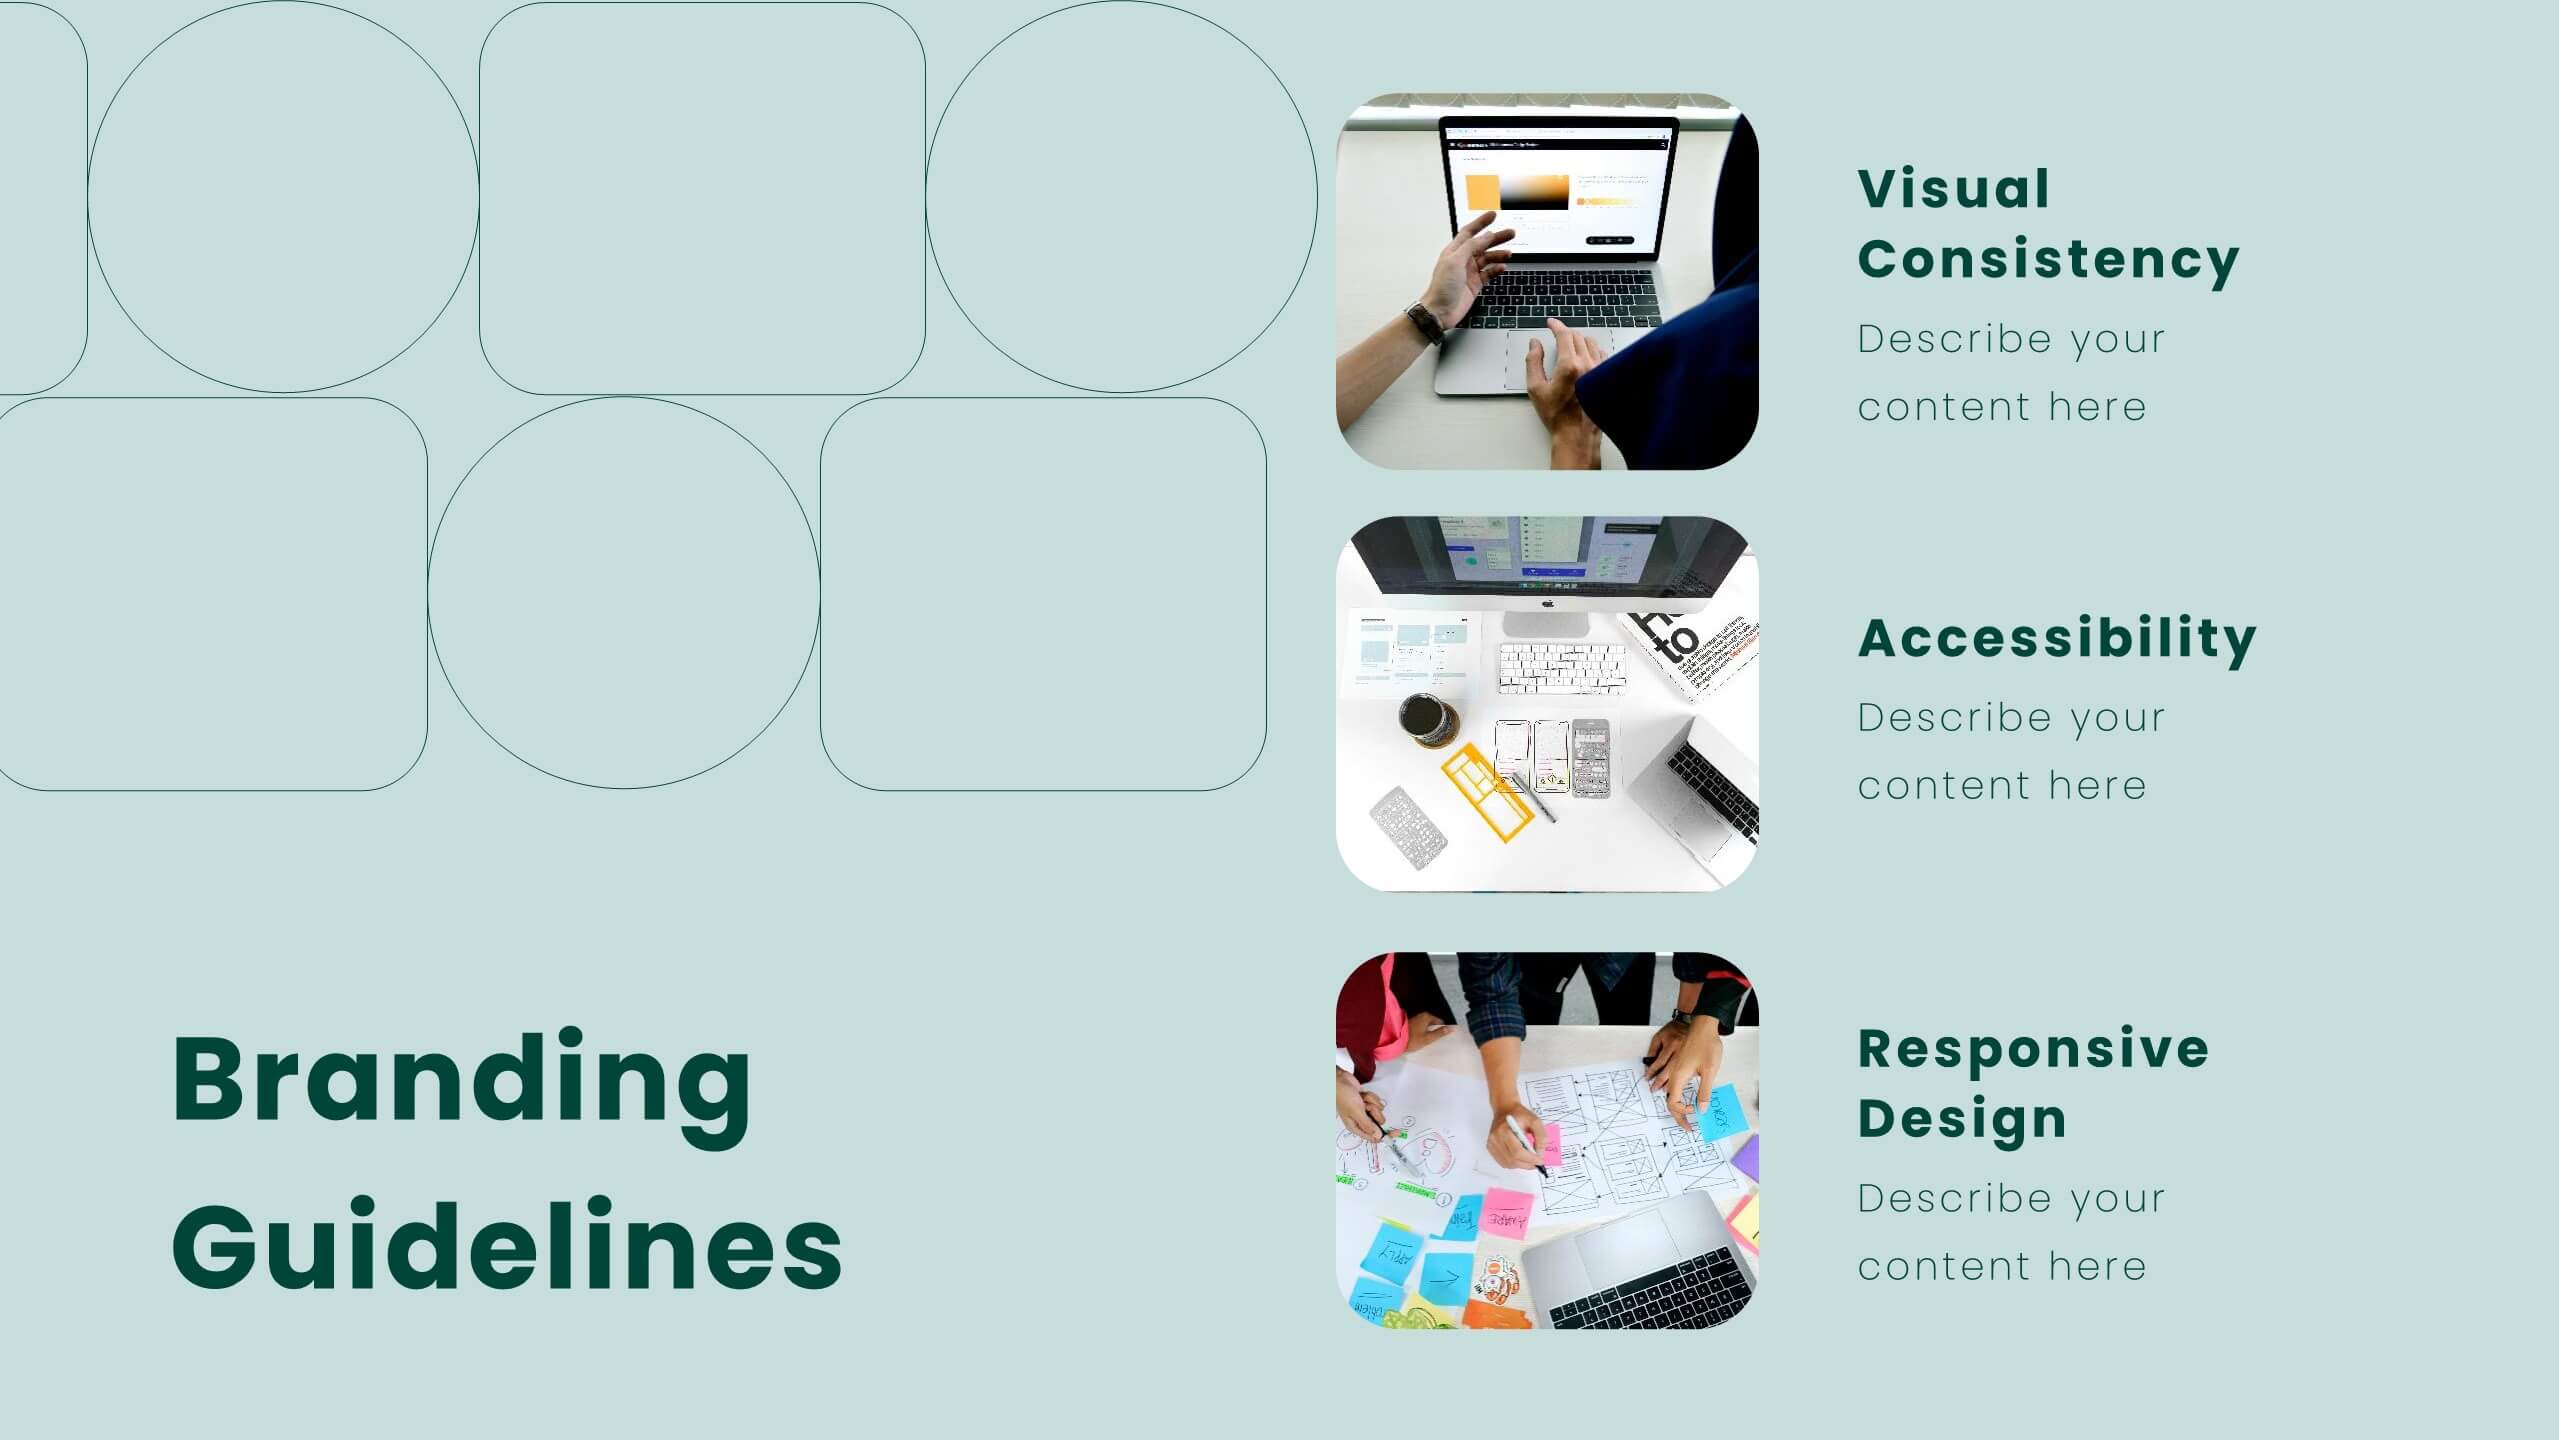
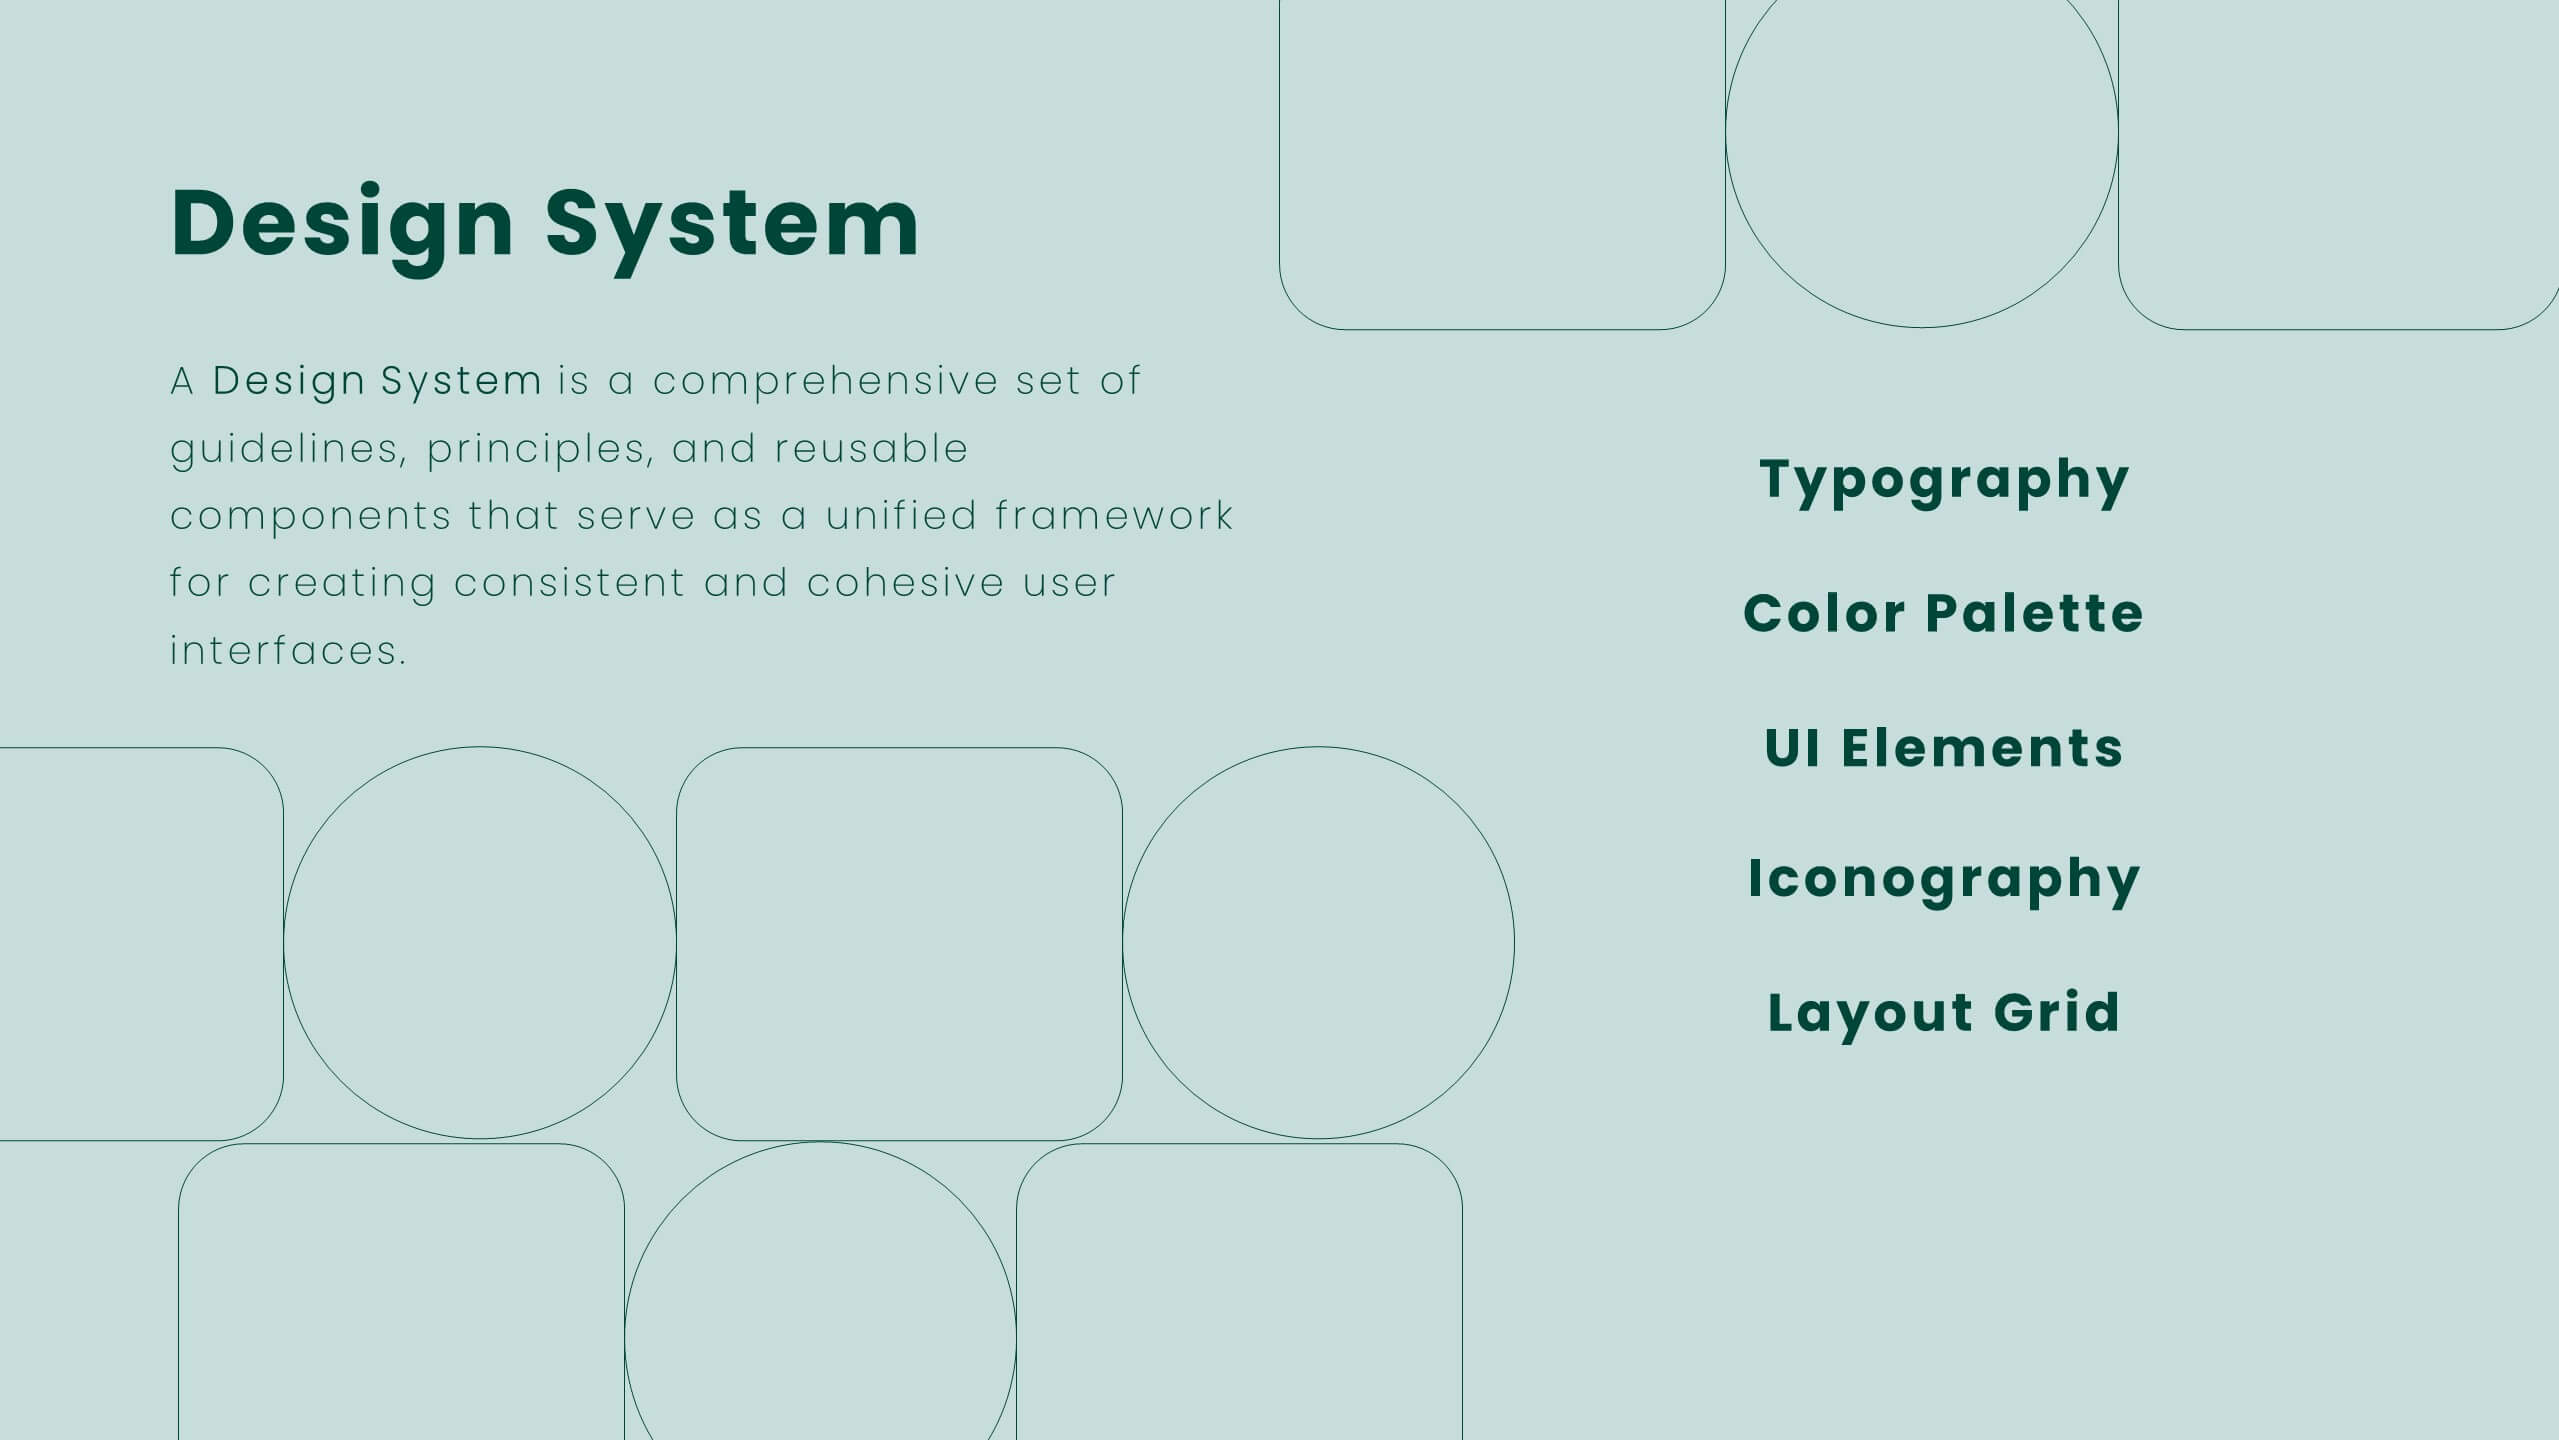
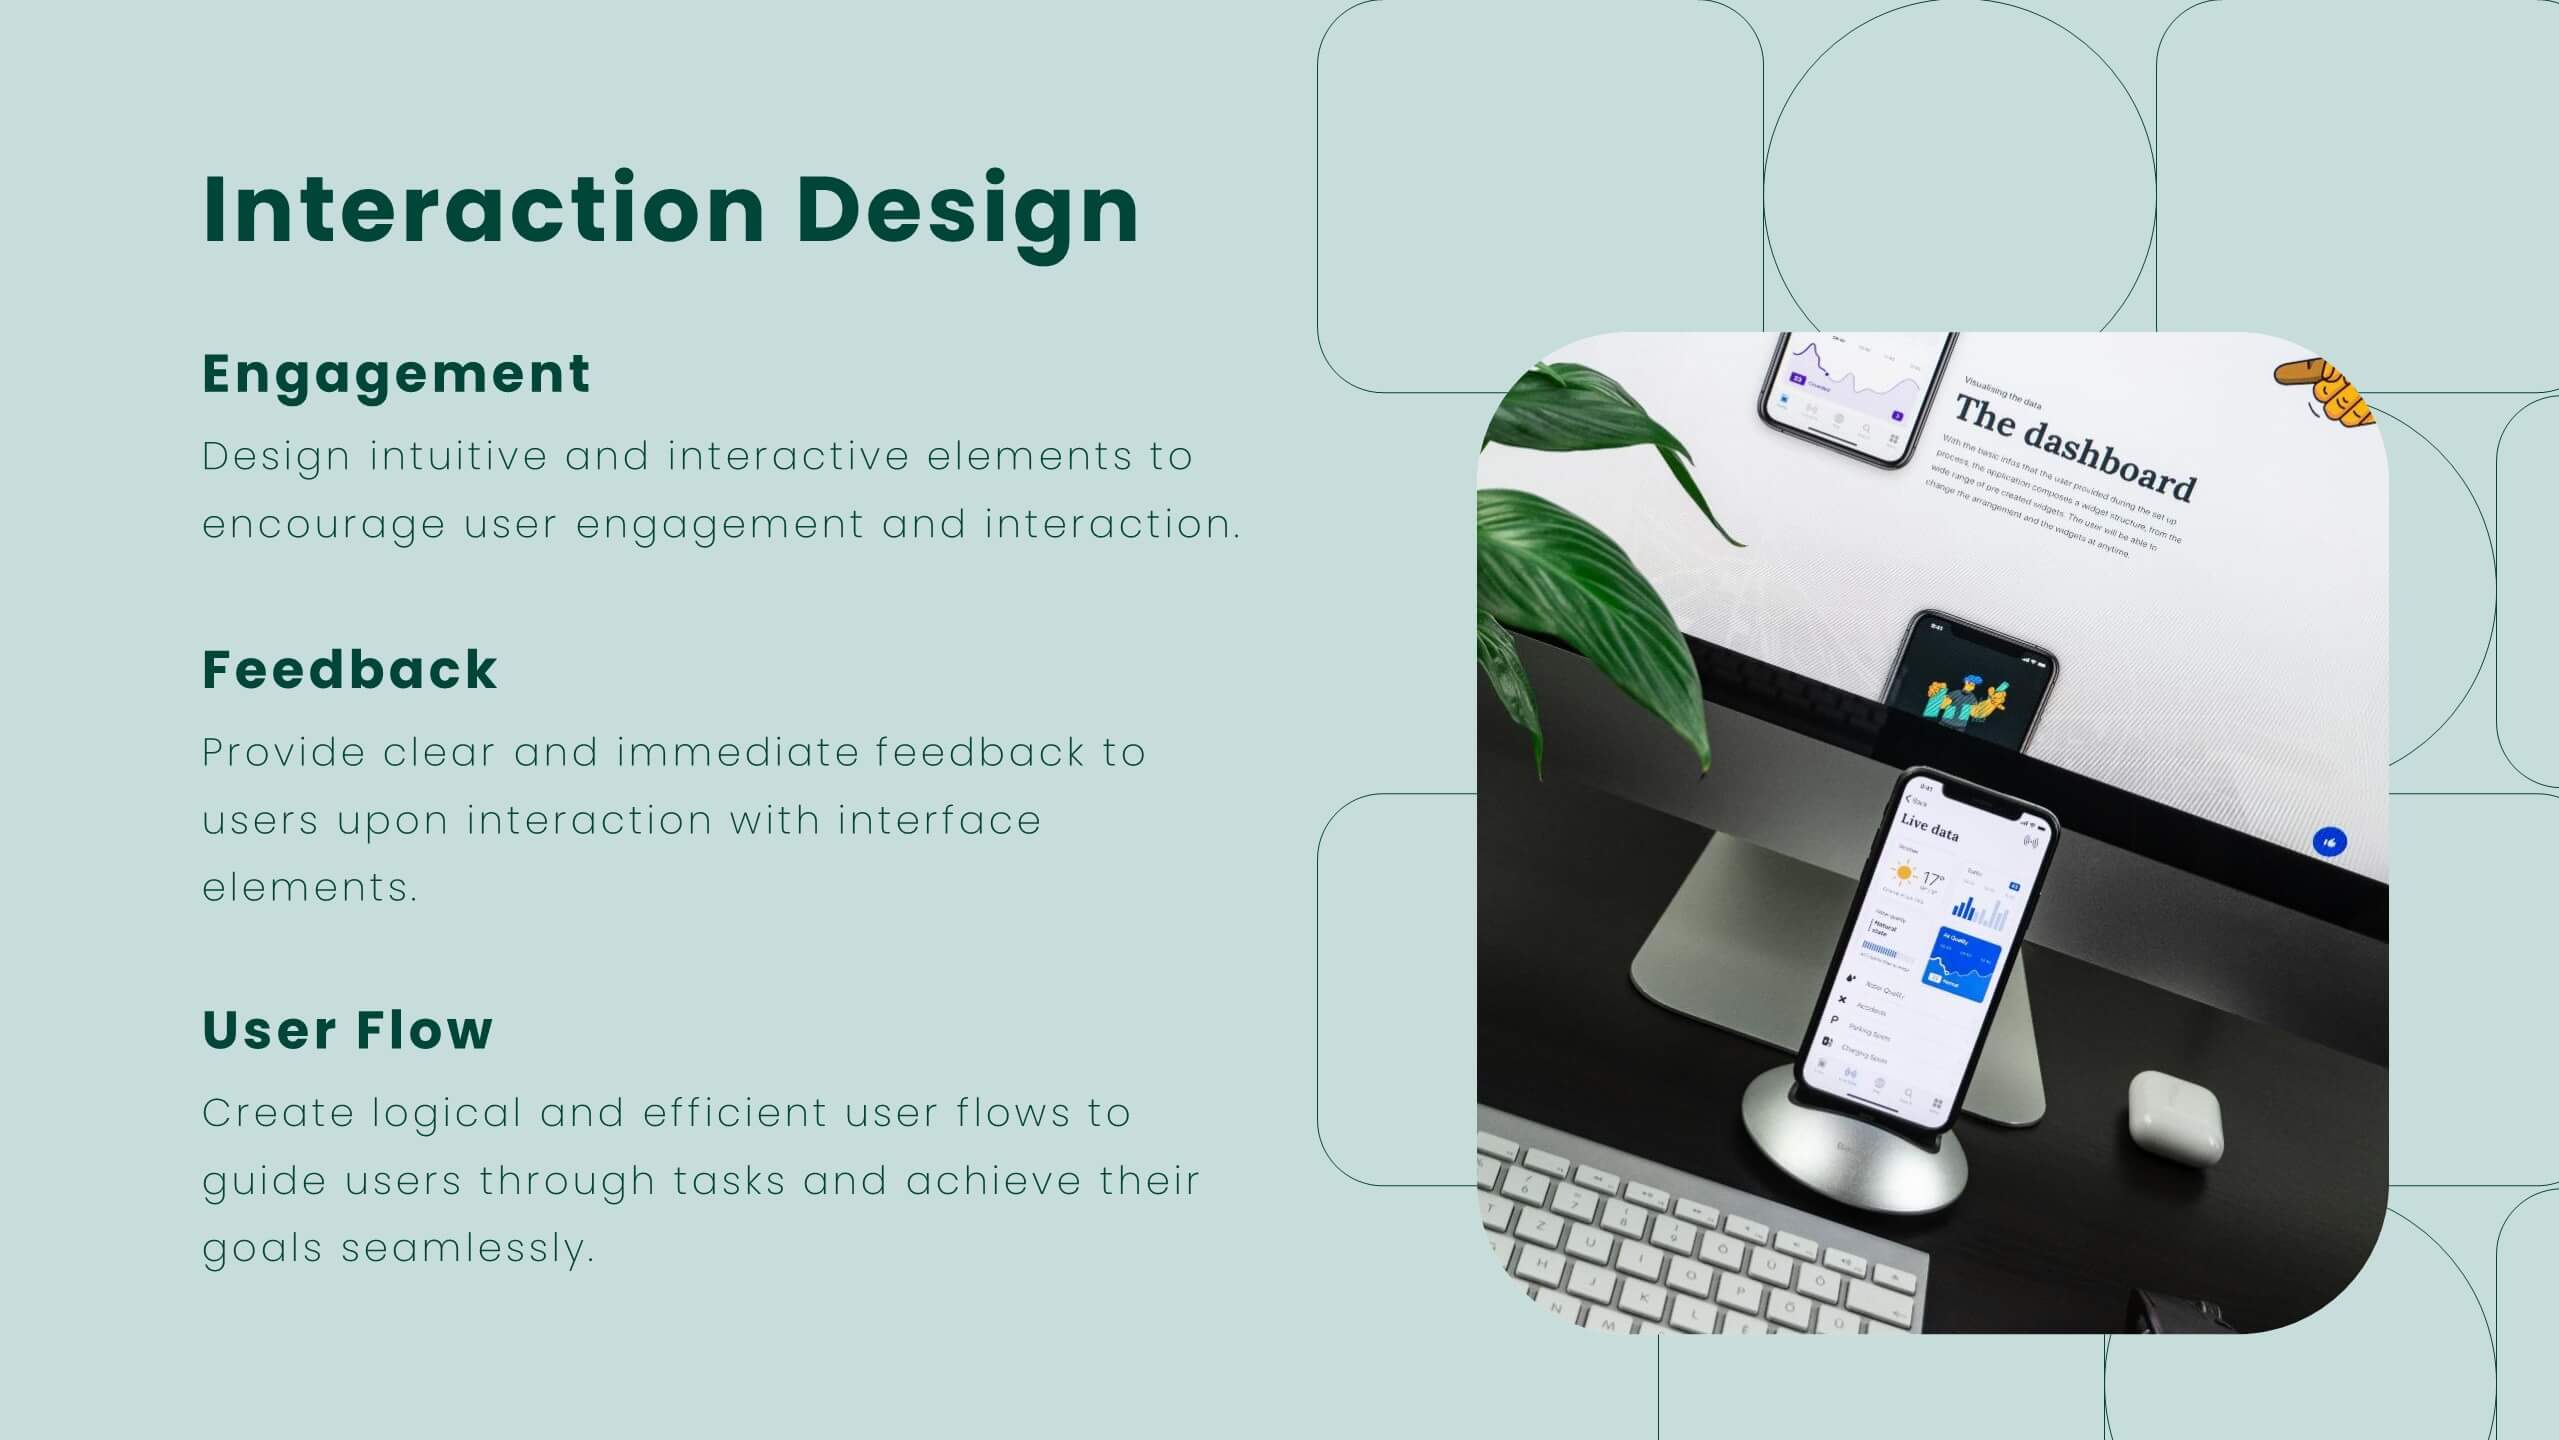
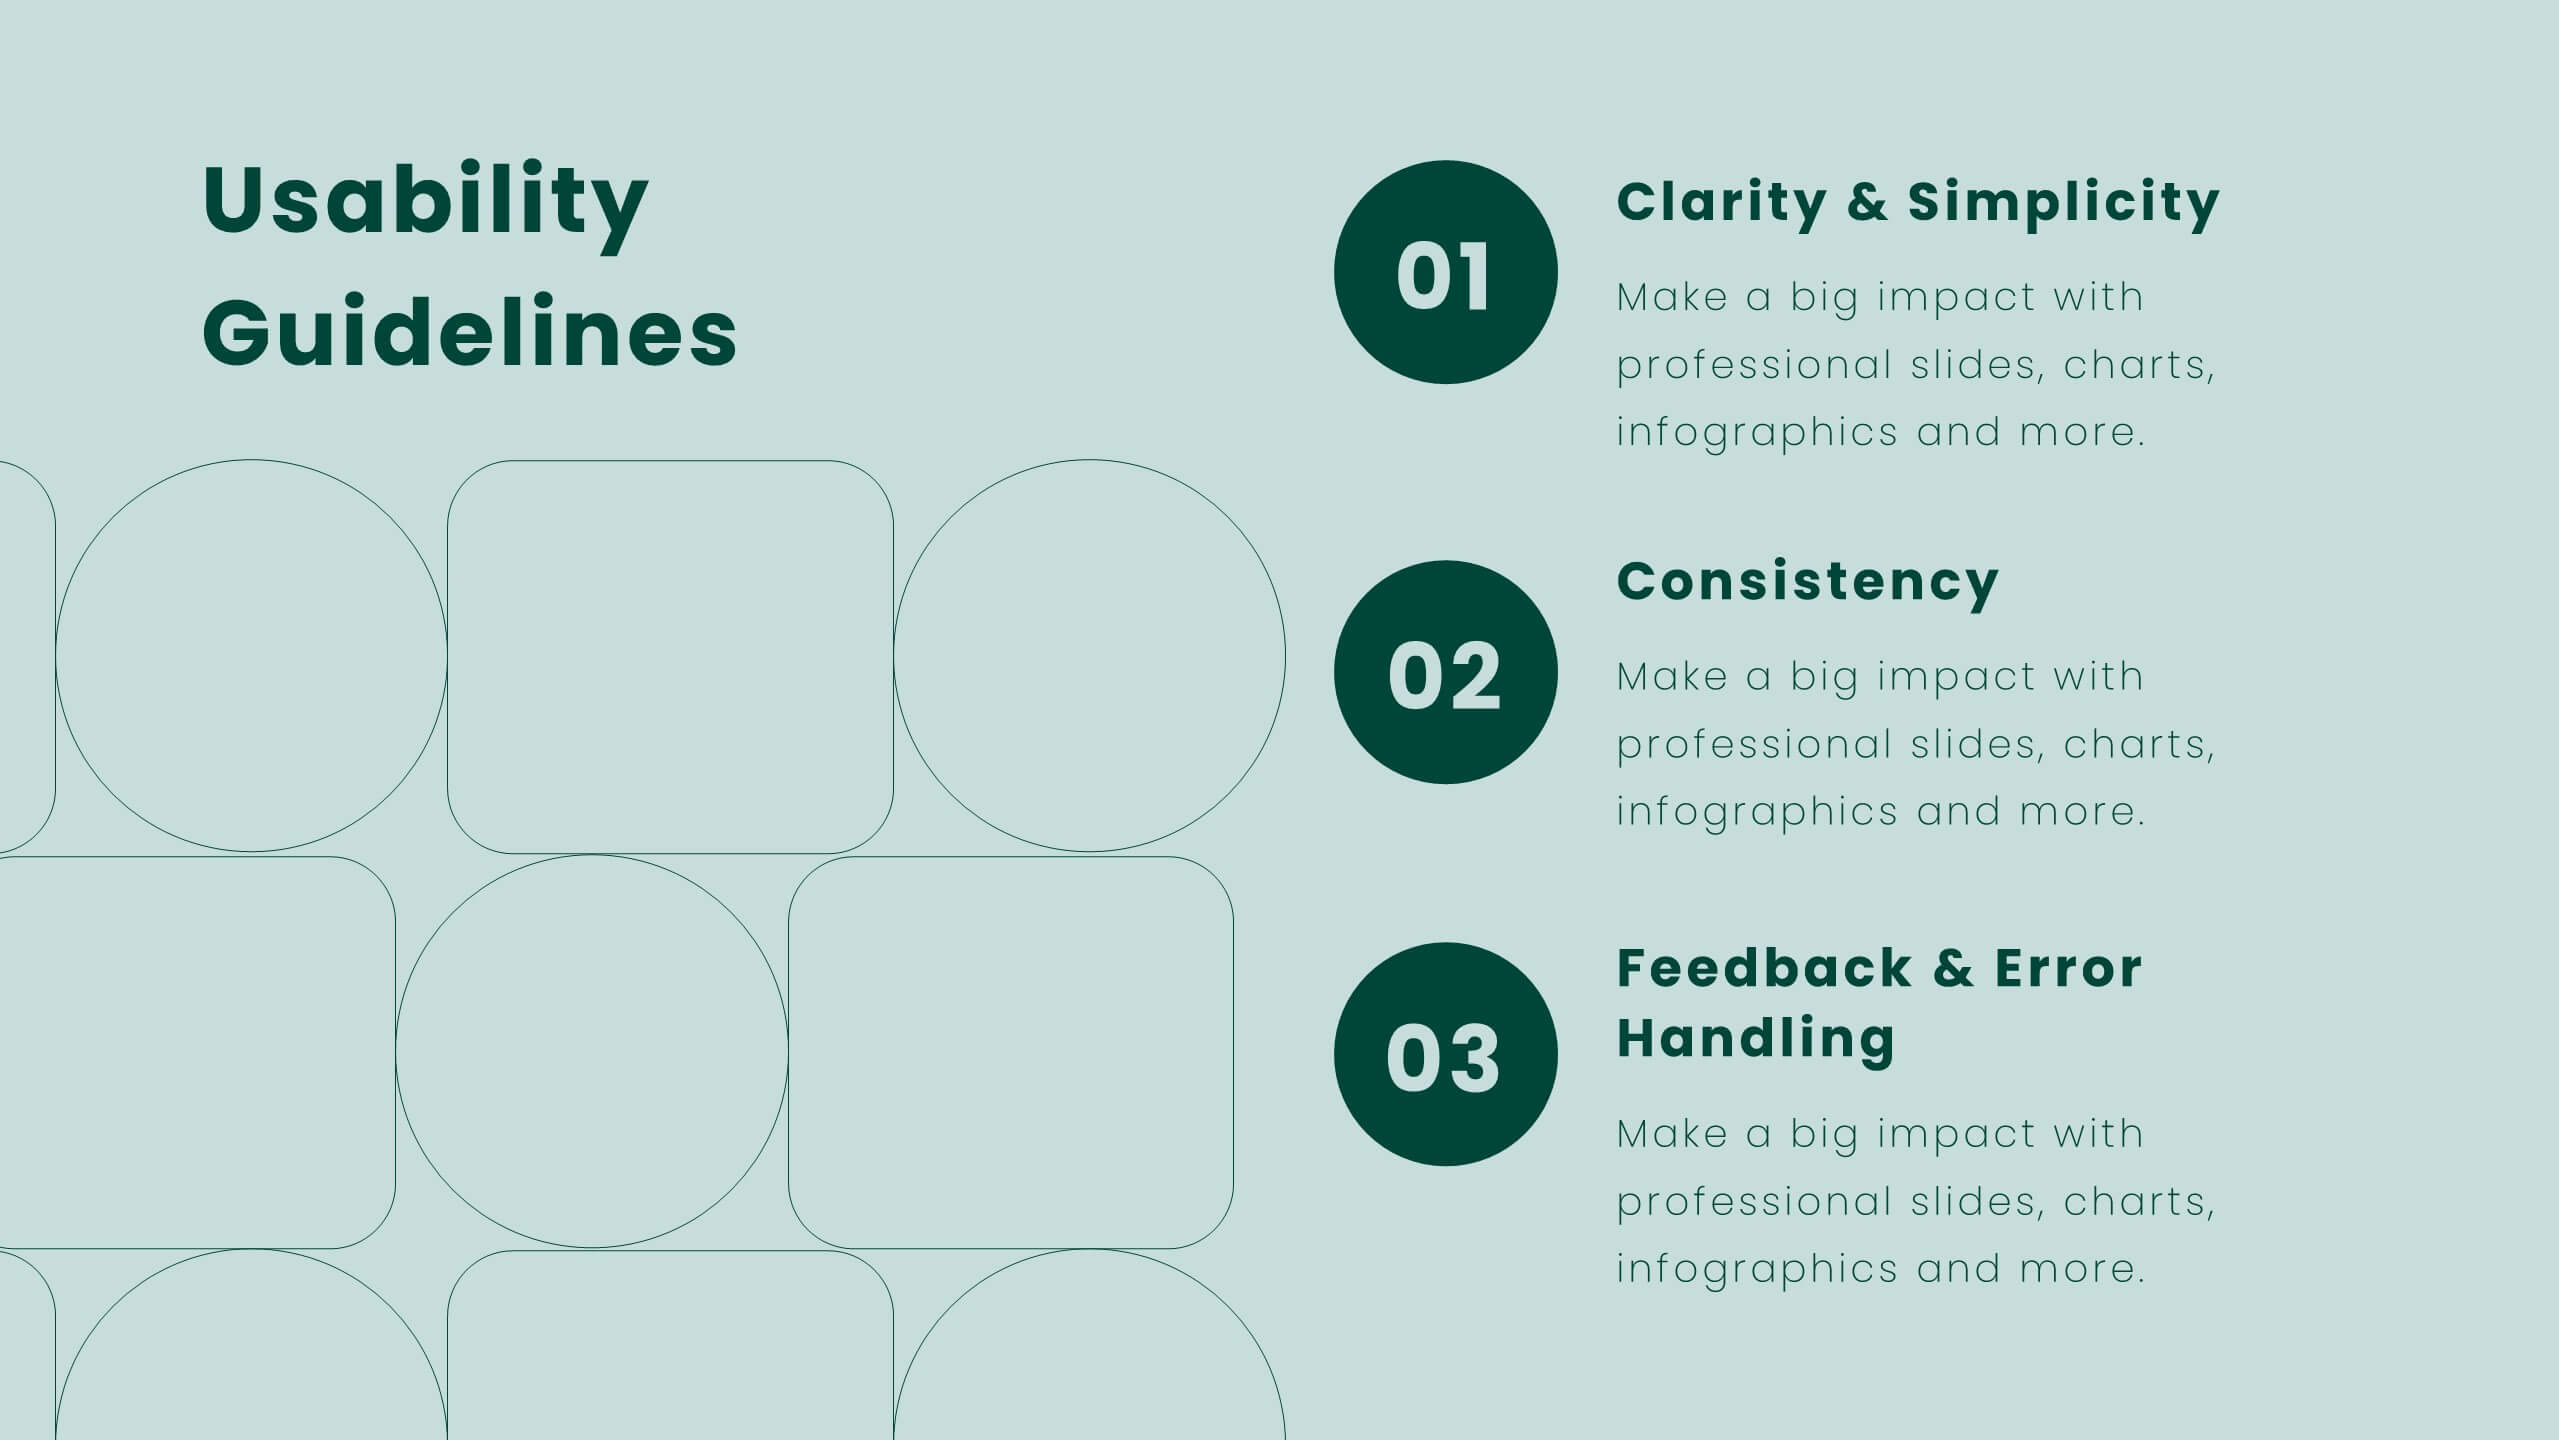
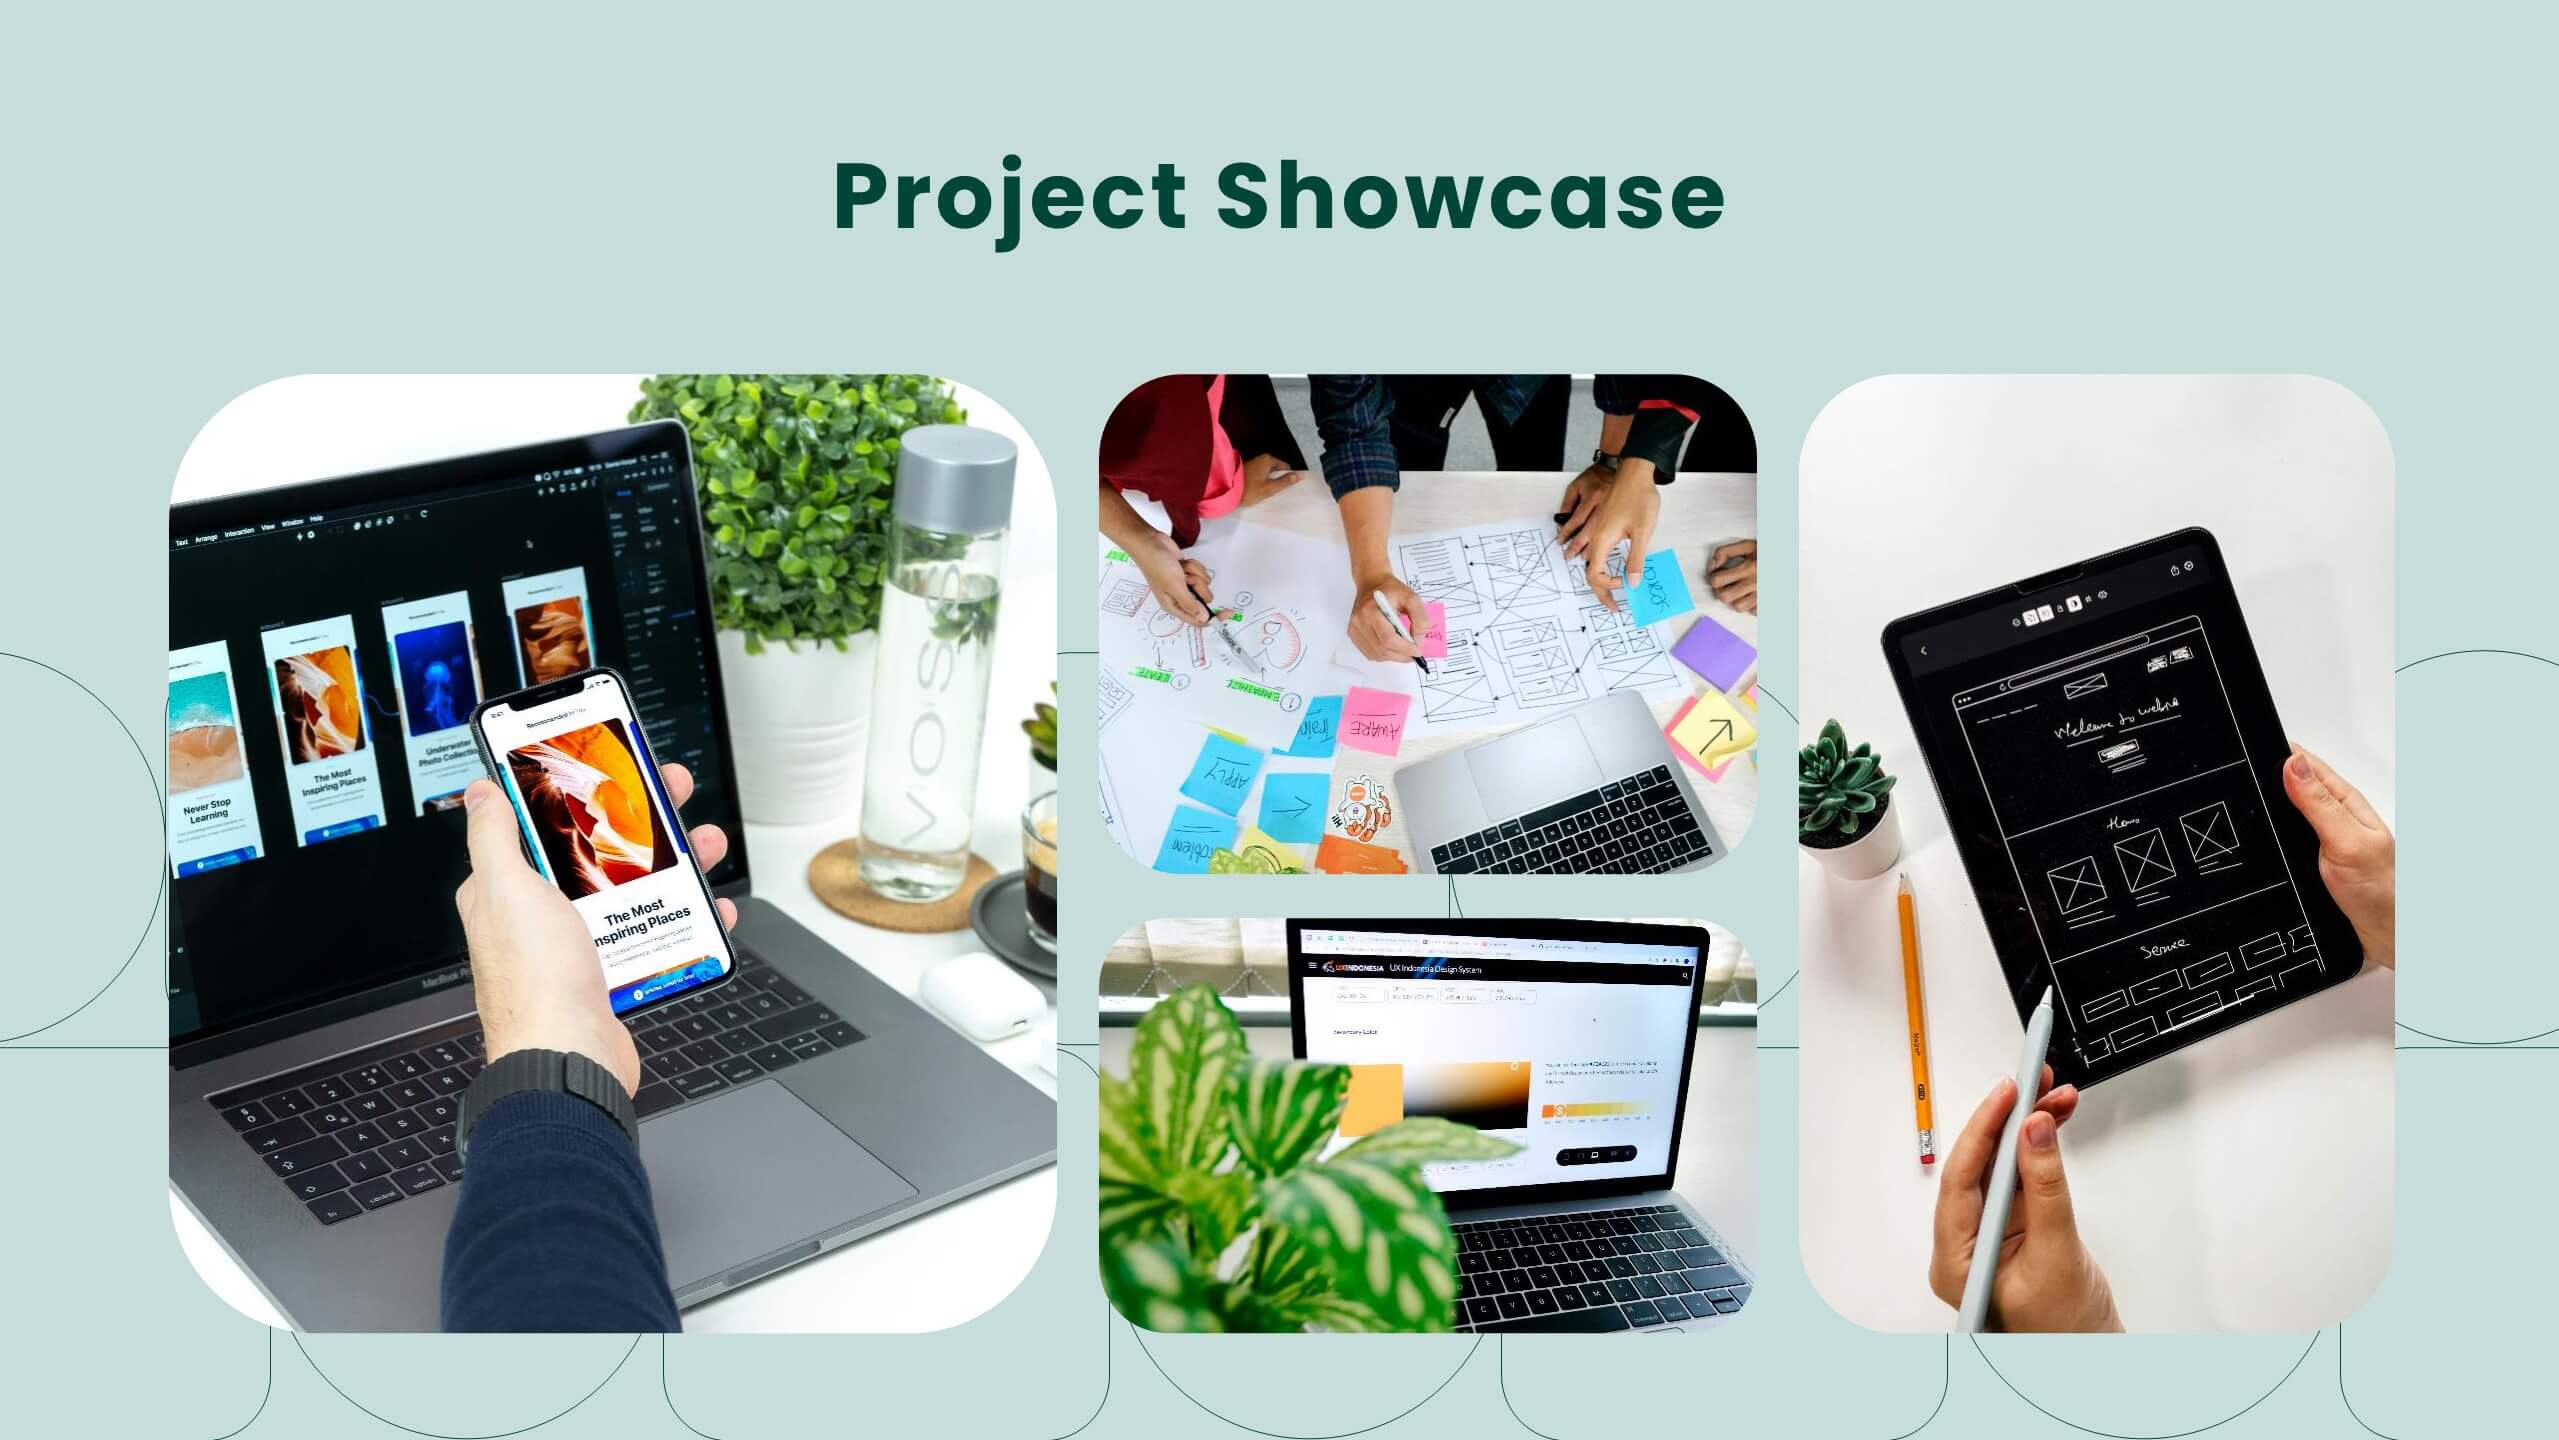
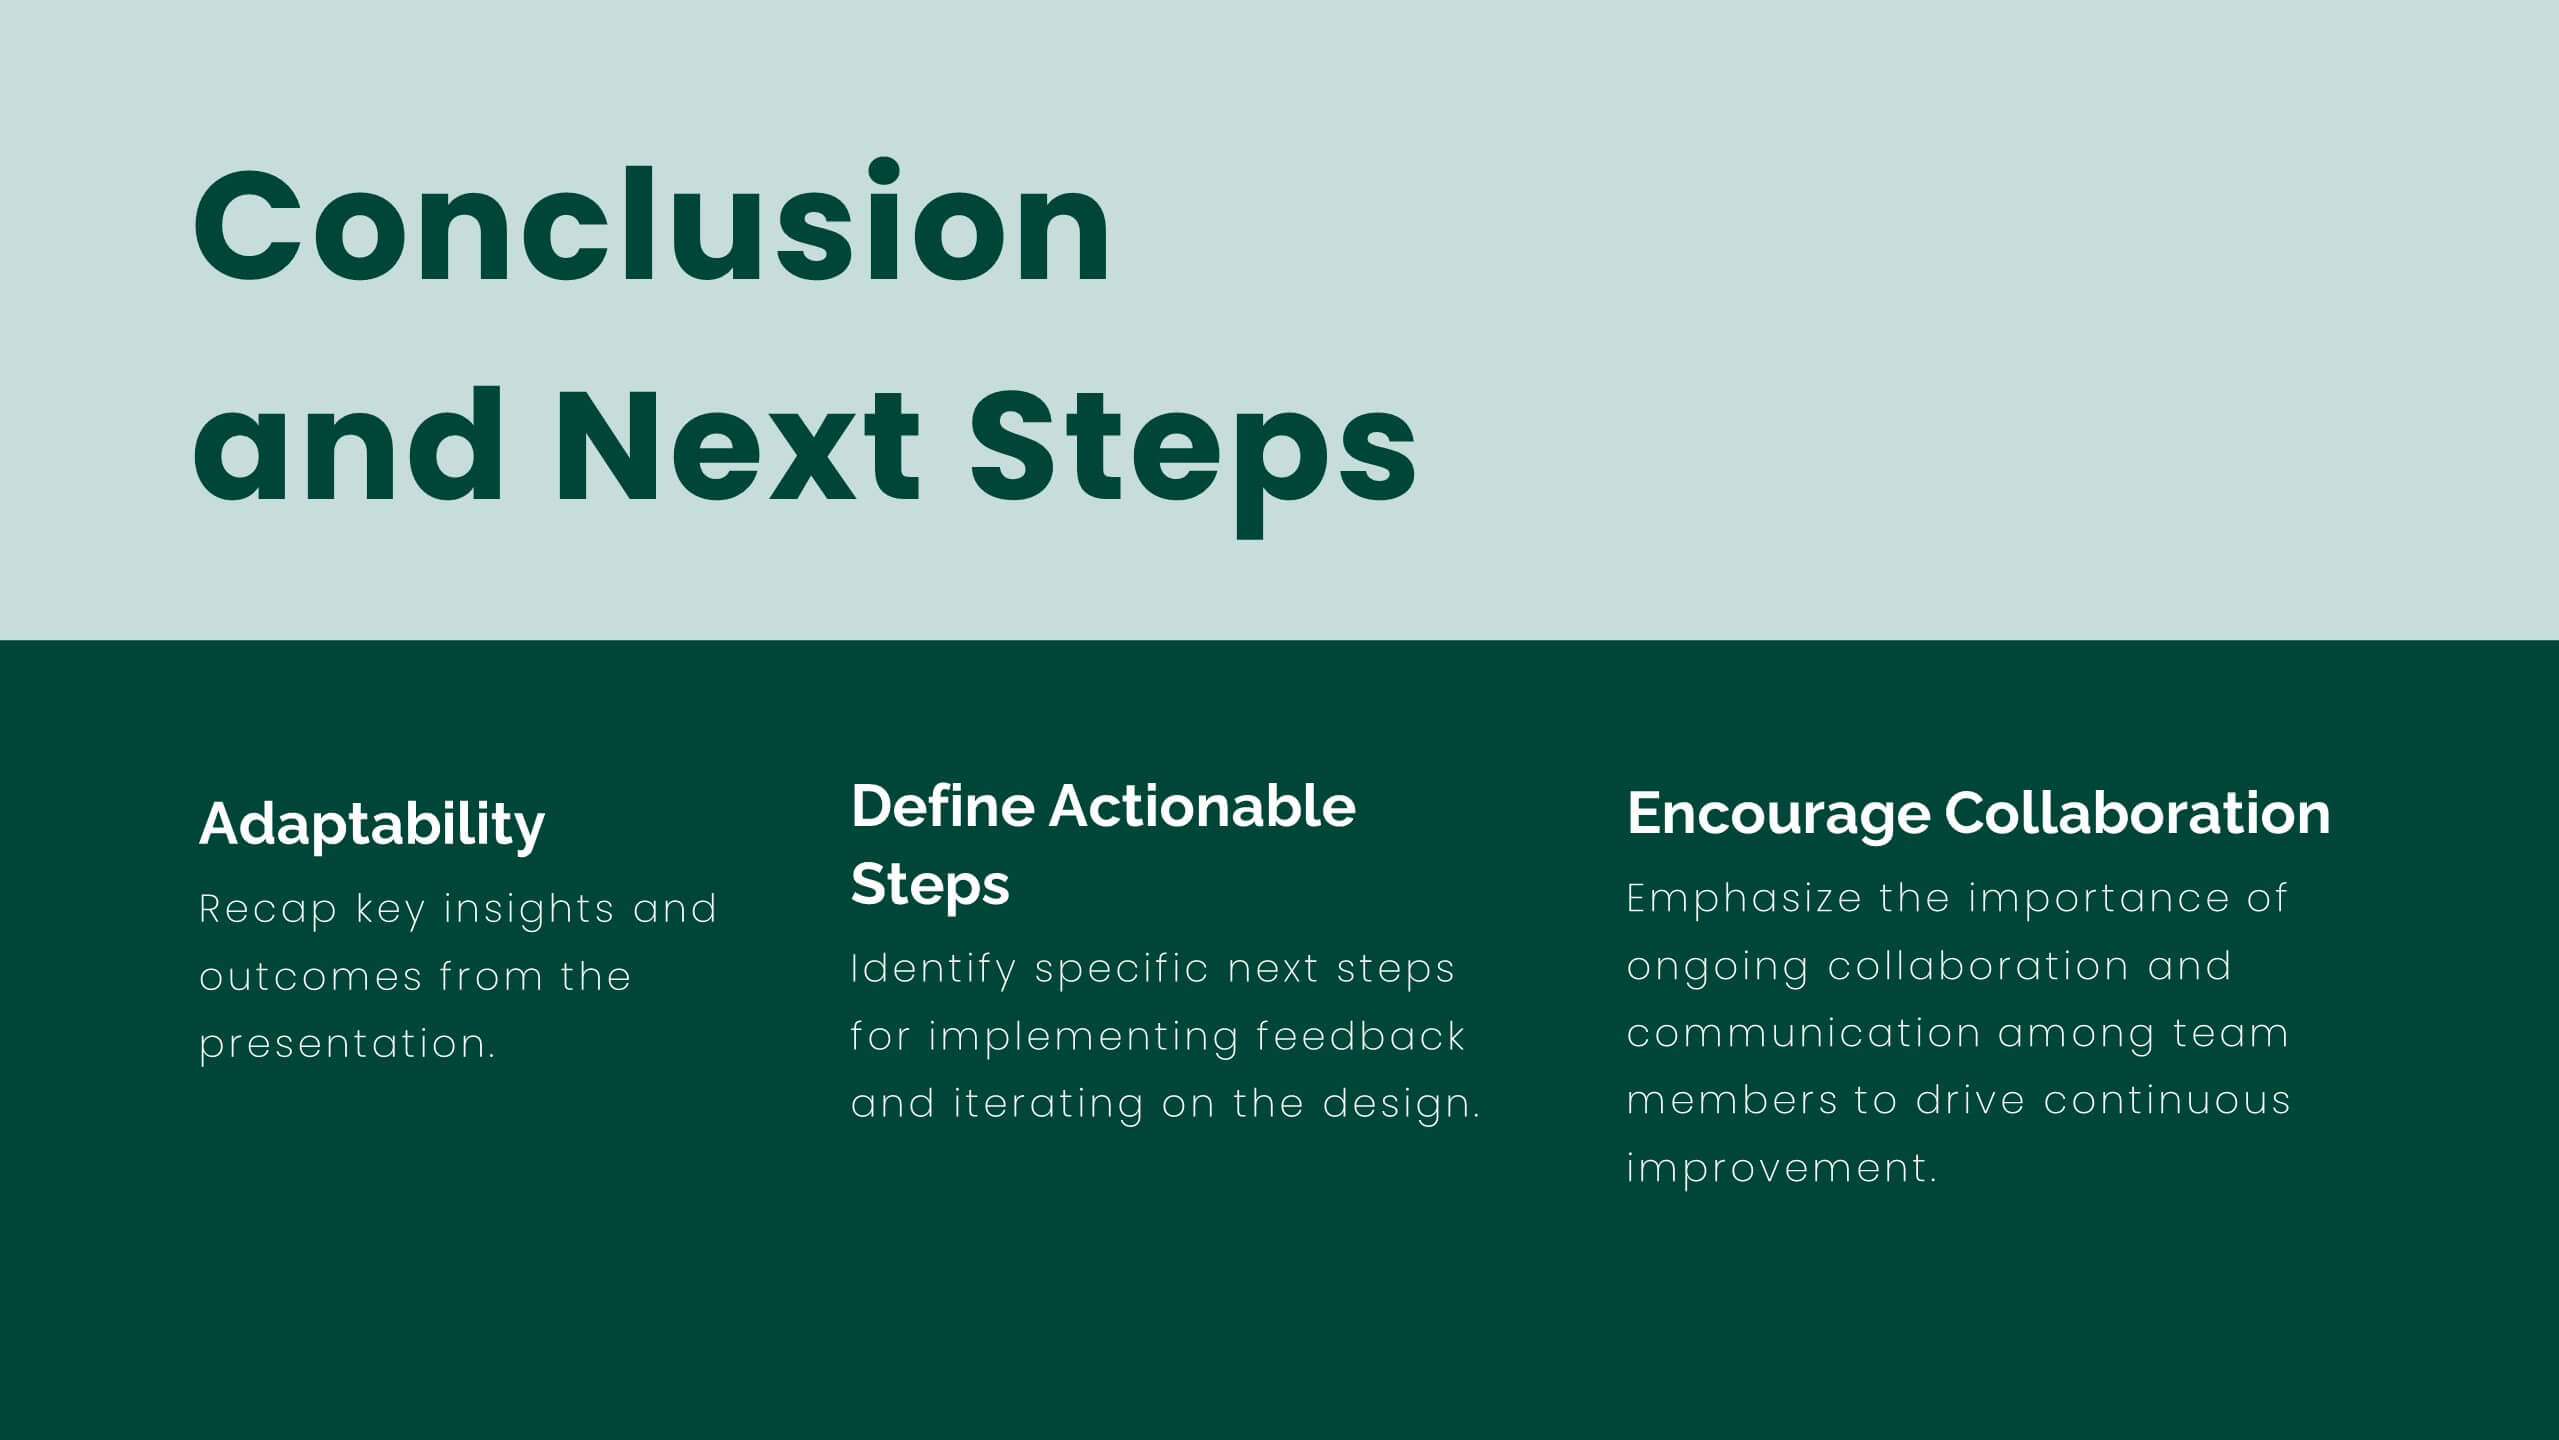
Lumina UX Case Study Presentation
Create compelling UX case studies with this modern template. Cover user research, personas, wireframes, and prototyping. Perfect for showcasing UI design principles, responsive design, and usability guidelines. Highlight feedback, iteration, and project showcase. Compatible with PowerPoint, Keynote, and Google Slides. Elevate your UX presentations and impress stakeholders with clear, detailed insights.


4 diapositivas
Defining Company Purpose Presentation
This template provides a visually engaging platform to articulate your organization's core values and mission. It features vibrant, clear sections for detailed insights, helping to communicate the foundational elements that drive business decisions and culture. Each slide is designed to support a cohesive narrative about your company's objectives and strategic direction, ensuring a professional presentation of your corporate ethos. This template is perfect for workshops, stakeholder meetings, or internal team alignments and is fully compatible with PowerPoint, Keynote, and Google Slides.


3 diapositivas
Persona Mapping for Target Audience Presentation
Get clear on who you're speaking to with this visual persona mapping slide. Ideal for marketing plans, customer research, or segmentation strategies, this layout helps you define and compare target audience types with clean icons and text space. Fully editable and works with PowerPoint, Keynote, and Google Slides.


5 diapositivas
Future Planning and Next Steps Strategy Presentation
Map out your goals with clarity using the Future Planning and Next Steps Strategy Presentation. This slide features a sleek four-step curved timeline with editable icons and labels, ideal for outlining strategic actions or project phases. Easily customize each stage to match your business objectives. Compatible with PowerPoint, Keynote, and Google Slides.


6 diapositivas
Leadership and Business Teamwork Presentation
Drive results through synergy with this dynamic Leadership and Business Teamwork presentation slide. Designed with a six-part segmented pie chart, this layout helps visualize collaborative frameworks, team roles, or leadership models in an engaging way. Ideal for team workshops, leadership development, or strategic planning meetings. Easy to personalize in PowerPoint, Keynote, or Google Slides.


6 diapositivas
Innovation-Driven Culture and Vision
Present your strategy with clarity using the Innovation-Driven Culture and Vision Presentation. This clean, modern layout features five vertical icon markers to highlight key pillars of innovation. Ideal for leadership talks or team strategy meetings. Fully customizable in PowerPoint, Keynote, and Google Slides for easy edits and branding.


2 diapositivas
Small Business Success Illustrations
Get your business on the right track with our small business success illustrations pack! These illustrations will help you with your next business presentation and make it more engaging and catchy. Fully compatible with Powerpoint, Keynote, and Google Slides. You can use these in your website, blog or social media posts. Turn your vision into a reality—download the small business success illustrations pack today!