


Características


¿Tienes alguna pregunta?
Recomendar


5 diapositivas
Marijuana Consumption Infographics
Marijuana, also known as cannabis or weed, is a psychoactive drug that comes from the Cannabis plant. This template offers a visually appealing and informative way to present facts, data, and insights related to marijuana consumption. Its customizable features, visually engaging elements, and modern design make it an effective tool for educational presentations, healthcare seminars, policy discussions, or any presentation related to marijuana use and its impact. This template includes a variety of slide layouts specifically designed to present different aspects of marijuana consumption. It is compatible with PowerPoint, Keynote, and Google Slides.


4 diapositivas
Turning Ideas into Impact Presentation
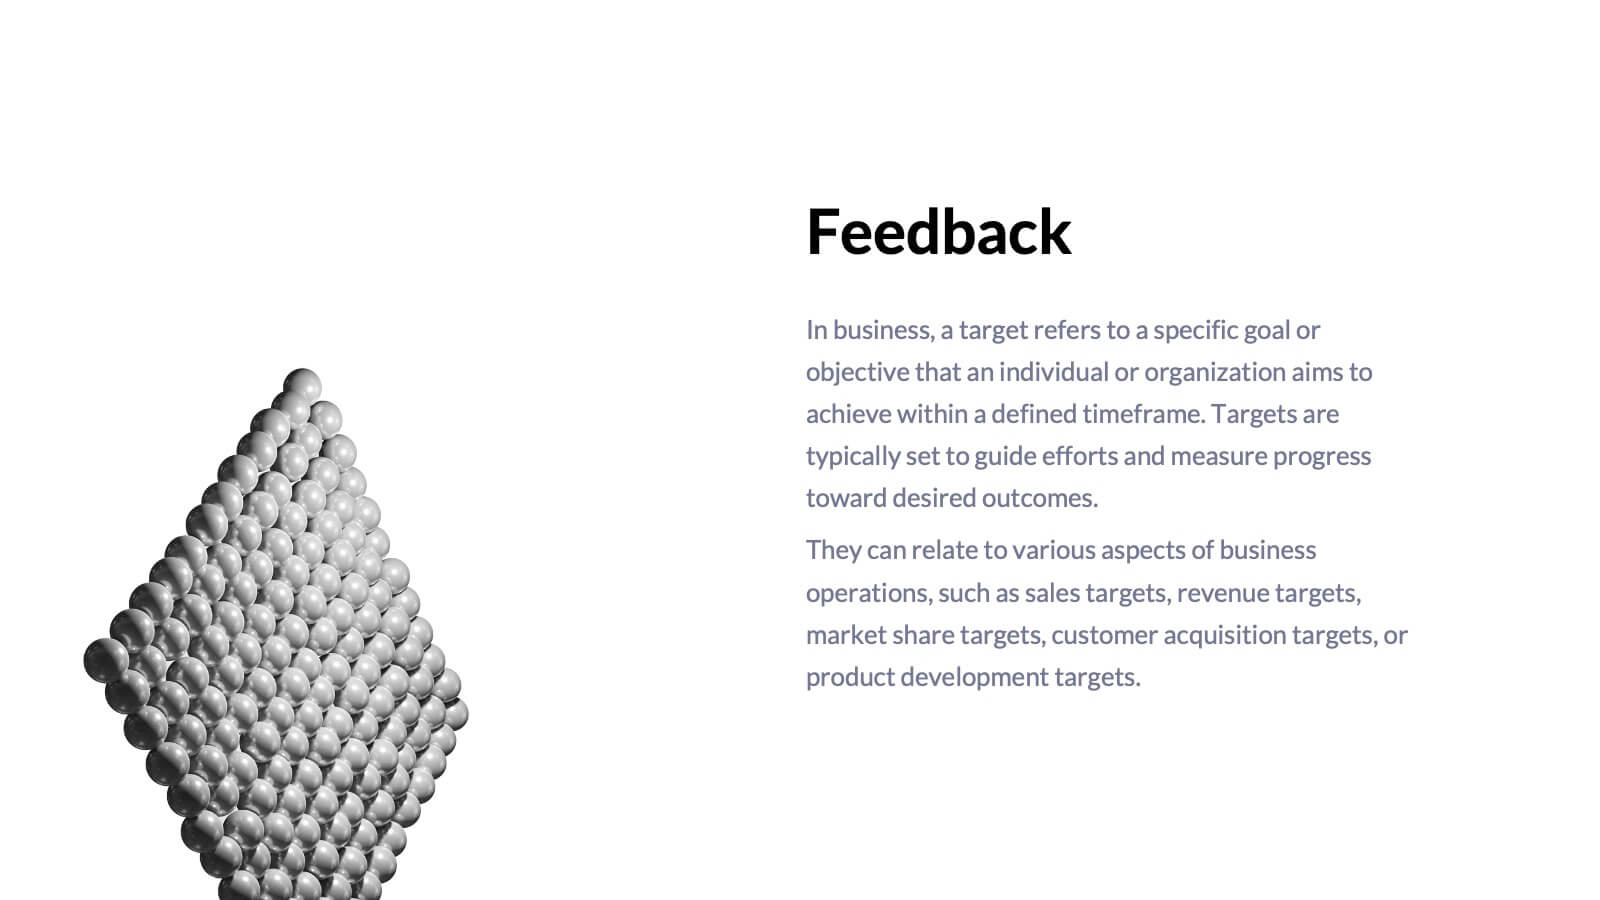
Showcase your transformation journey from concept to achievement with this bold visual layout. The three-step diagram—idea, action, success—makes it ideal for project planning, product development, or strategic execution. Easily editable in PowerPoint, Keynote, and Google Slides for pitch decks, business roadmaps, or innovation workflows. Clean, modern, and impactful.


5 diapositivas
Overlapping Venn Chart Presentation
Bring ideas together with a bold visual that highlights how multiple concepts overlap to form stronger insights. This presentation makes comparison and connection effortless using smooth layered shapes and clear labels. Fully editable and compatible with PowerPoint, Keynote, and Google Slides.


5 diapositivas
Relationship Mapping Diagram Presentation
Bring clarity to complex connections with this clean and modern visual layout designed to map relationships, processes, or ideas effortlessly. Perfect for presentations that require structure and flow, it balances simplicity with professionalism. Fully customizable and compatible with PowerPoint, Keynote, and Google Slides for seamless design flexibility.
6 diapositivas
Arrow Mapping for Growth Journey
Showcase progress and strategic development using the Arrow Mapping for Growth Journey Presentation. This vibrant arrow-style roadmap is designed to highlight five key stages—perfect for illustrating phases of growth, milestones, or business transformations. Use it to map out project timelines, organizational development, or customer onboarding flows. Fully editable in PowerPoint, Keynote, and Google Slides, it’s ideal for business strategists, consultants, and marketing teams.


4 diapositivas
Mirror Data Distribution Butterfly Format Presentation
Present side-by-side comparisons with clarity using the Mirror Data Distribution Butterfly Format Presentation. This layout helps visualize balanced data sets, performance comparisons, or goal vs. outcome metrics with mirrored bars and intuitive icons. Fully customizable in Canva, PowerPoint, Google Slides, and Keynote to match your brand's aesthetic and message.


5 diapositivas
Data Density Visualization via Heat Mapping Presentation
Turn complex datasets into clear insights with the Data Density Visualization via Heat Mapping Presentation. This layered area chart template is perfect for showcasing data intensity over time—ideal for monthly trends, usage spikes, or multi-variable performance analysis. Fully customizable in Canva, PowerPoint, Keynote, and Google Slides.


10 diapositivas
Financial Money Management Strategies Presentation
Break down your key financial strategies with this clear, wheel-style diagram. Perfect for outlining budgeting principles, savings goals, or investment methods, each segment includes space for titles and concise text. Ideal for financial advisors, consultants, or internal team planning. Fully customizable in PowerPoint, Keynote, and Google Slides.


7 diapositivas
Environmental Planning Infographic Presentation
Environmental infographics are an essential tool in raising awareness about the state of the environment and the impact of human activities on the planet. This template presents a broad range of data text on the environment for you to input. Use this eye-catching infographic design to educate and raise awareness about the environment. This template is ideal to give an overview of the topic, its importance and the main issues. Stay on track using facts and figures, good visuals and data visualizations. This presentation is easy to use and can be edited in Powerpoint, Keynote or Google Slides.


4 diapositivas
Sales Funnel Data Presentation
Turn your data into a clear story with a visual flow that shows exactly how leads move from one stage to the next. This presentation helps explain conversion steps, highlight drop-off points, and simplify complex marketing insights. It’s easy to customize and fully compatible with PowerPoint, Keynote, and Google Slides.


5 diapositivas
Innovation with Design Thinking Framework
Boost creativity and problem-solving with the Innovation with Design Thinking Framework Presentation. This slide features a vertically stacked rocket diagram symbolizing the five key phases of design thinking—perfect for illustrating iterative innovation processes. Each level includes editable text and icons, helping you align stakeholders around empathy, ideation, and prototyping. Ideal for workshops, innovation teams, educators, or product development presentations. Fully customizable in PowerPoint, Keynote, and Google Slides.


5 diapositivas
Operational Workflow Process Chart Presentation
Streamline your operations with the Operational Workflow Process Chart Presentation. This template provides a clear visual layout to map out step-by-step processes, helping teams align on roles, timelines, and dependencies. Perfect for training, reporting, or system audits—fully customizable in PowerPoint, Canva, and Google Slides.


6 diapositivas
Four Pillar of Success Presentation
Build a strong foundation for your ideas with this elegant and structured infographic layout. Perfect for presenting key principles, business strategies, or organizational goals, it balances clarity and design beautifully. Fully customizable and compatible with PowerPoint, Keynote, and Google Slides for seamless editing and professional presentations.


21 diapositivas
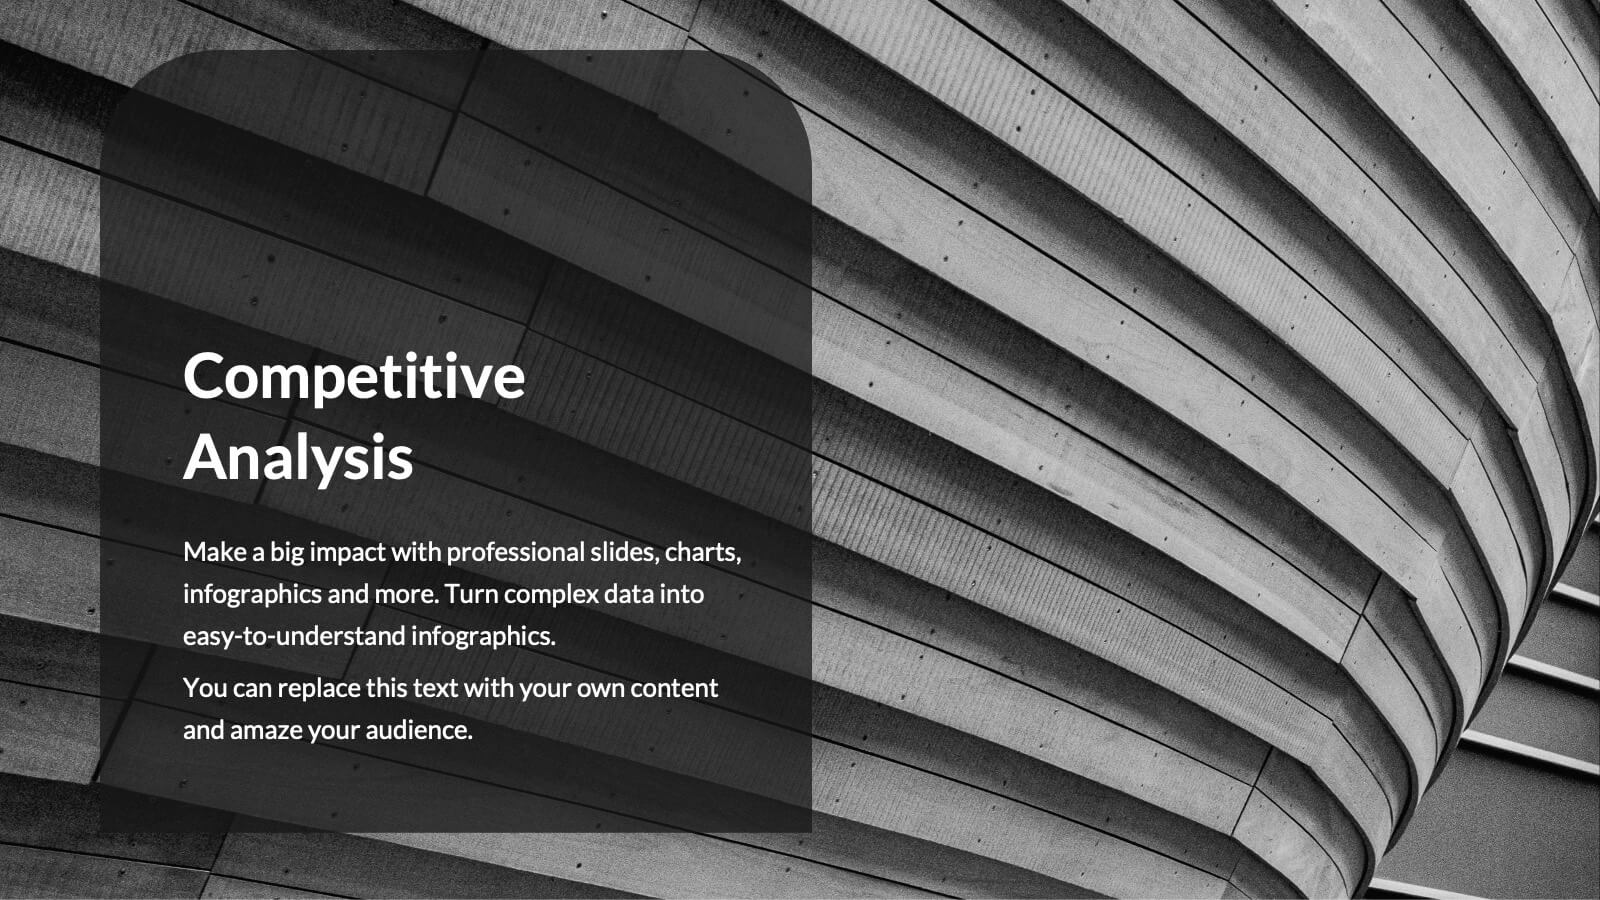
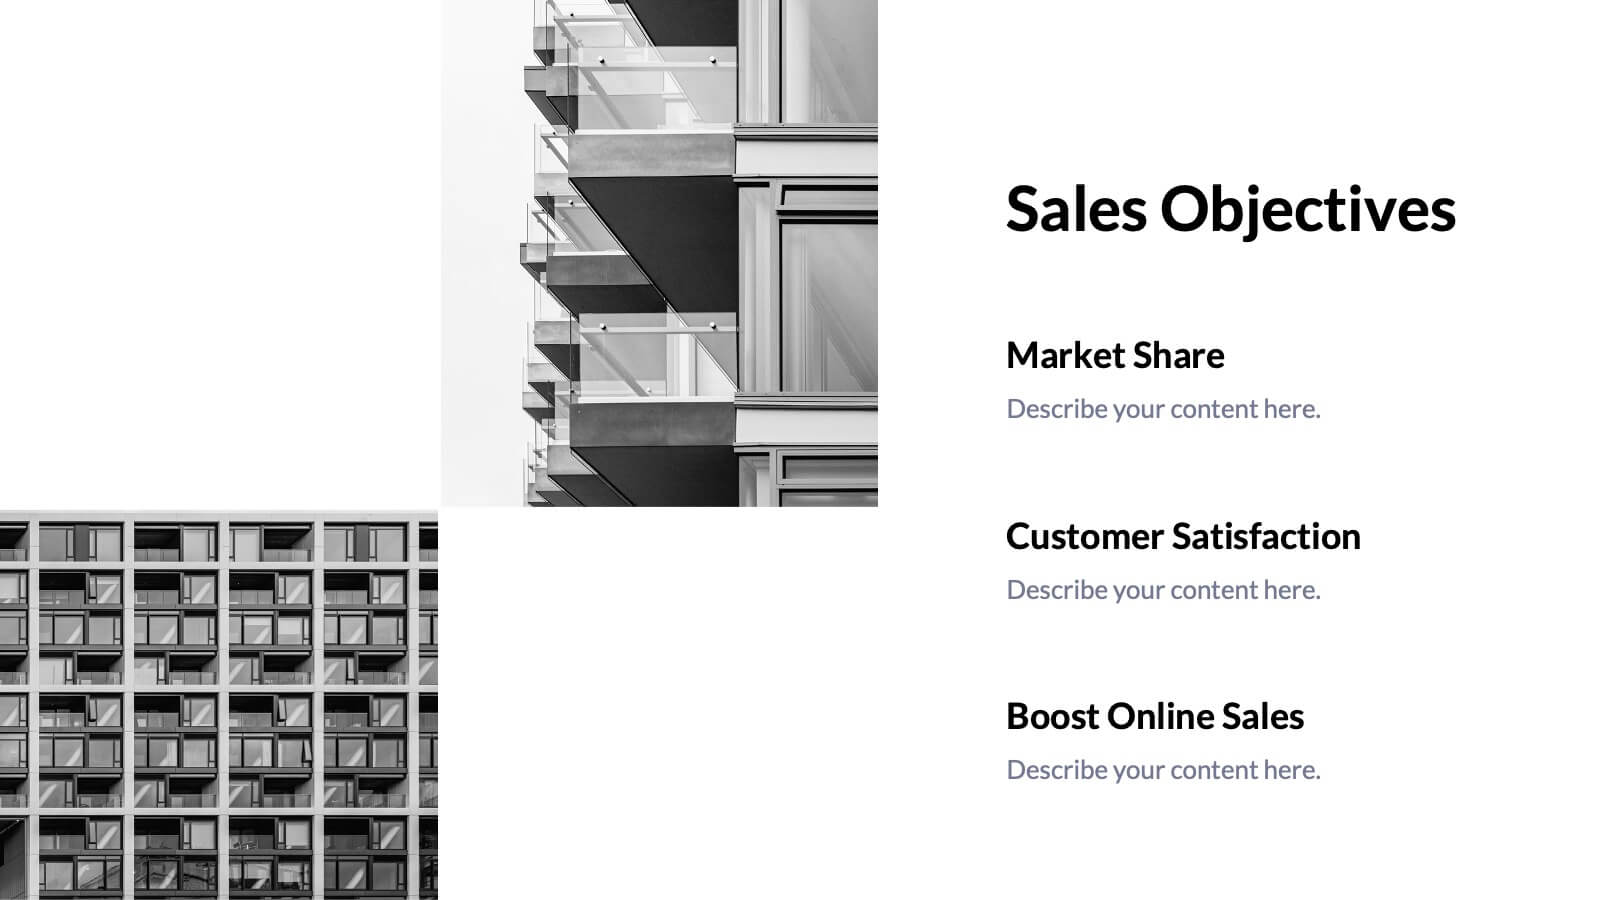
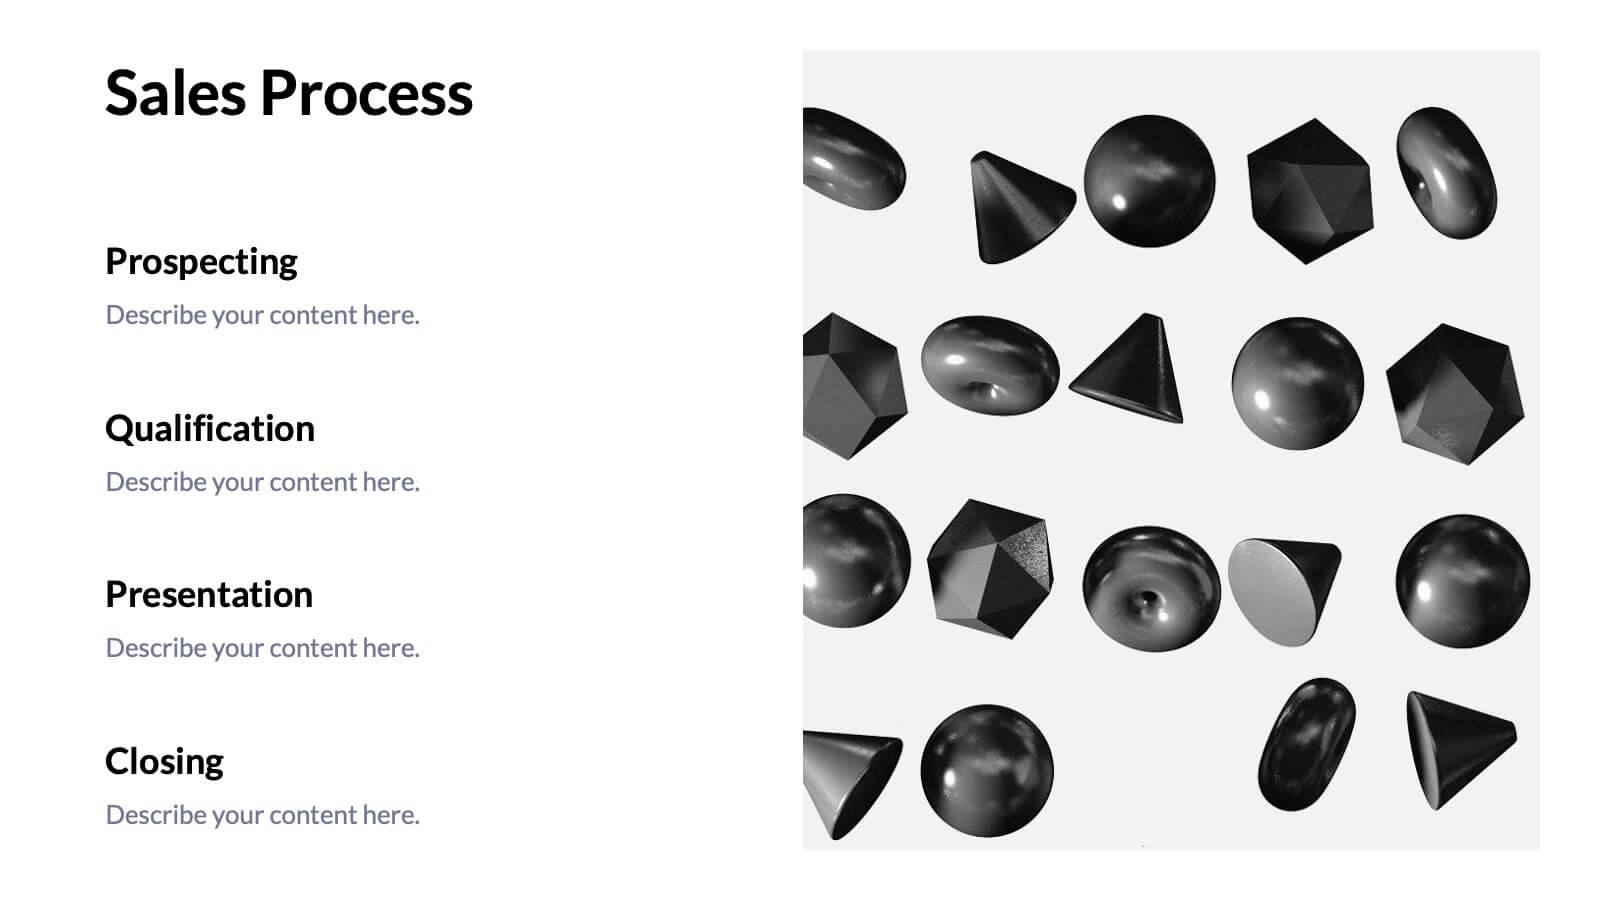
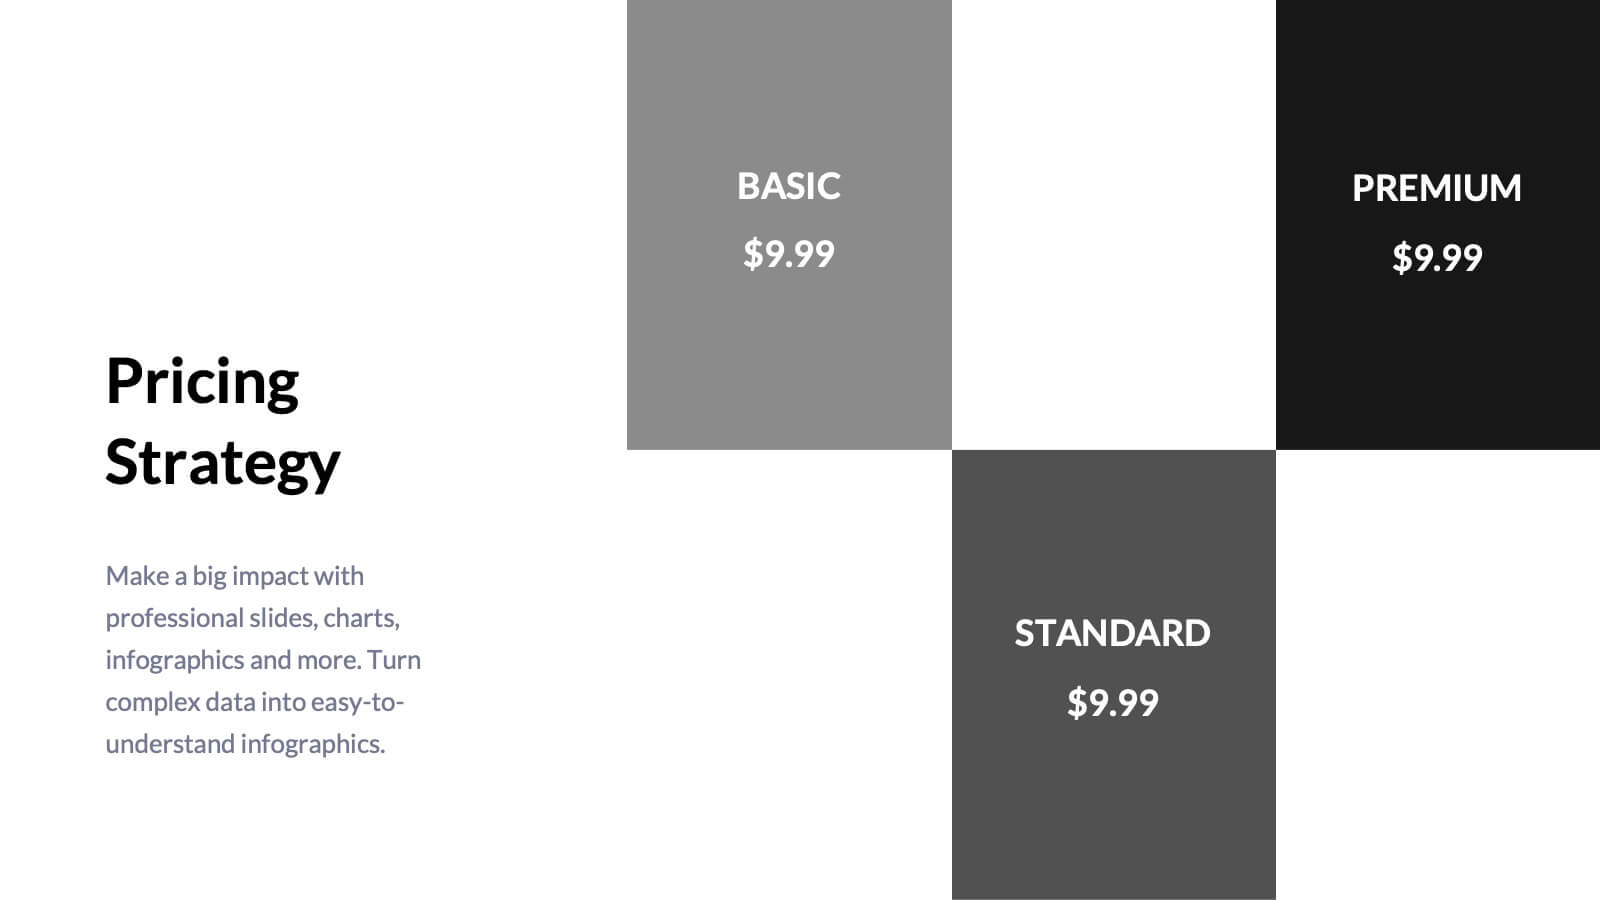
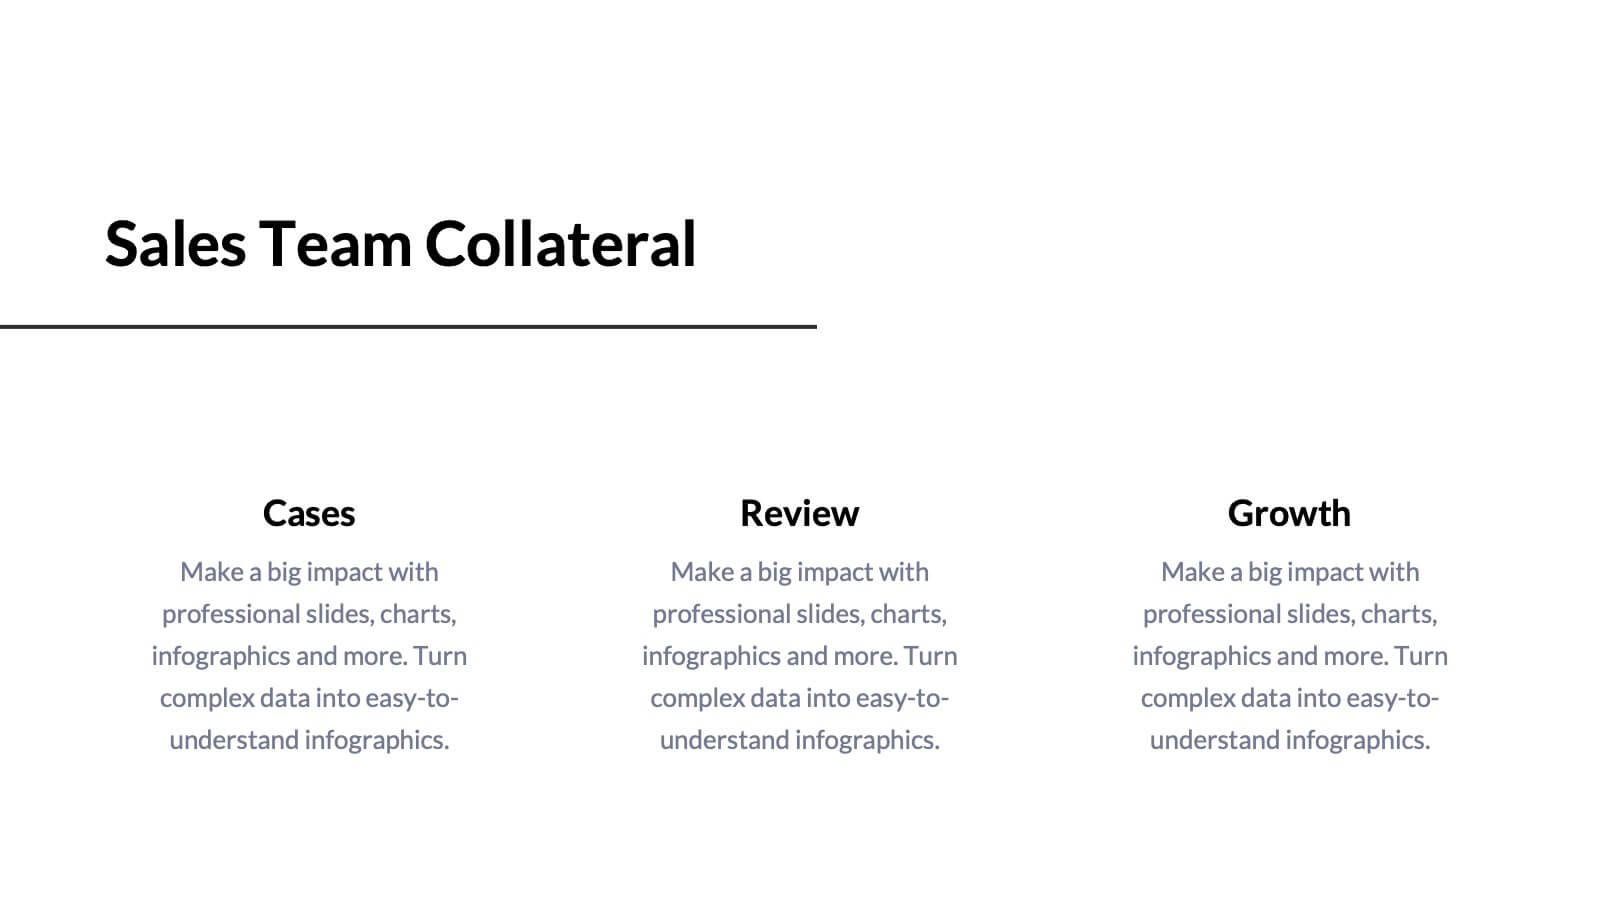
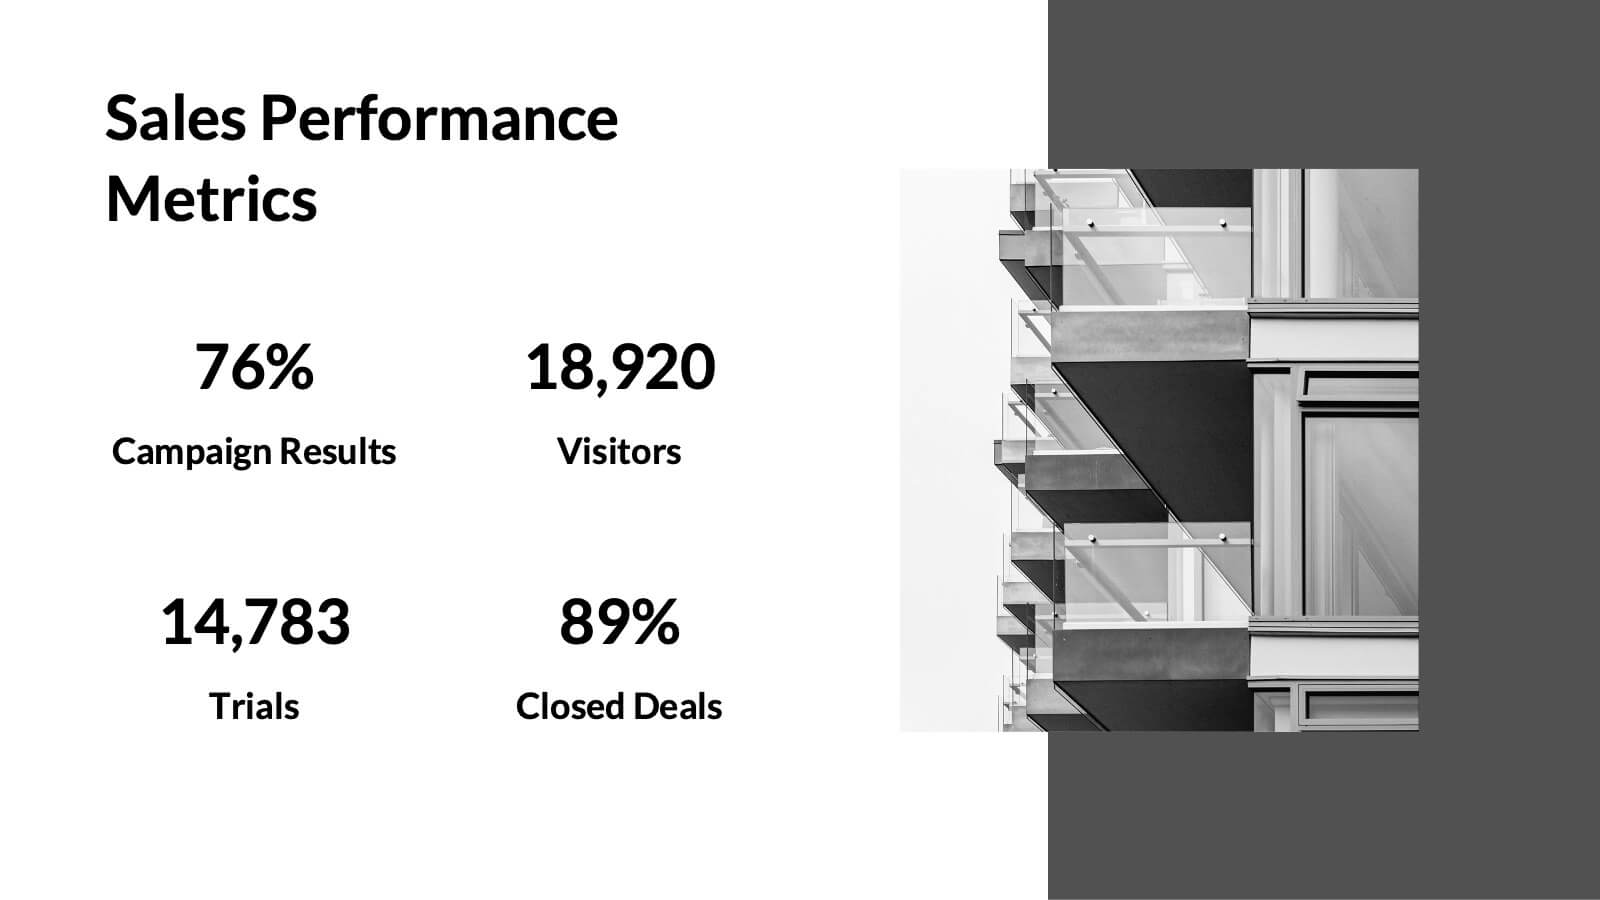
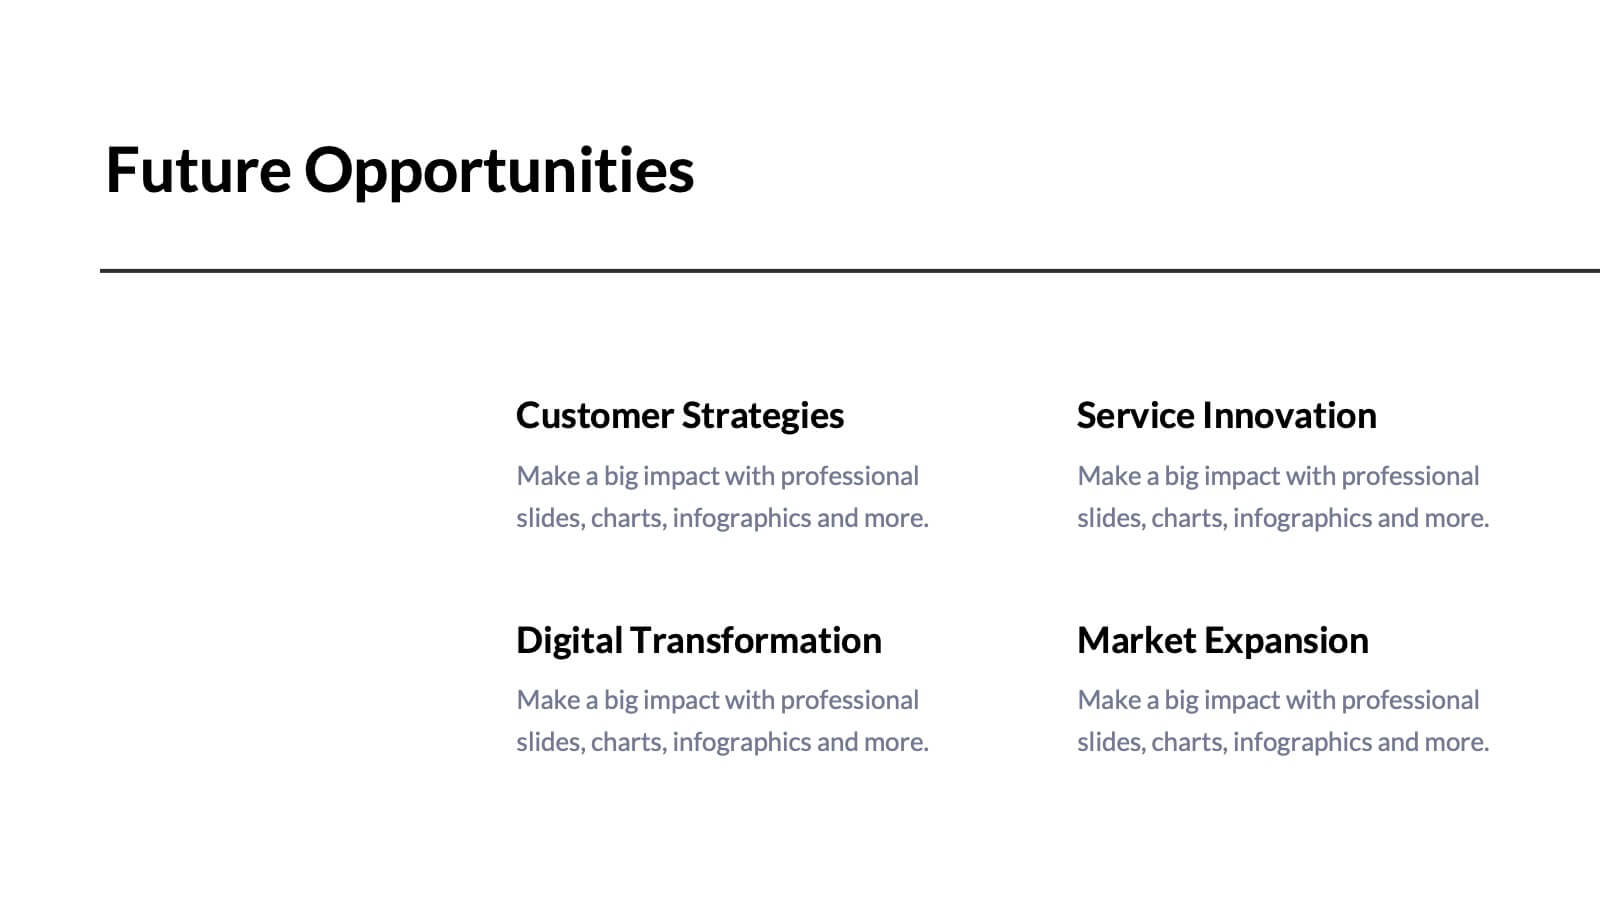
Tempest Sales Performance Report Presentation
Supercharge your sales presentations with this sleek, professional template. Perfect for outlining sales objectives, processes, and performance metrics, it features a clean, minimalist design that enhances clarity and impact. Highlight key elements like competitive analysis, pricing strategy, and future opportunities to captivate your audience. Compatible with PowerPoint, Keynote, and Google Slides, it ensures seamless presentations on any platform.


7 diapositivas
Communication Infographic Presentation Template
Communication Infographics are a more professional way of presenting facts and a great way to share your marketing strategy and goals with your team. Our template includes a variety of infographic elements, including bullet points, call to actions and persuasive slogans. This template design is ideal for presentations on subjects such as content marketing, sales, social media strategy, and many more. Our Communication Template includes graphic illustrations, slides and text boxes for your topics. In this template you can easily add your own text and images to create a meaningful presentation.


21 diapositivas
Sapphire Graphic Design Project Plan Presentation
Make your next project plan sparkle with this sleek, sapphire-inspired presentation design! This template is perfect for showcasing your graphic design project, helping you organize key milestones, timelines, and objectives. With its modern layout and clean aesthetics, your ideas will stand out beautifully. Compatible with PowerPoint, Keynote, and Google Slides.


6 diapositivas
Efficient Workflow Management
Highlight process optimization, task delegation, or team productivity strategies using this linear gear-style workflow design. Perfect for operations leaders, project managers, or consultants presenting step-by-step plans. Fully customizable in PowerPoint, Keynote, and Google Slides—edit icons, text, and colors to fit your message.