


Características


¿Tienes alguna pregunta?
Recomendar


5 diapositivas
Customer Satisfaction Survey Ratings Presentation
Present customer insights with clarity using this Customer Satisfaction Survey Ratings slide. Designed with a vertical timeline beside a thumbs-up icon, it’s perfect for showcasing key survey data, feedback percentages, or sentiment trends. Each rating step includes editable text and color-coded markers for easy comparison. Compatible with PowerPoint, Canva, and Google Slides.


5 diapositivas
Economic Analysis of Europe Map Presentation
Visualize key economic indicators across European regions with this impactful map-based presentation. Use shaded country highlights and accompanying bar charts to present comparative data, performance trends, and regional growth. Ideal for economic reports, investor updates, or strategic planning. Fully editable and works seamlessly with PowerPoint, Keynote, and Google Slides.
21 diapositivas
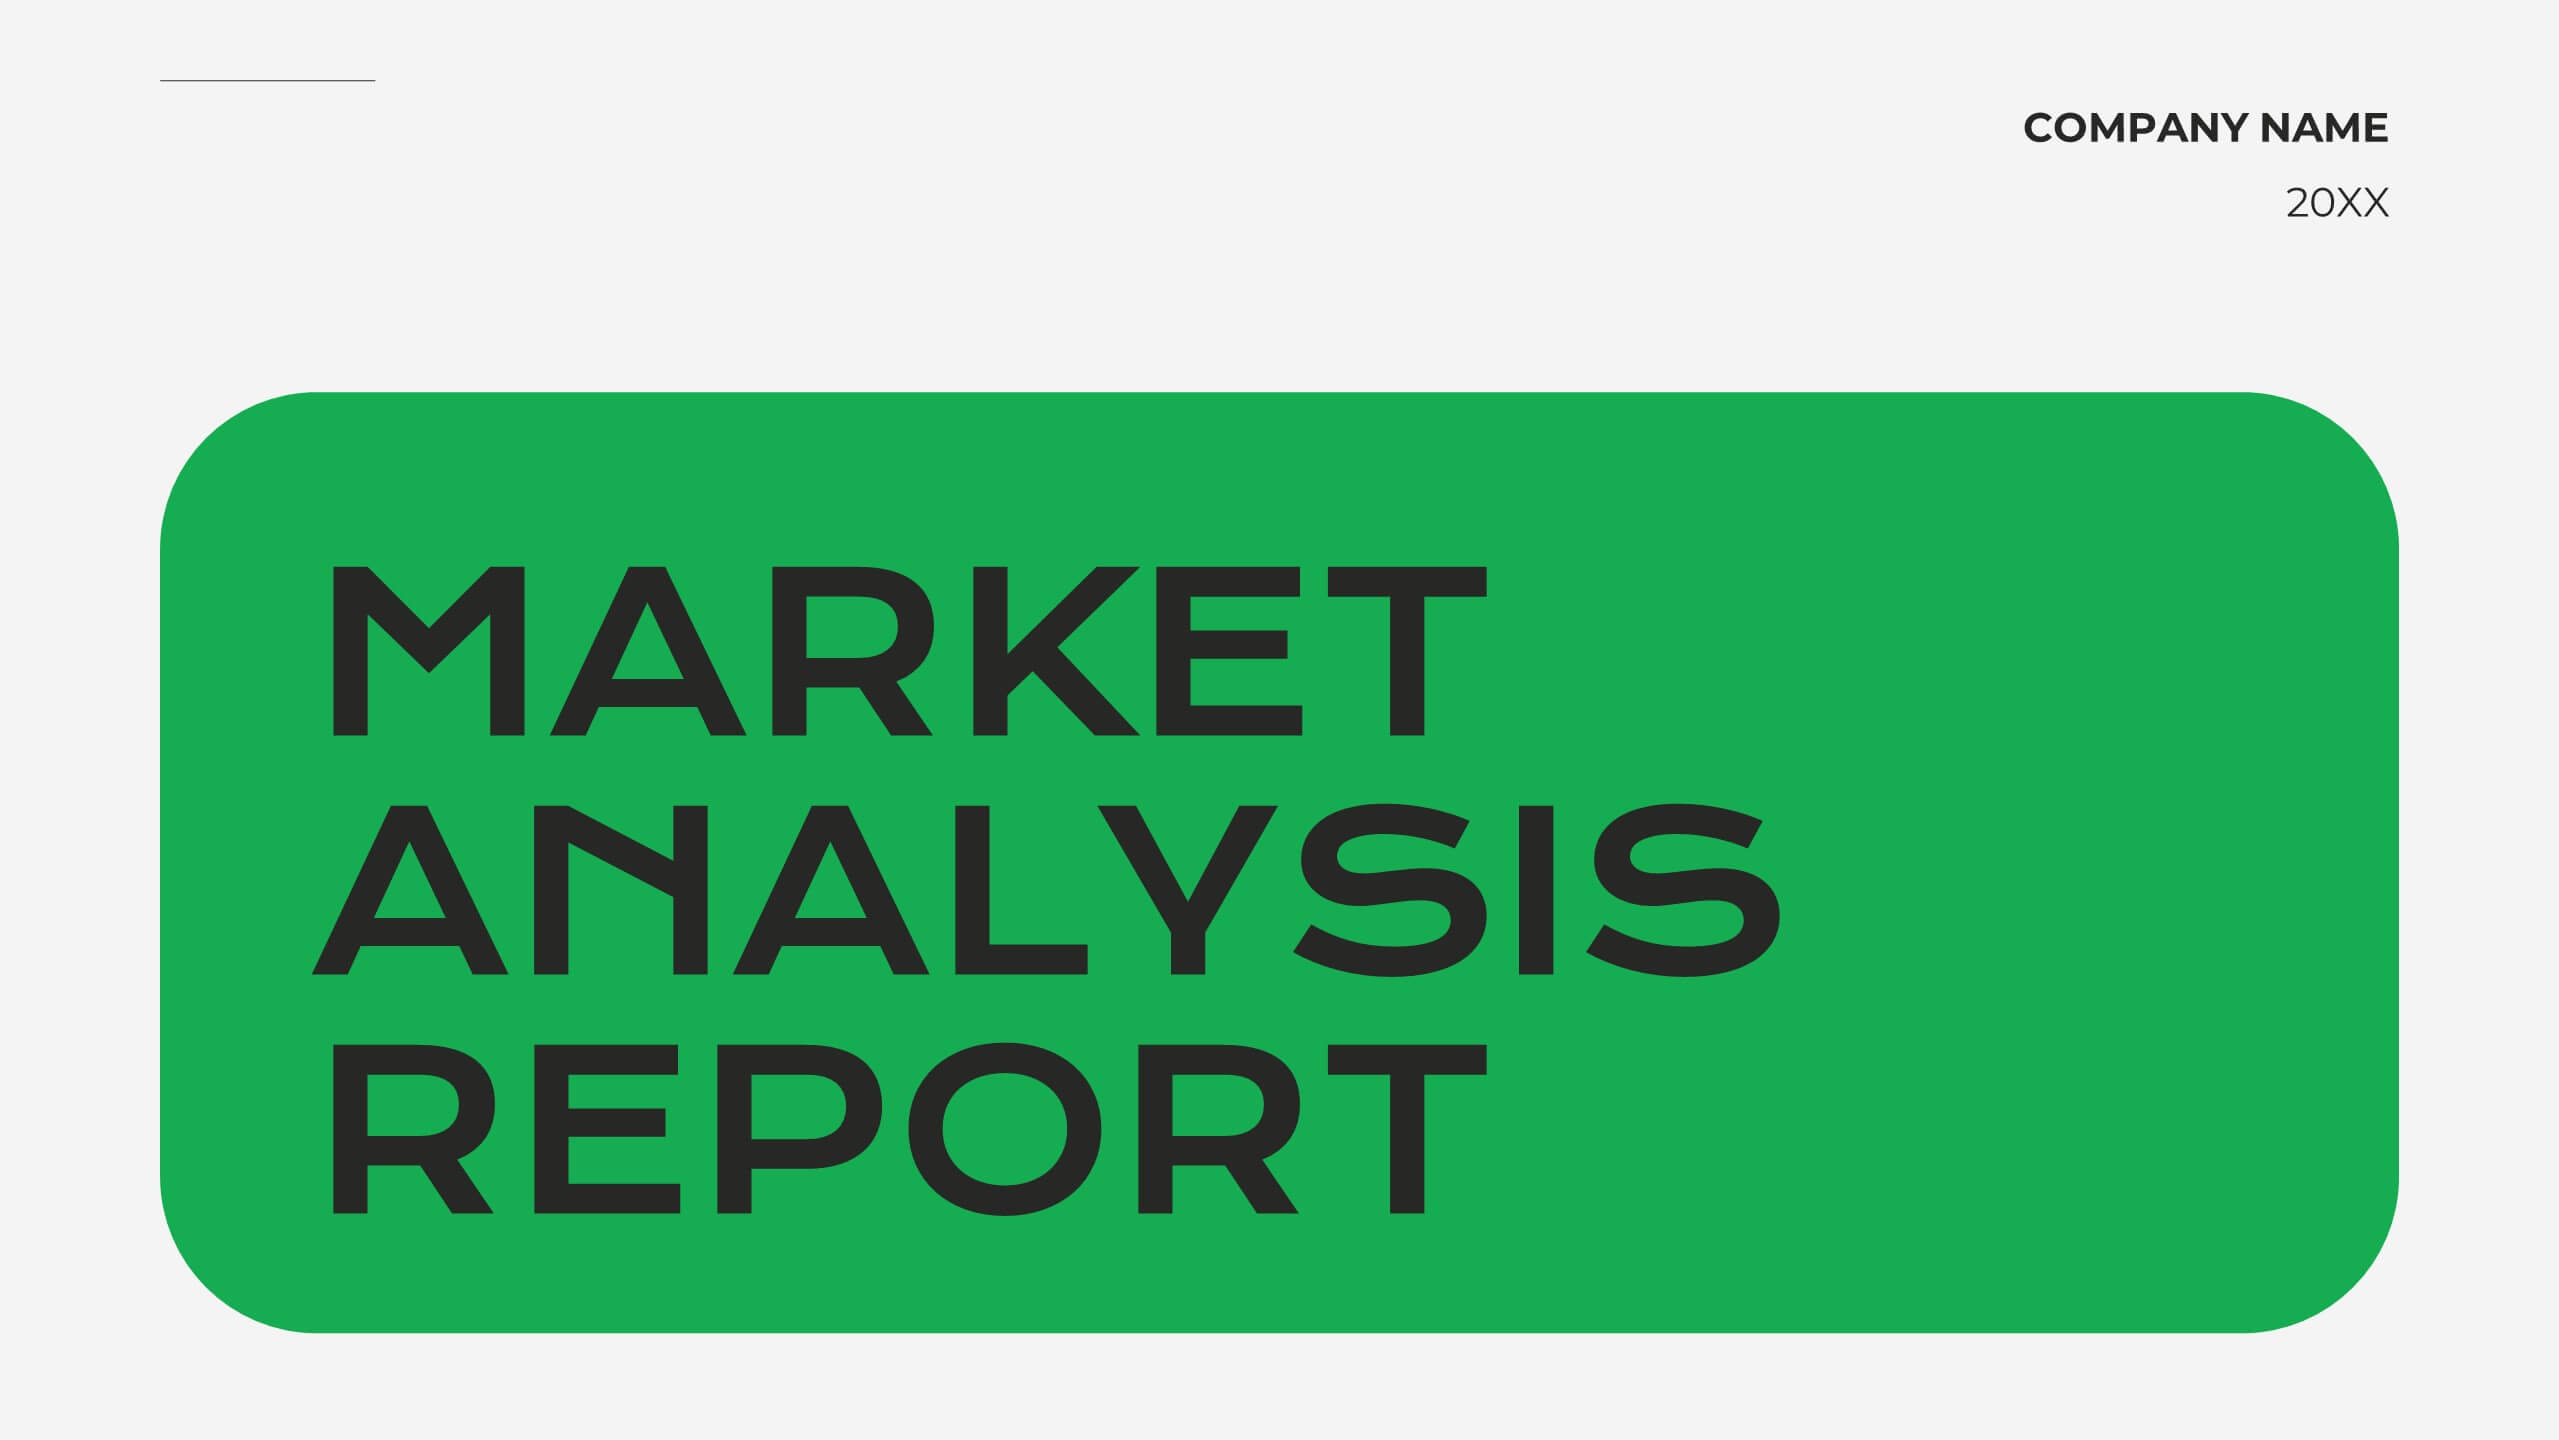
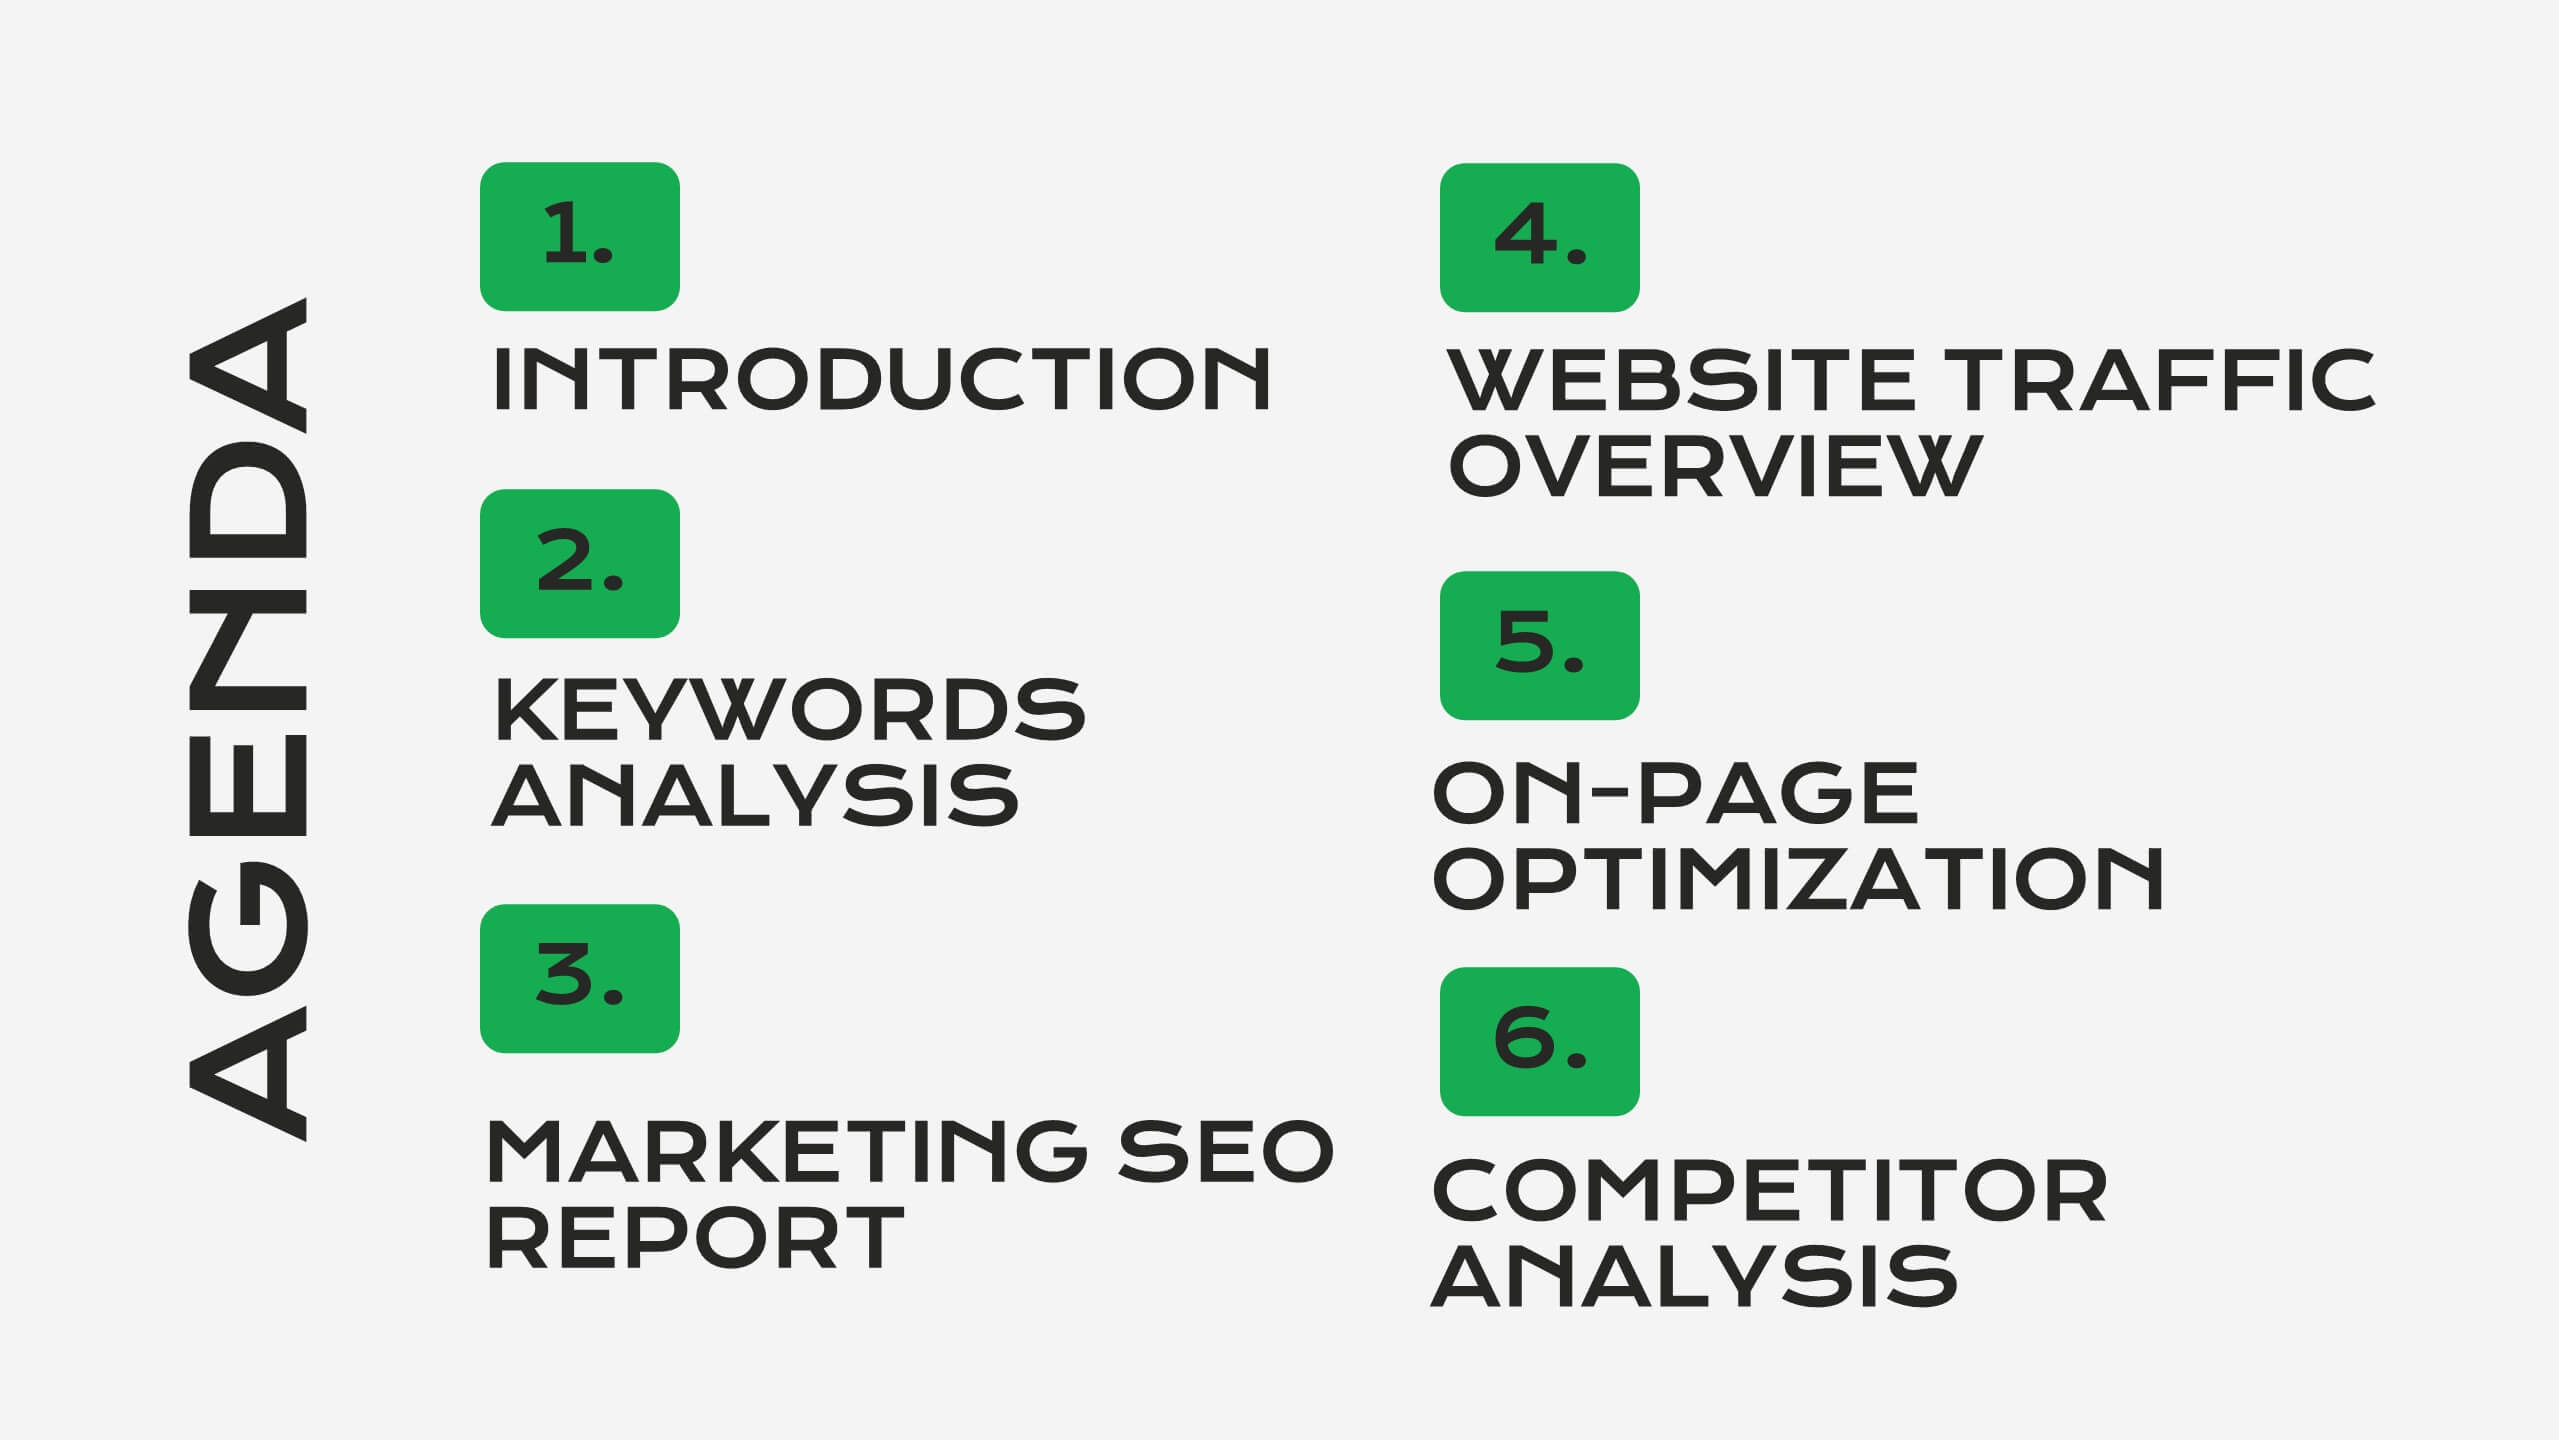
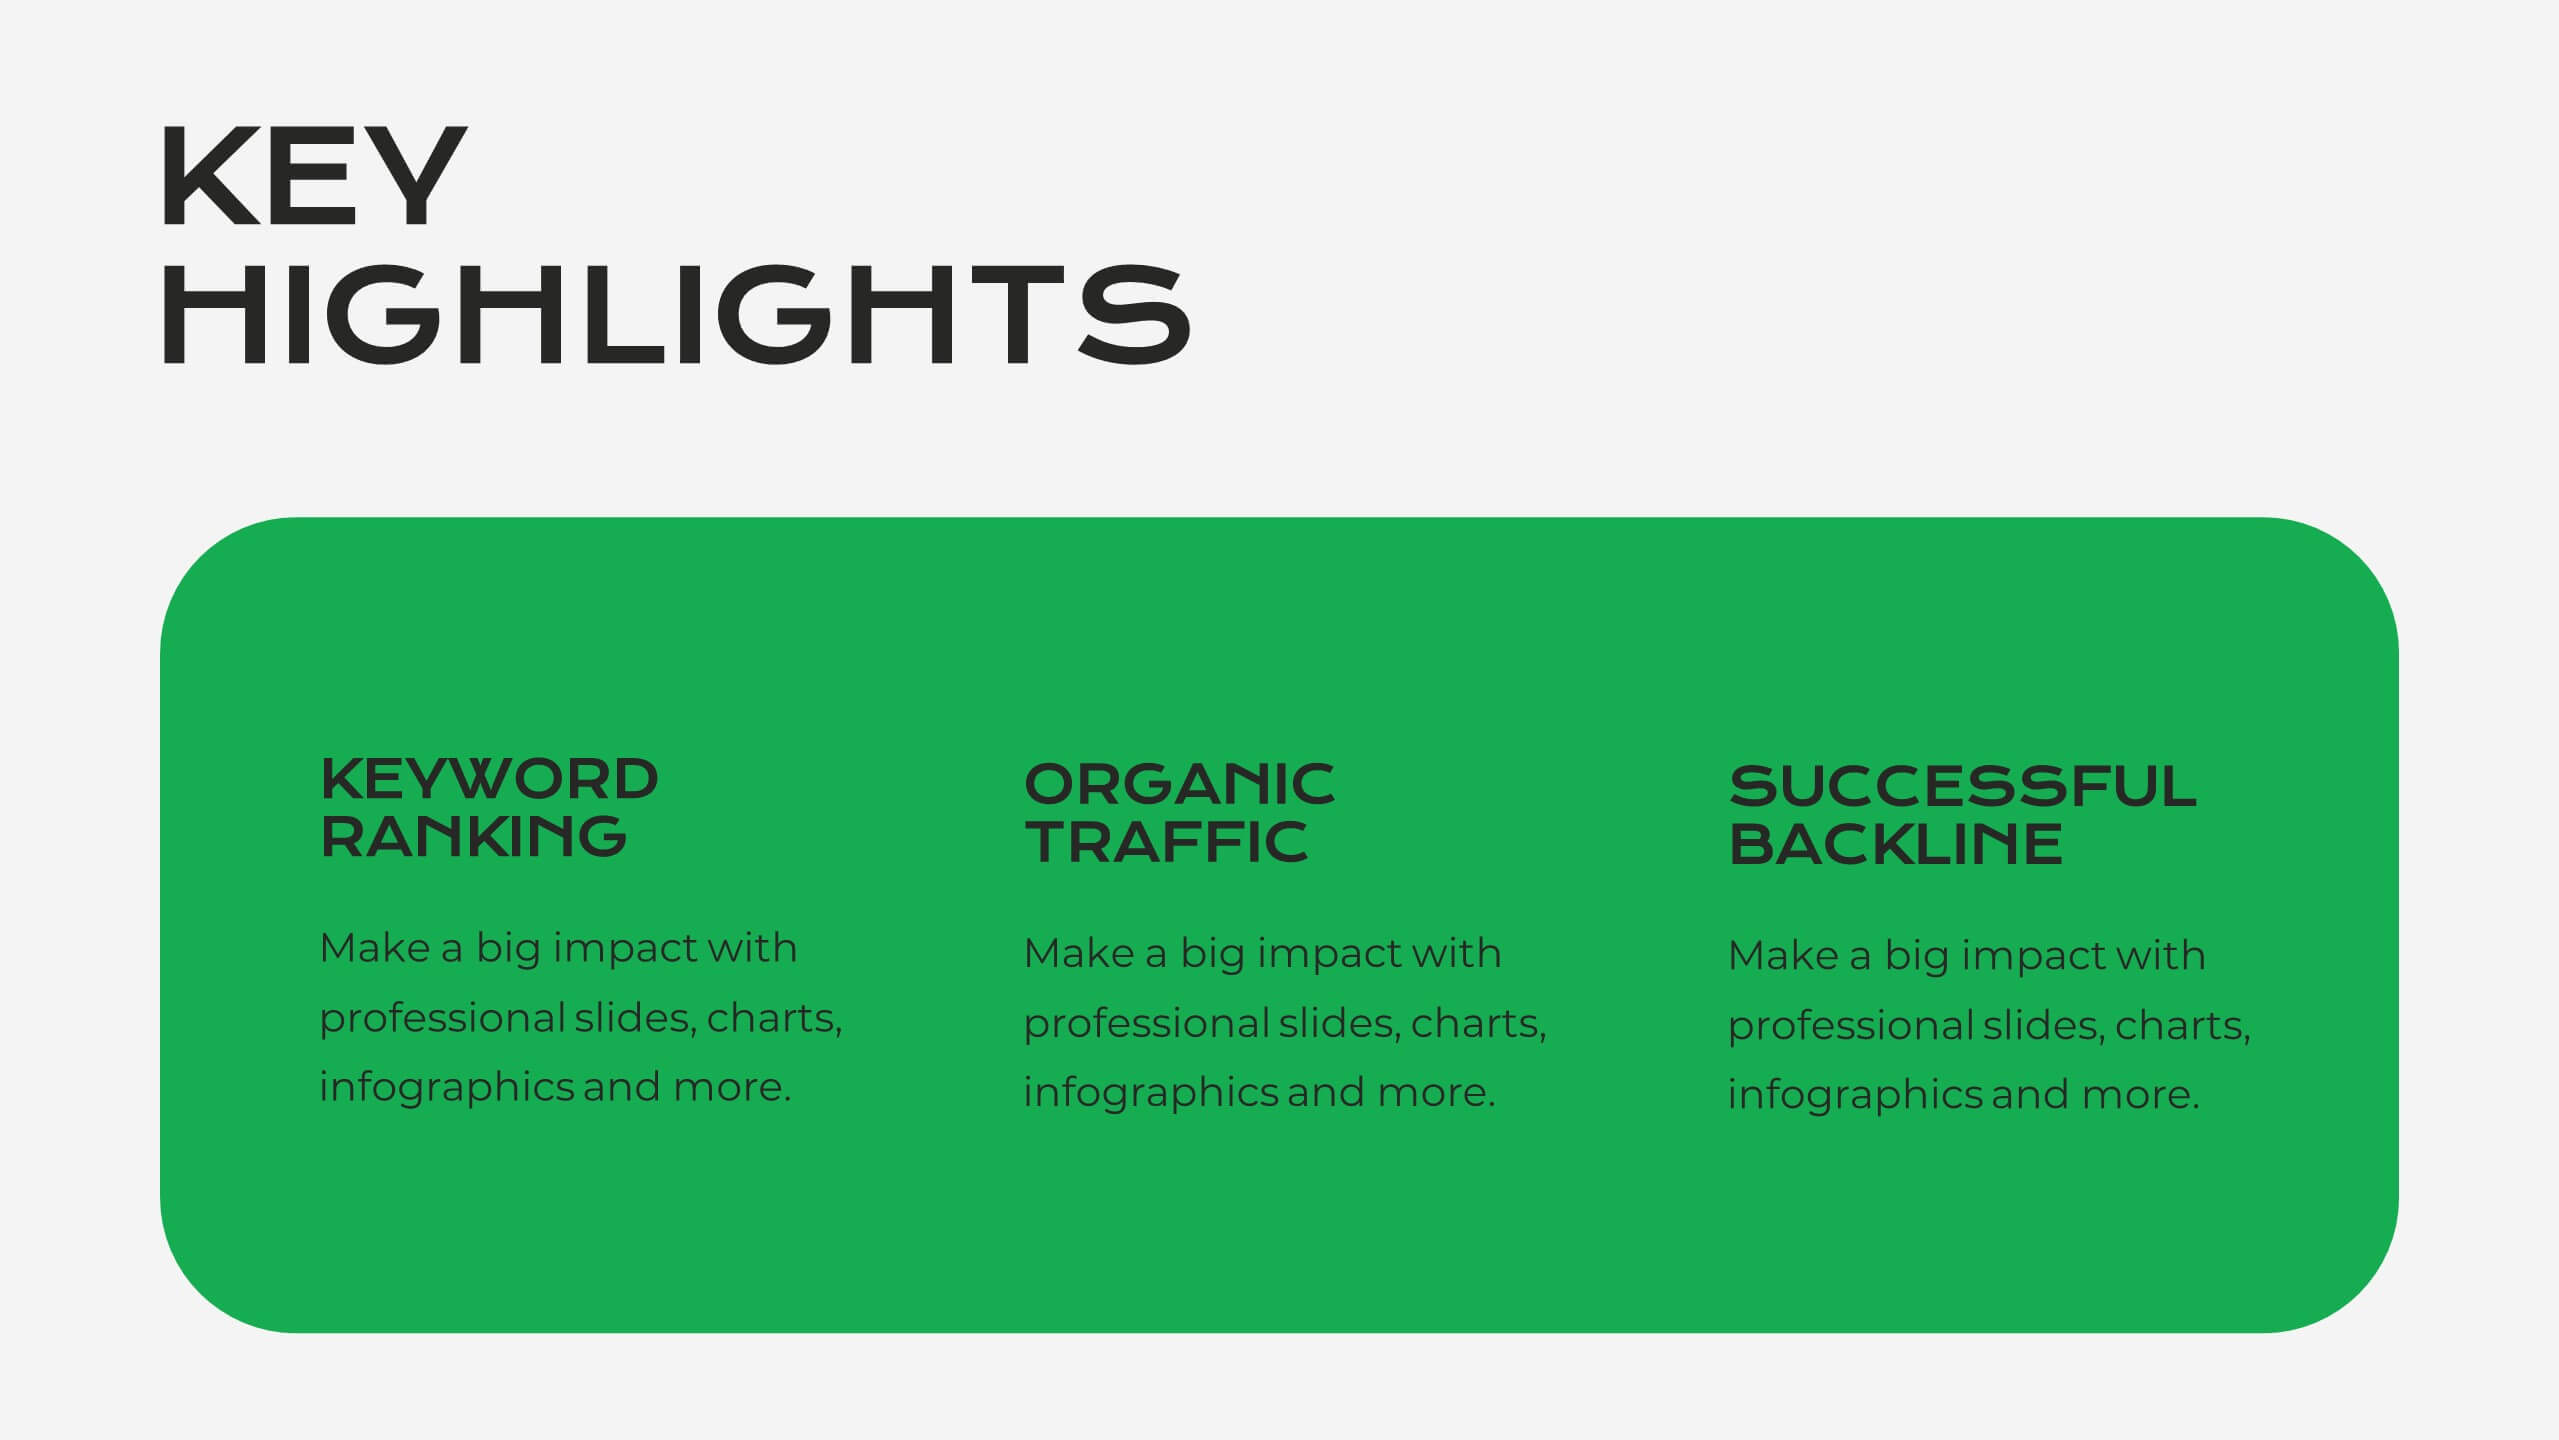
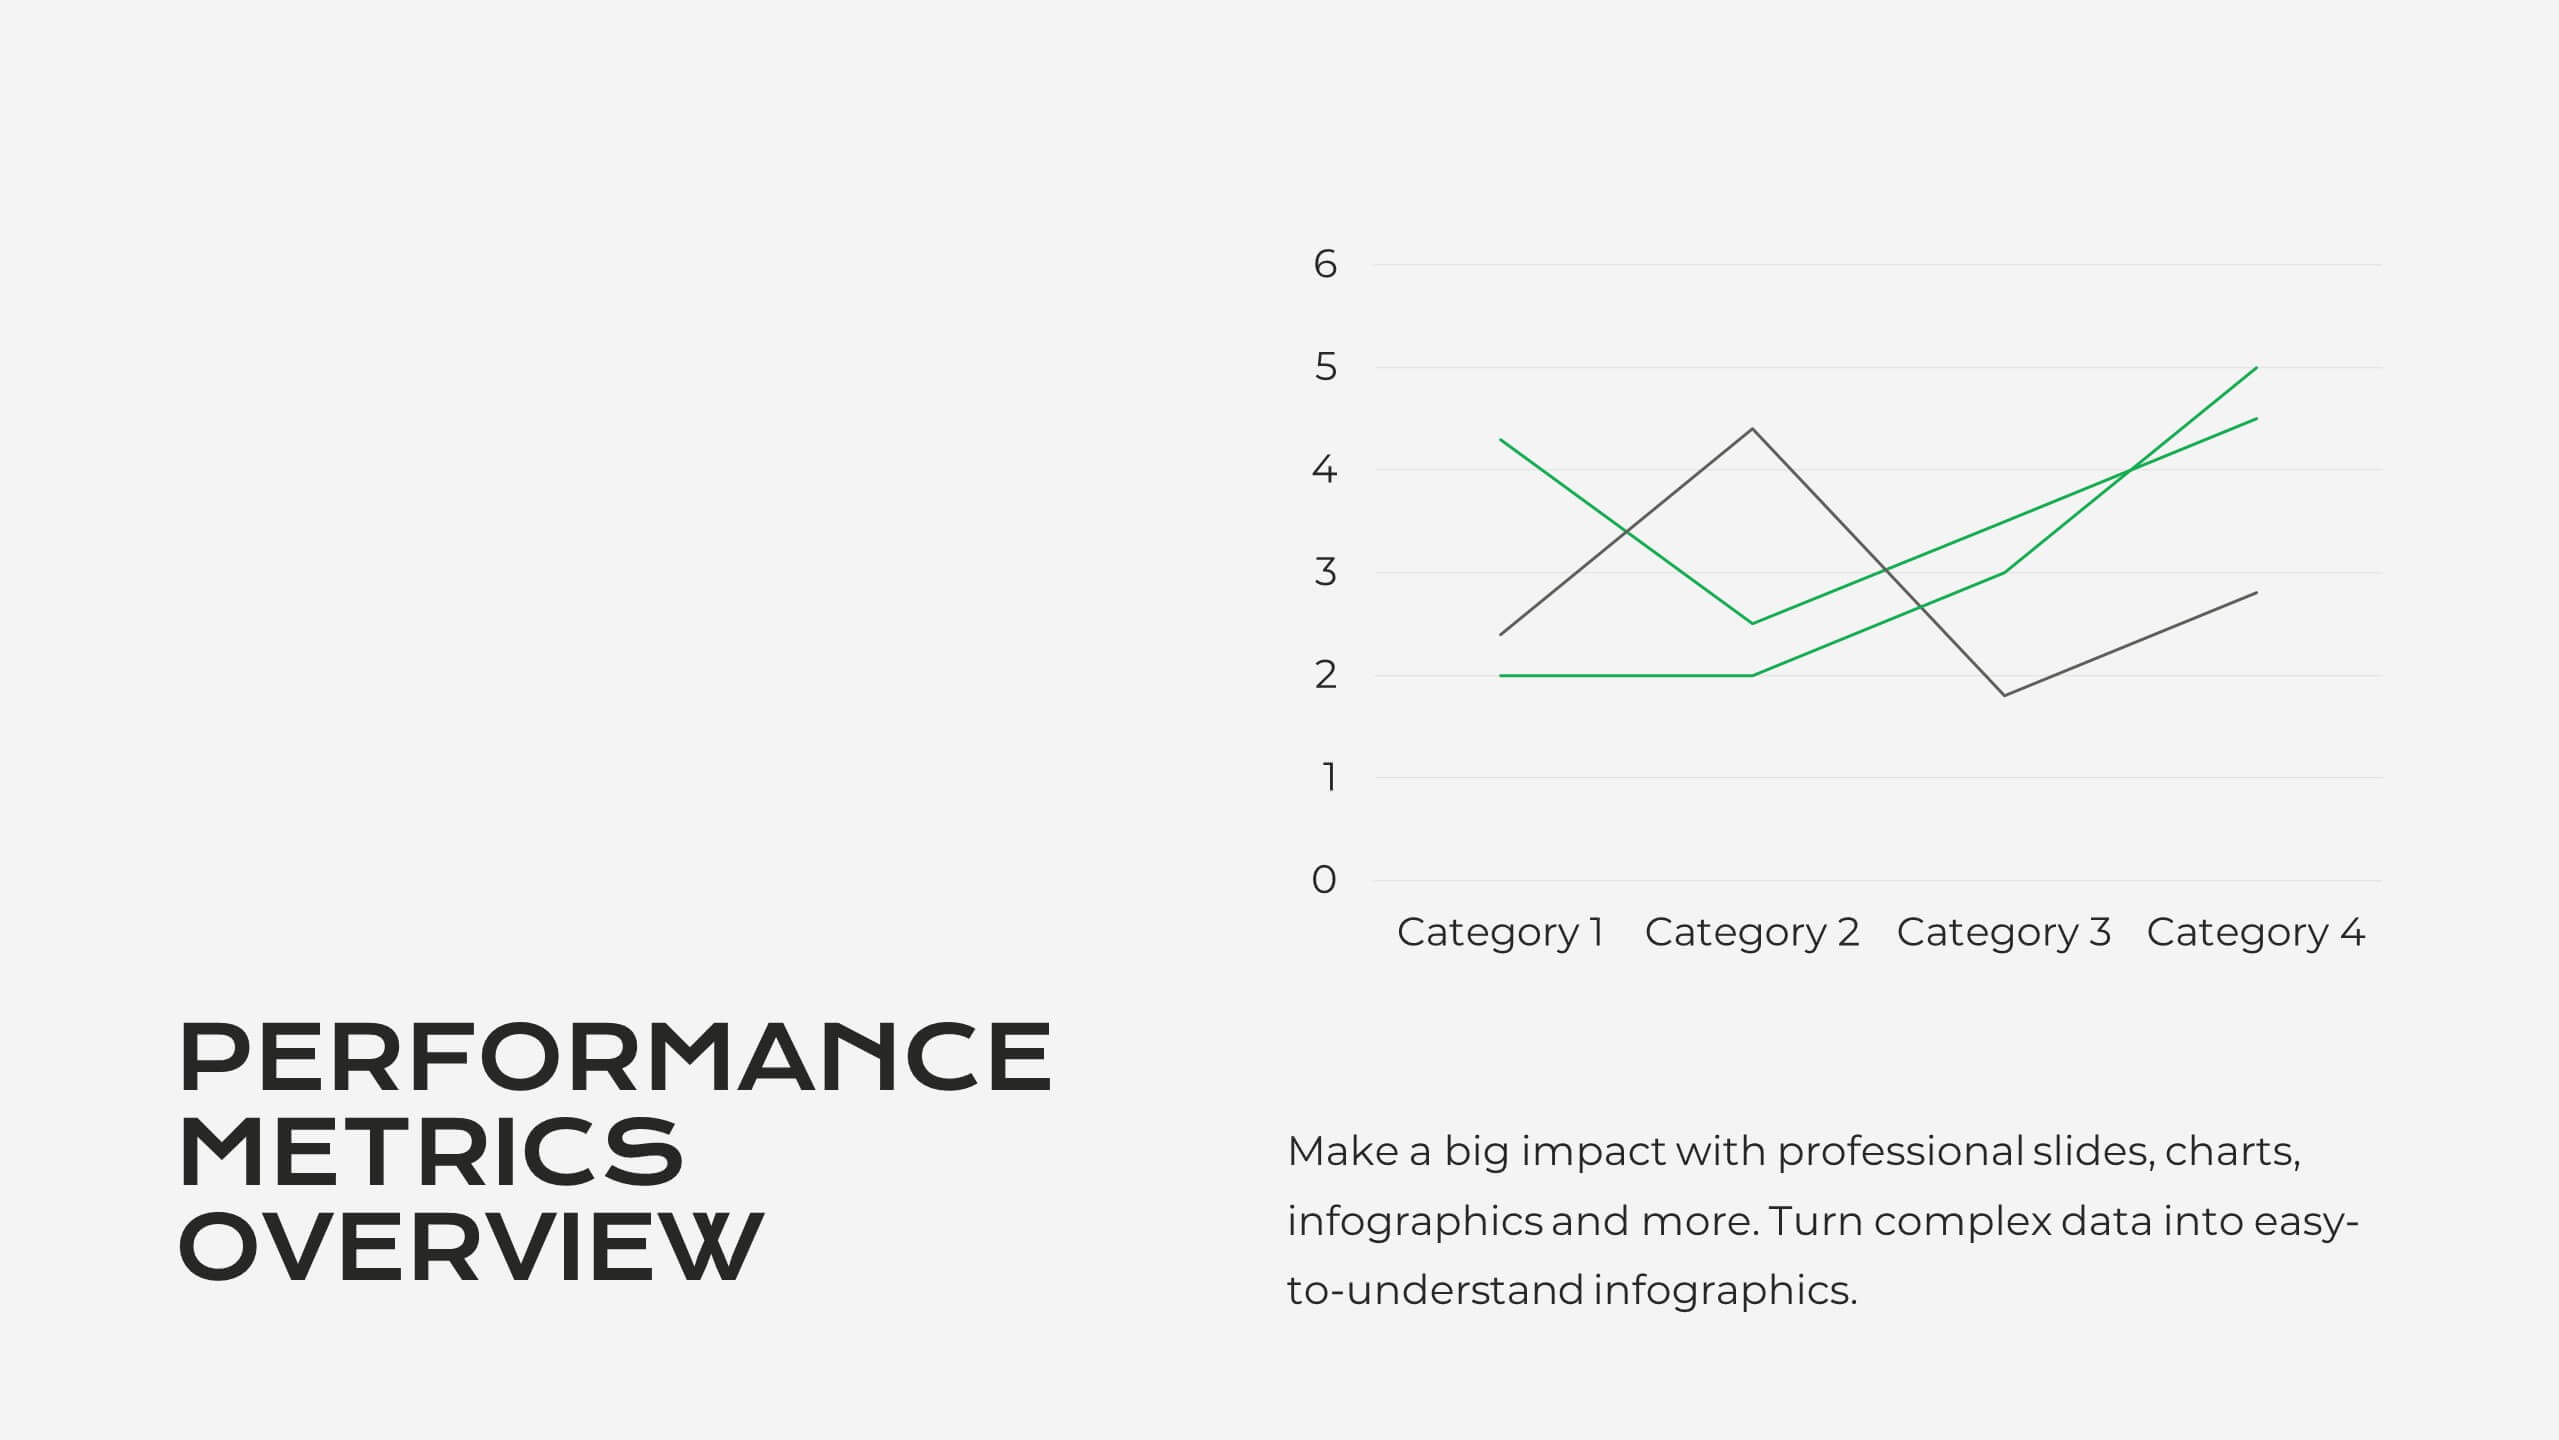
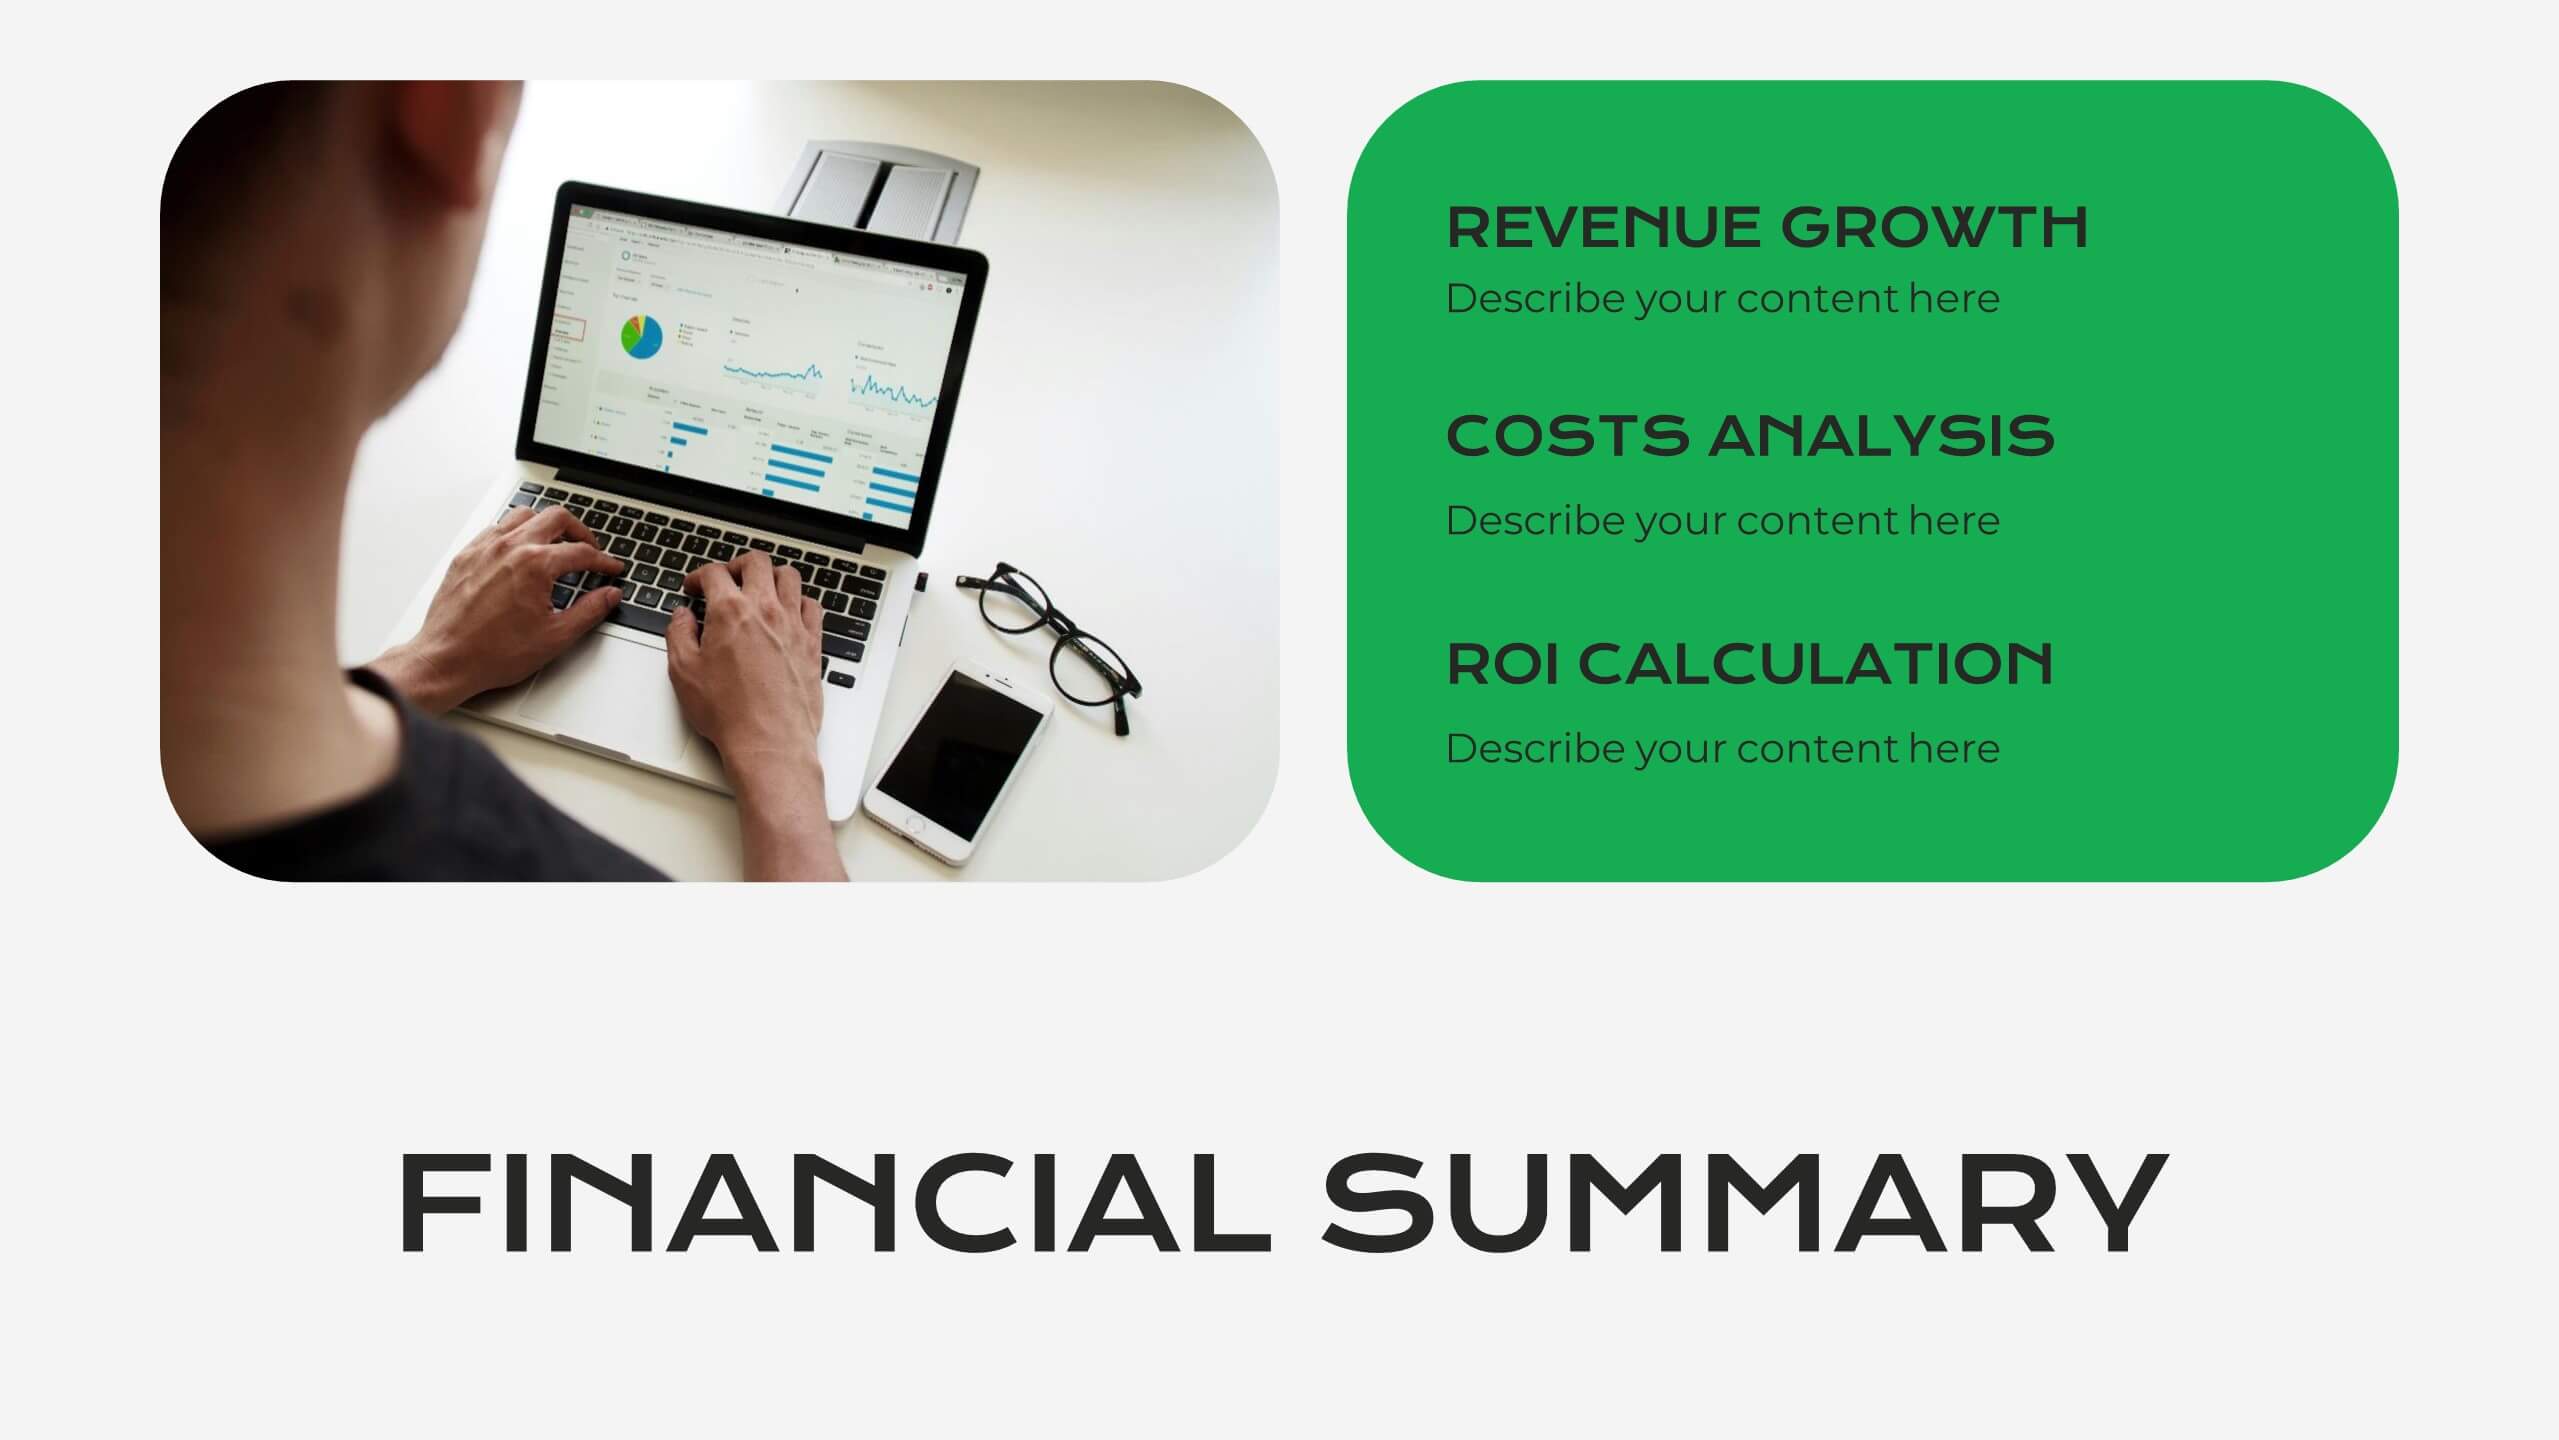
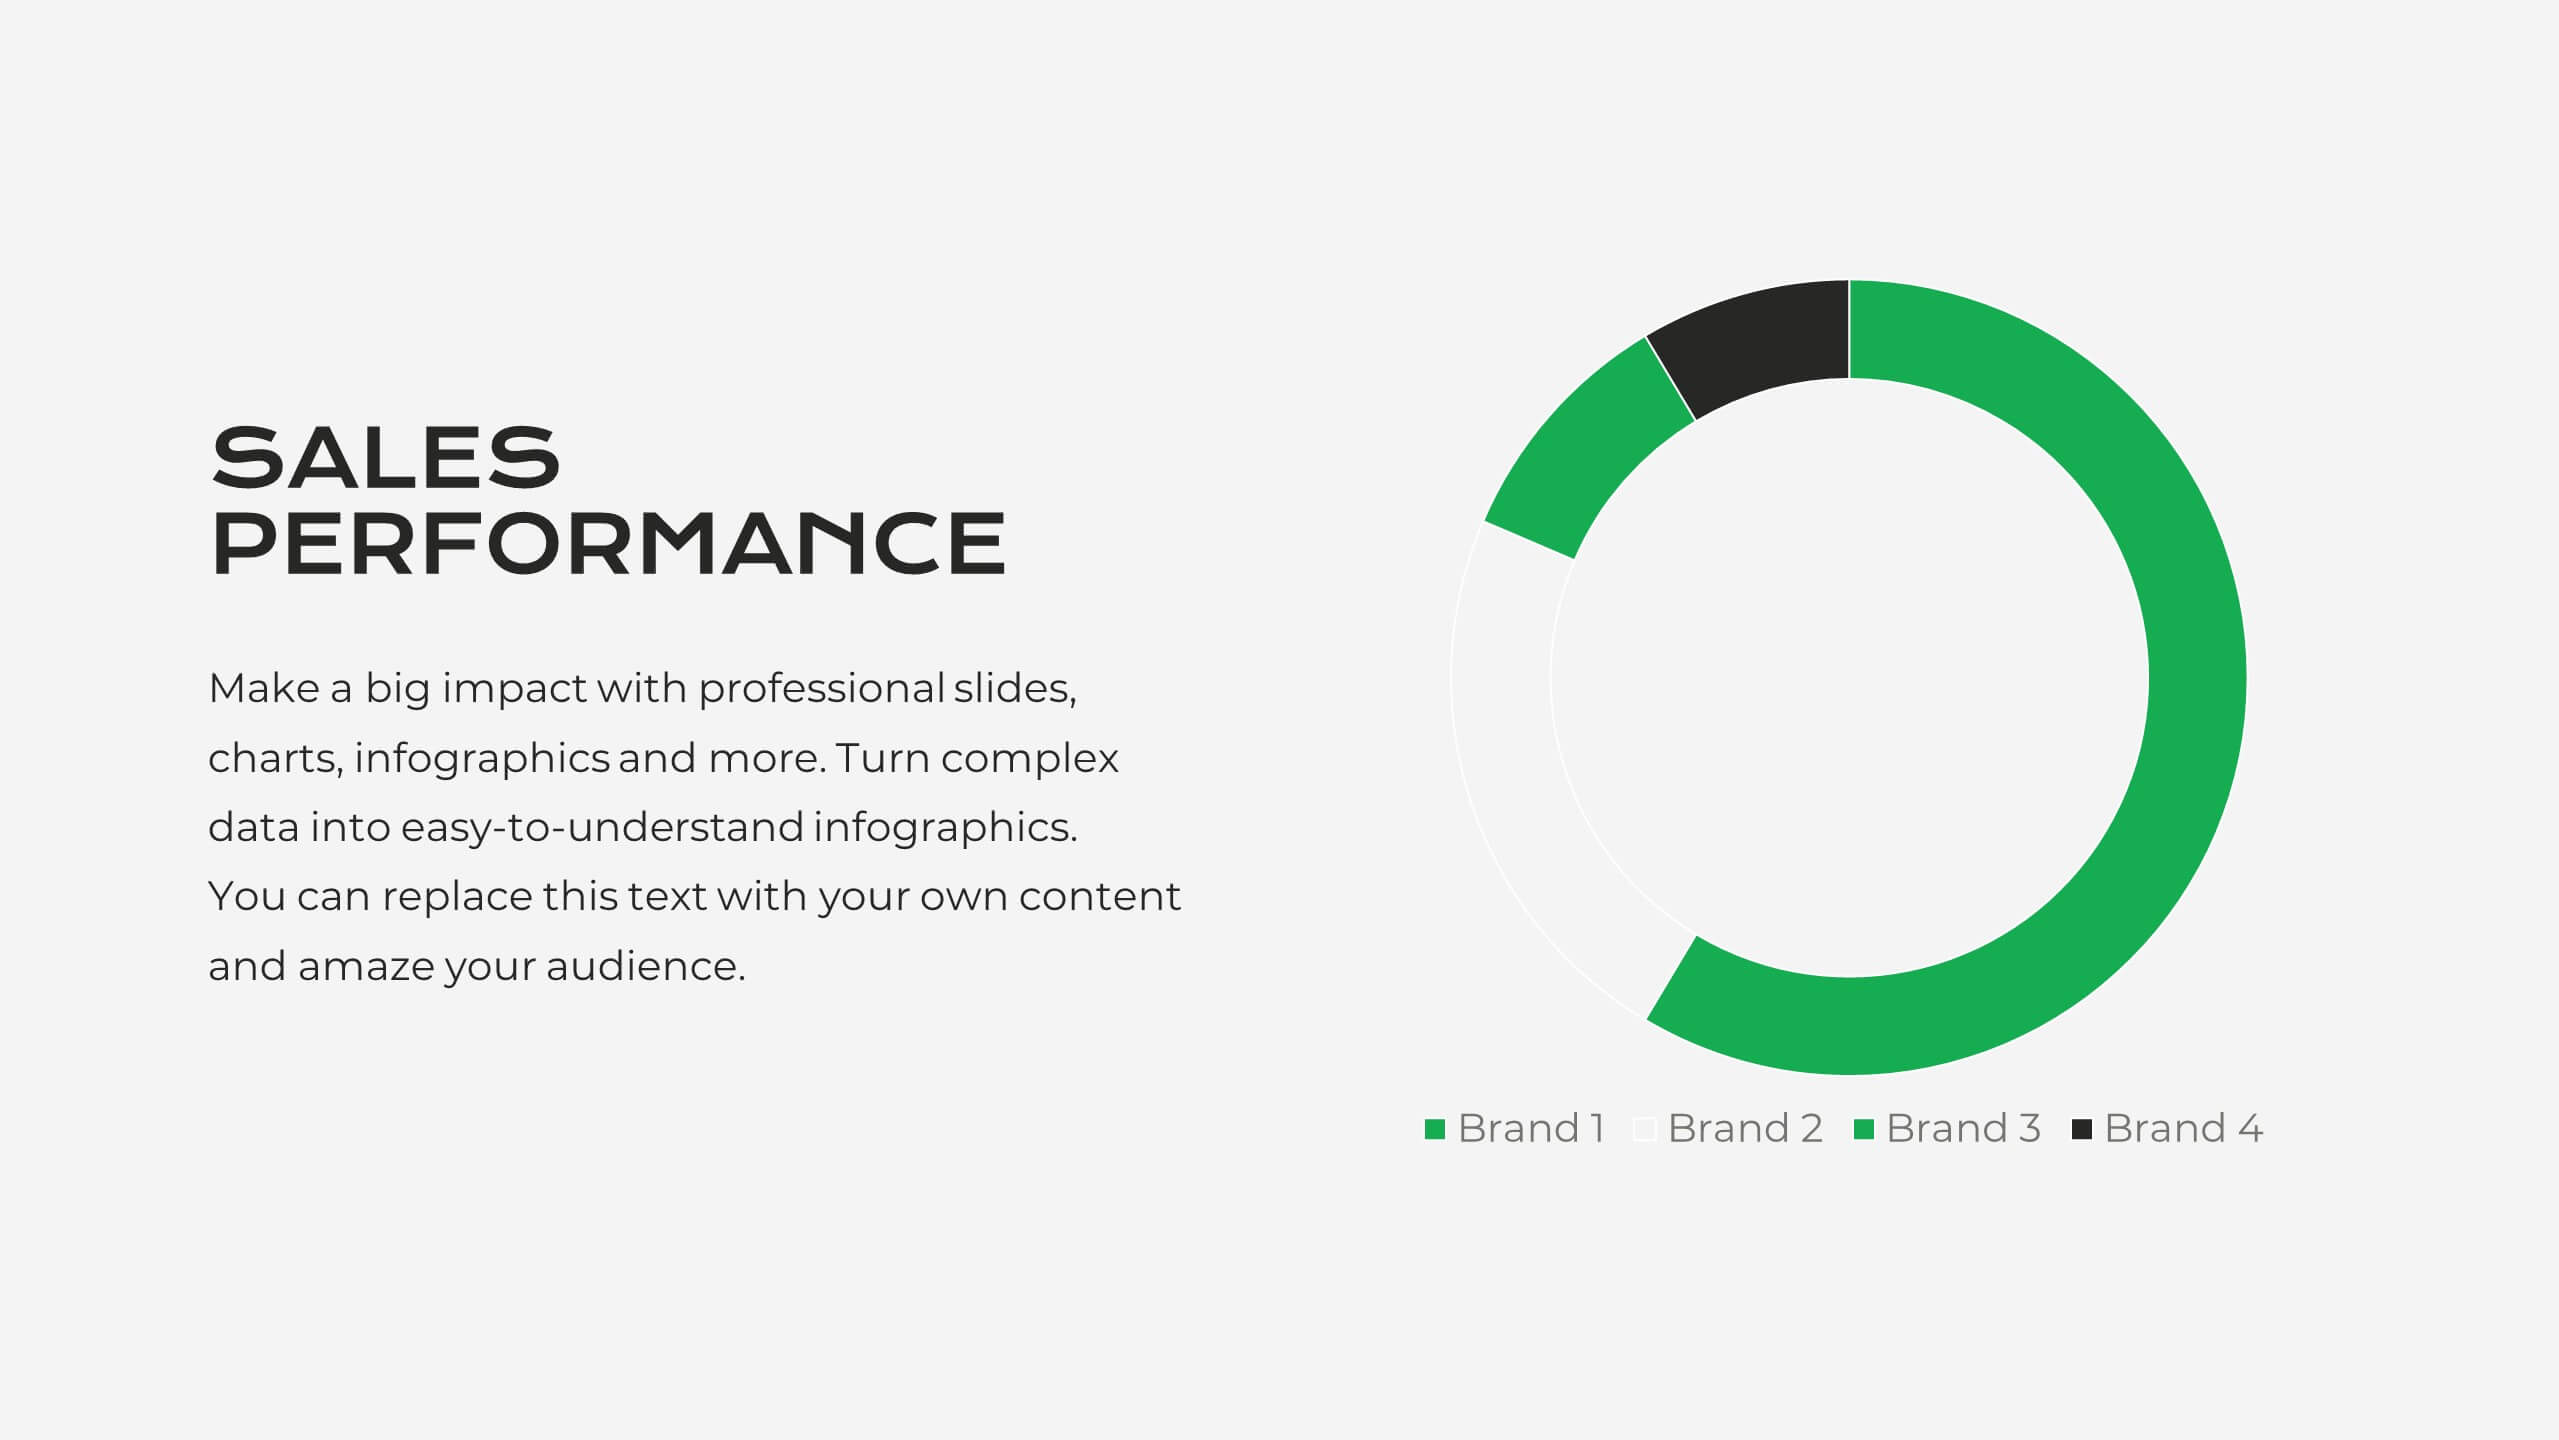
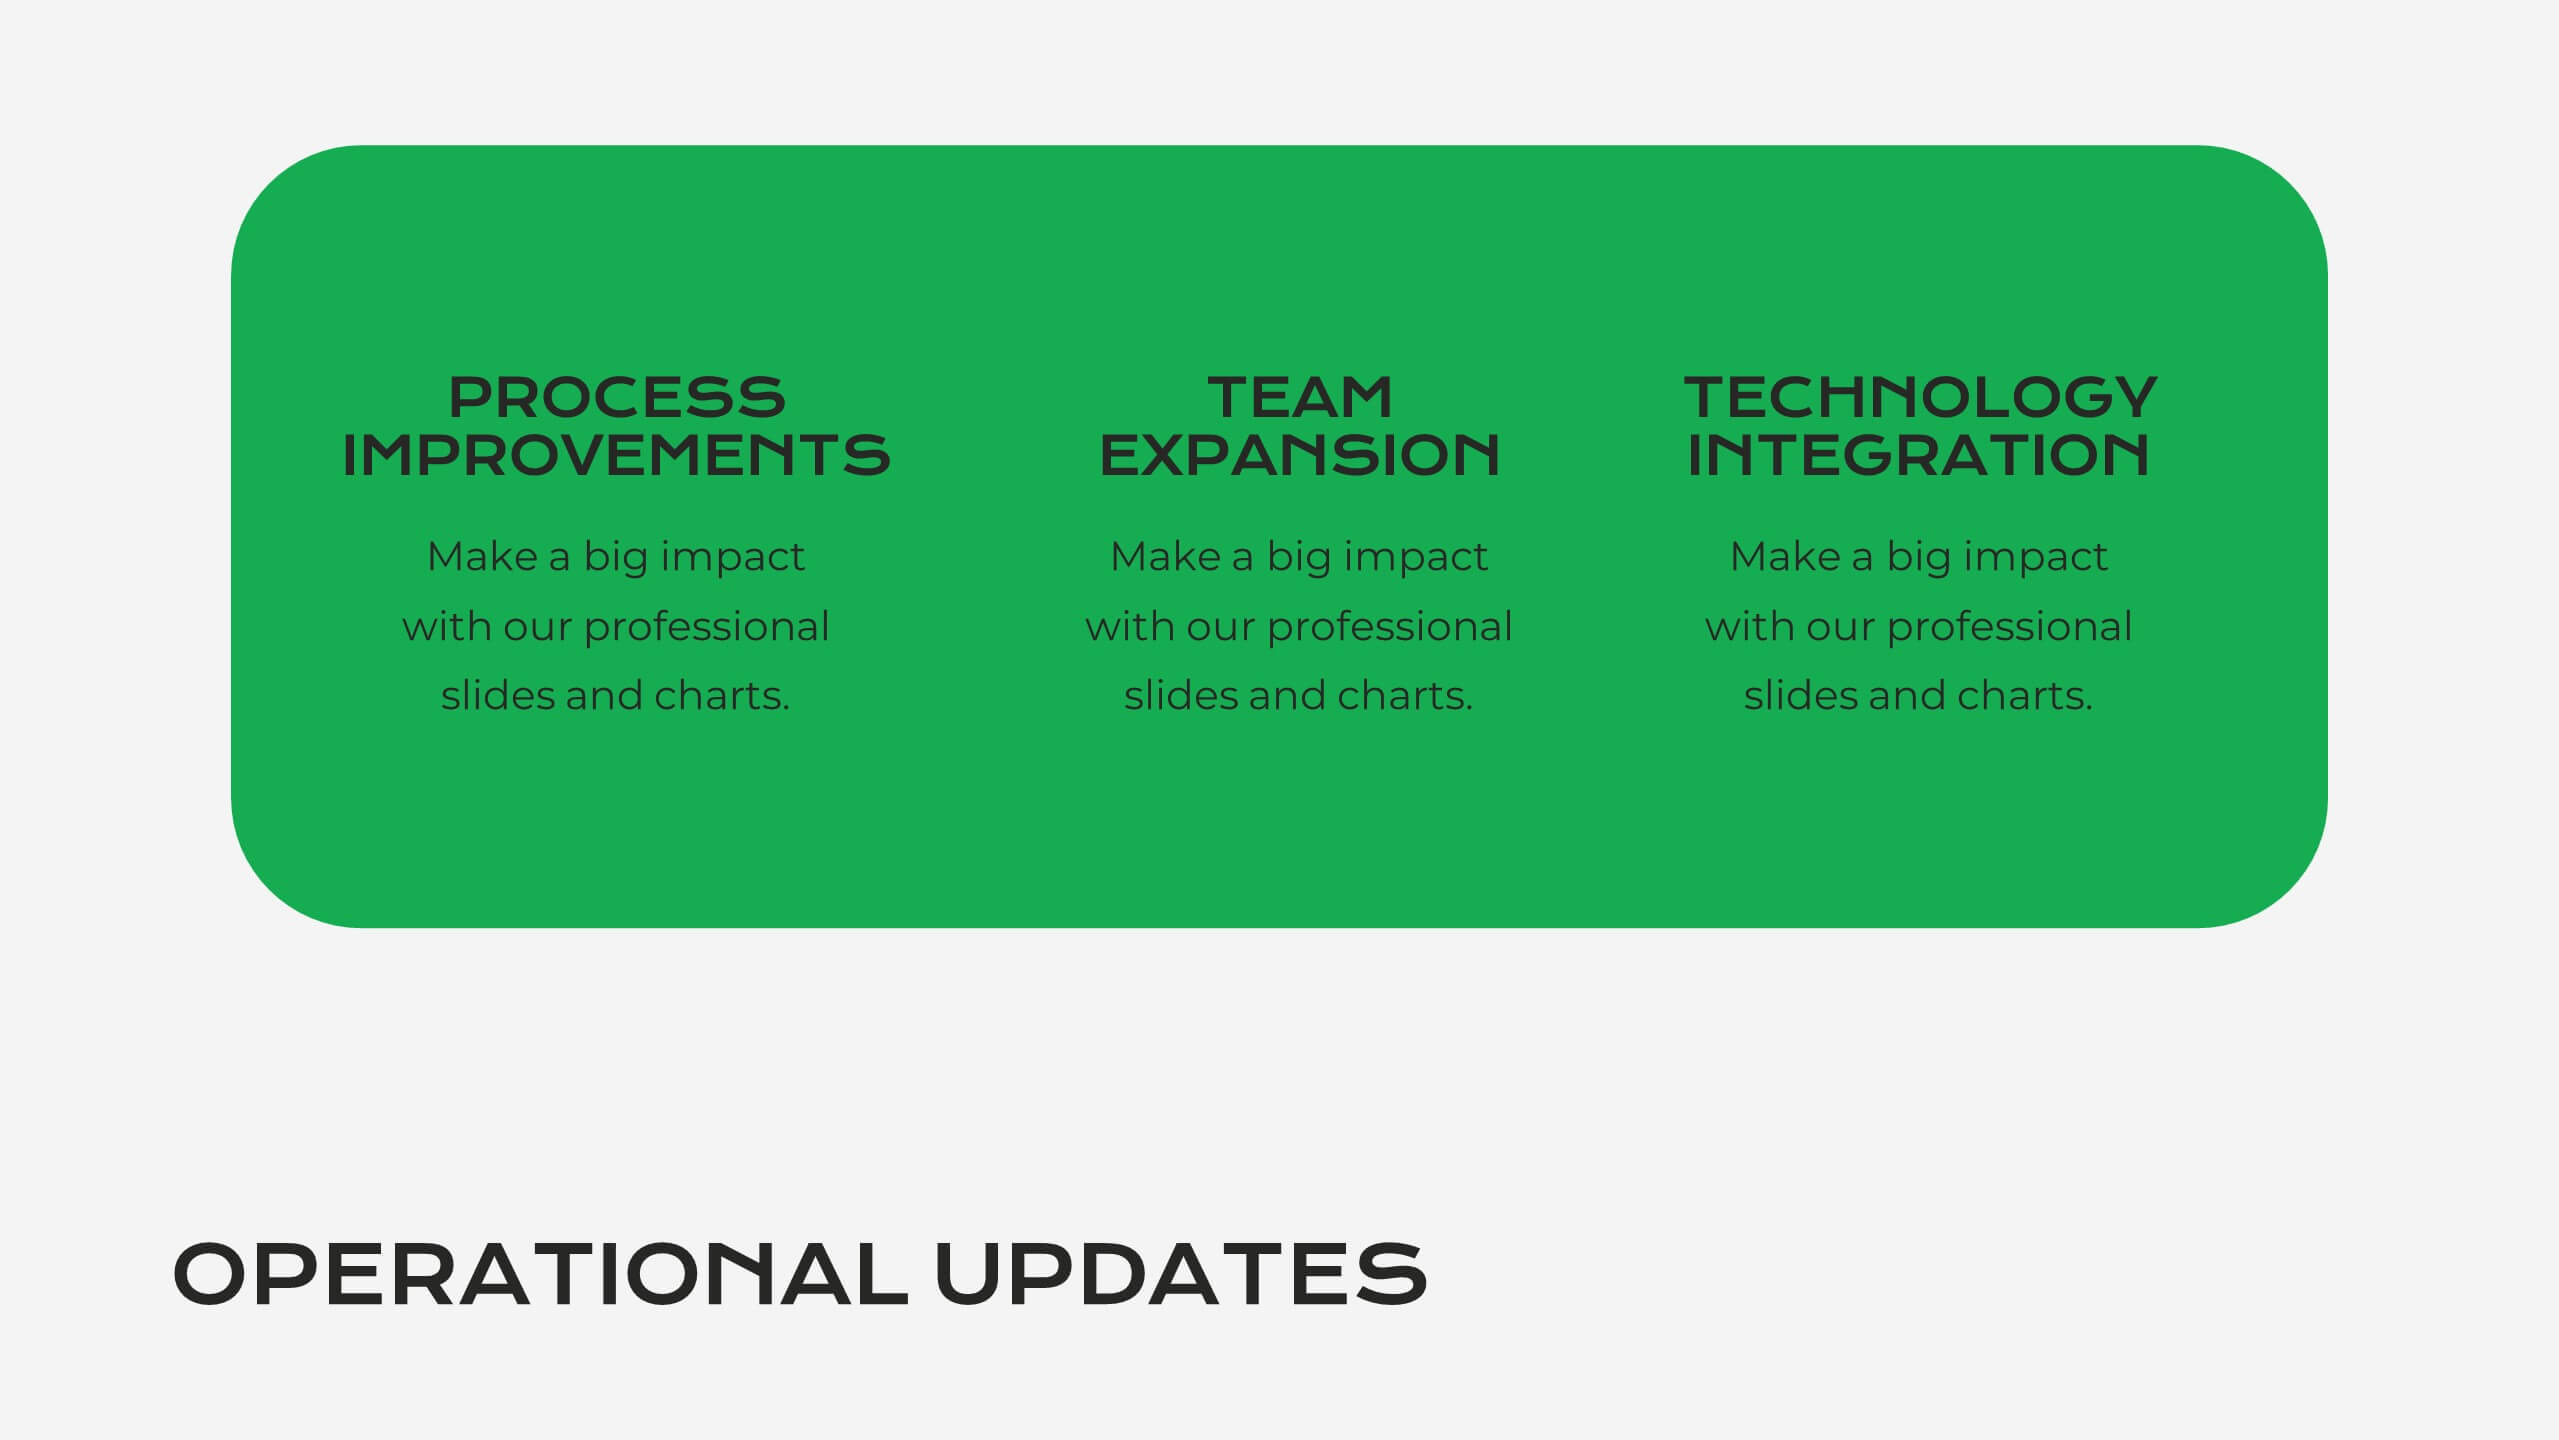
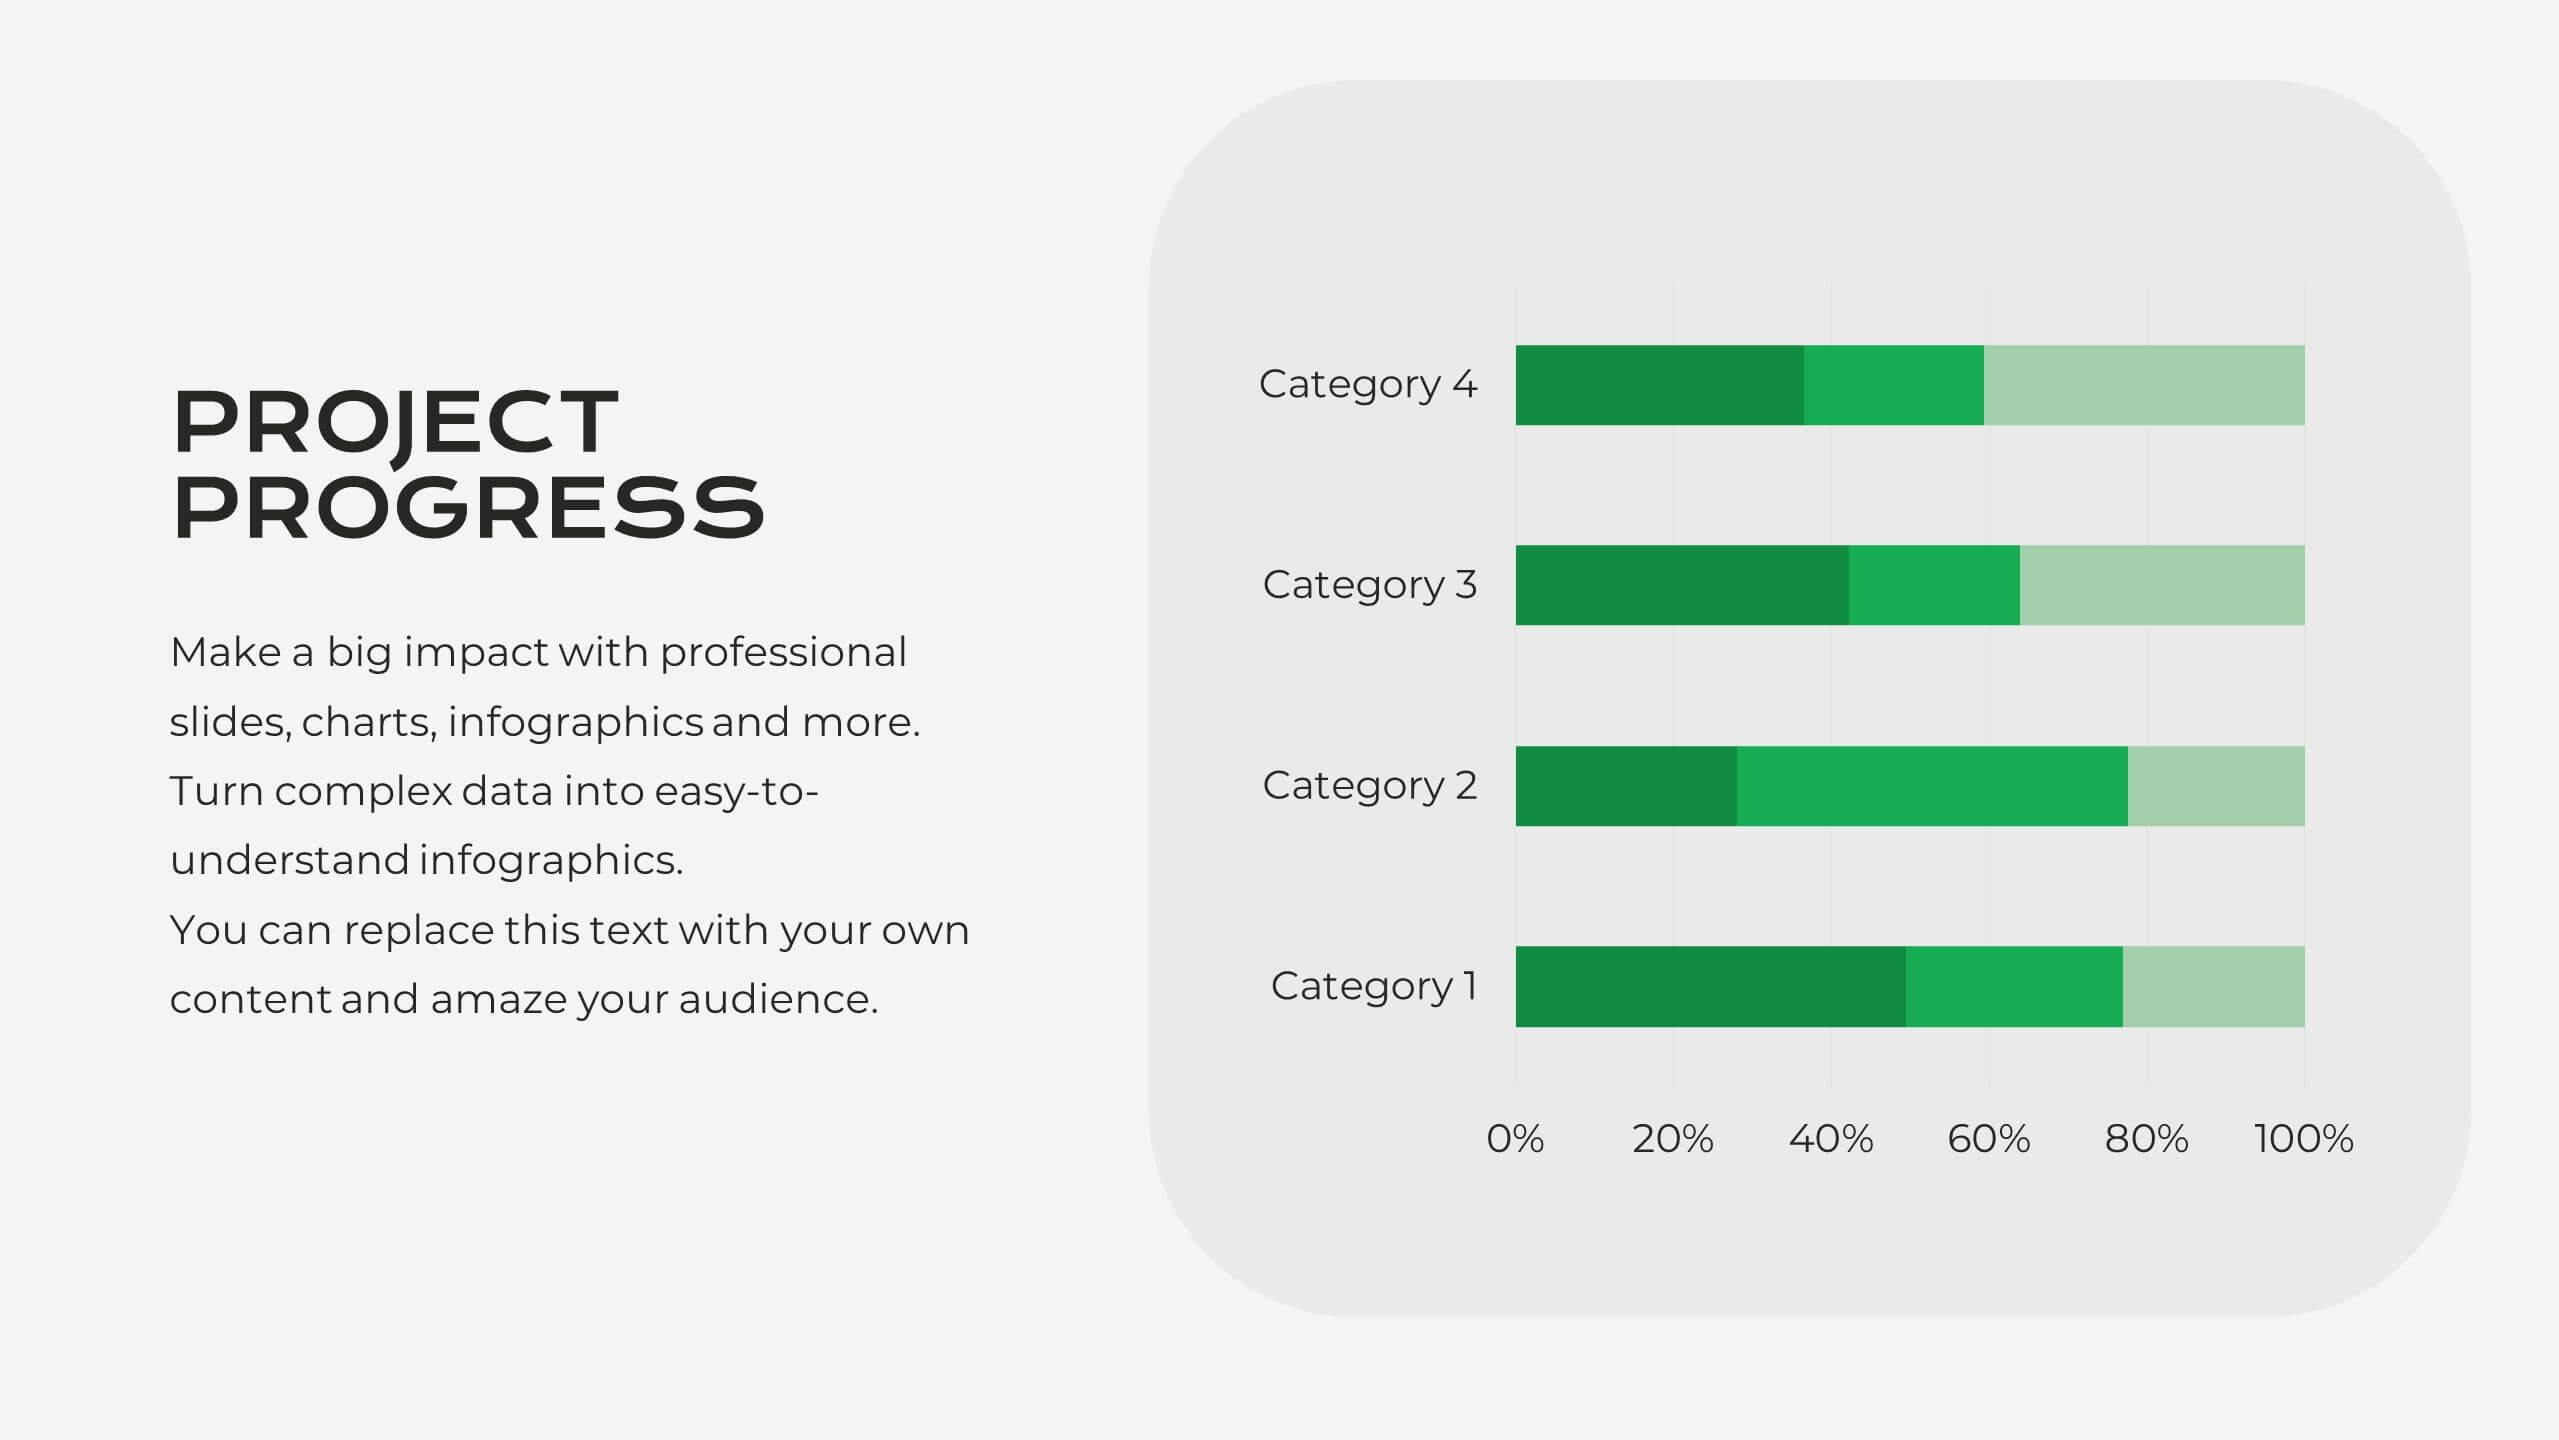
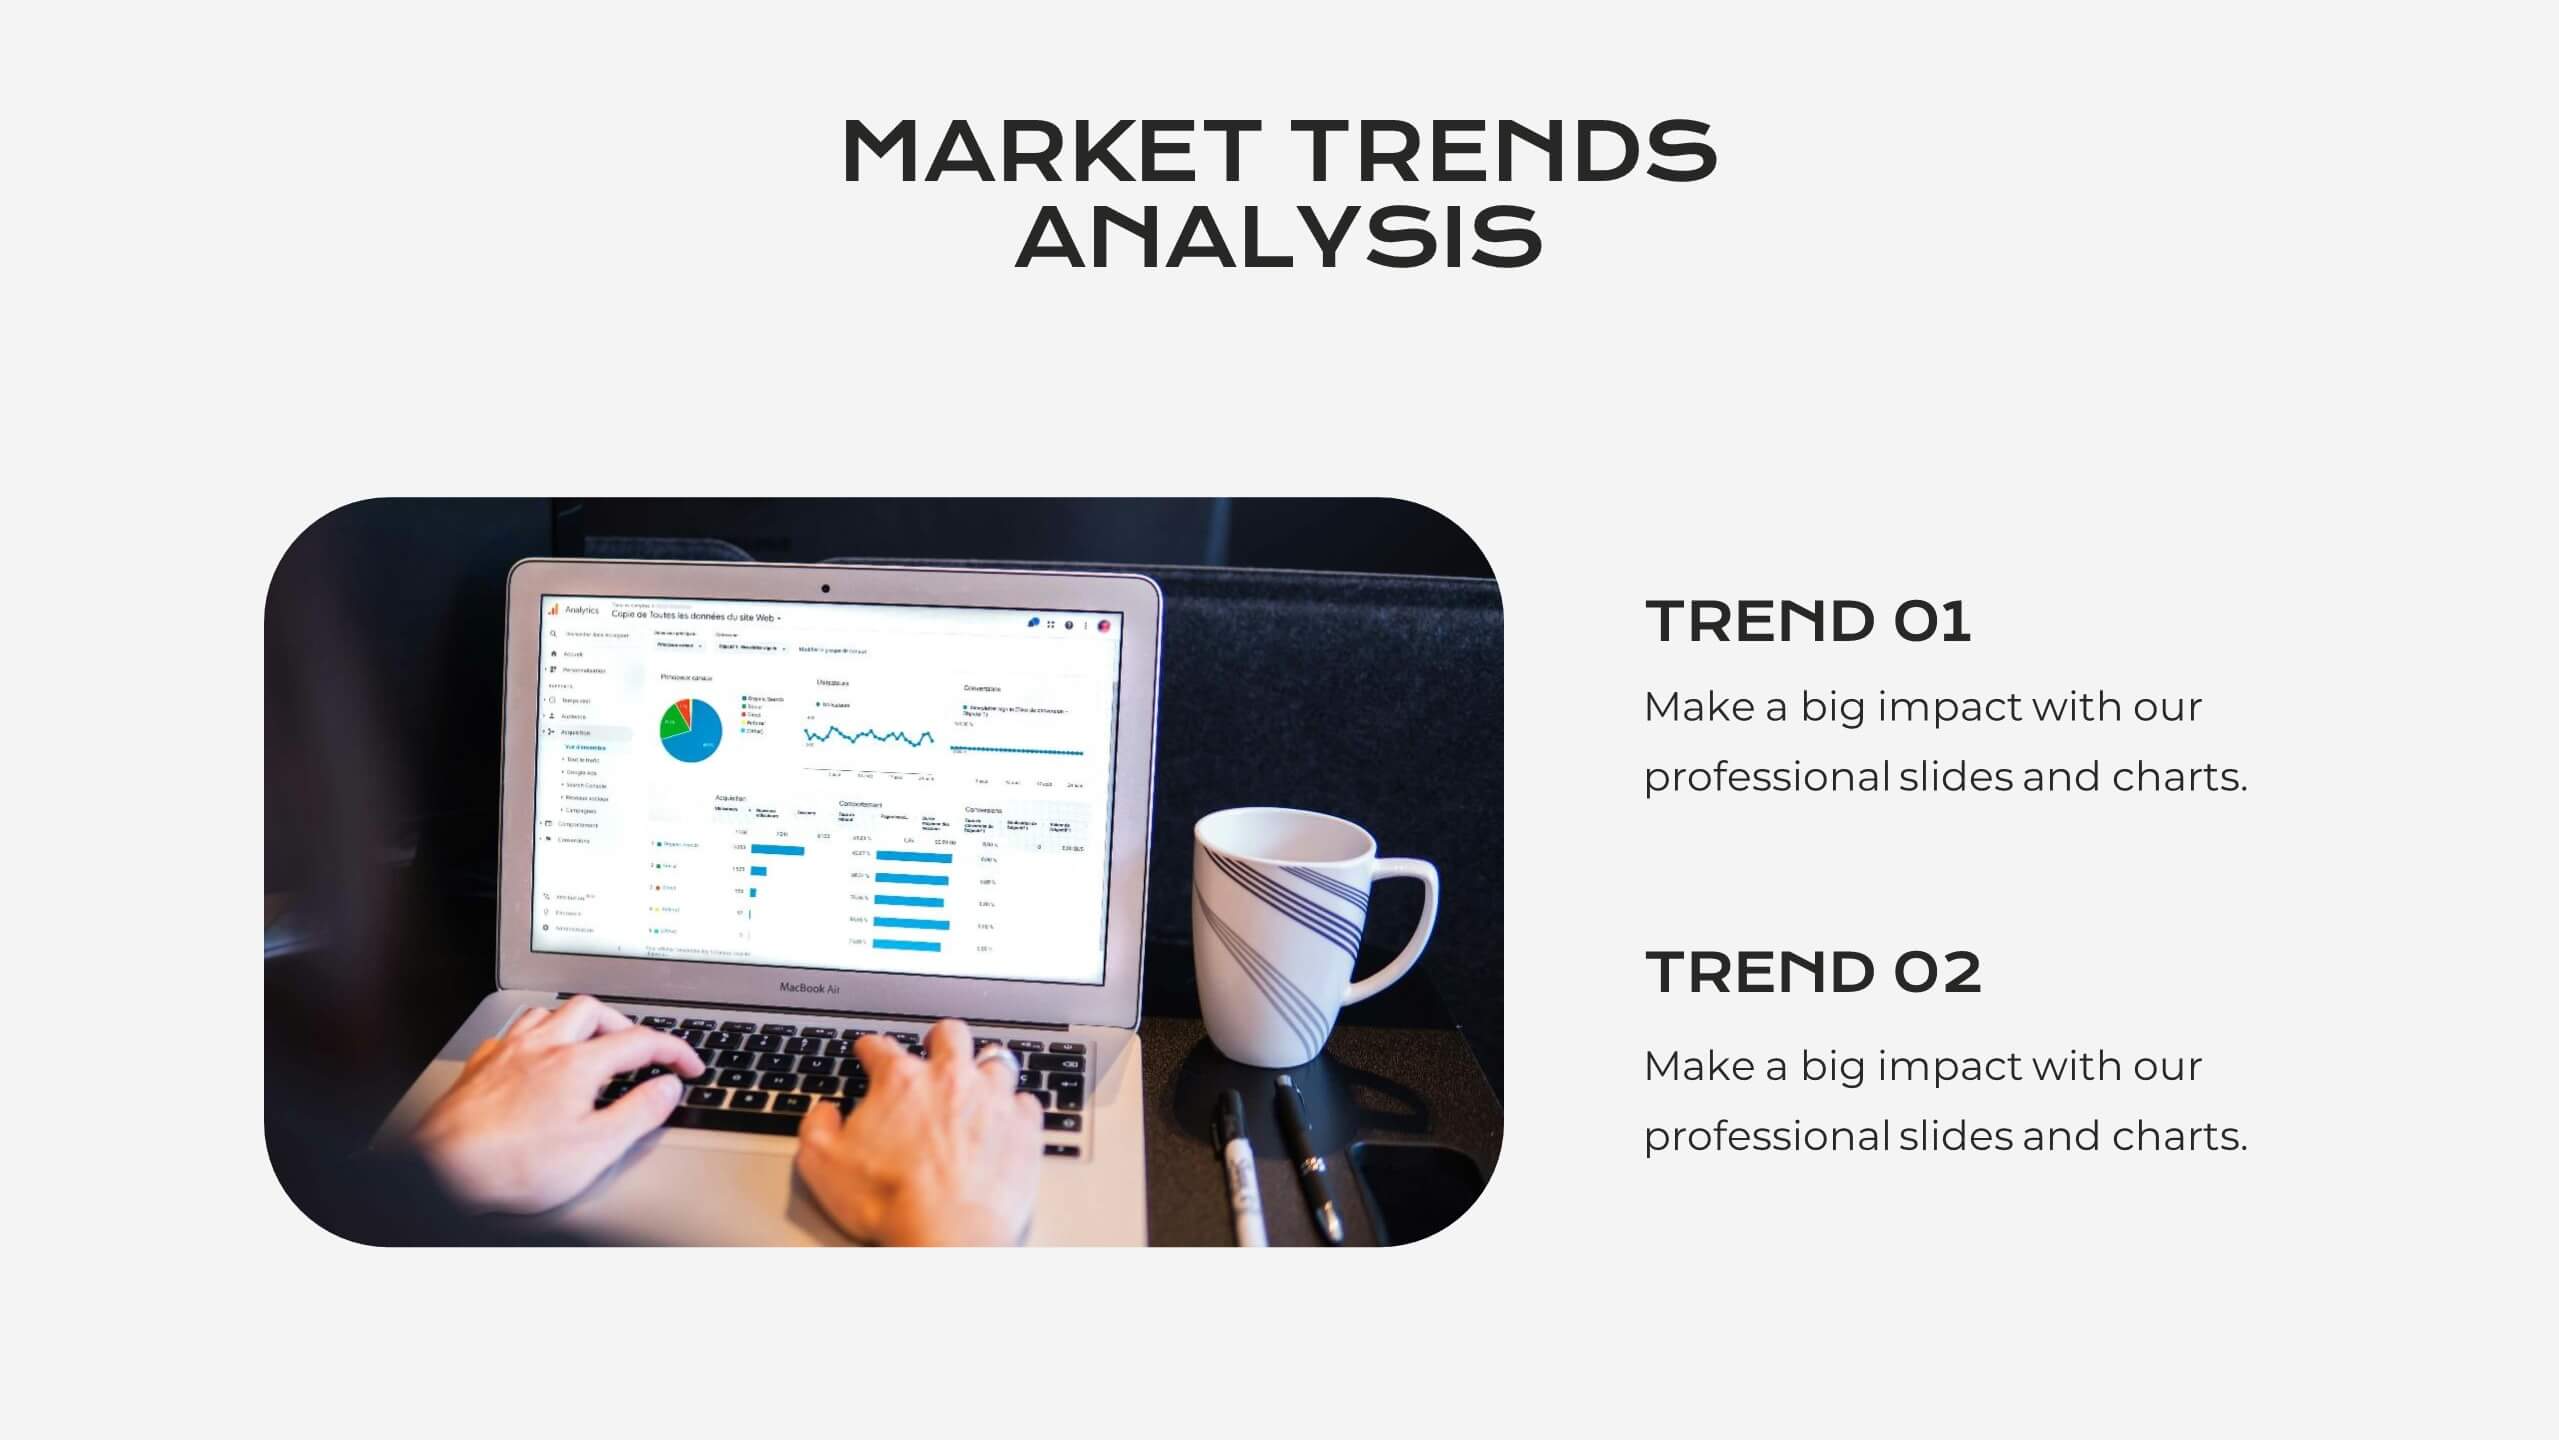
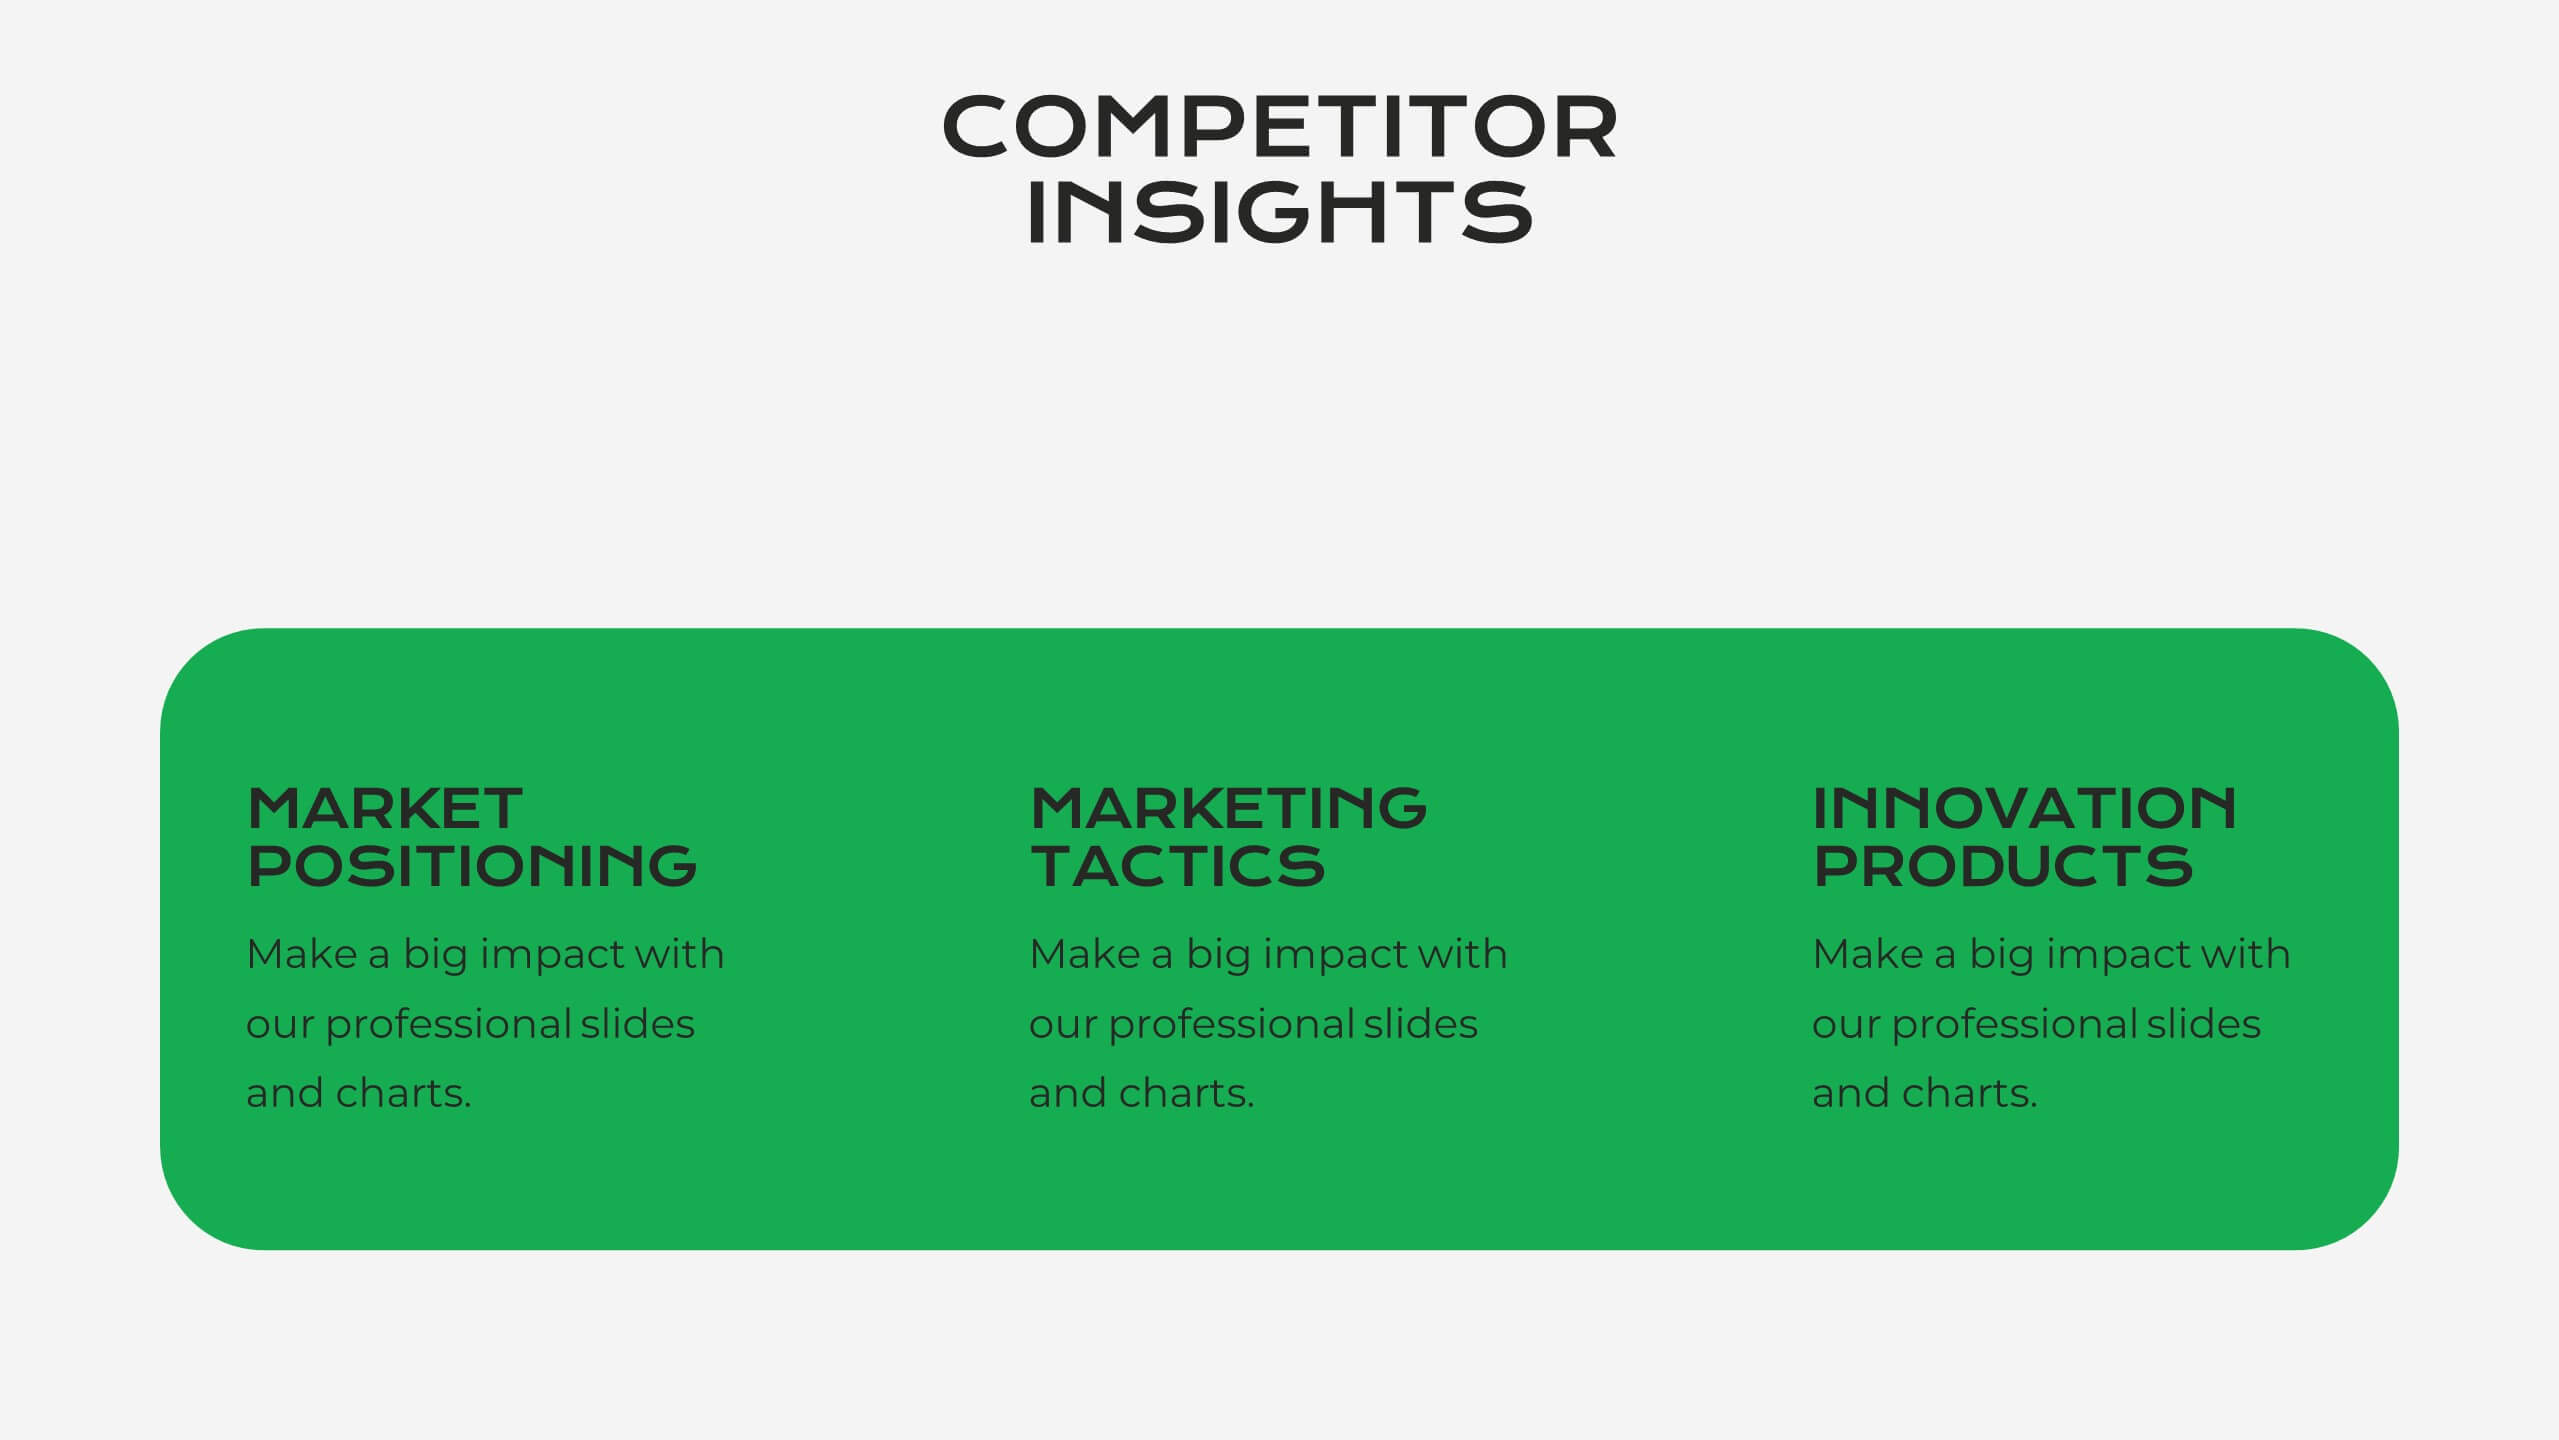
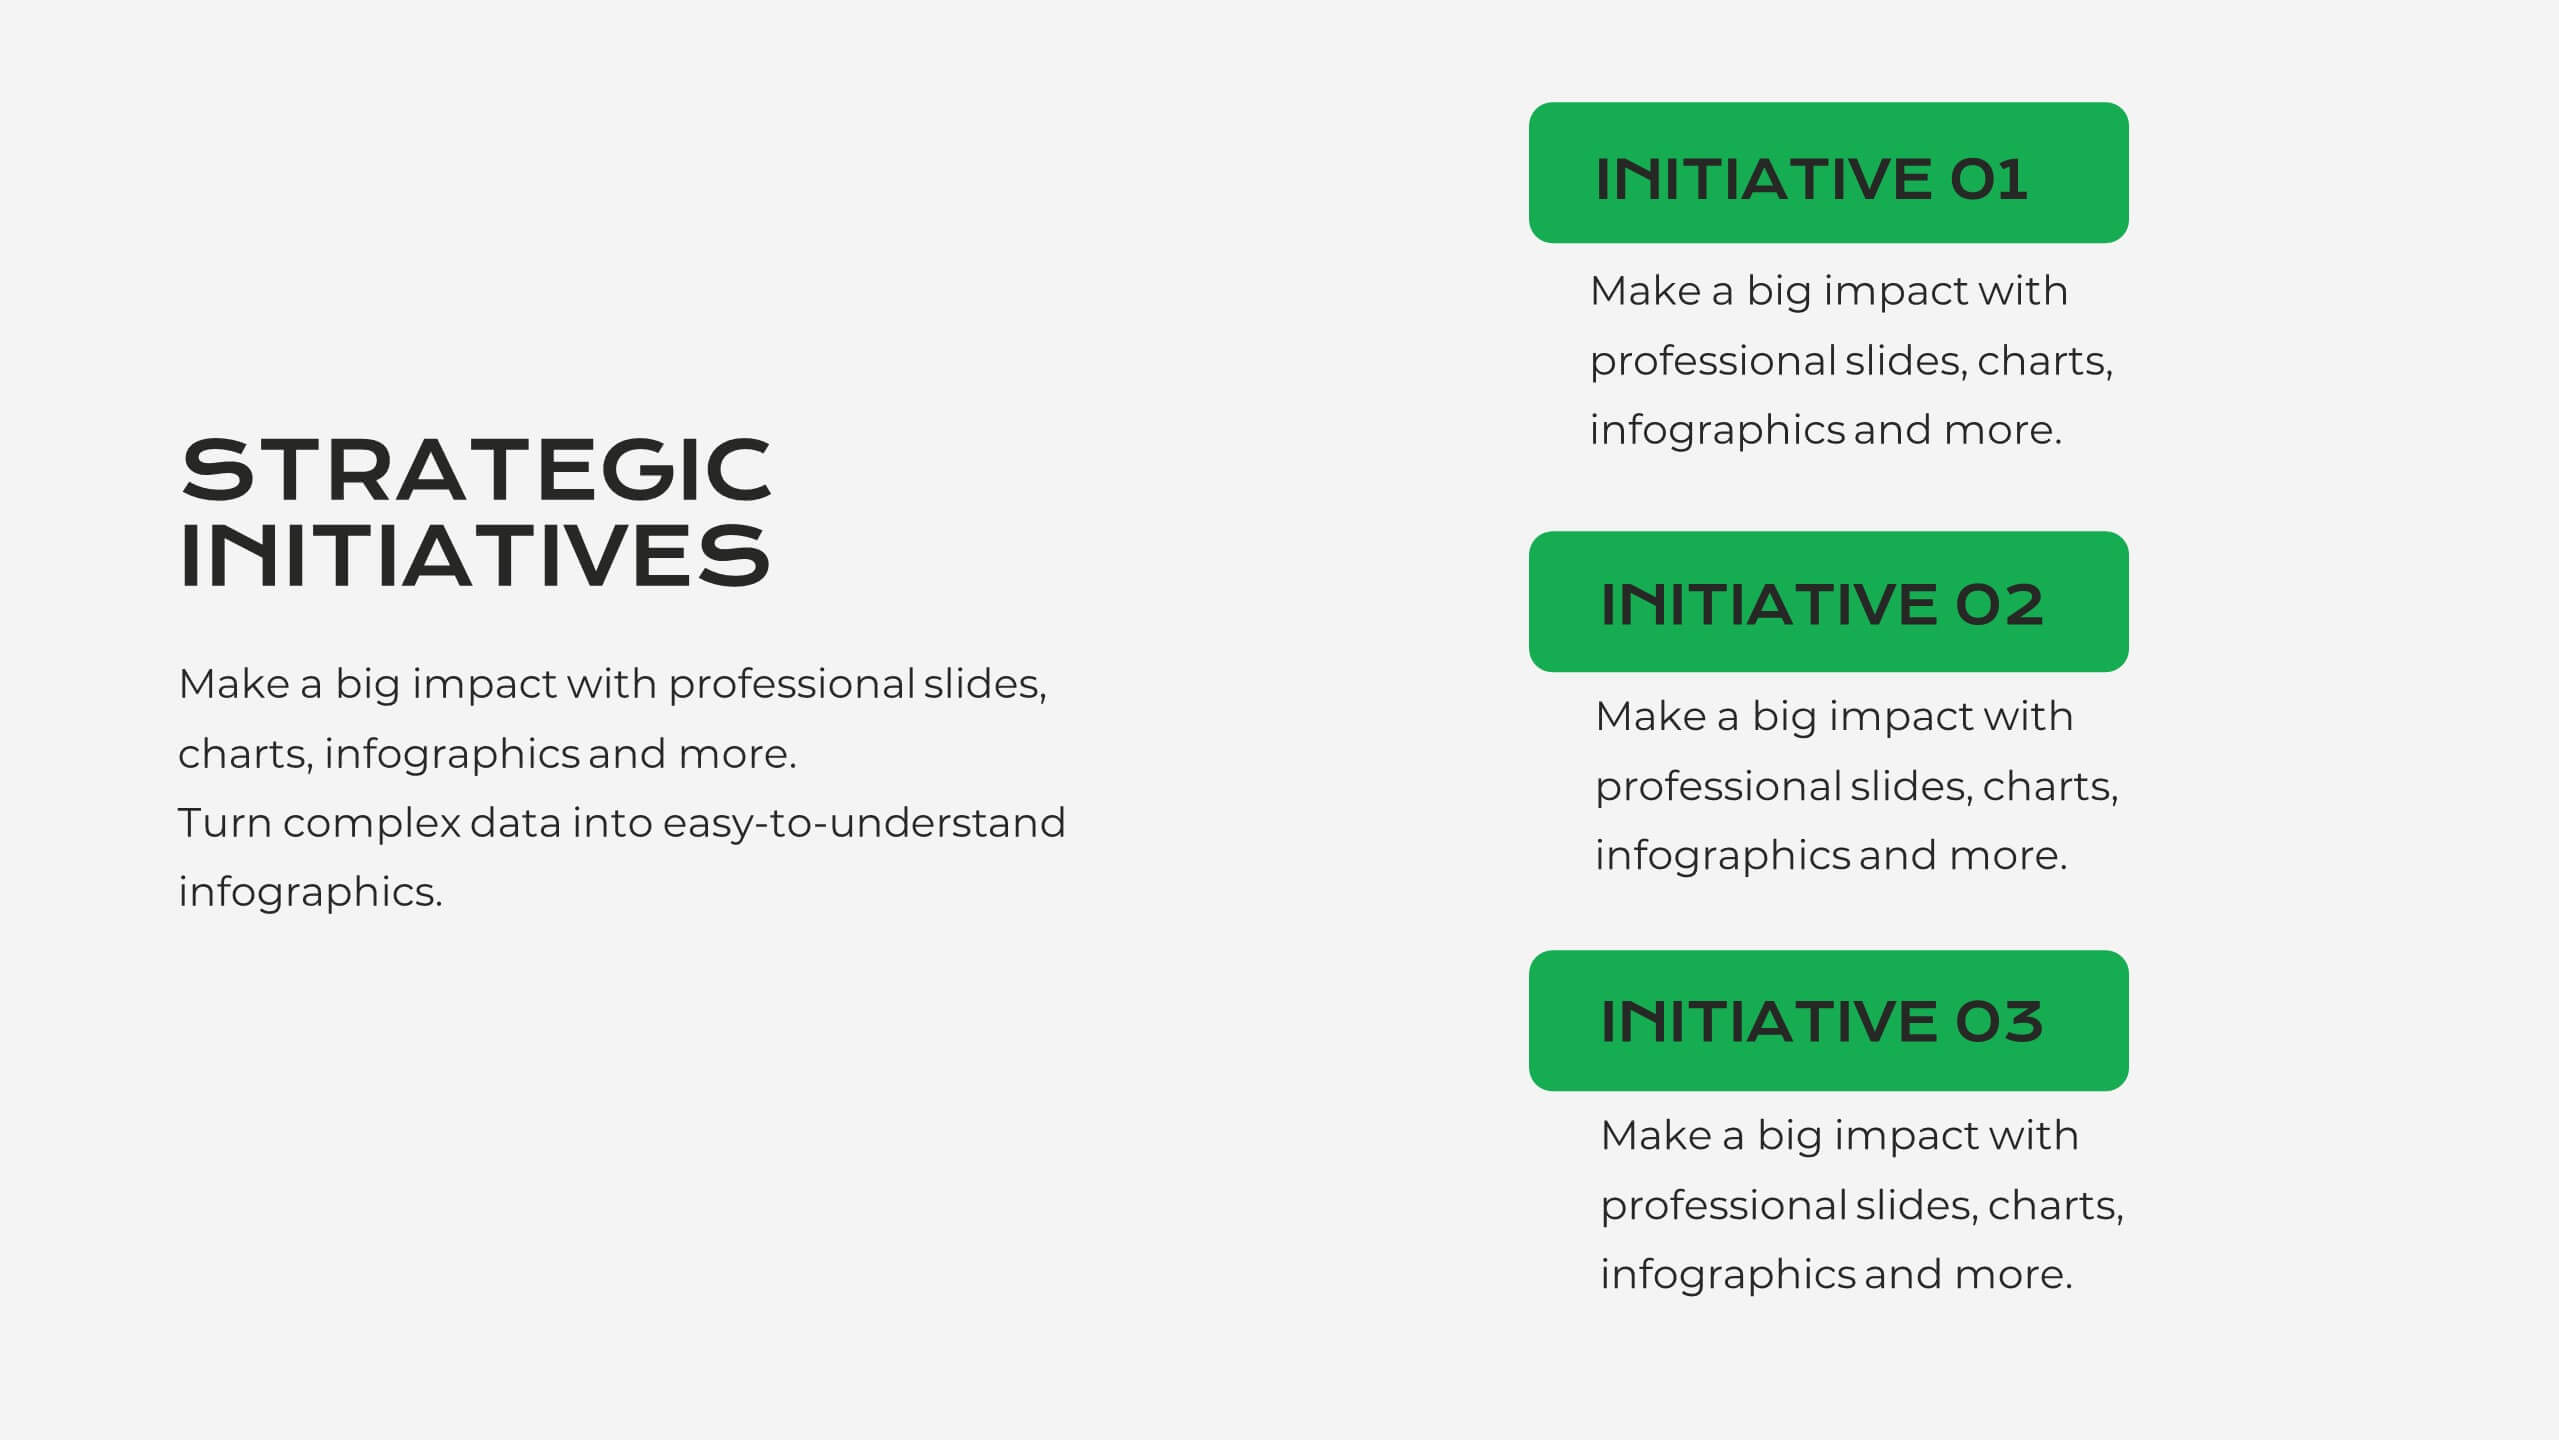
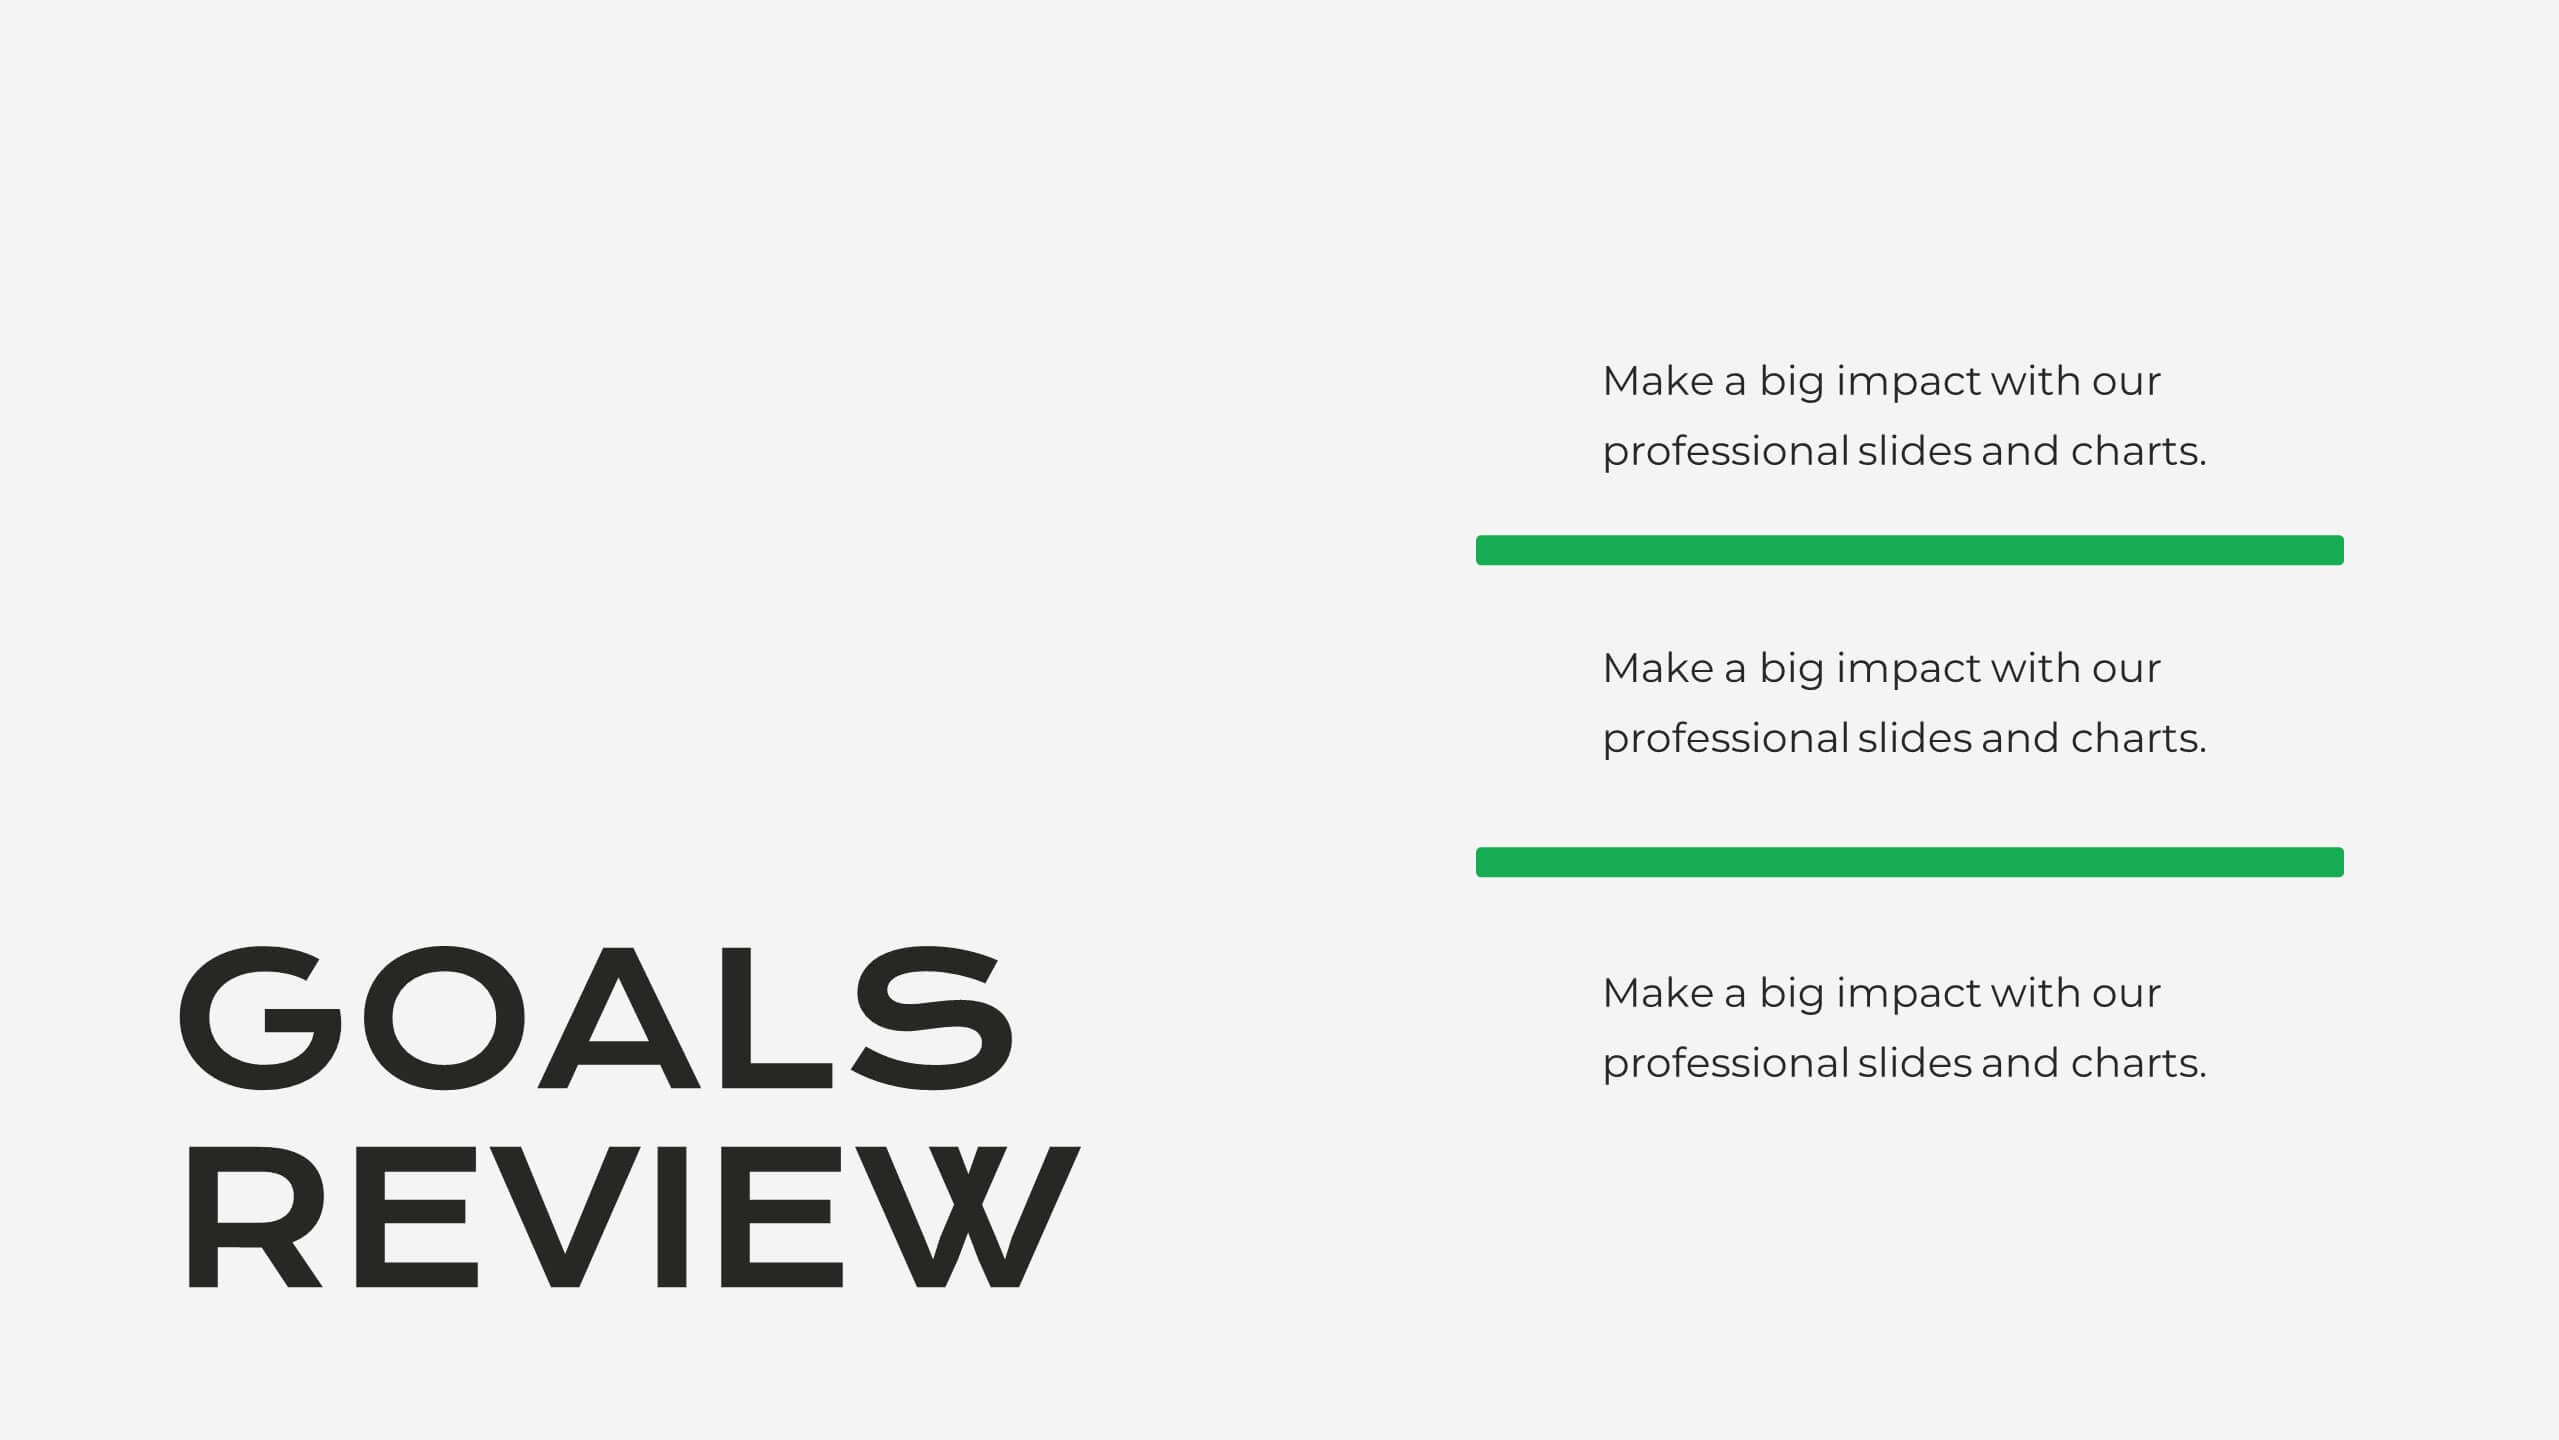
Serene Market Analysis Report Presentation
This modern and clean Market Analysis Report template is designed to help you present key data and insights with clarity and impact. Ideal for business professionals and analysts, it includes slides for key highlights, performance metrics, financial summaries, competitor insights, and strategic initiatives. The template's sleek layout ensures that your data is easy to understand and visually appealing, making it perfect for internal reports or client presentations. Customize it effortlessly in PowerPoint, Keynote, or Google Slides, and impress your audience with a polished and professional report.


10 diapositivas
Quality Control with Six Sigma Framework Presentation
Enhance quality management with this Six Sigma Framework template. Highlight each phase—Define, Measure, Analyze, Improve, Control—in a clean, modern layout for effective presentations. Ideal for quality assurance teams, process analysts, and Six Sigma professionals. Fully editable in PowerPoint, Keynote, and Google Slides to match your brand and insights.


6 diapositivas
Strategic Objective Planning Presentation
Present your Strategic Objective Planning with this powerful, chess-themed presentation template. Highlight competitive strategies, goal alignment, and decision-making with visually engaging chess piece graphics. Ideal for corporate strategy, business planning, and leadership presentations. Compatible with PowerPoint, Keynote, and Google Slides.


5 diapositivas
Breast Cancer Treatment Infographics
Breast cancer is a type of cancer that develops in the breast cells. These vertical infographics serve as a valuable resource for healthcare professionals, patients, advocacy groups, and educational institutions involved in breast cancer awareness and support. They provide a visually engaging and informative overview of common causes, different treatment options, stages, side effects, survivorship, and ongoing research in breast cancer treatment. This template will help you convey crucial information in a clear manner, empowering individuals with knowledge about breast cancer treatment options and fostering informed decision-making.


26 diapositivas
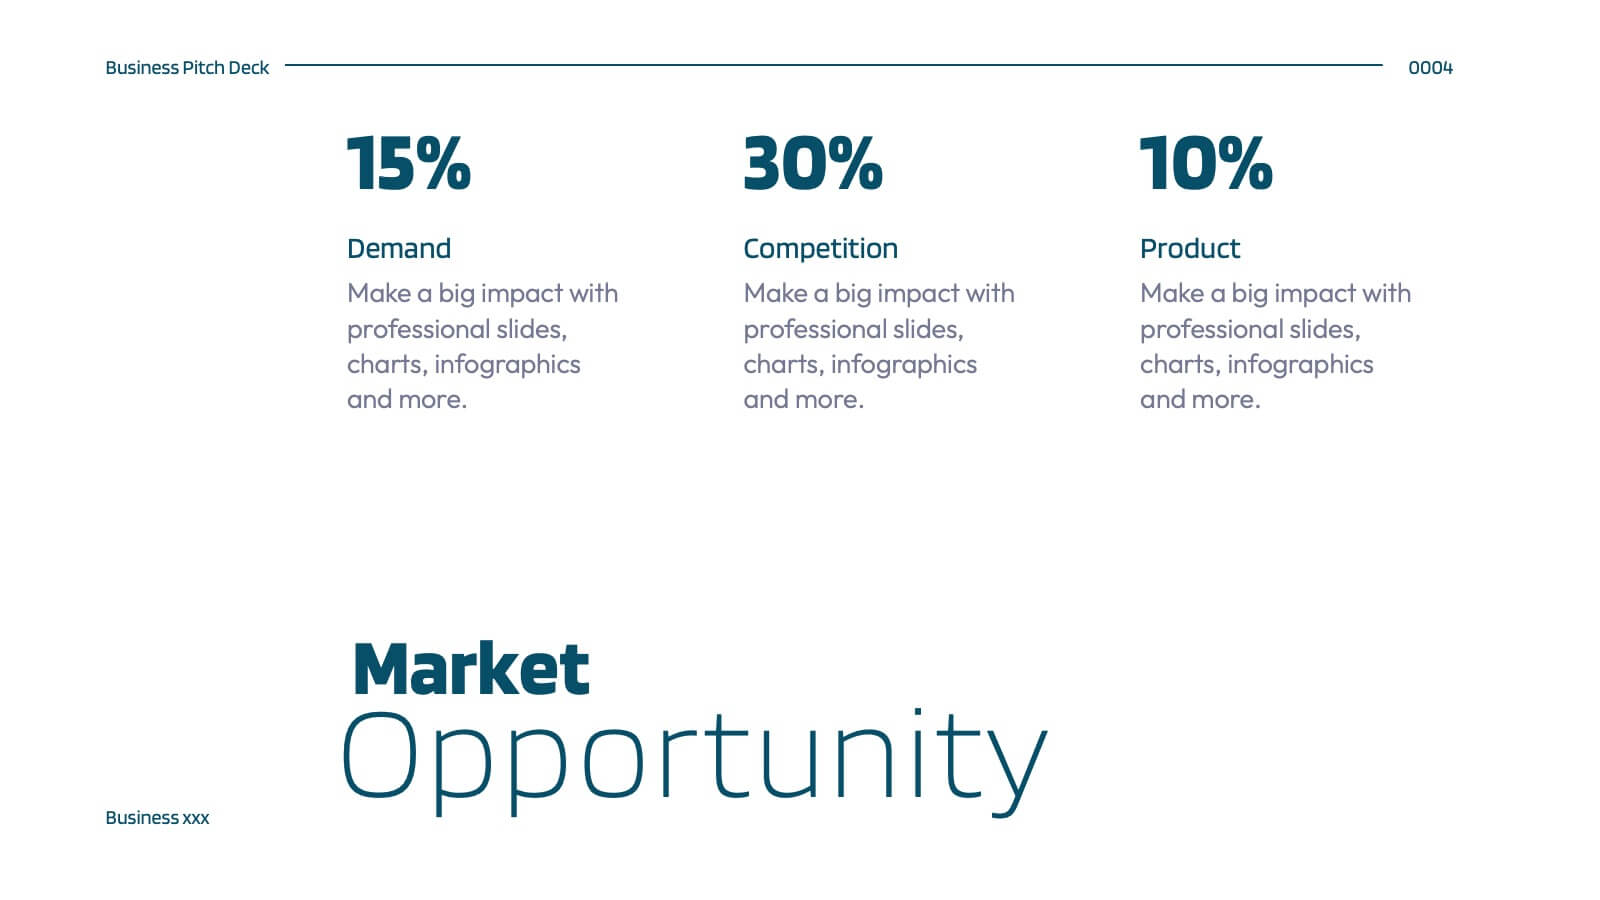
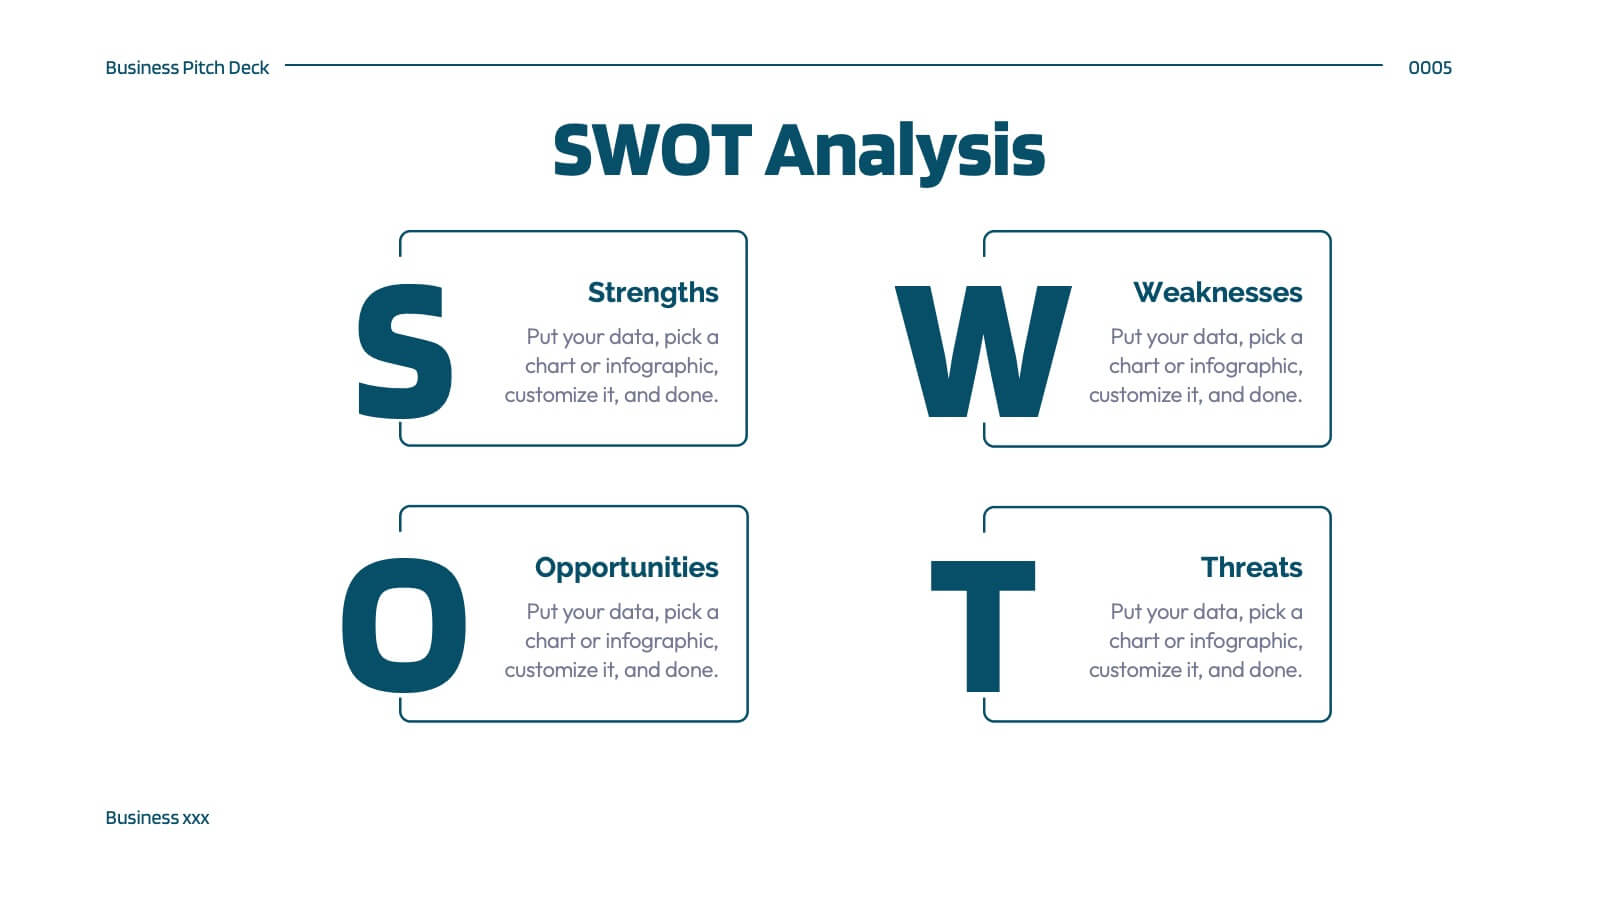
Startup Presentation
Elevate your startup's story with this Startup Presentation template. It features slides for your mission, innovation highlights, market analysis, and growth strategy. Perfect for engaging potential investors and partners. This versatile template is compatible with PowerPoint, Keynote, and Google Slides, making it easily accessible for all your presentation needs.

21 diapositivas
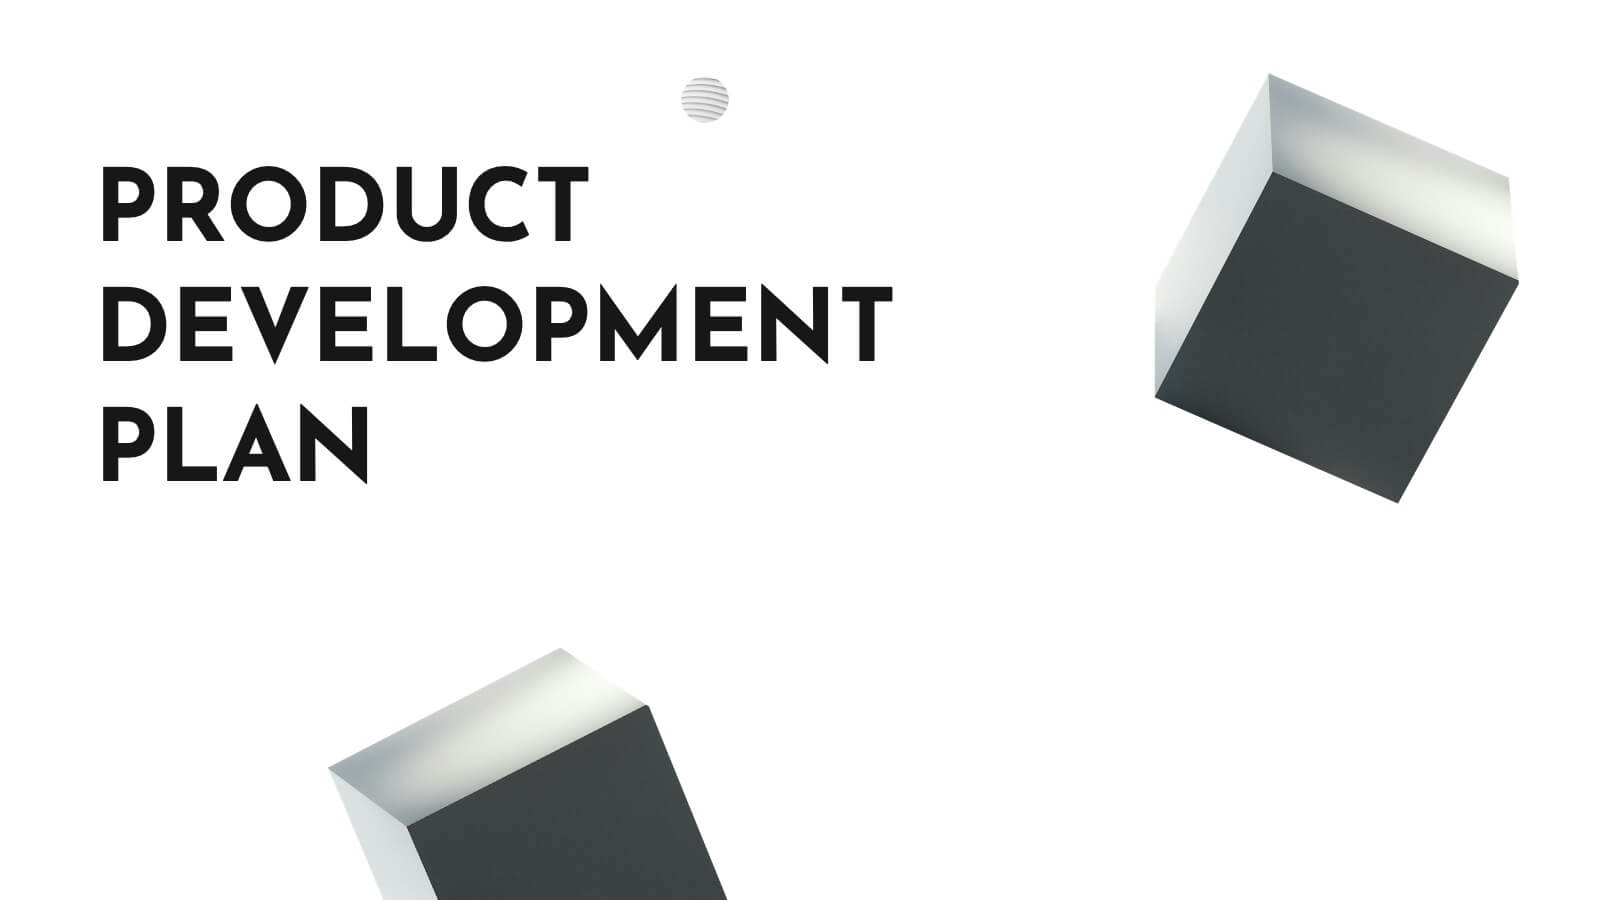
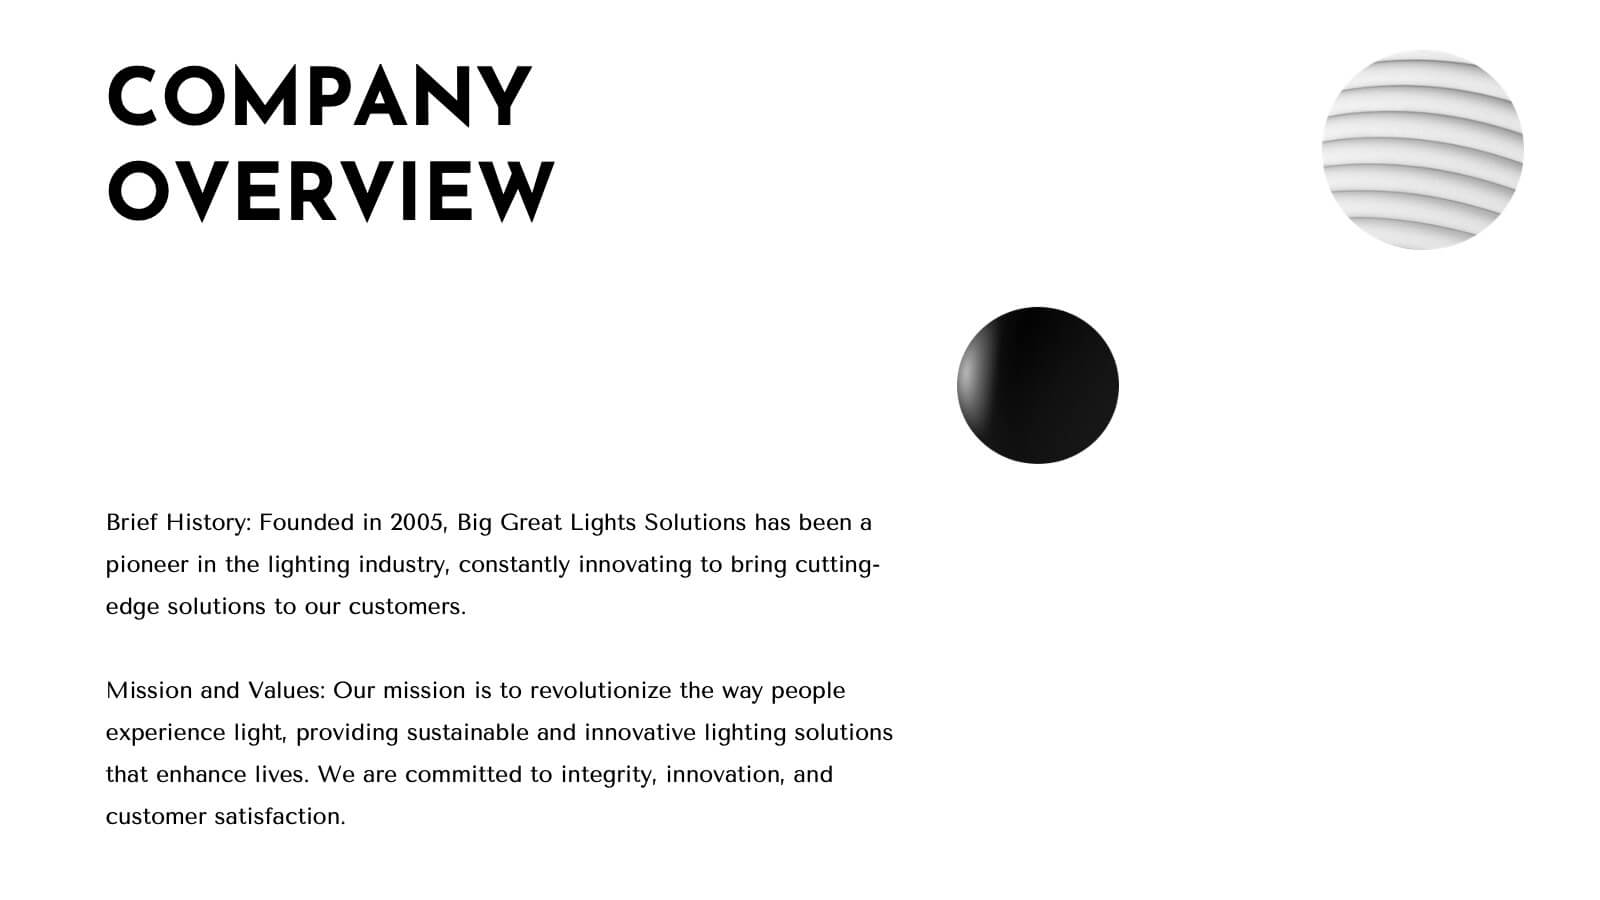
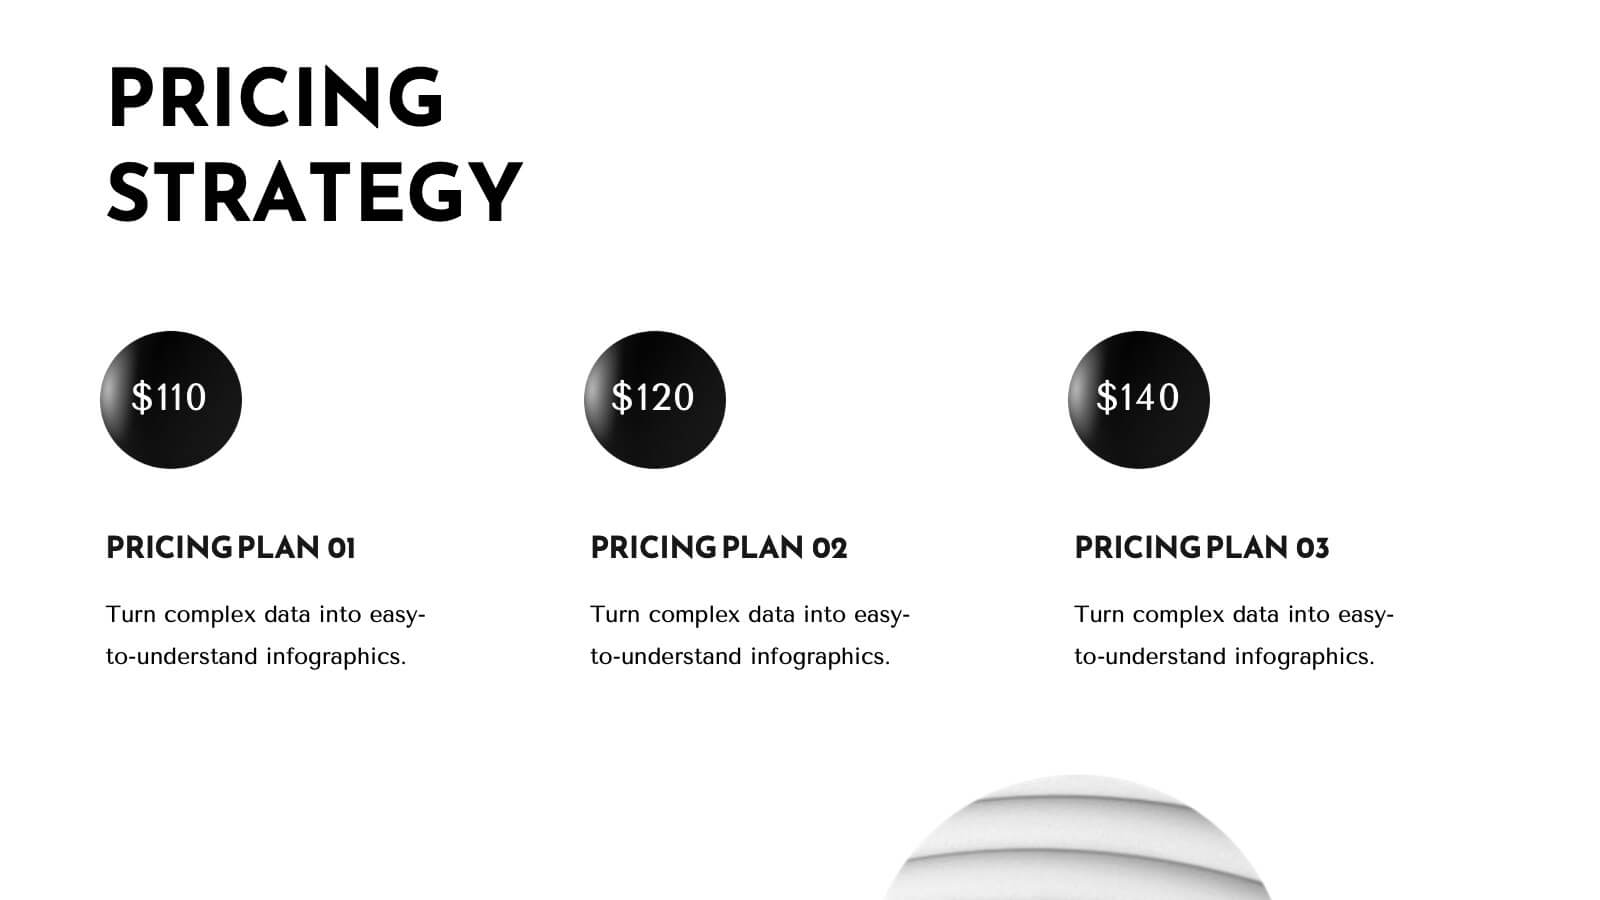
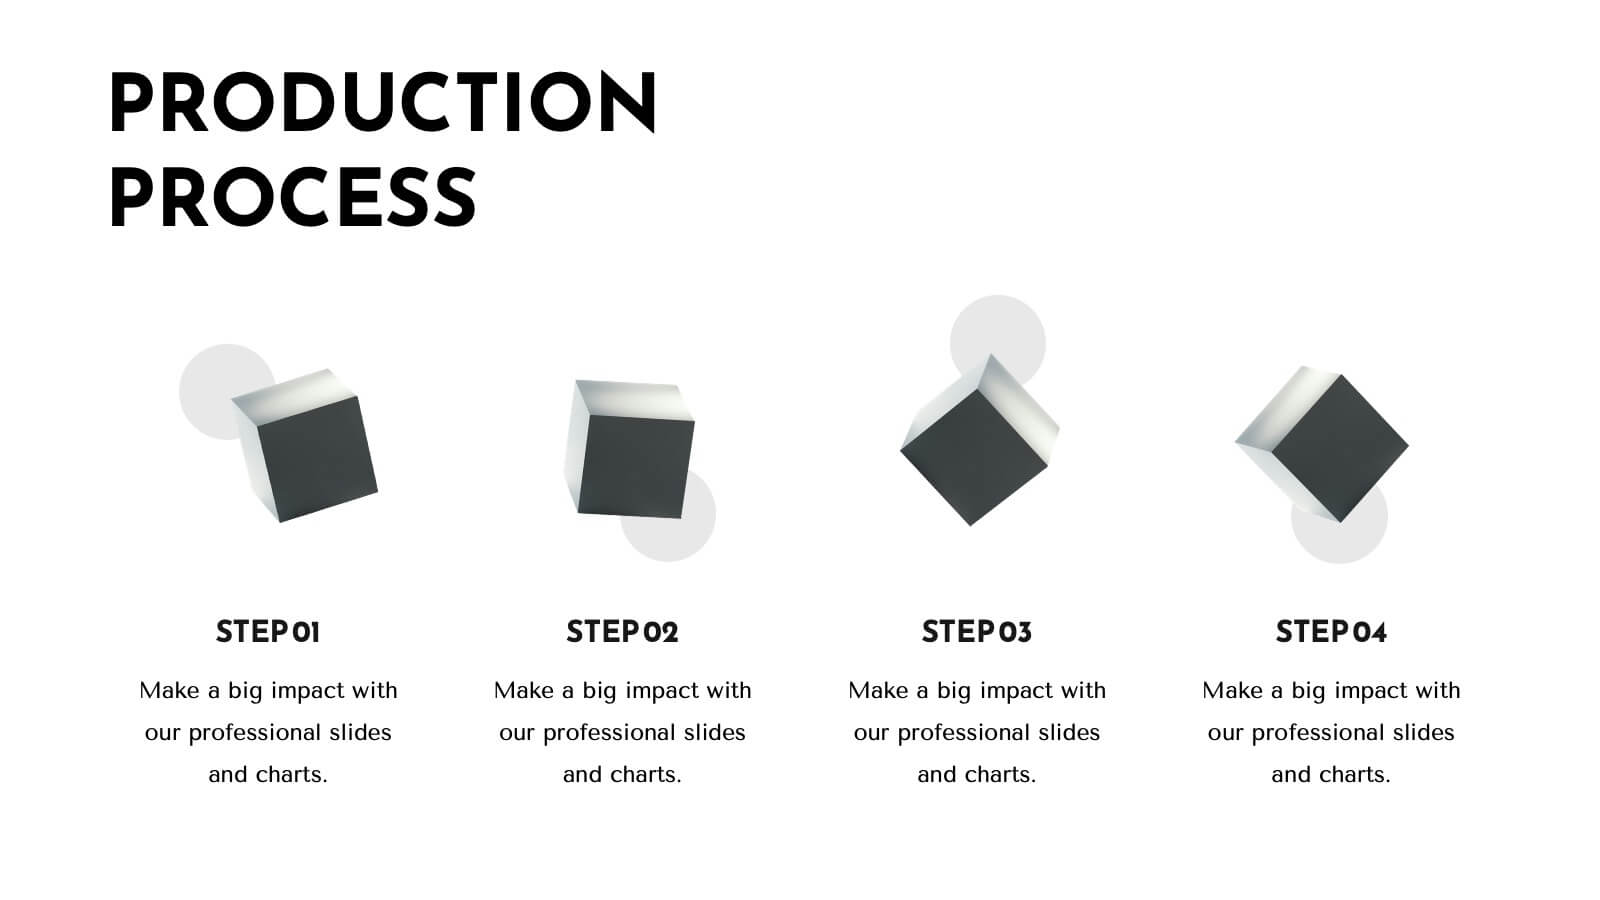
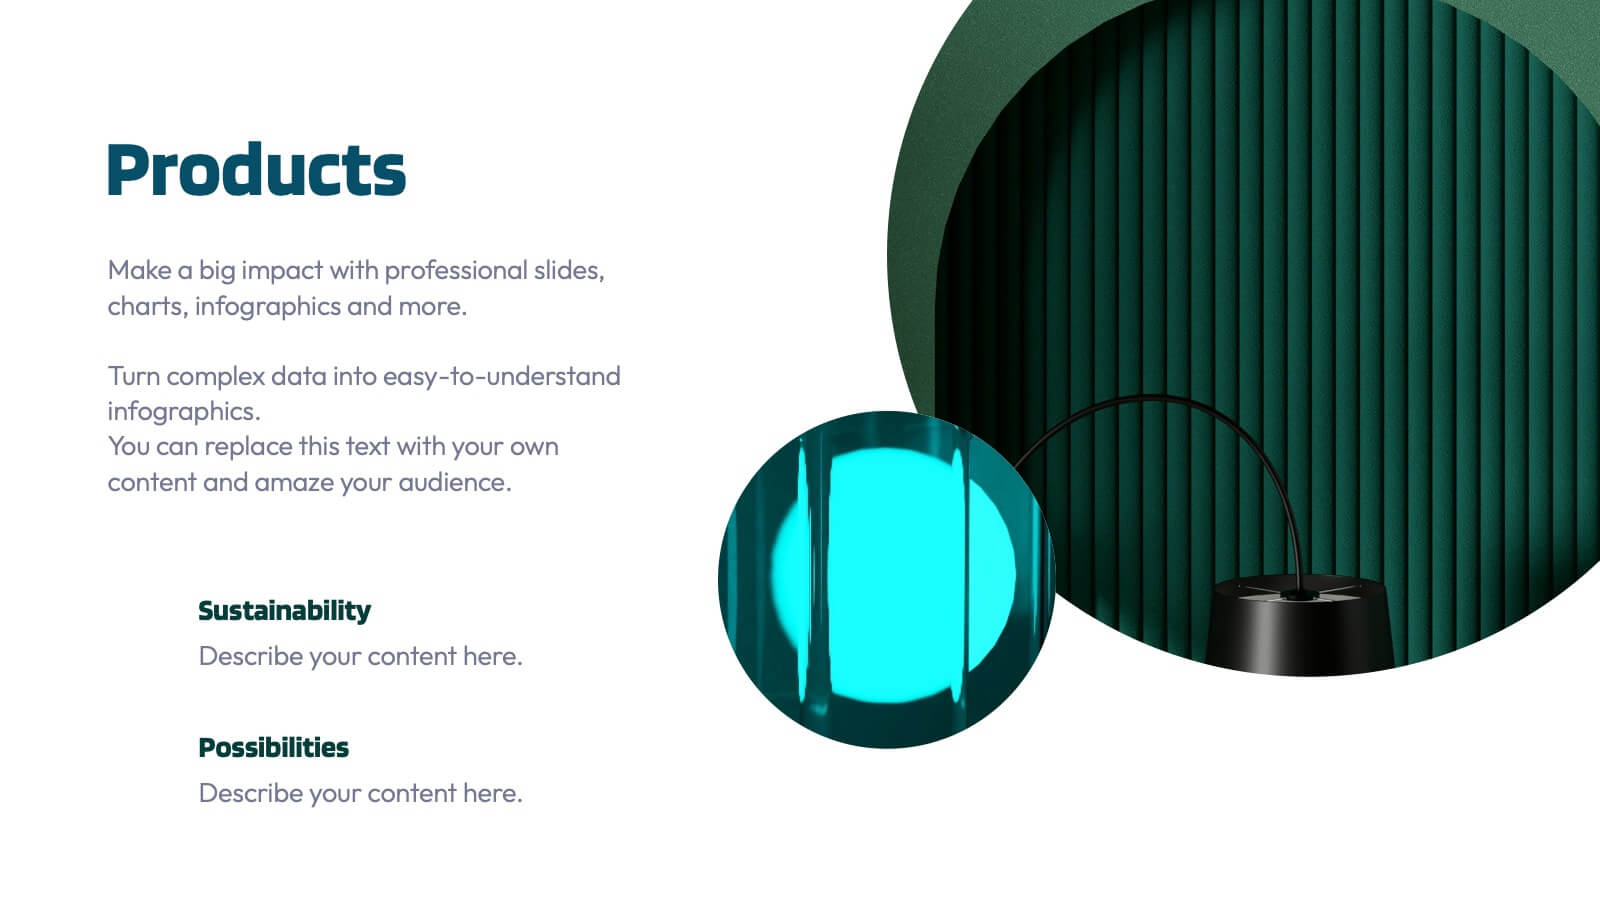
Trident Product Development Plan Presentation
Present your product development strategy with this sleek, professional template! Highlight company overview, product features, and unique selling proposition. Ideal for showcasing market analysis, pricing strategy, and production process. Perfect for developers and project managers. Compatible with PowerPoint, Keynote, and Google Slides.


4 diapositivas
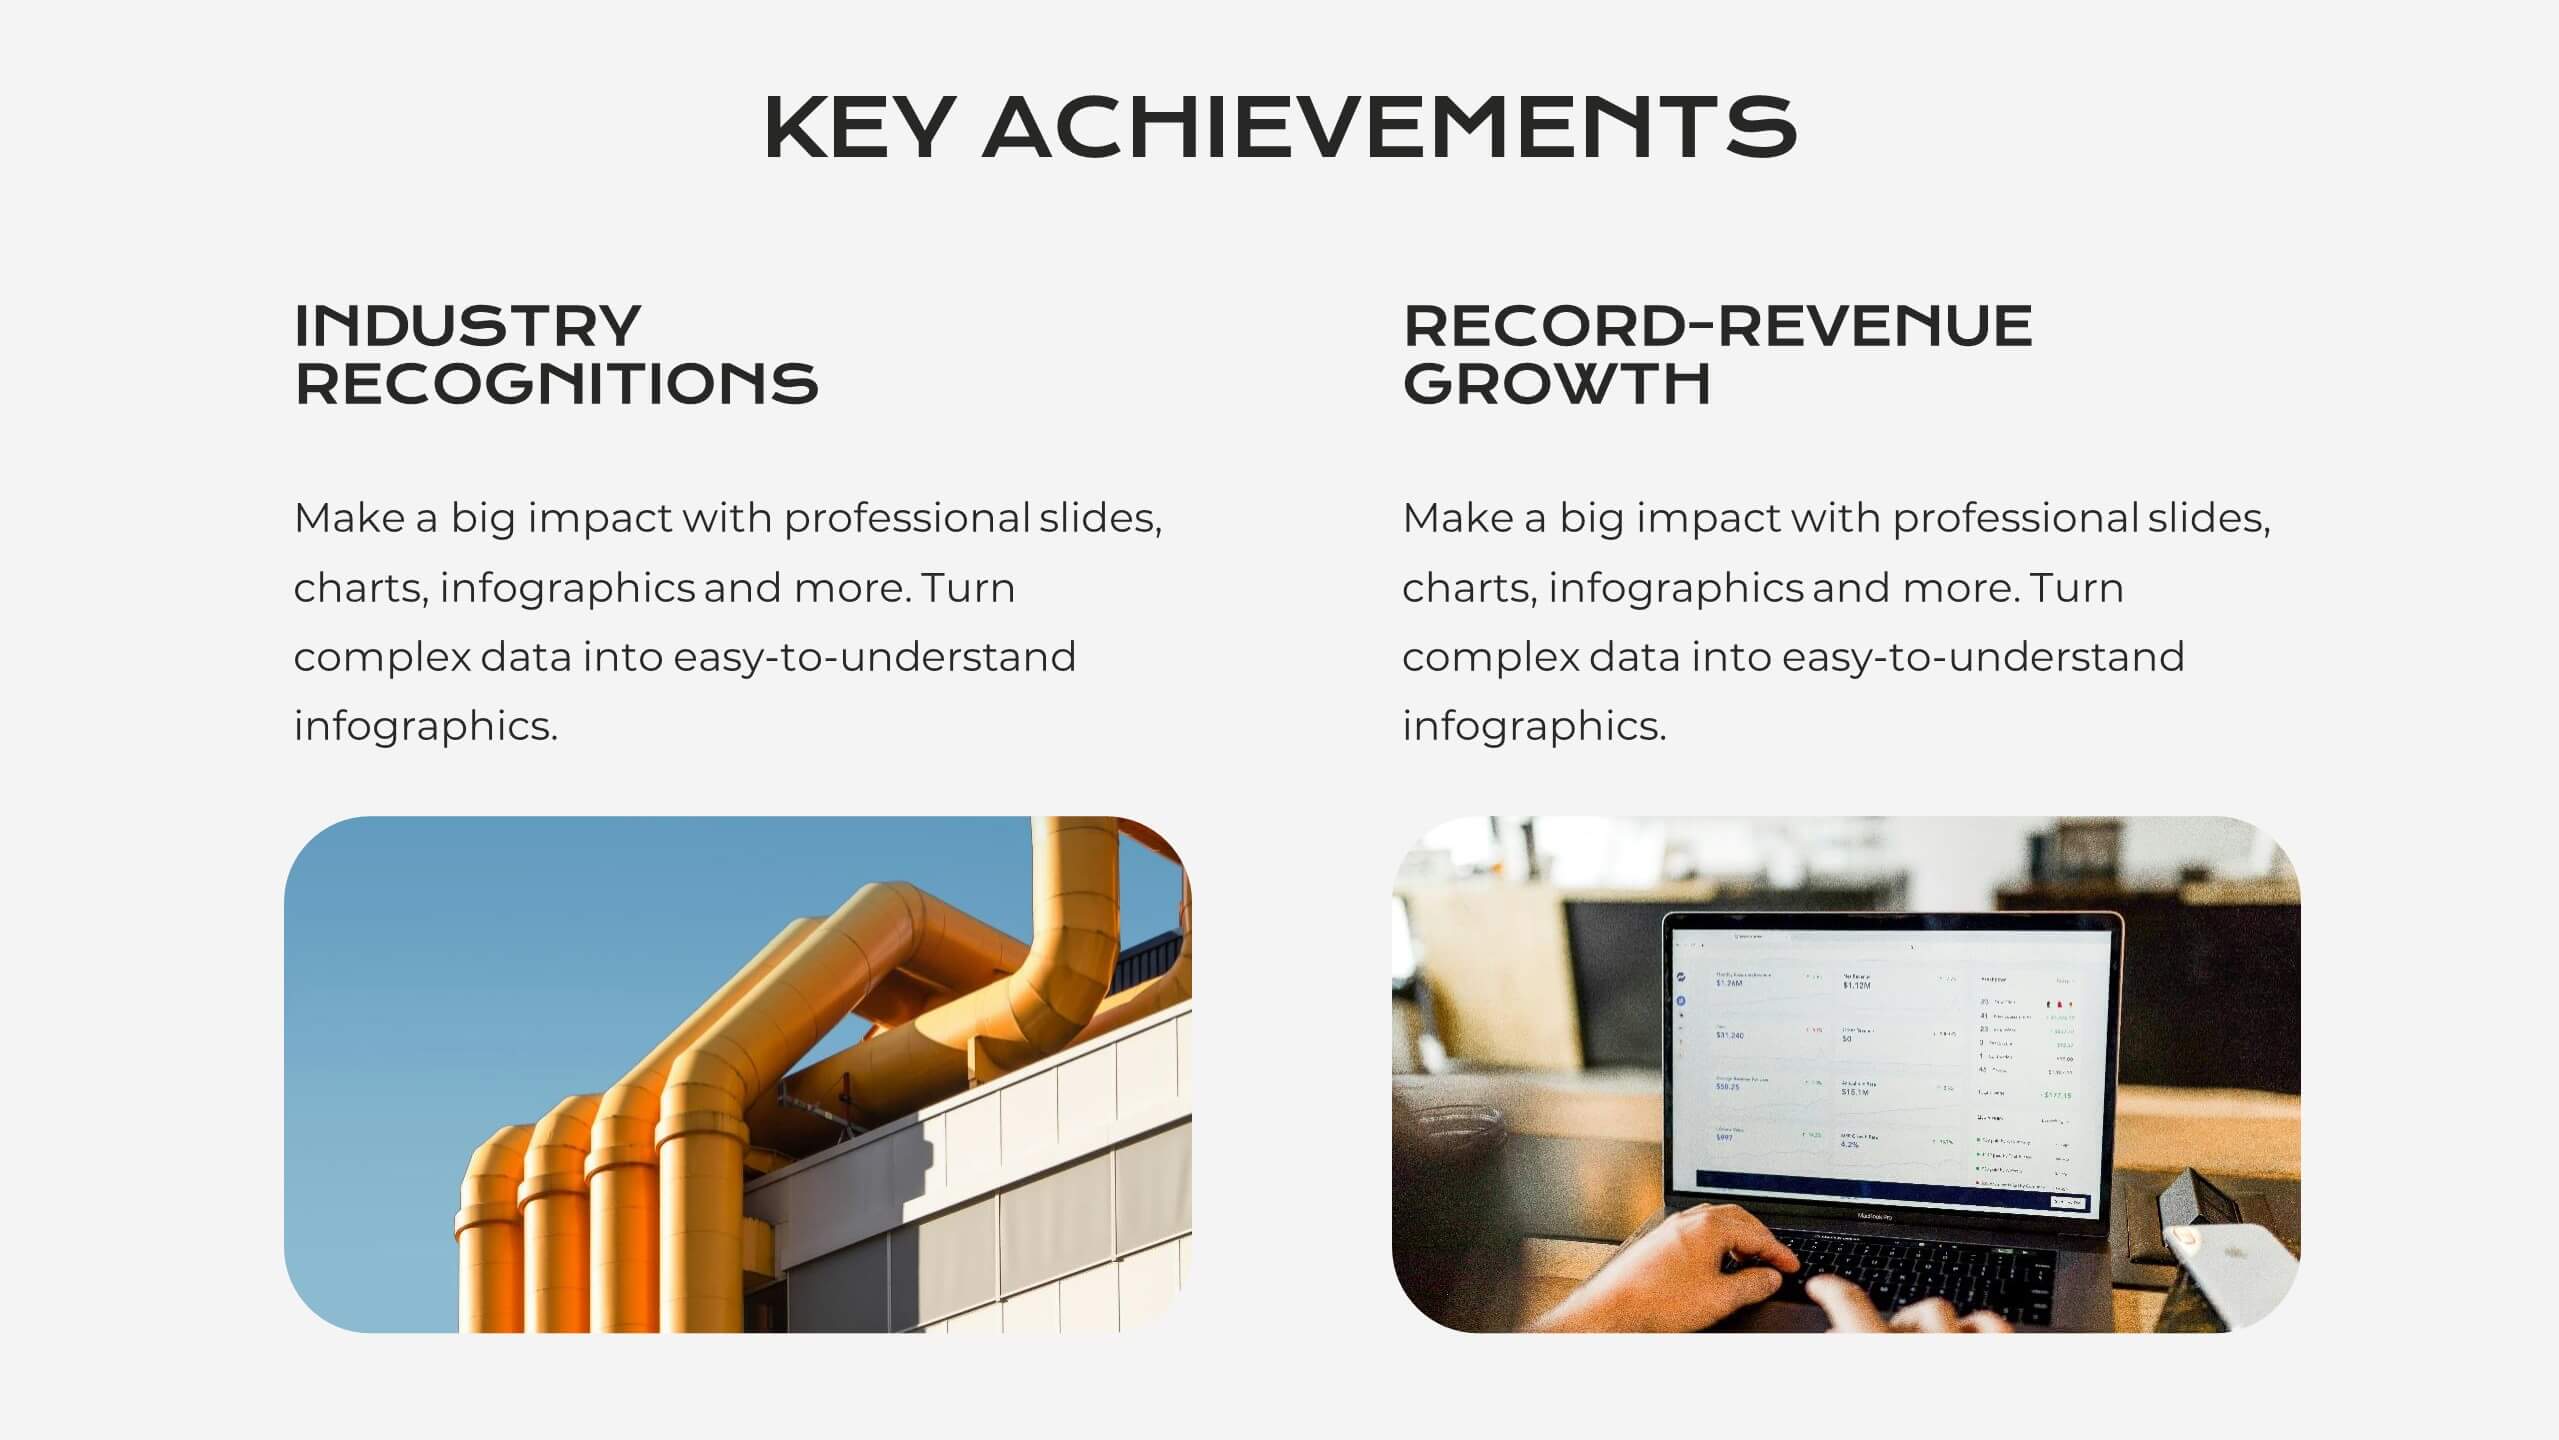
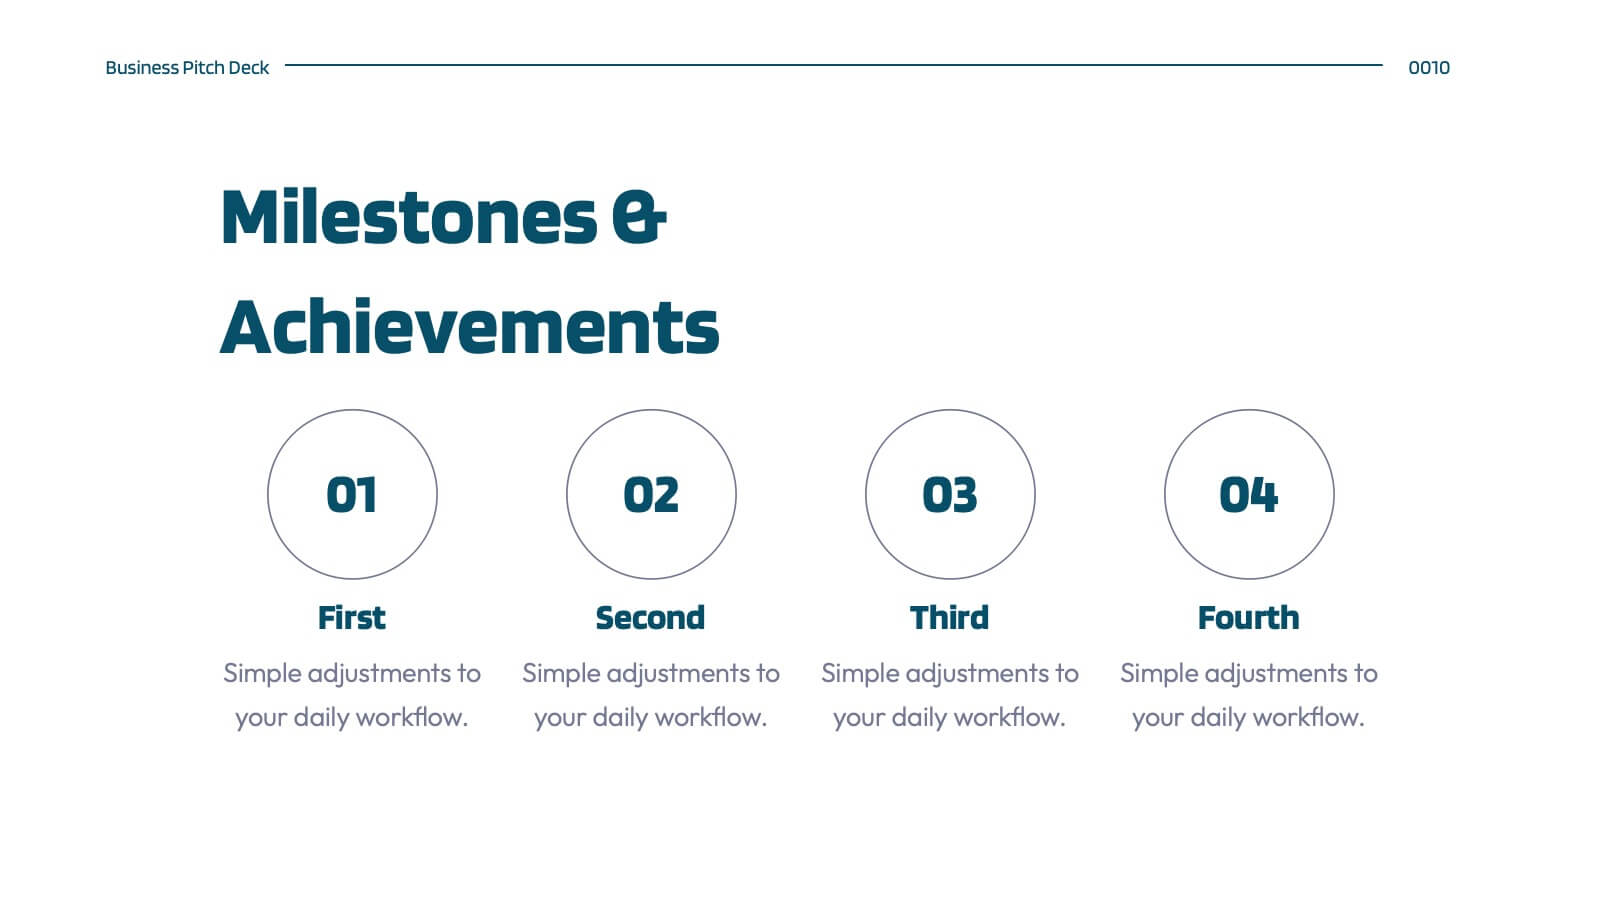
Corporate Portfolio of Achievements Presentation
Present your professional milestones with this sleek, image-focused layout. Featuring a large photo placeholder and three clearly defined highlights, this slide is ideal for showcasing company achievements or project phases. Fully editable in PowerPoint, Keynote, and Google Slides—perfect for client updates, internal reviews, or corporate storytelling.


10 diapositivas
Startup Executive Overview Template Presentation
Bring your startup’s big picture to life in one smart, visual swoop! This infographic presentation template helps you map out key insights and milestones in a clean, modern layout. Ideal for pitching ideas, aligning teams, or showcasing growth strategies. Fully compatible with PowerPoint, Keynote, and Google Slides for easy editing.


26 diapositivas
Jenna Presentation Template
Want to let your customers know how your services can help with their interior design needs? The Jenna template features attractive images of different room designs, color palettes, services, and lighting concepts that this business can help you with. This presentation uses soft pastel colors and a clean design so that potential clients can focus on the importance of your services. With its eye-catching graphics, informative content, and organized structure, this presentation template will engage and inspire your audience as you present your ideas for creating beautiful, functional interior spaces.


5 diapositivas
Business Cycle and Wheel Diagram
Illustrate key stages, continuous workflows, or strategic frameworks with this circular business diagram. Ideal for visualizing four connected steps in a clean, modern style. Easily editable in PowerPoint, Keynote, and Google Slides for full customization.


10 diapositivas
Sustainable Farming Practices
Present eco-friendly agricultural strategies with this visually structured layout. Featuring a linear process flow and eco-themed icons, this slide is ideal for outlining key sustainability practices, steps, or phases. Use it for presentations on regenerative agriculture, organic farming, or environmental policy. Fully editable in PowerPoint, Keynote, and Google Slides.

22 diapositivas
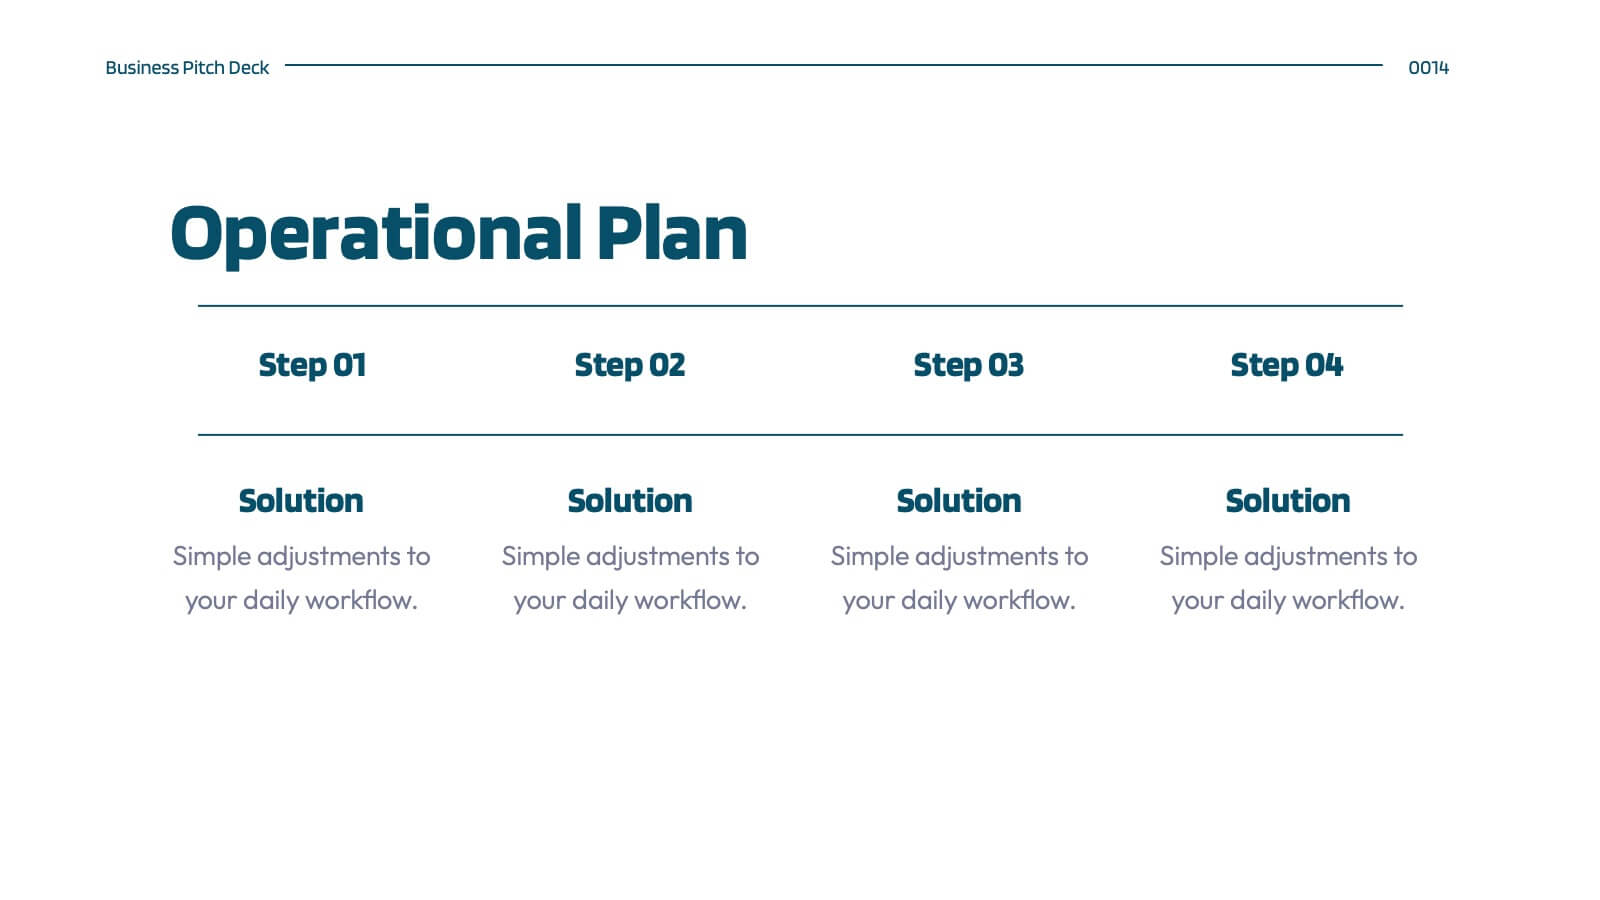
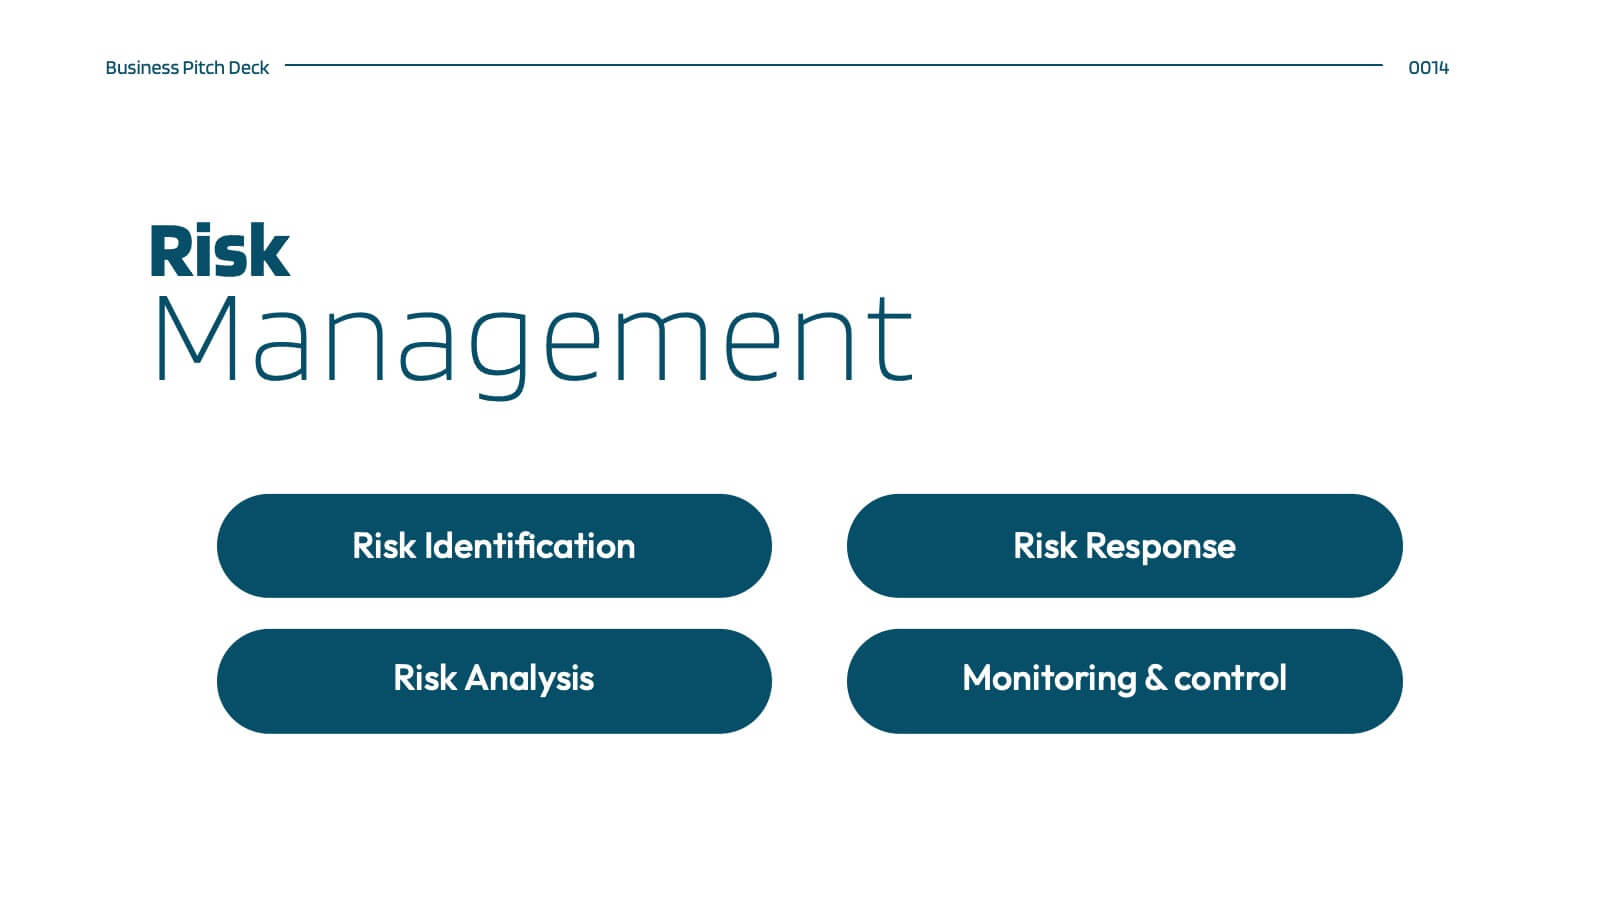
Hellenic Small Business Pitch Deck Presentation
Unleash the spirit of entrepreneurship with this captivating Hellenic-themed presentation! Designed specifically for small business pitches, this template allows you to showcase your business concept, market analysis, and financial plans with elegance and clarity. Its vibrant visuals will engage your audience and leave a lasting impression. Compatible with PowerPoint, Keynote, and Google Slides.


8 diapositivas
Beginner's Guide to Stock Market Presentation
Turn complex financial ideas into simple, engaging visuals with this sleek, data-driven design. Perfect for explaining market basics, investment growth, and trading concepts in a way that’s easy to follow and visually appealing. Fully compatible with PowerPoint, Keynote, and Google Slides for effortless editing and presentation customization.


7 diapositivas
Professional Goals Infographic
Unfold the pathway to success with our professional goals infographic. Designed to help individuals and organizations visualize and track their aspirations, this infographic offers a comprehensive look at professional milestones and strategies to achieve them. The primary palette revolves around a pristine white backdrop, enhanced by accents of vibrant orange and a mix of complementary colors to distinguish different areas. Its design ensures seamless integration into PowerPoint, Keynote, or Google Slides presentations, transforming your professional goals discourse into a visually engaging experience.


12 diapositivas
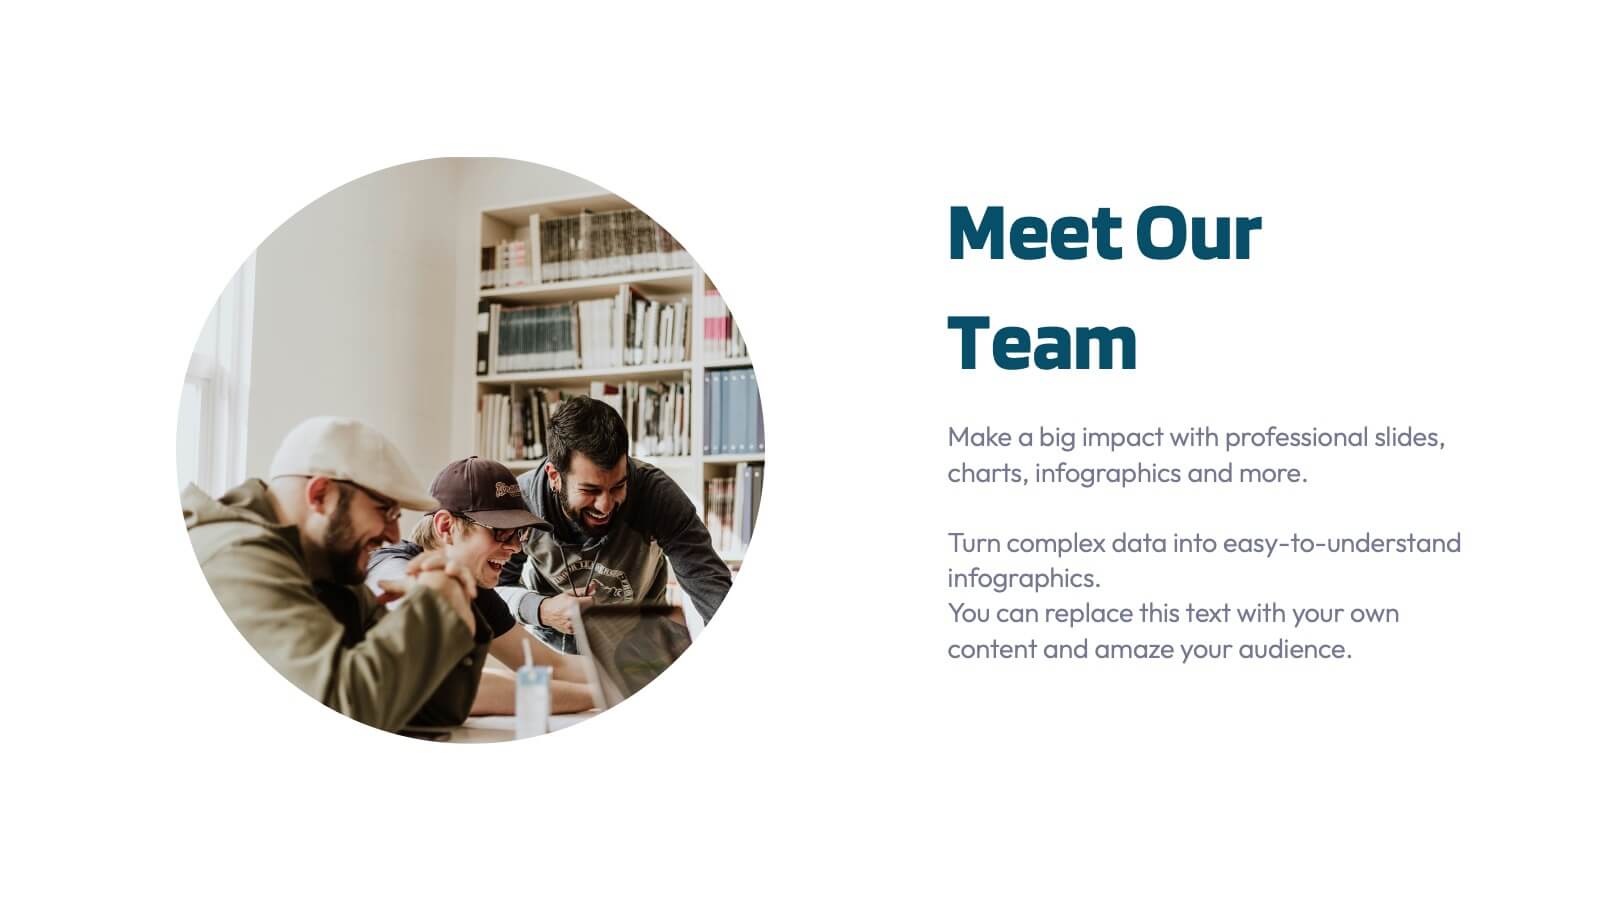
Personal Portfolio Presentation
Our Personal Portfolio Presentation template is designed for professionals looking to make a strong impression with a sleek and engaging portfolio. This comprehensive template provides an excellent framework to showcase your personal brand, professional journey, and achievements. The opening slide, with your name boldly presented, acts as your introduction. It's followed by a 'Get to know me' section that offers a glimpse into your personality and work ethic. The 'Skills' slide is a visually impactful way to present your competencies, while the 'Experience' slide chronologically outlines your professional milestones. Featuring sections for detailed case studies, showcased projects, and educational background, this template helps you tell your story in a cohesive and captivating manner. The 'Recognitions' slide allows you to highlight awards and honors, adding credibility to your profile. Ending with a compelling 'Let's work together!' call-to-action, this template is adaptable to PowerPoint, Keynote, and Google Slides, perfect for anyone looking to stand out in their field.