


Características


¿Tienes alguna pregunta?
Recomendar


7 diapositivas
Porters Five Forces Model Infographic Presentation
Porter's Five Forces Model is a structured framework used to analyze the competitive forces within an industry and their impact on a company's profitability. With template you can create an appealing and informative infographic about Porter's Five Forces Model. Featuring helpful illustrations and easy-to-read text, this template is perfect for breaking down the complex concepts of Porter's Five Forces Model into simple, understandable terms. Designed for use with Powerpoint, Keynote, and Google Slides, you can easily add your own content and tailor the template to fit your specific needs.


9 diapositivas
Statistics Dashboard Infographic
Dive into data with this comprehensive Statistics Dashboard Infographic, perfectly tailored for analysts, marketers, and business professionals. This dashboard provides a clear, visual representation of various statistical data through an assortment of charts, graphs, and metrics. The template features multiple panels, each dedicated to different aspects such as sales performance, customer behavior, financial health, and marketing results. Its design combines vibrant colors with a clean layout to highlight key information, making it easy to compare figures and track trends. Whether you need to present quarterly results, monitor project progress, or analyze marketing effectiveness, this infographic is an invaluable tool. It simplifies complex data into manageable visualizations, helping you convey critical insights effectively and make informed decisions based on solid statistical analysis.


10 diapositivas
Medical Anatomy Overview Presentation
Bring your audience into the world of medical insight with a slide that makes anatomy feel clear, modern, and easy to follow. This presentation highlights key organs and body systems in a clean visual layout, helping you explain health data with confidence. Fully compatible with PowerPoint, Keynote, and Google Slides.


7 diapositivas
Annual Credit Report Infographic Presentation
An Annual Report Infographic is a visual representation of the key information contained in a company's annual report. This template can be used to provide detailed financial information, performance metrics, and other important data that shareholders and stakeholders need to assess a company's health and growth prospects. This infographic is a popular way to present your information in a more easily digestible and visually appealing format. Included in this template are graphs, charts, tables, icons, and other visual elements that help convey complex data in a clear and concise manner.


8 diapositivas
Business Problem Solution Presentation
Turn complex challenges into clear, visual insights with this sleek diagram designed to outline problems, root causes, and actionable solutions. Ideal for strategy meetings or proposal decks, it helps you communicate ideas with structure and impact. Fully compatible with PowerPoint, Keynote, and Google Slides for easy customization and presentation use.


5 diapositivas
Meet the Team Layout Presentation
Meet the team with a layout that feels fresh, upbeat, and effortlessly clear. This presentation helps you introduce key members, highlight roles, and showcase expertise in a clean, engaging format perfect for leadership updates or project kickoffs. Fully editable and compatible with PowerPoint, Keynote, and Google Slides.


6 diapositivas
Leadership and Business Teamwork Presentation
Drive results through synergy with this dynamic Leadership and Business Teamwork presentation slide. Designed with a six-part segmented pie chart, this layout helps visualize collaborative frameworks, team roles, or leadership models in an engaging way. Ideal for team workshops, leadership development, or strategic planning meetings. Easy to personalize in PowerPoint, Keynote, or Google Slides.


3 diapositivas
Hierarchy of Needs Pyramid Visual Presentation
Simplify complex priorities with this Hierarchy of Needs Pyramid Visual presentation. Designed to illustrate layered structures or business priorities, this editable 3D-style pyramid highlights three distinct tiers with customizable text and bold letter labels. Perfect for strategy slides or organizational models in Canva, PowerPoint, or Google Slides.


7 diapositivas
Mind Map Program Infographic Presentation
Mind Maps are appealing visuals that are easy to follow. Use our high quality template to create a mind map infographic that explains your concepts, or use it to highlight the benefits of your product in an educational way. Map out your ideas and create a visual that can be explored from many different directions. This template is suitable for both business and educational applications, so you can use it at work, school or as part of your portfolio. It’s easy to customize and compatible with PowerPoint, Keynote and Google Slides. Easily create a dynamic and engaging project in just minutes!


6 diapositivas
Statistics and Figures Report Presentation
Present complex data with clarity using the Statistics and Figures Report Presentation template. Featuring scatter plots, radar charts, and key metric highlights, this template is perfect for performance tracking, analytics reports, and business reviews. Fully customizable for PowerPoint, Keynote, and Google Slides, it ensures professional and insightful data visualization.


6 diapositivas
Workload Distribution and Calendar Plan Presentation
Stay on top of weekly responsibilities with the Workload Distribution and Calendar Plan Presentation. This visual planning template helps teams clearly assign tasks across days of the week, making it easy to organize schedules and boost productivity. Fully editable in PowerPoint, Keynote, and Google Slides.


10 diapositivas
Overcoming Market Challenges Presentation
Overcome business obstacles with confidence using this Overcoming Market Challenges template. Designed with a dynamic step-by-step growth visual, this slide helps illustrate challenges, solutions, and progress in an engaging way. Ideal for strategy meetings, financial forecasts, and competitive analysis, this template makes complex information easy to understand. Fully editable for PowerPoint, Keynote, and Google Slides.


4 diapositivas
Harvey Ball Ratings Presentation
Make your evaluations stand out with this sleek and intuitive presentation design. Perfect for rating performance, comparing metrics, or visualizing customer feedback, it brings clarity and visual balance to your data. Easily editable and fully compatible with PowerPoint, Keynote, and Google Slides for a smooth, professional presentation experience.


7 diapositivas
Standard Process Infographic
Streamline operations with clarity with our standard process infographic. This template is your ultimate tool for presenting complex processes in a clear, easy-to-understand manner. This infographic is designed to break down intricate procedures into visual, digestible segments. This includes a step-by-step diagram presenting each step clearly. Compatible with Powerpoint, Keynote, and Google Slides. Include a versatile color palette to choose from, matching your brand or adding visual interest. With this template you'll make even the most complicated processes understandable and actionable. Start streamlining your operations today!


10 diapositivas
Corporate Briefing Schedule Agenda
Present your briefing points clearly with the Corporate Briefing Schedule Agenda Presentation. This linear layout uses bold icons, color-coded sections, and connecting lines to outline four key discussion items—ideal for company meetings, timelines, or project updates. Fully editable in PowerPoint, Keynote, and Google Slides.


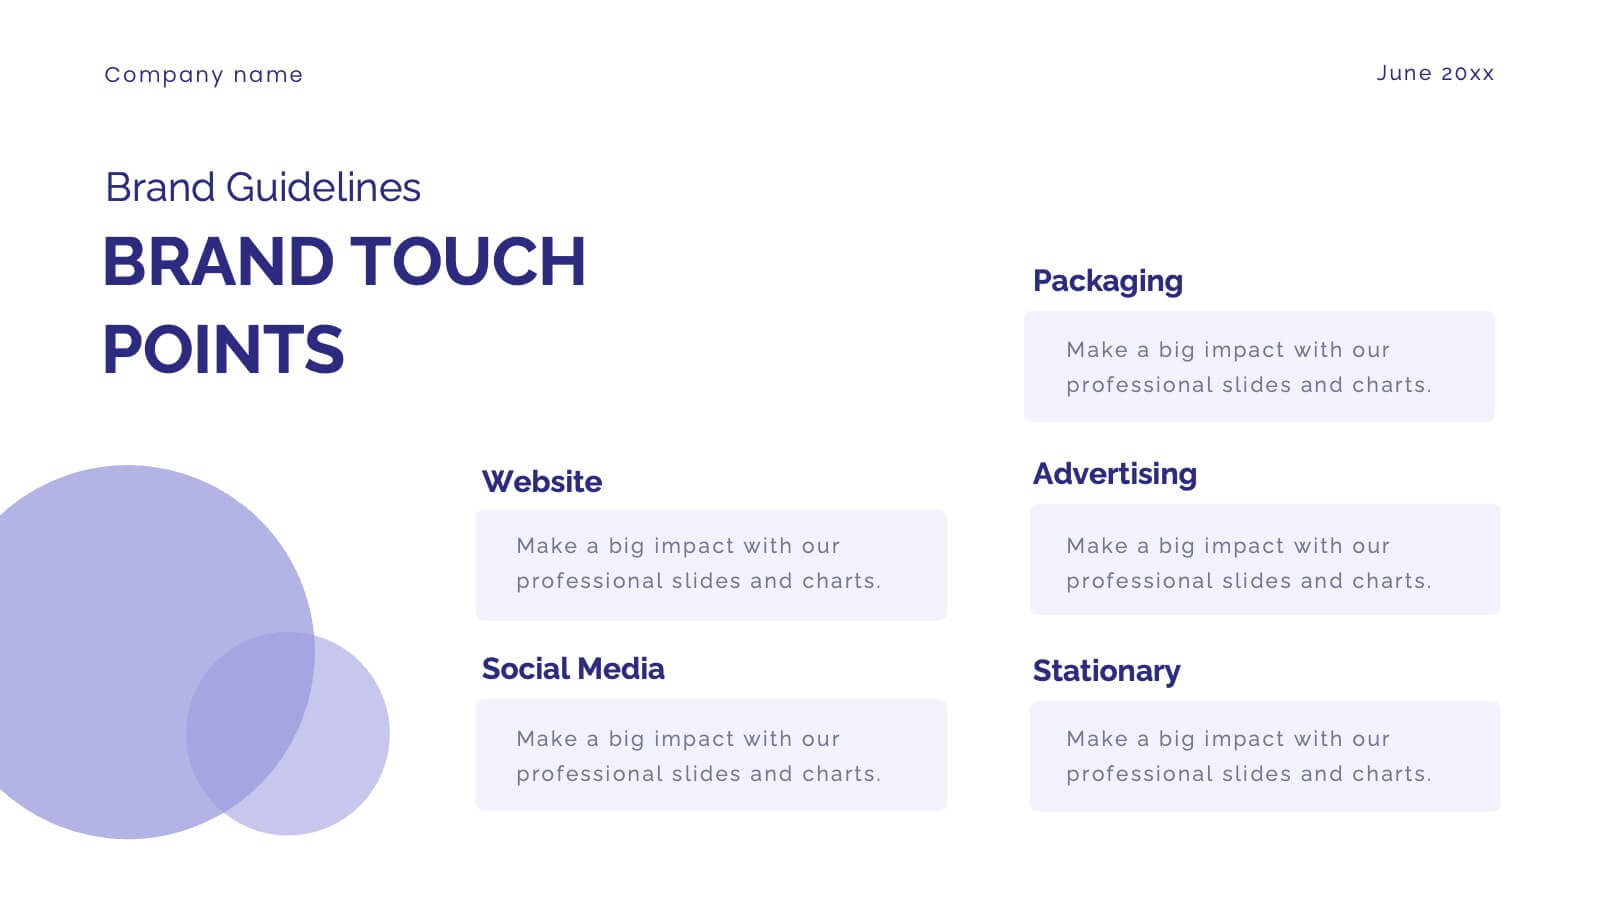
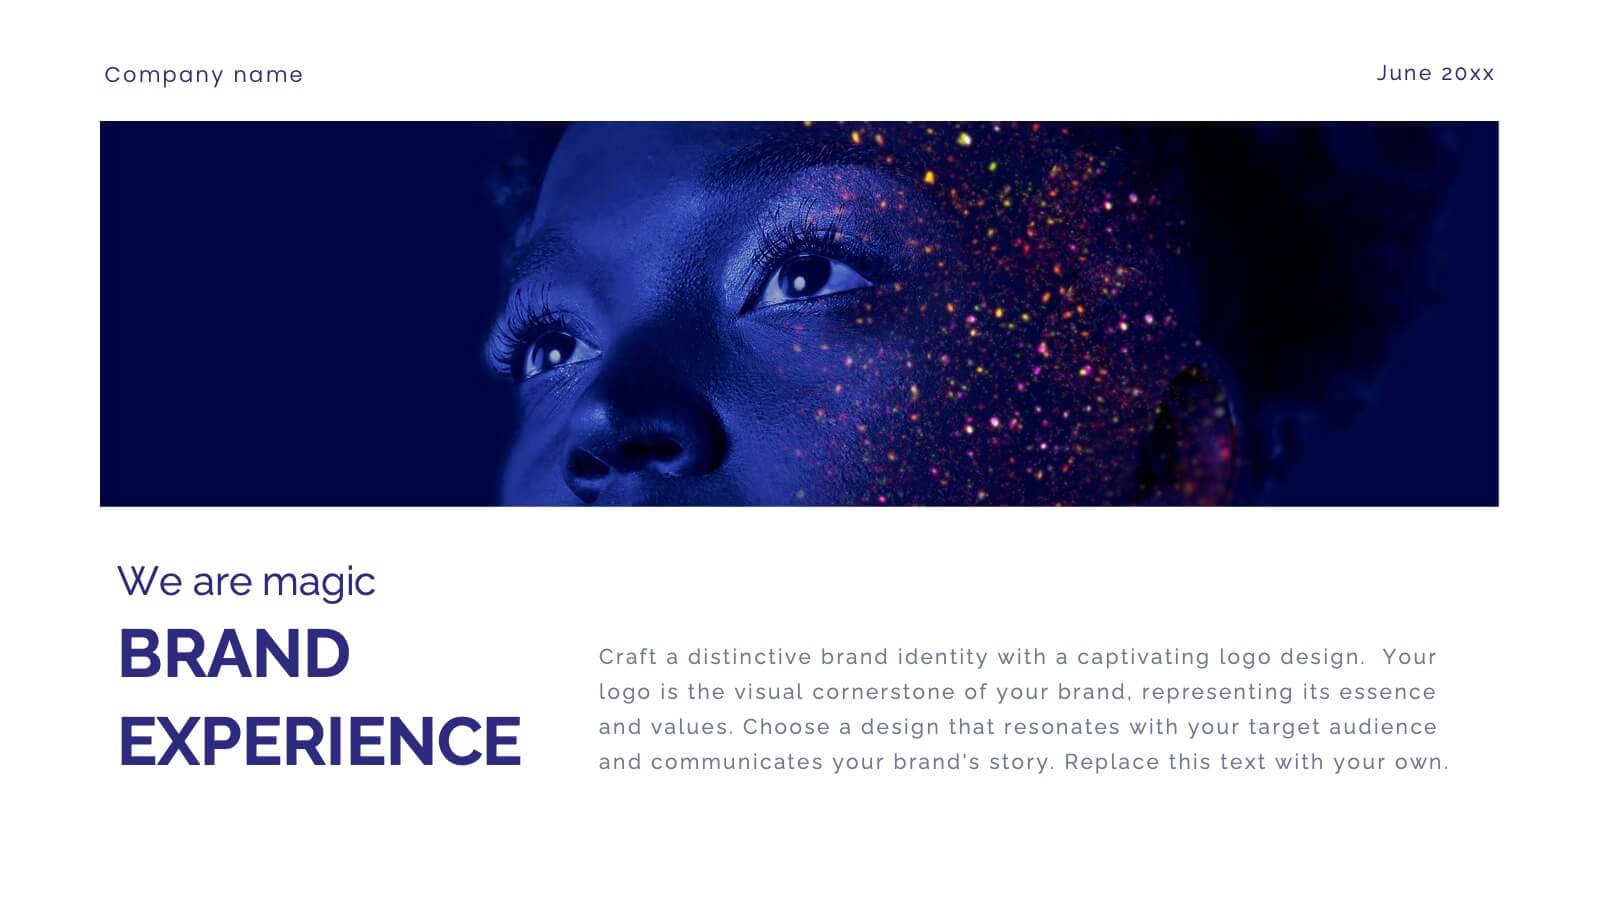
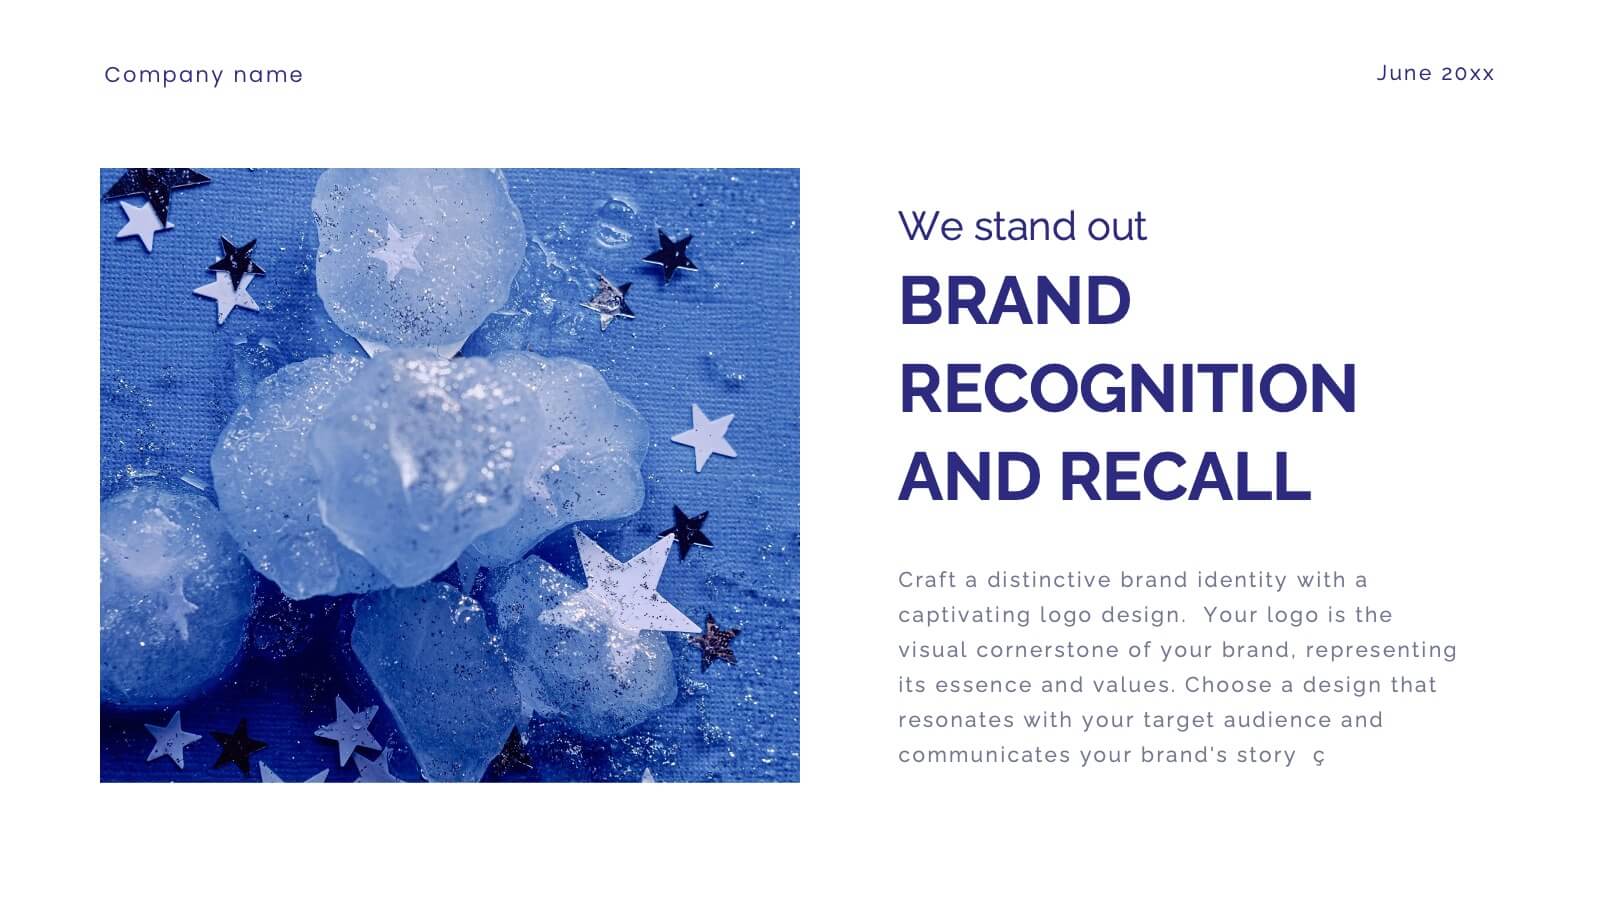
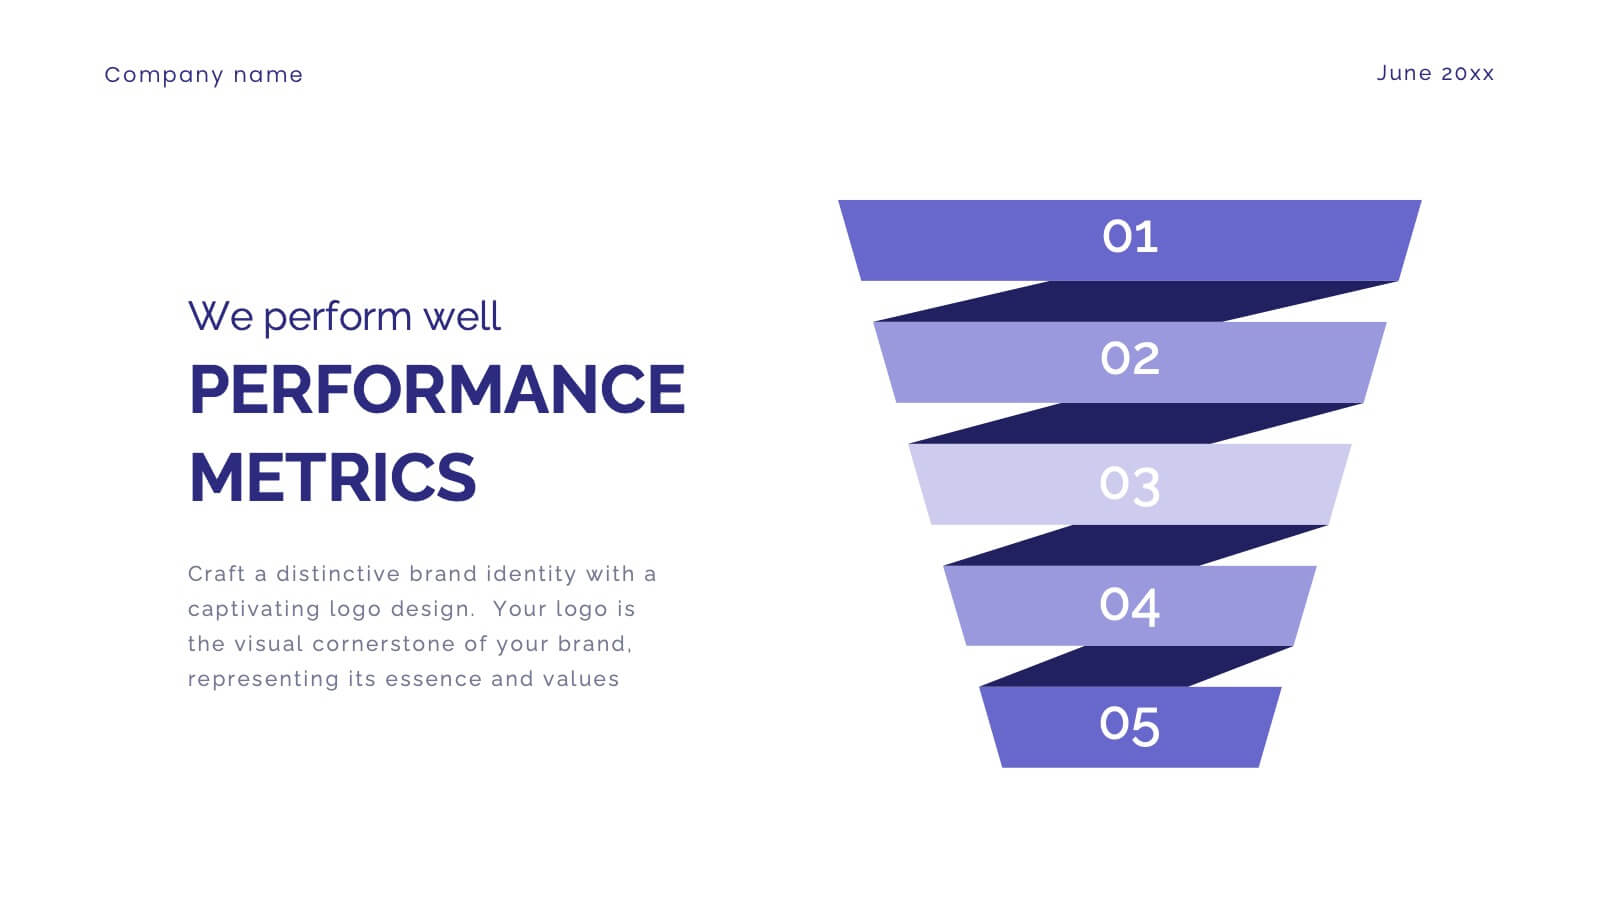
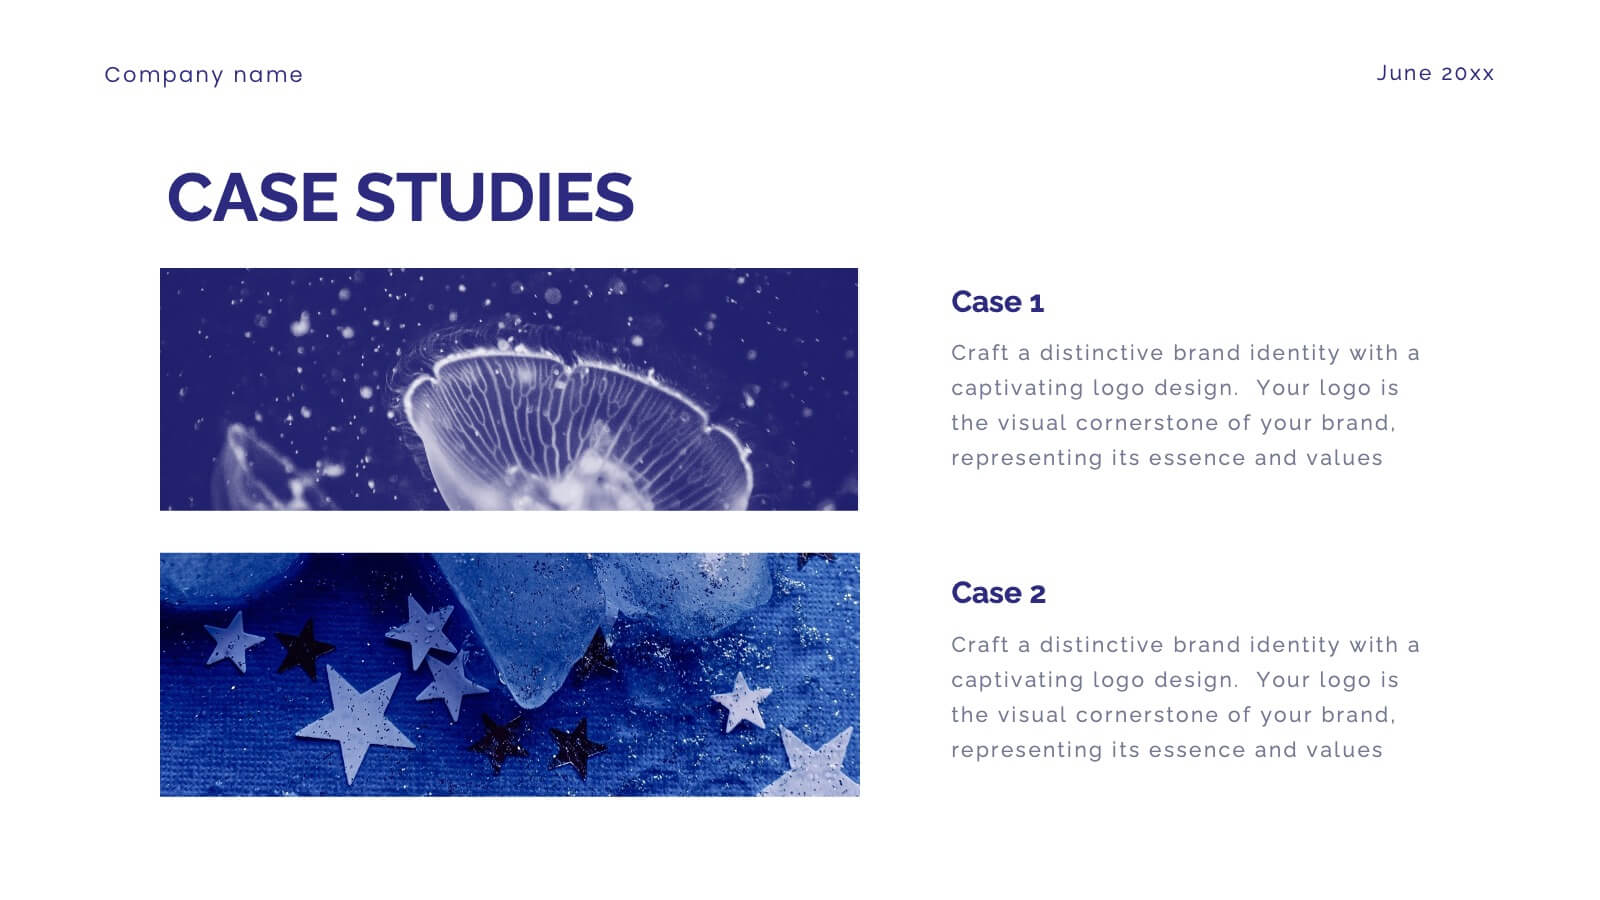
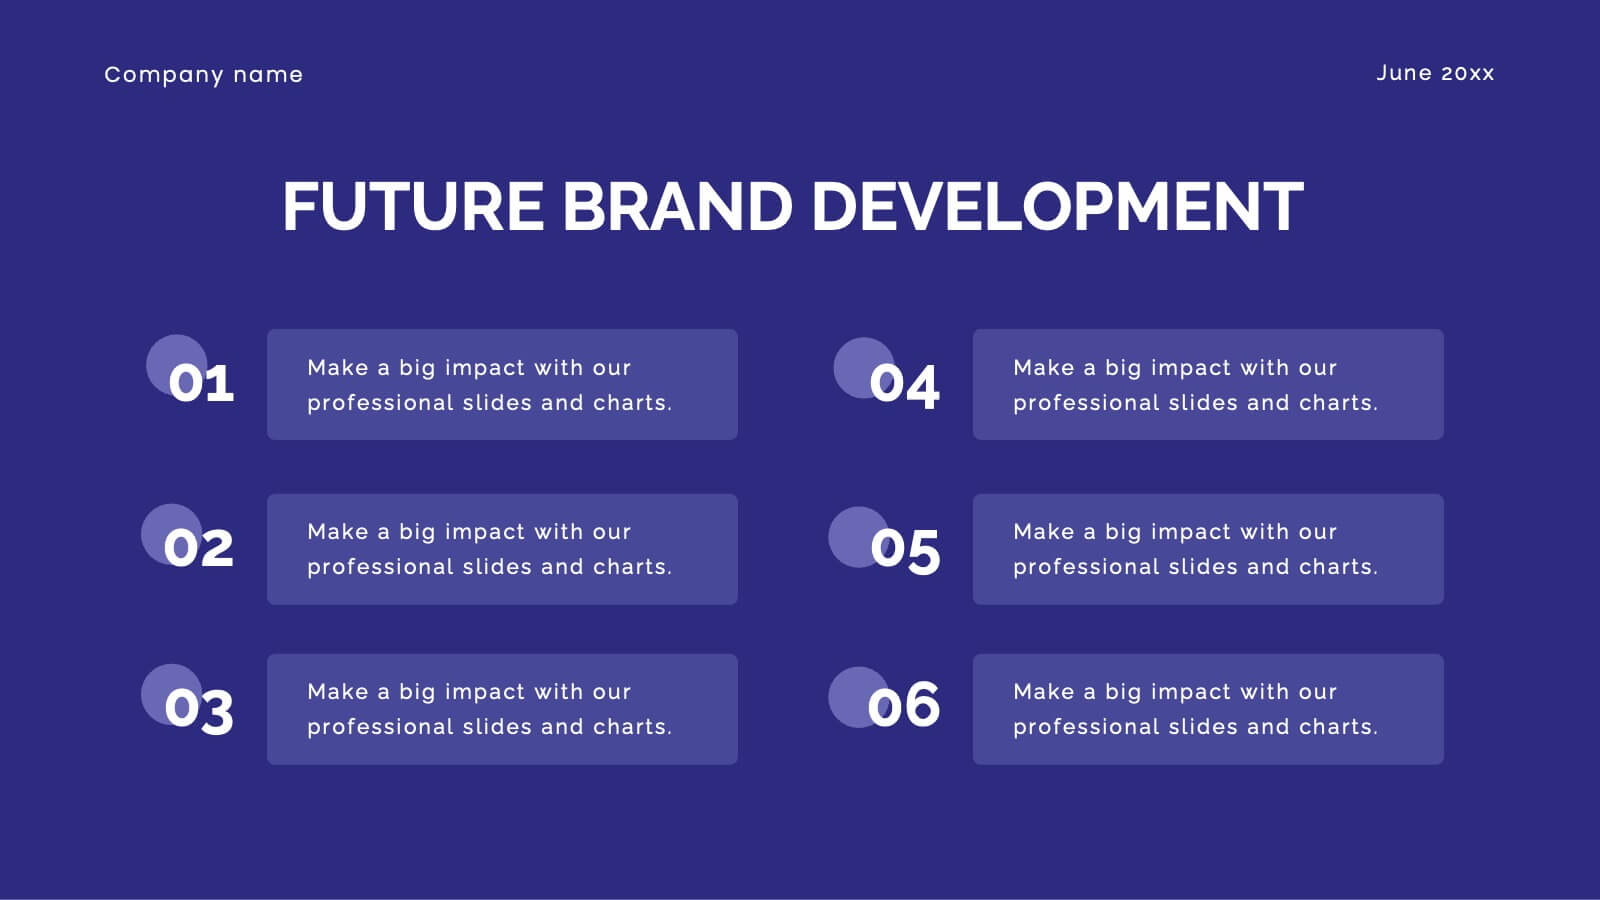
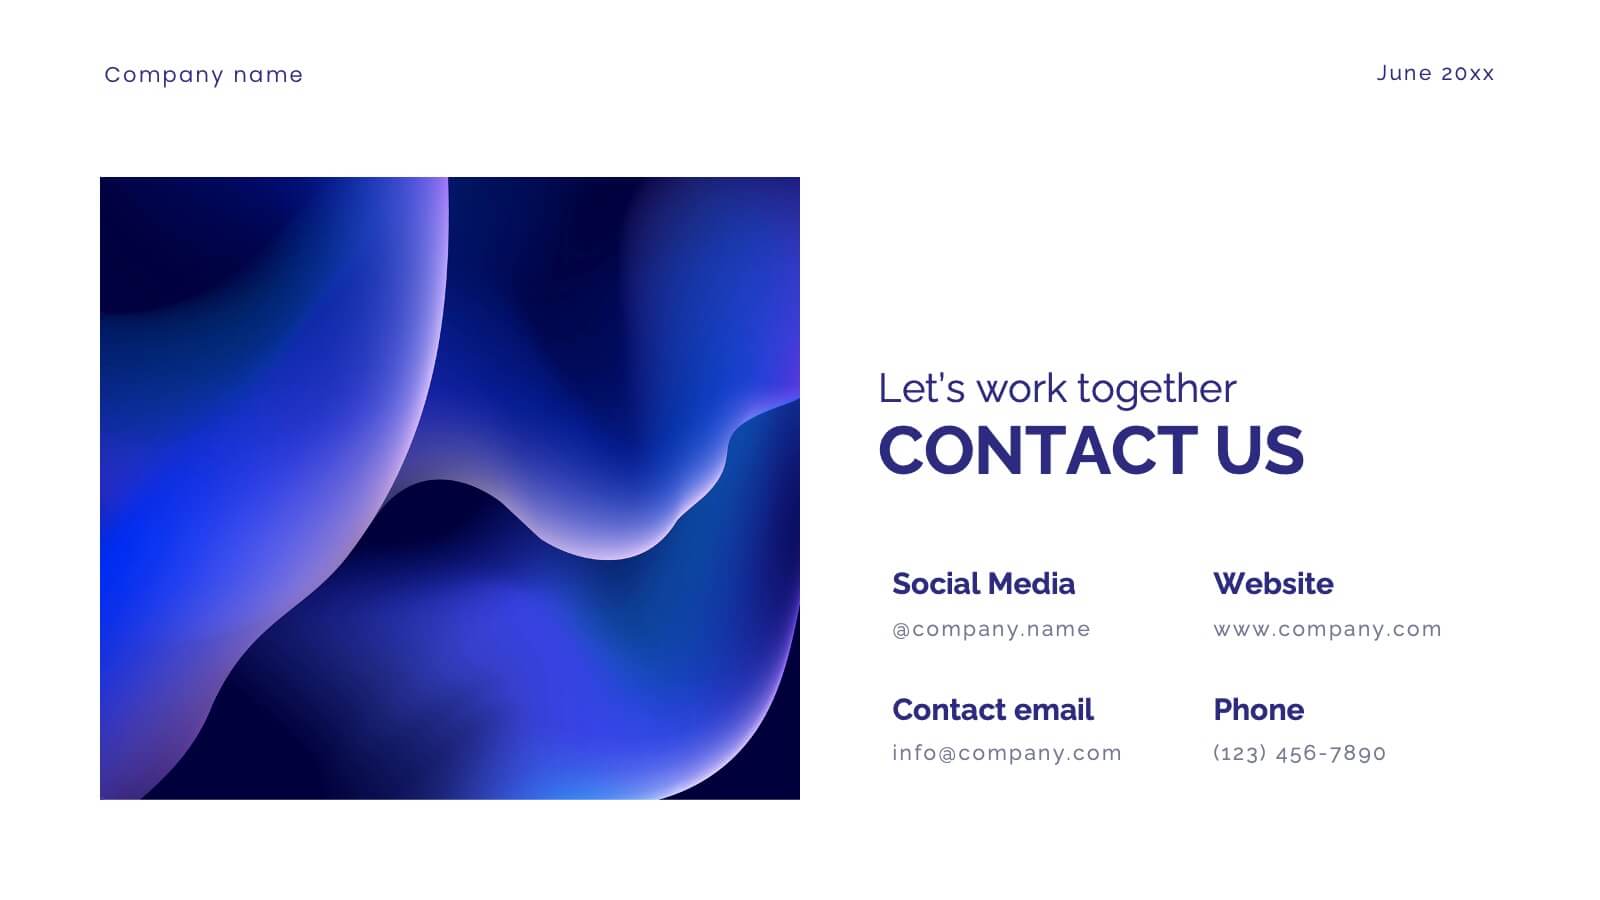

26 diapositivas
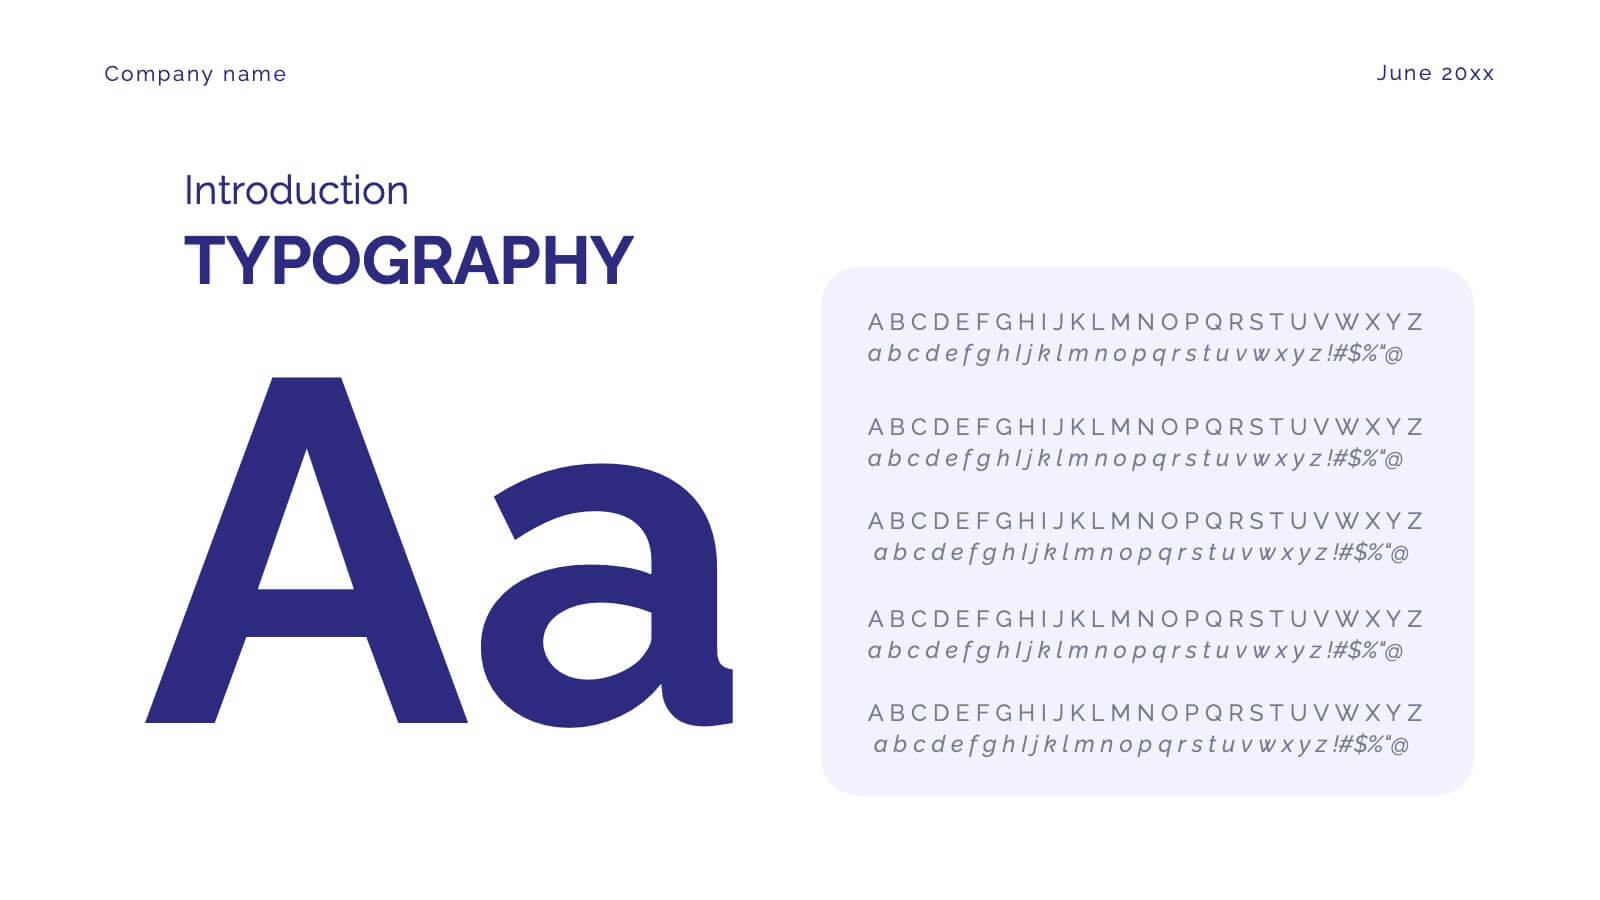
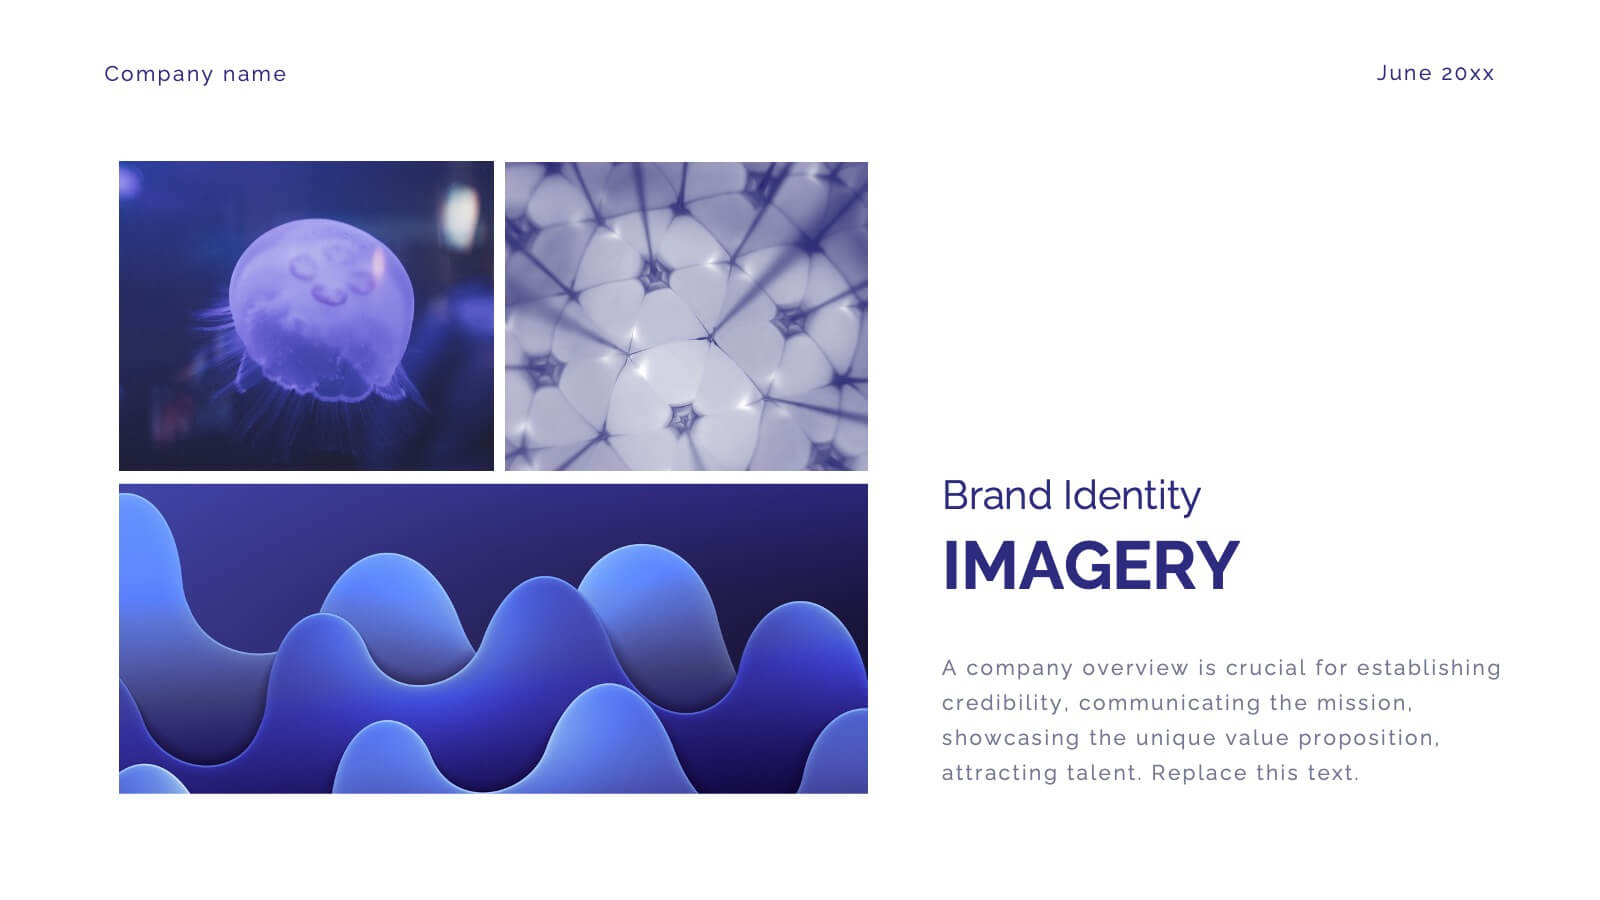
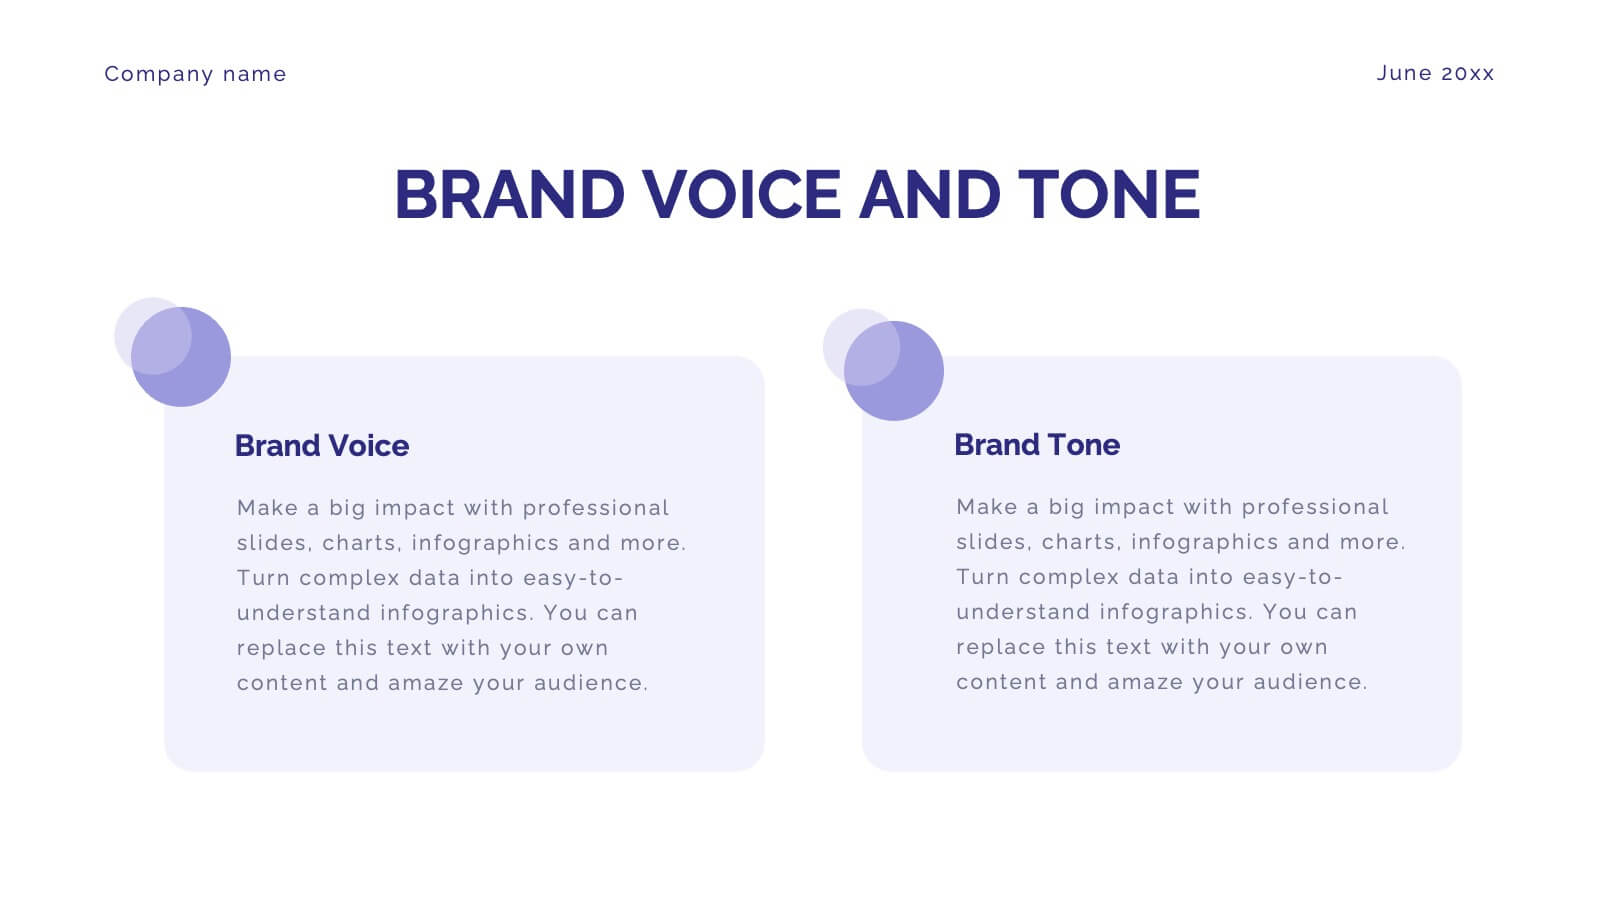
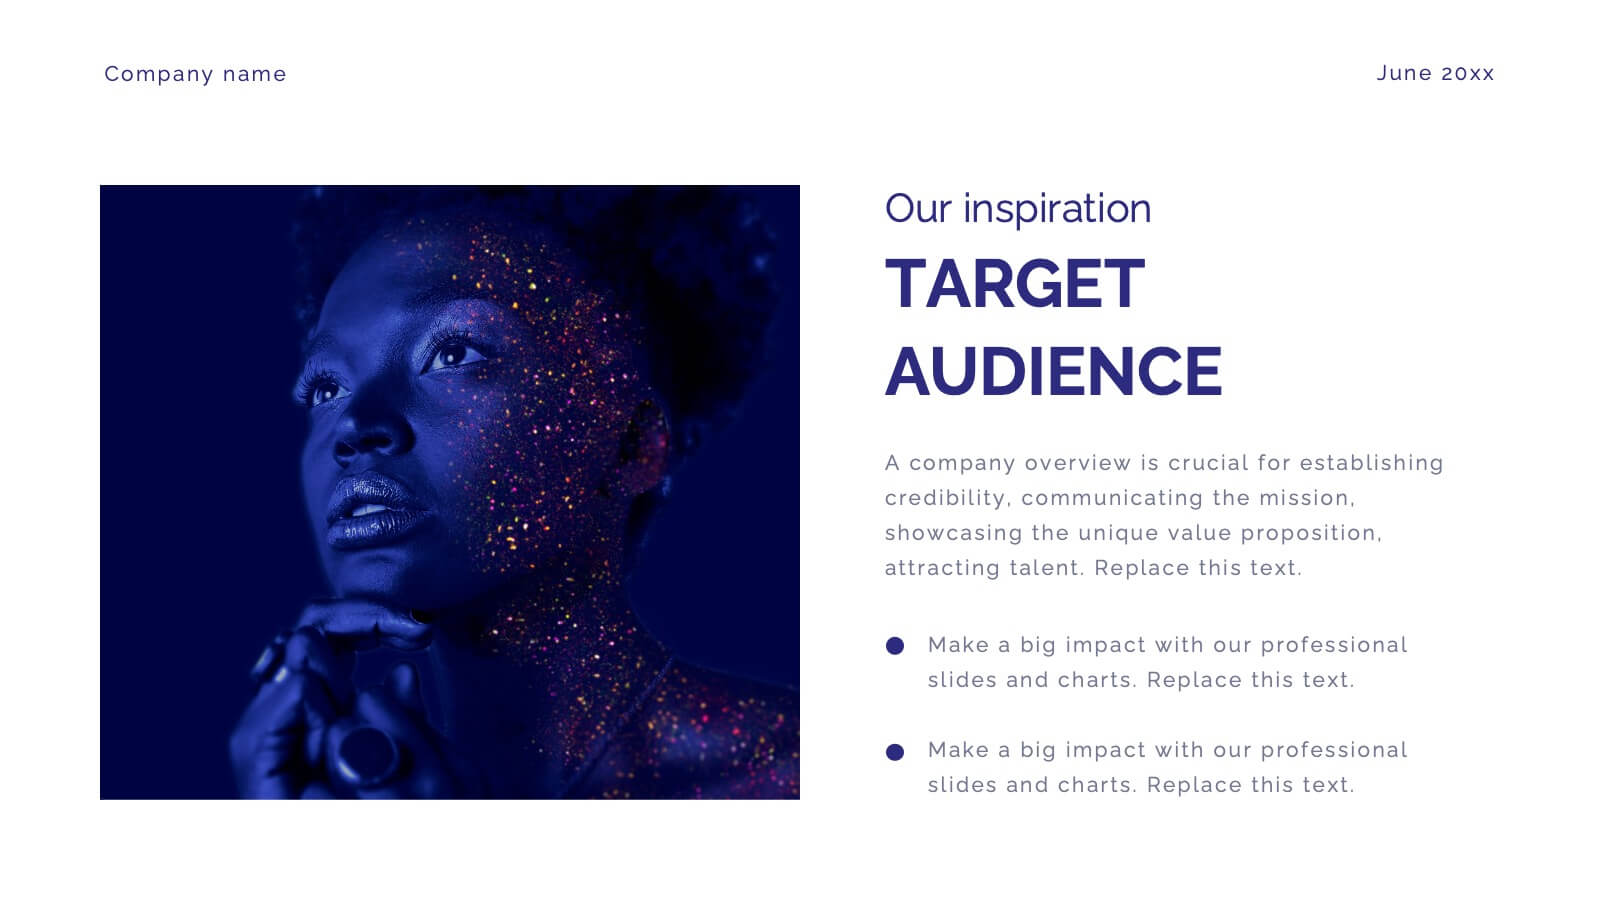
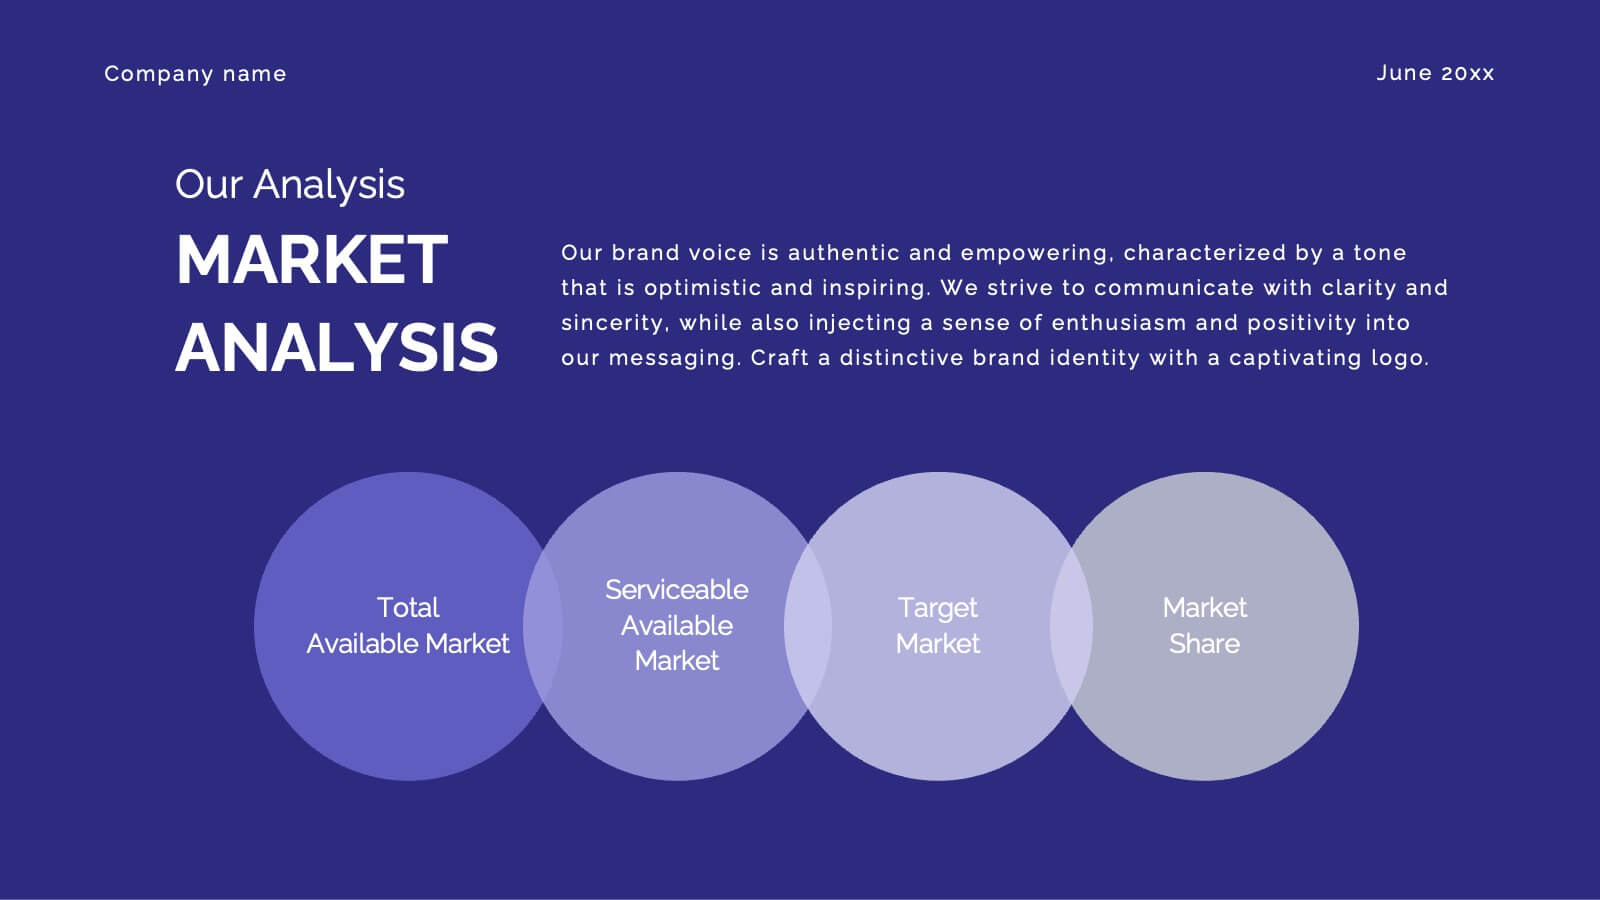
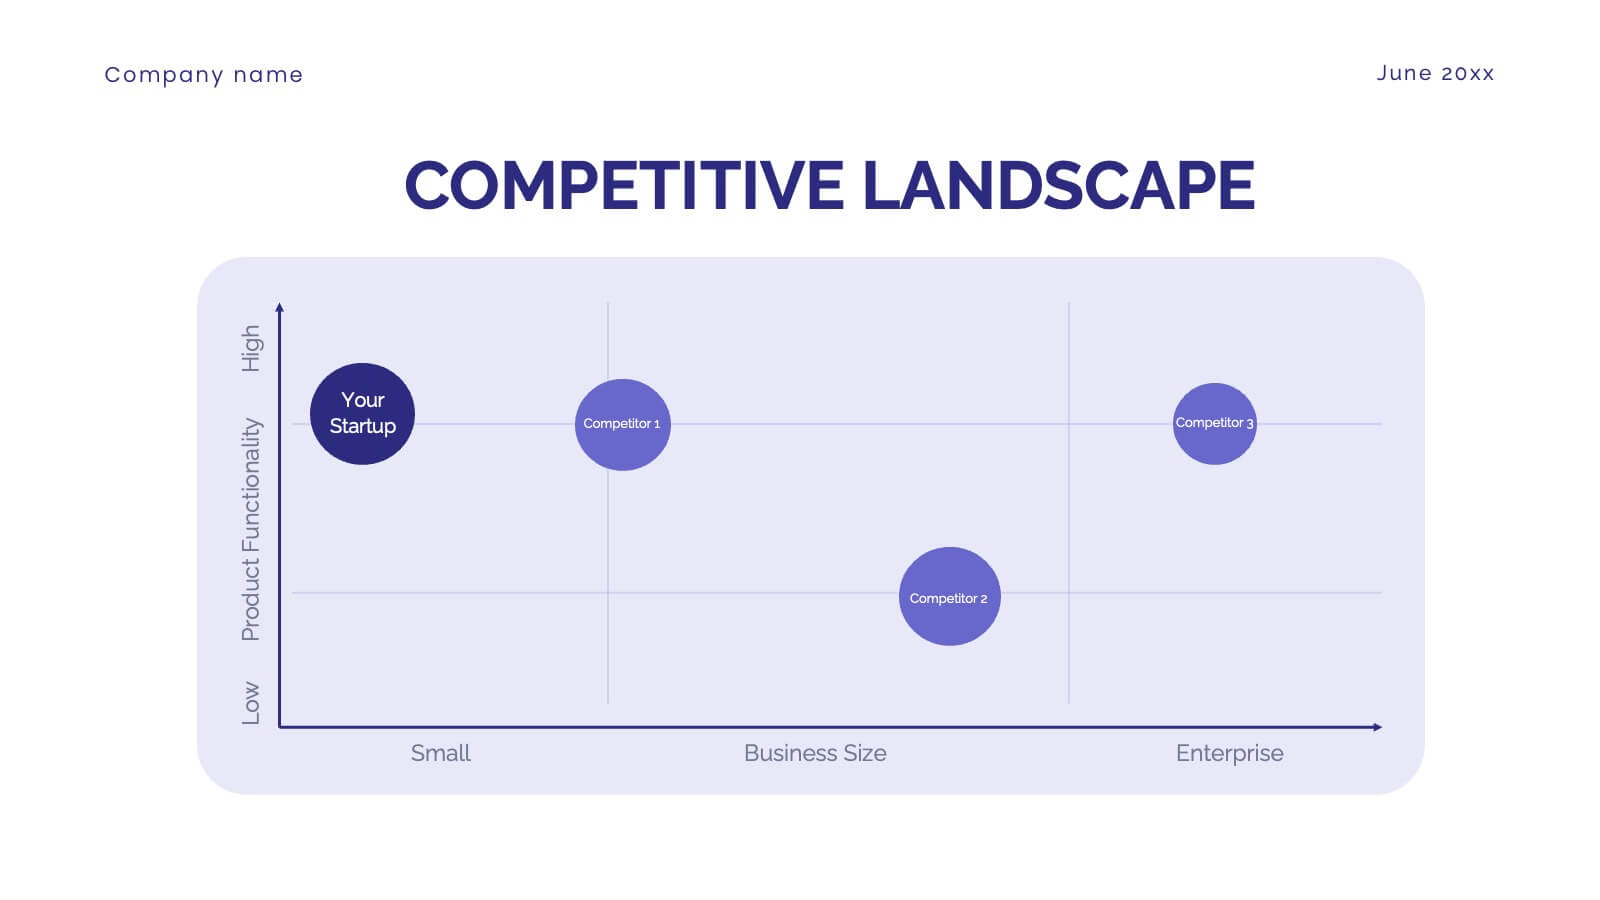
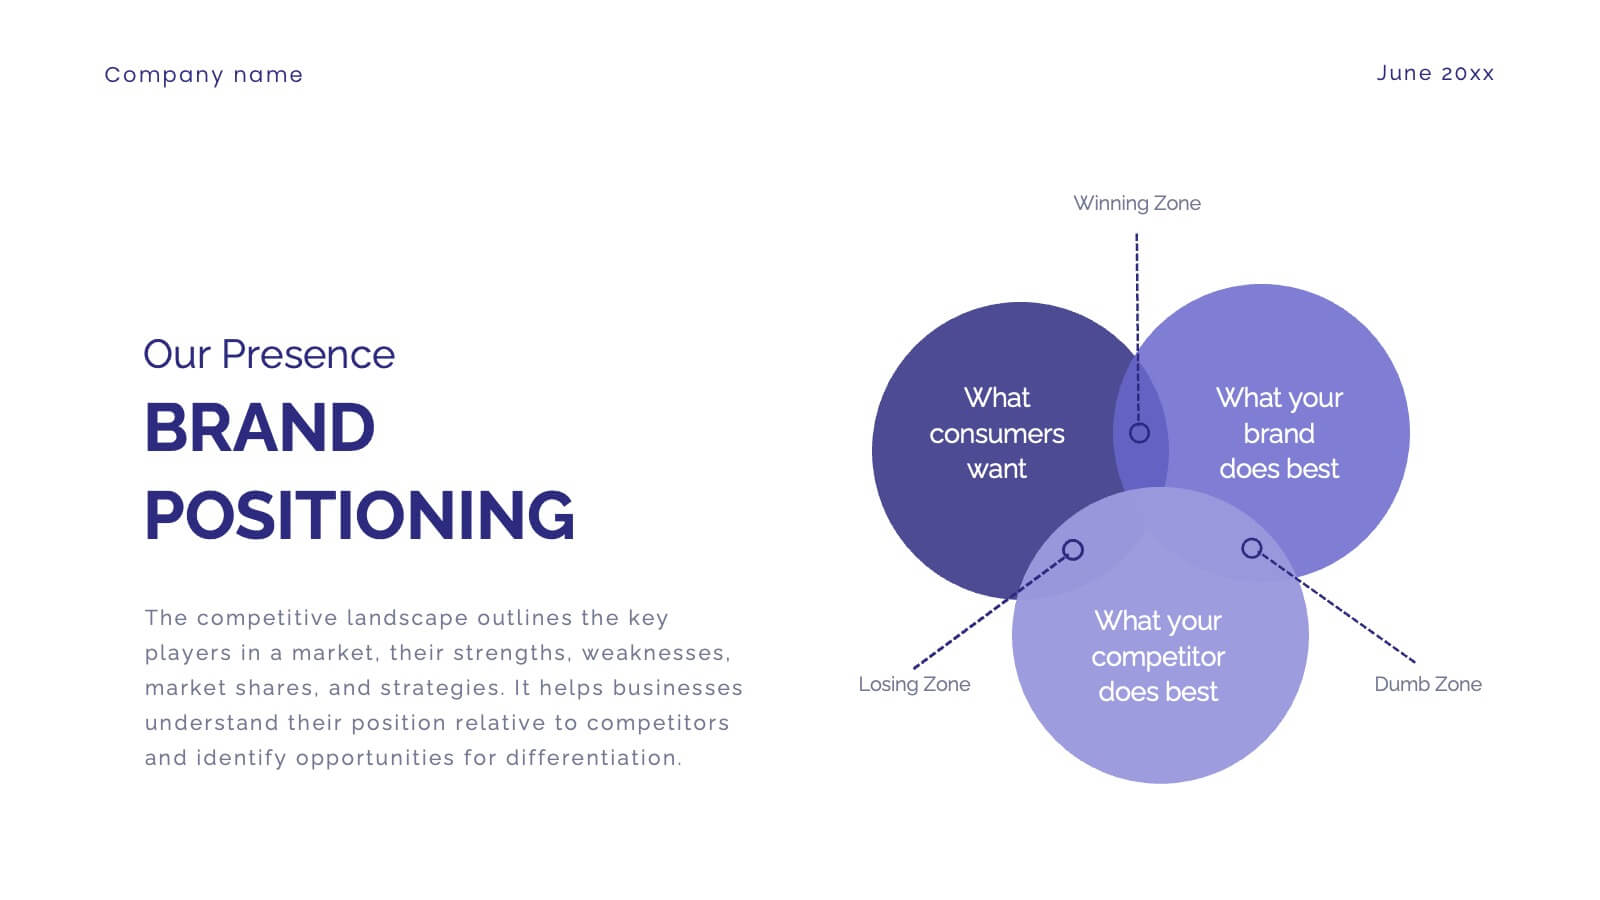
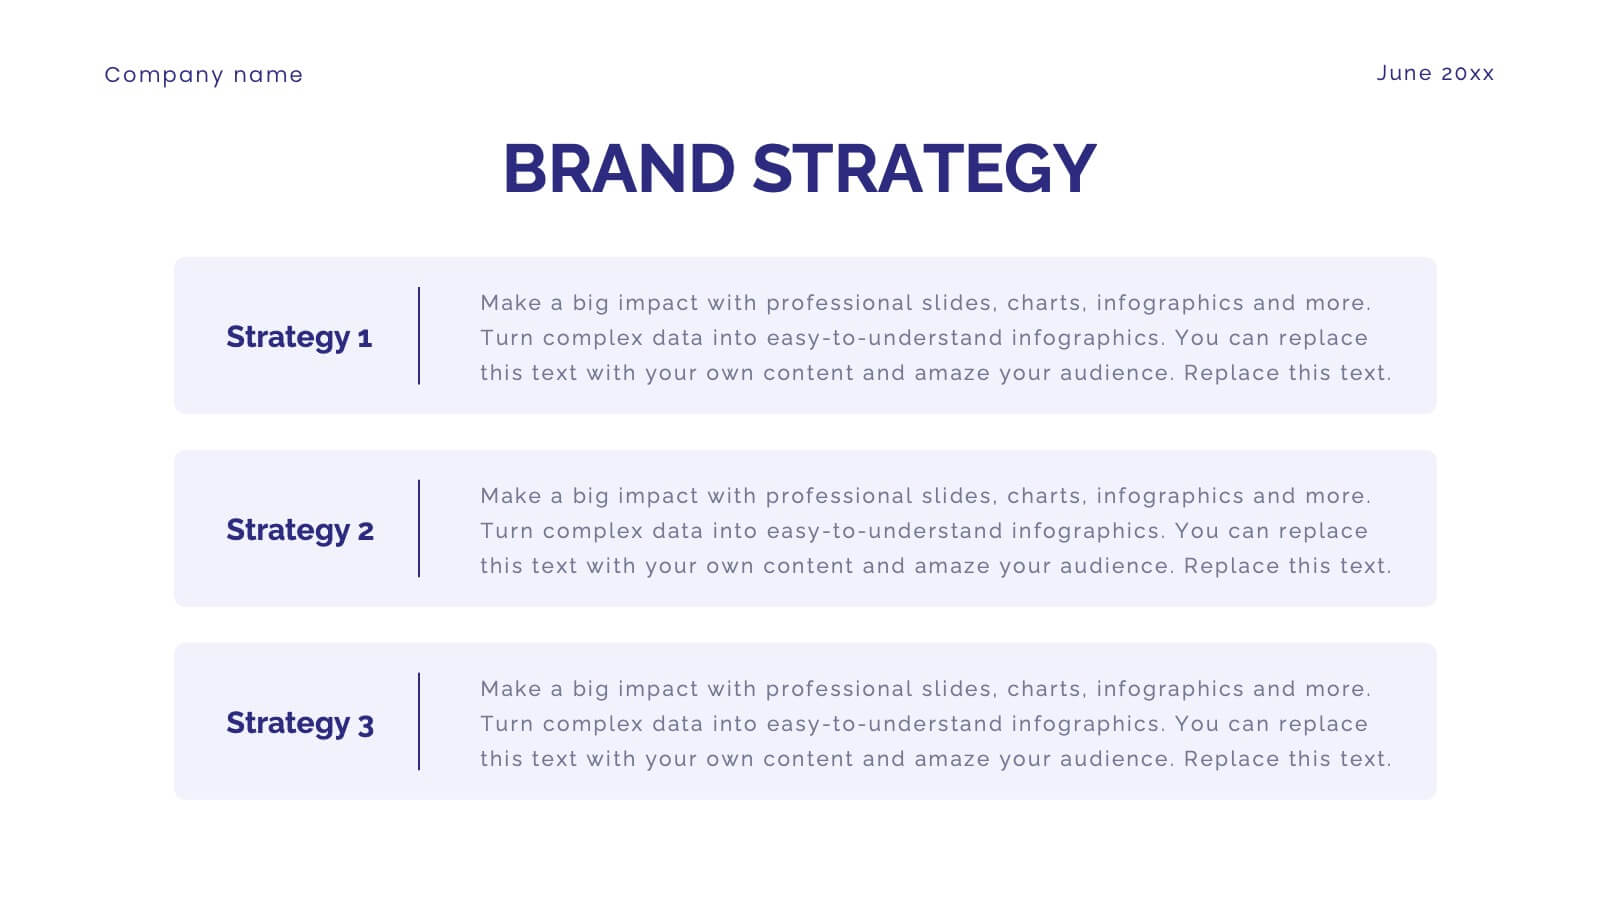
Glimmer Brand Development Pitch Deck Presentation
Elevate your brand with this comprehensive rebranding presentation template! Perfect for detailing your logo, color scheme, and market analysis, it includes slides for brand positioning, competitive landscape, and performance metrics. Engage your audience with clear visuals and structured content. Compatible with PowerPoint, Keynote, and Google Slides for seamless presentations on any platform.


6 diapositivas
School Goals and Administration Presentation
Visualize key academic priorities with this notebook-style layout, perfect for school administrators and teachers. Featuring colorful pushpin markers and a two-page spread, this template is great for outlining goals, responsibilities, or class guidelines. Fully editable in PowerPoint, Keynote, and Google Slides for customized, classroom-ready presentations.