


Características


¿Tienes alguna pregunta?
Recomendar


2 diapositivas
Breast Cancer Awareness Infographics Presentation
Empower your message with a bold, meaningful design that spreads awareness and inspires action. This impactful layout uses visual balance and clear data points to highlight key statistics, health information, or campaign goals. Fully editable and compatible with PowerPoint, Keynote, and Google Slides for effortless customization and professional presentations.


20 diapositivas
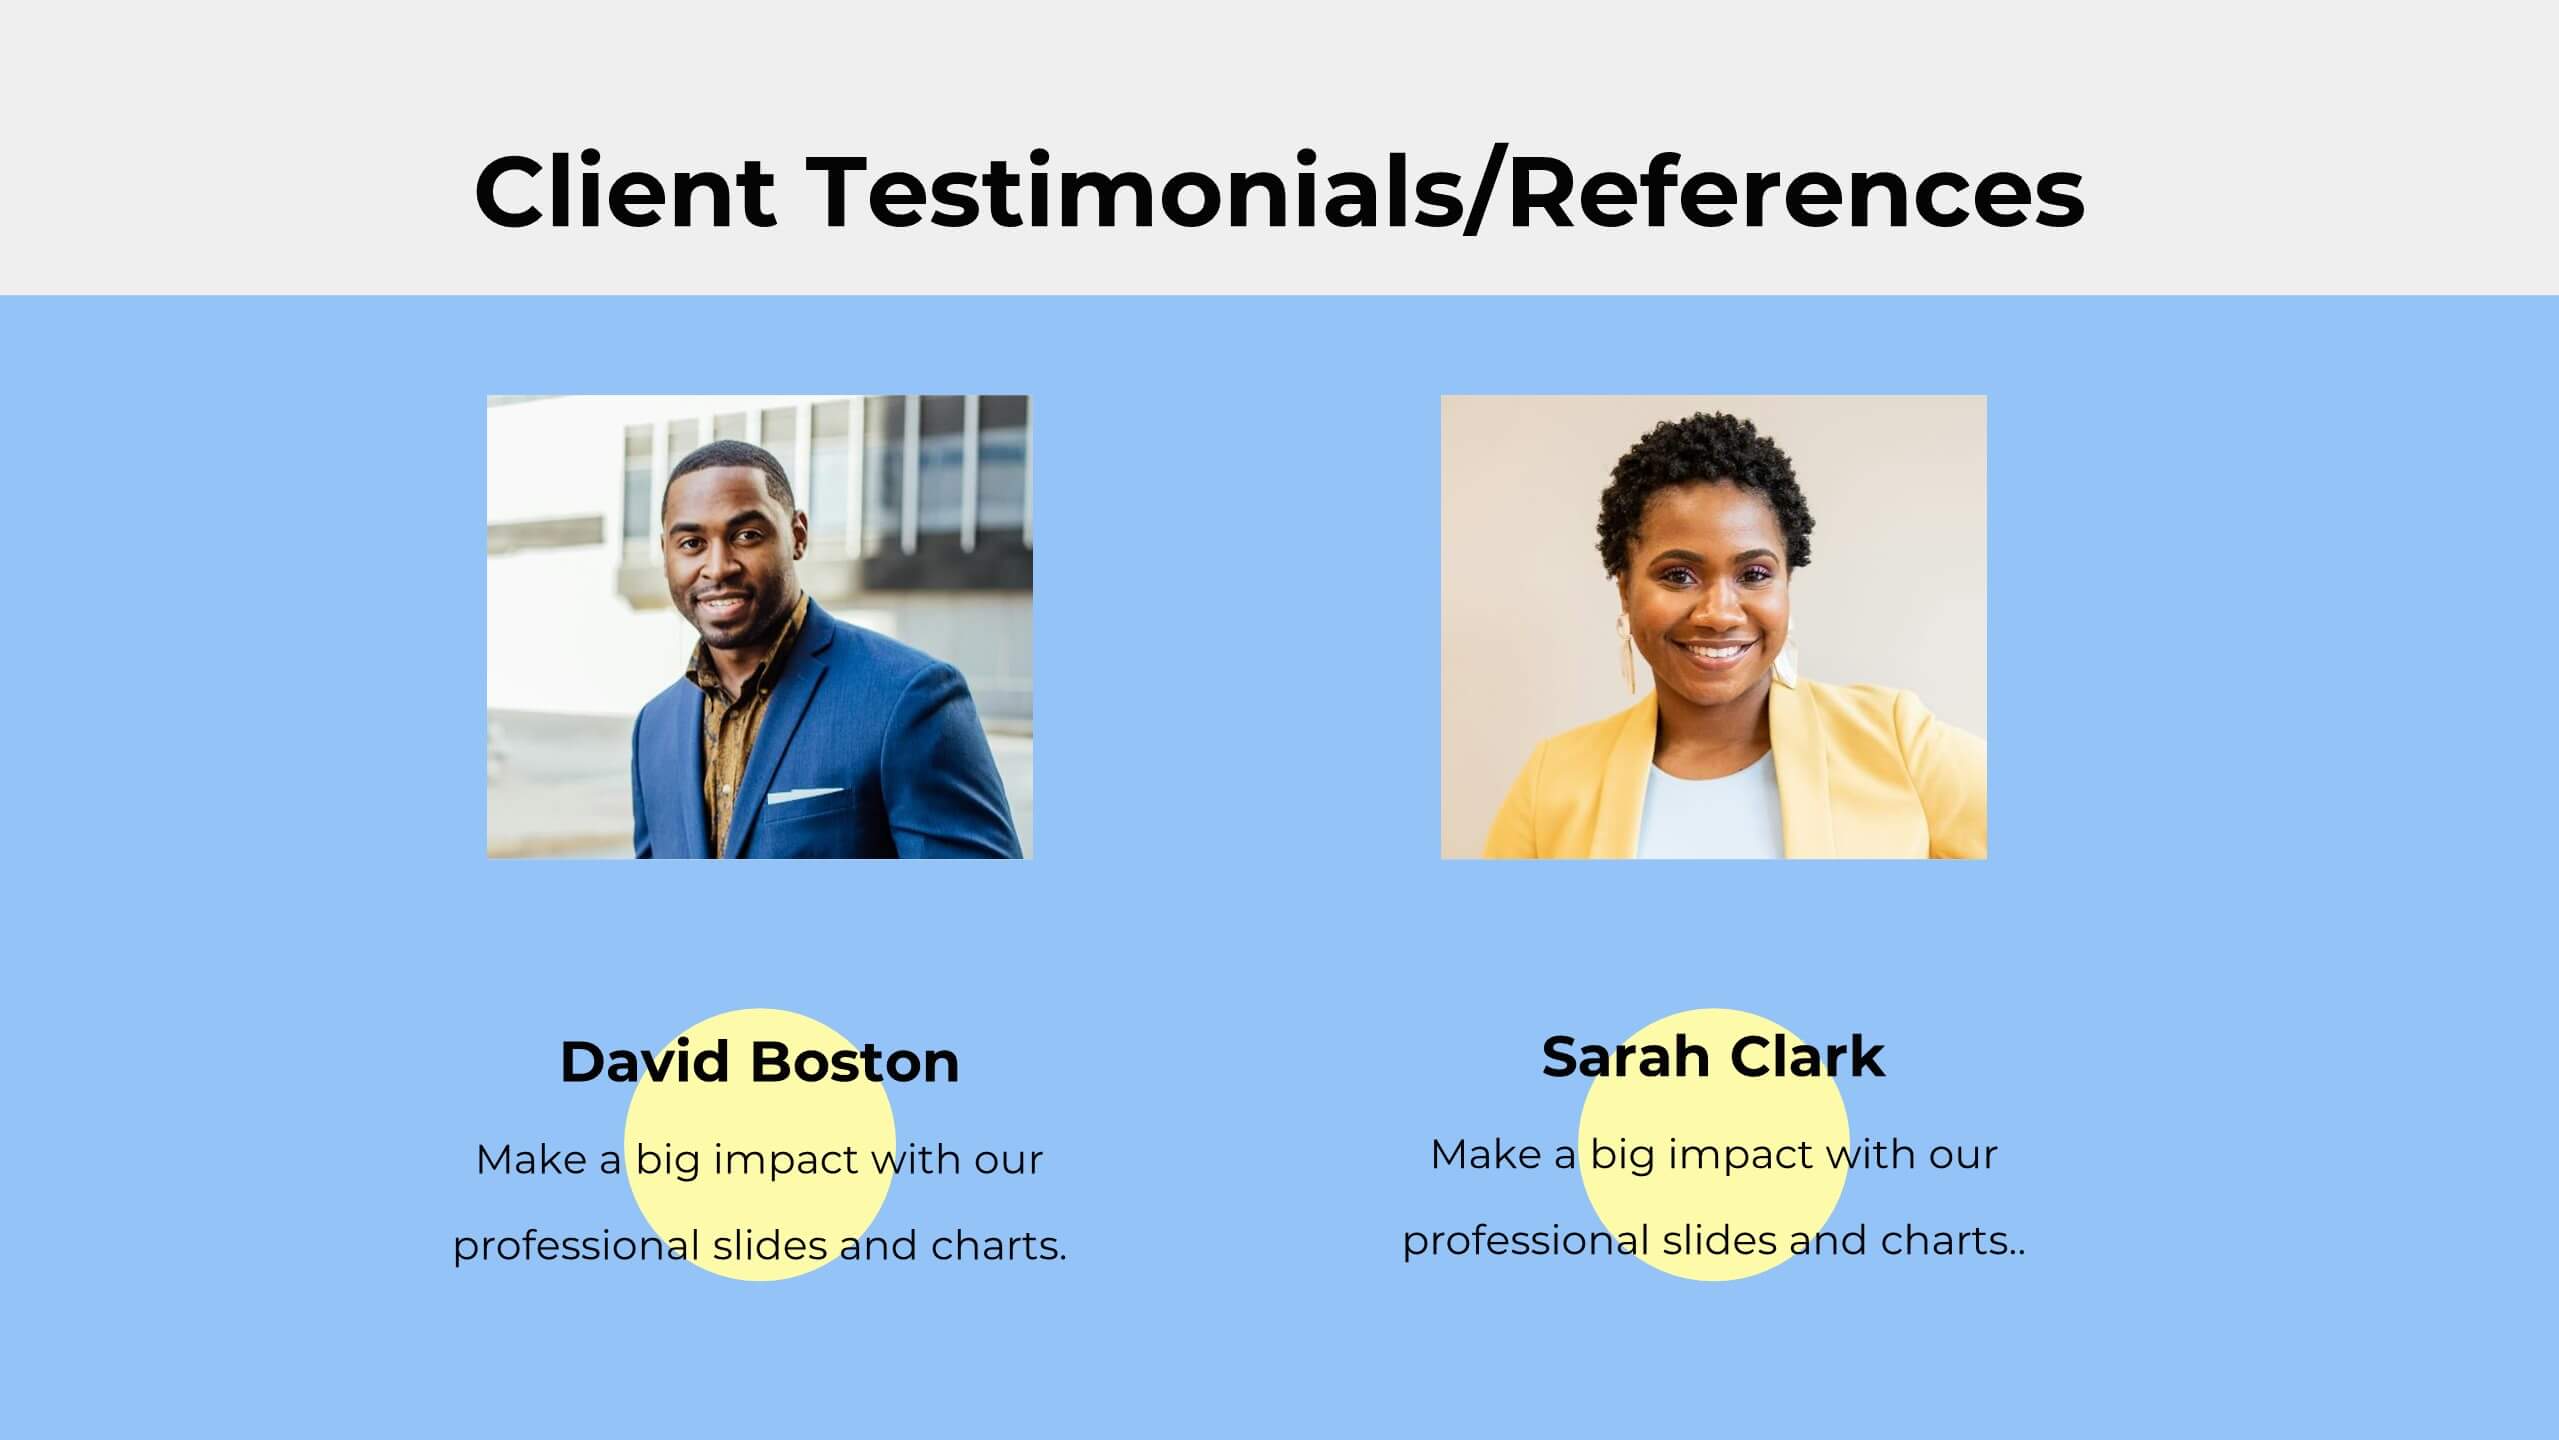
Radiance Sales Forecast Presentation
This vibrant sales presentation template is perfect for showcasing your strategy, objectives, and team. It highlights key areas like pricing, sales process, and performance metrics with a modern and eye-catching design. Compatible with PowerPoint, Keynote, and Google Slides, it ensures you’ll deliver impactful and professional presentations every time. Get ready to wow your audience!

20 diapositivas
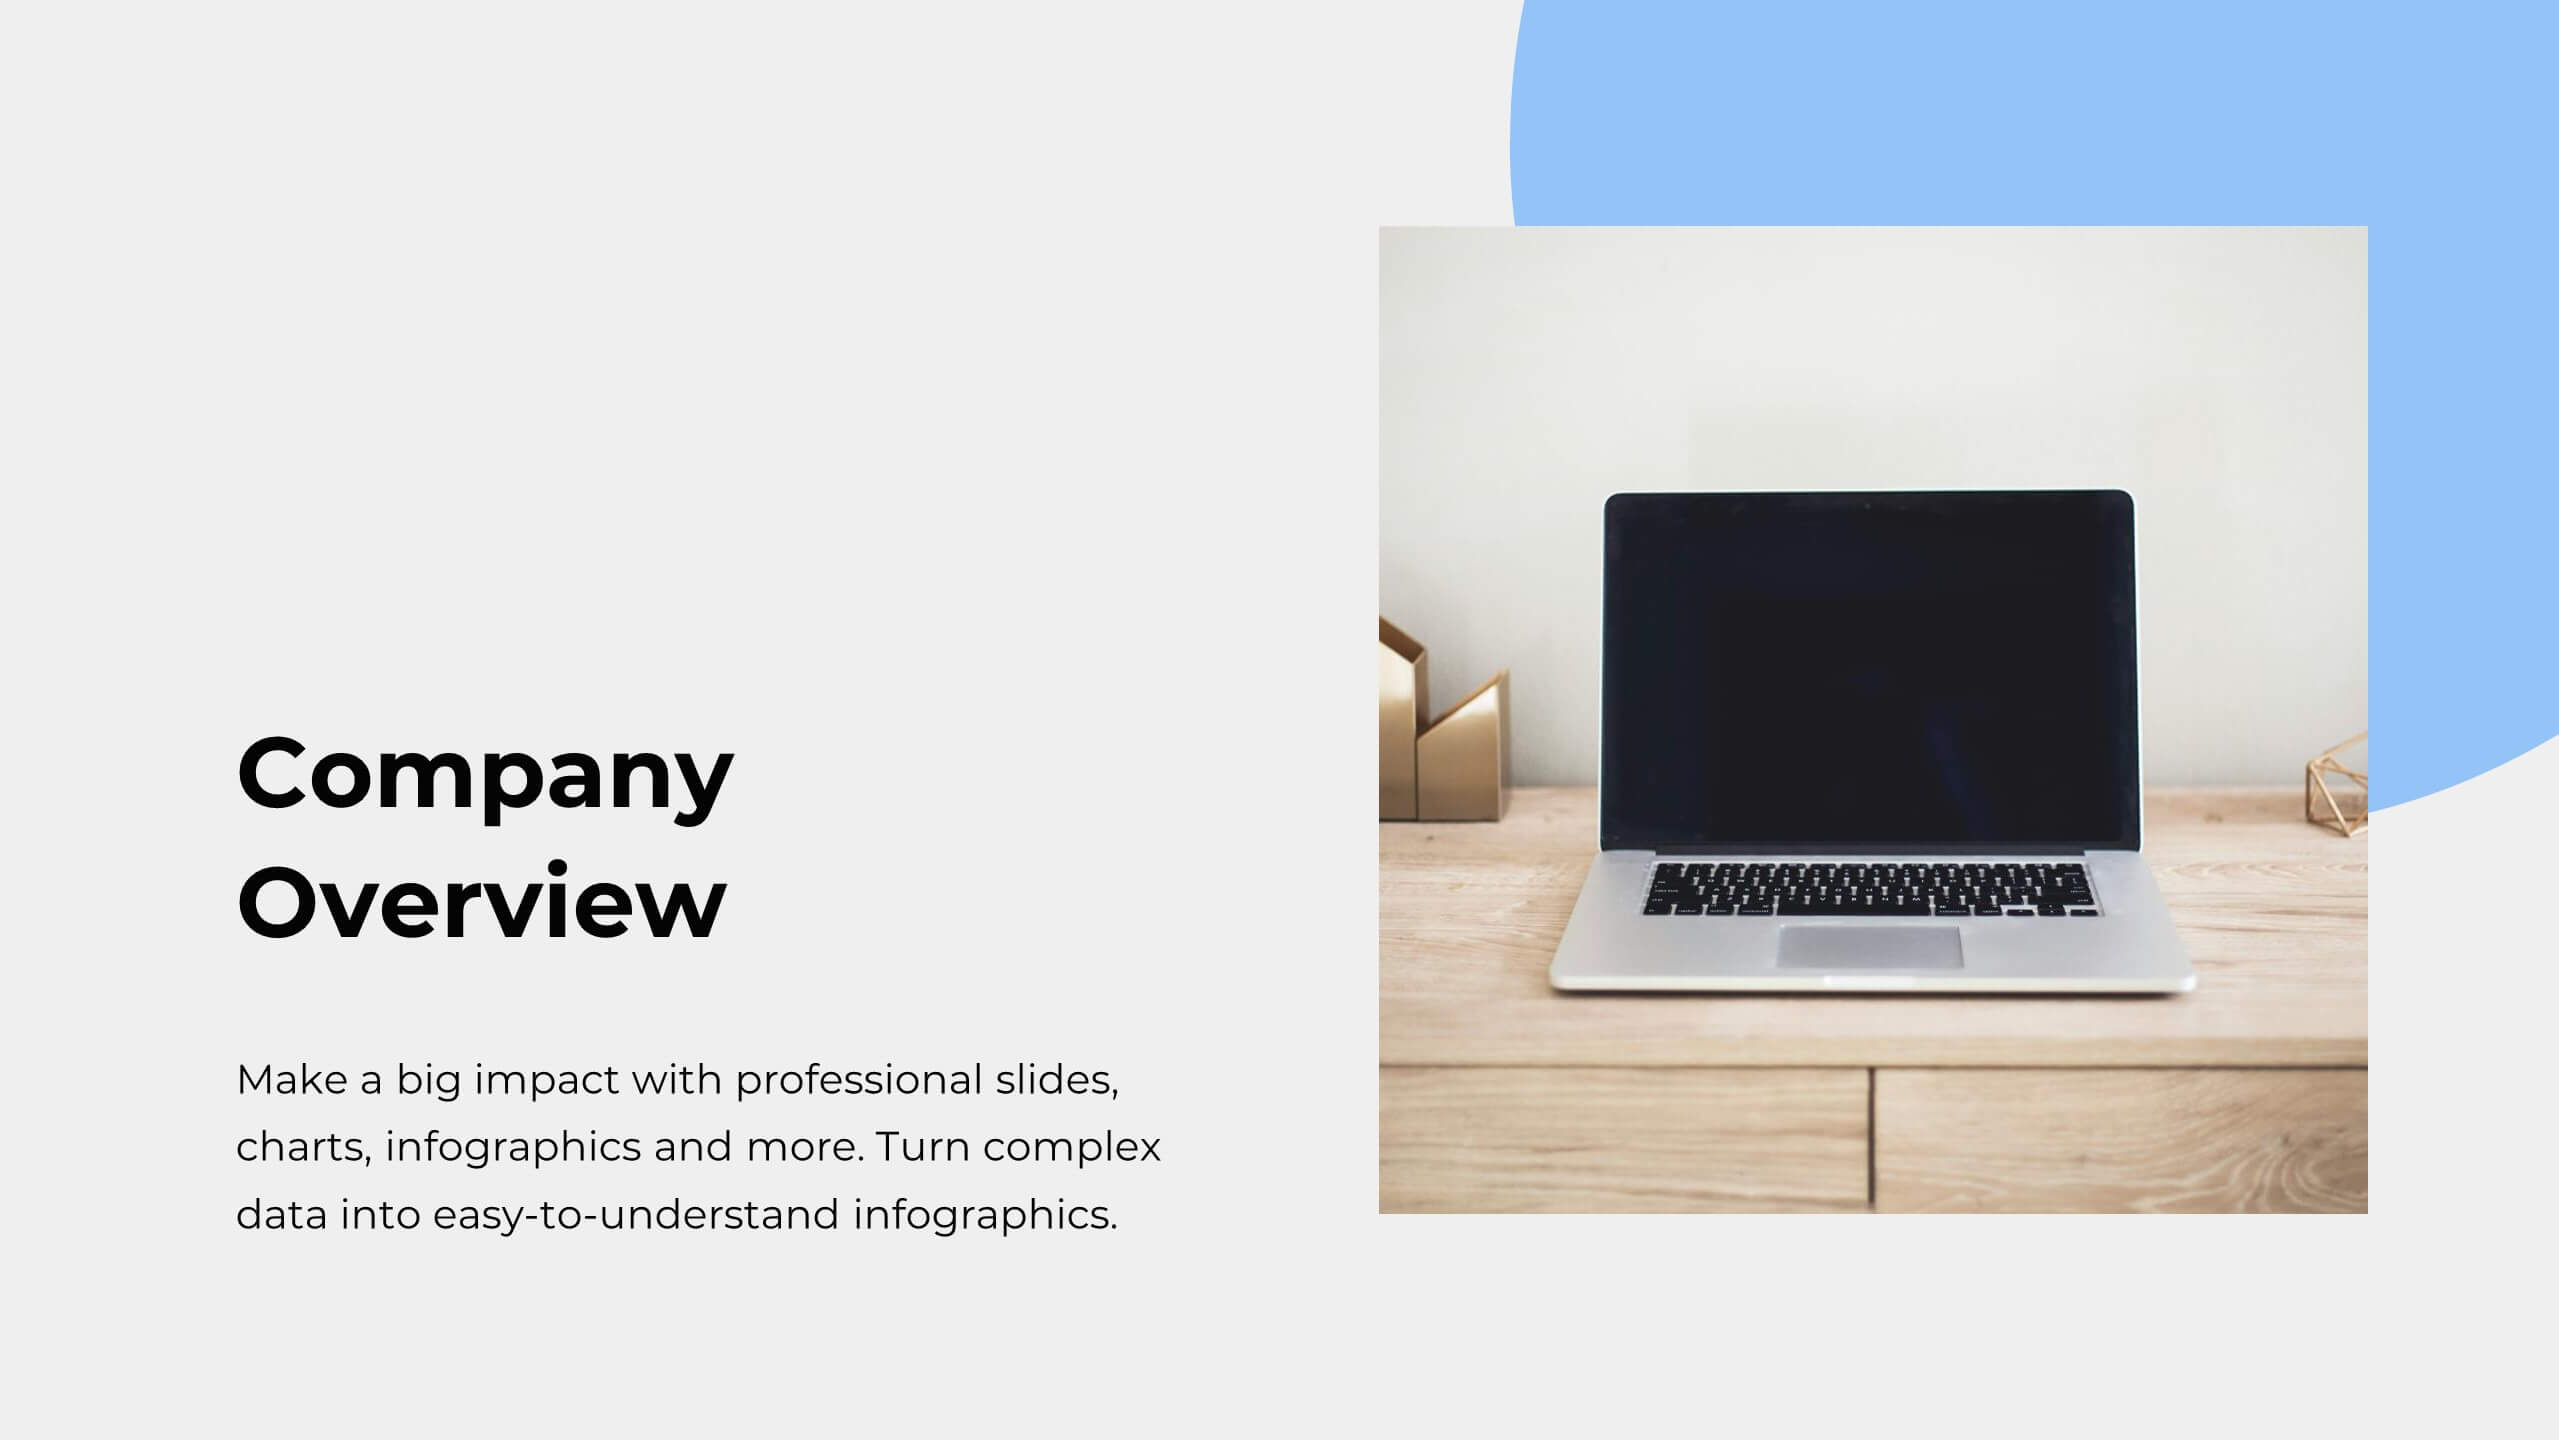
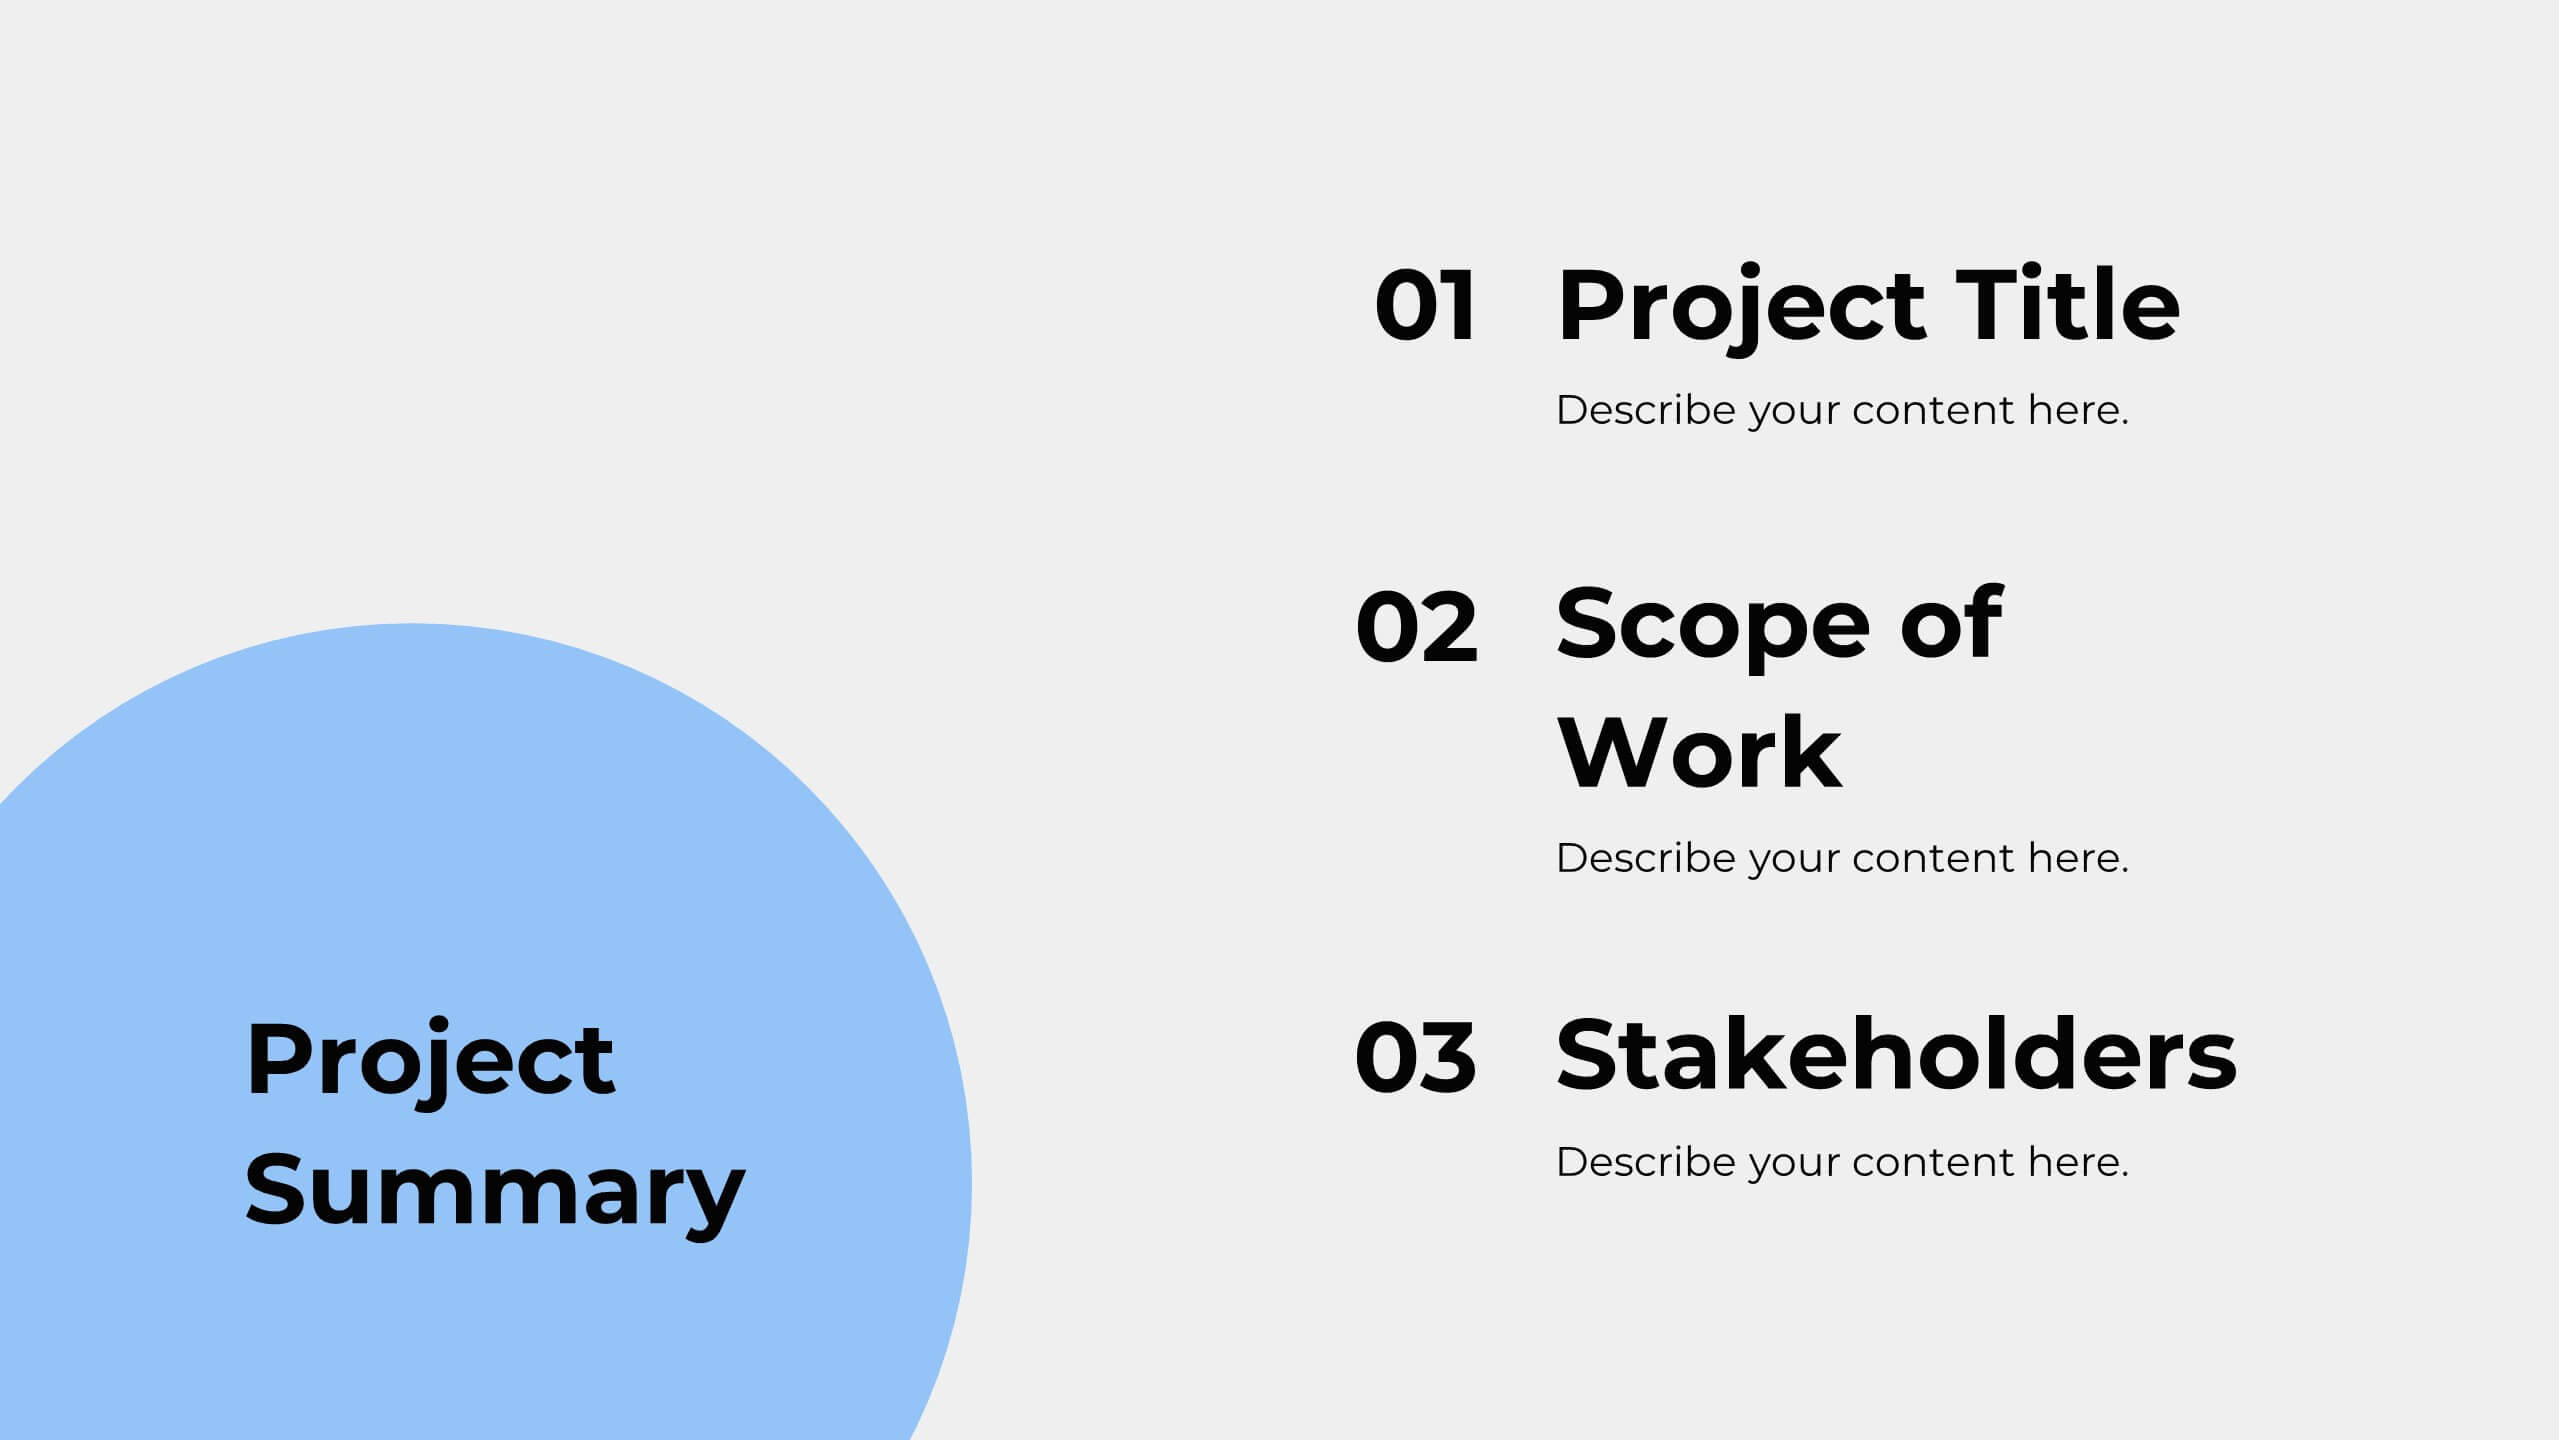
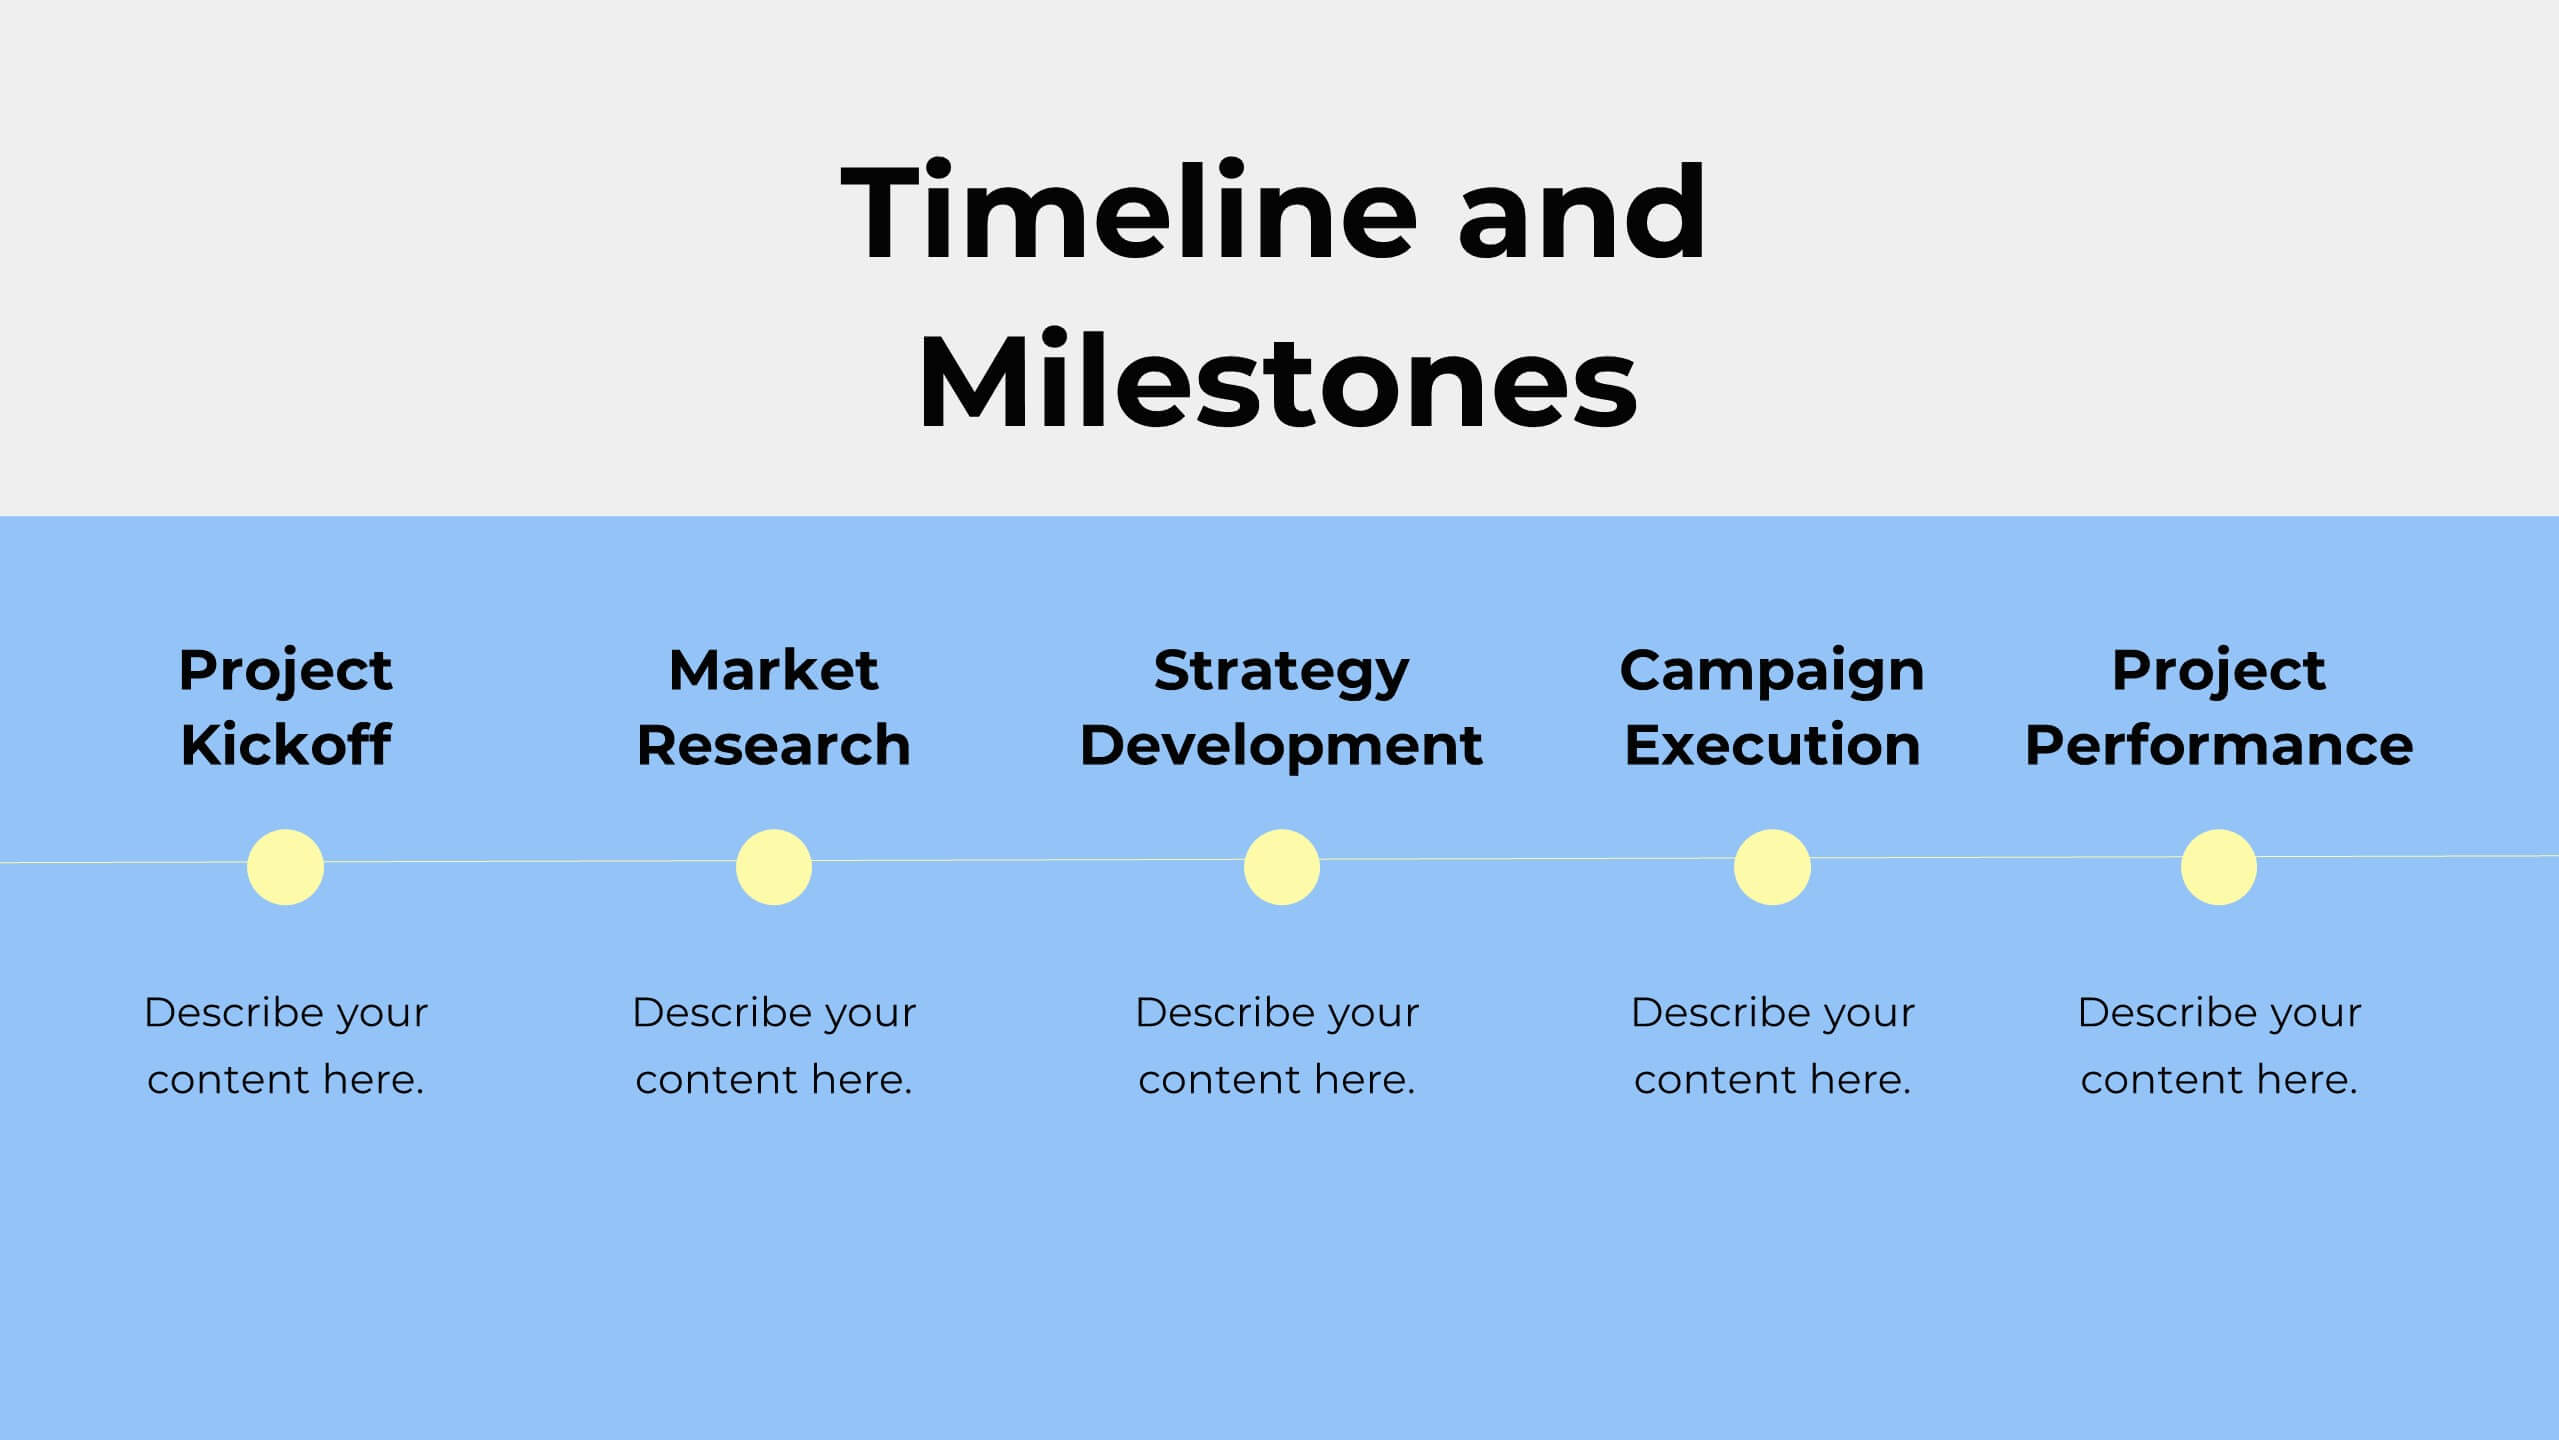
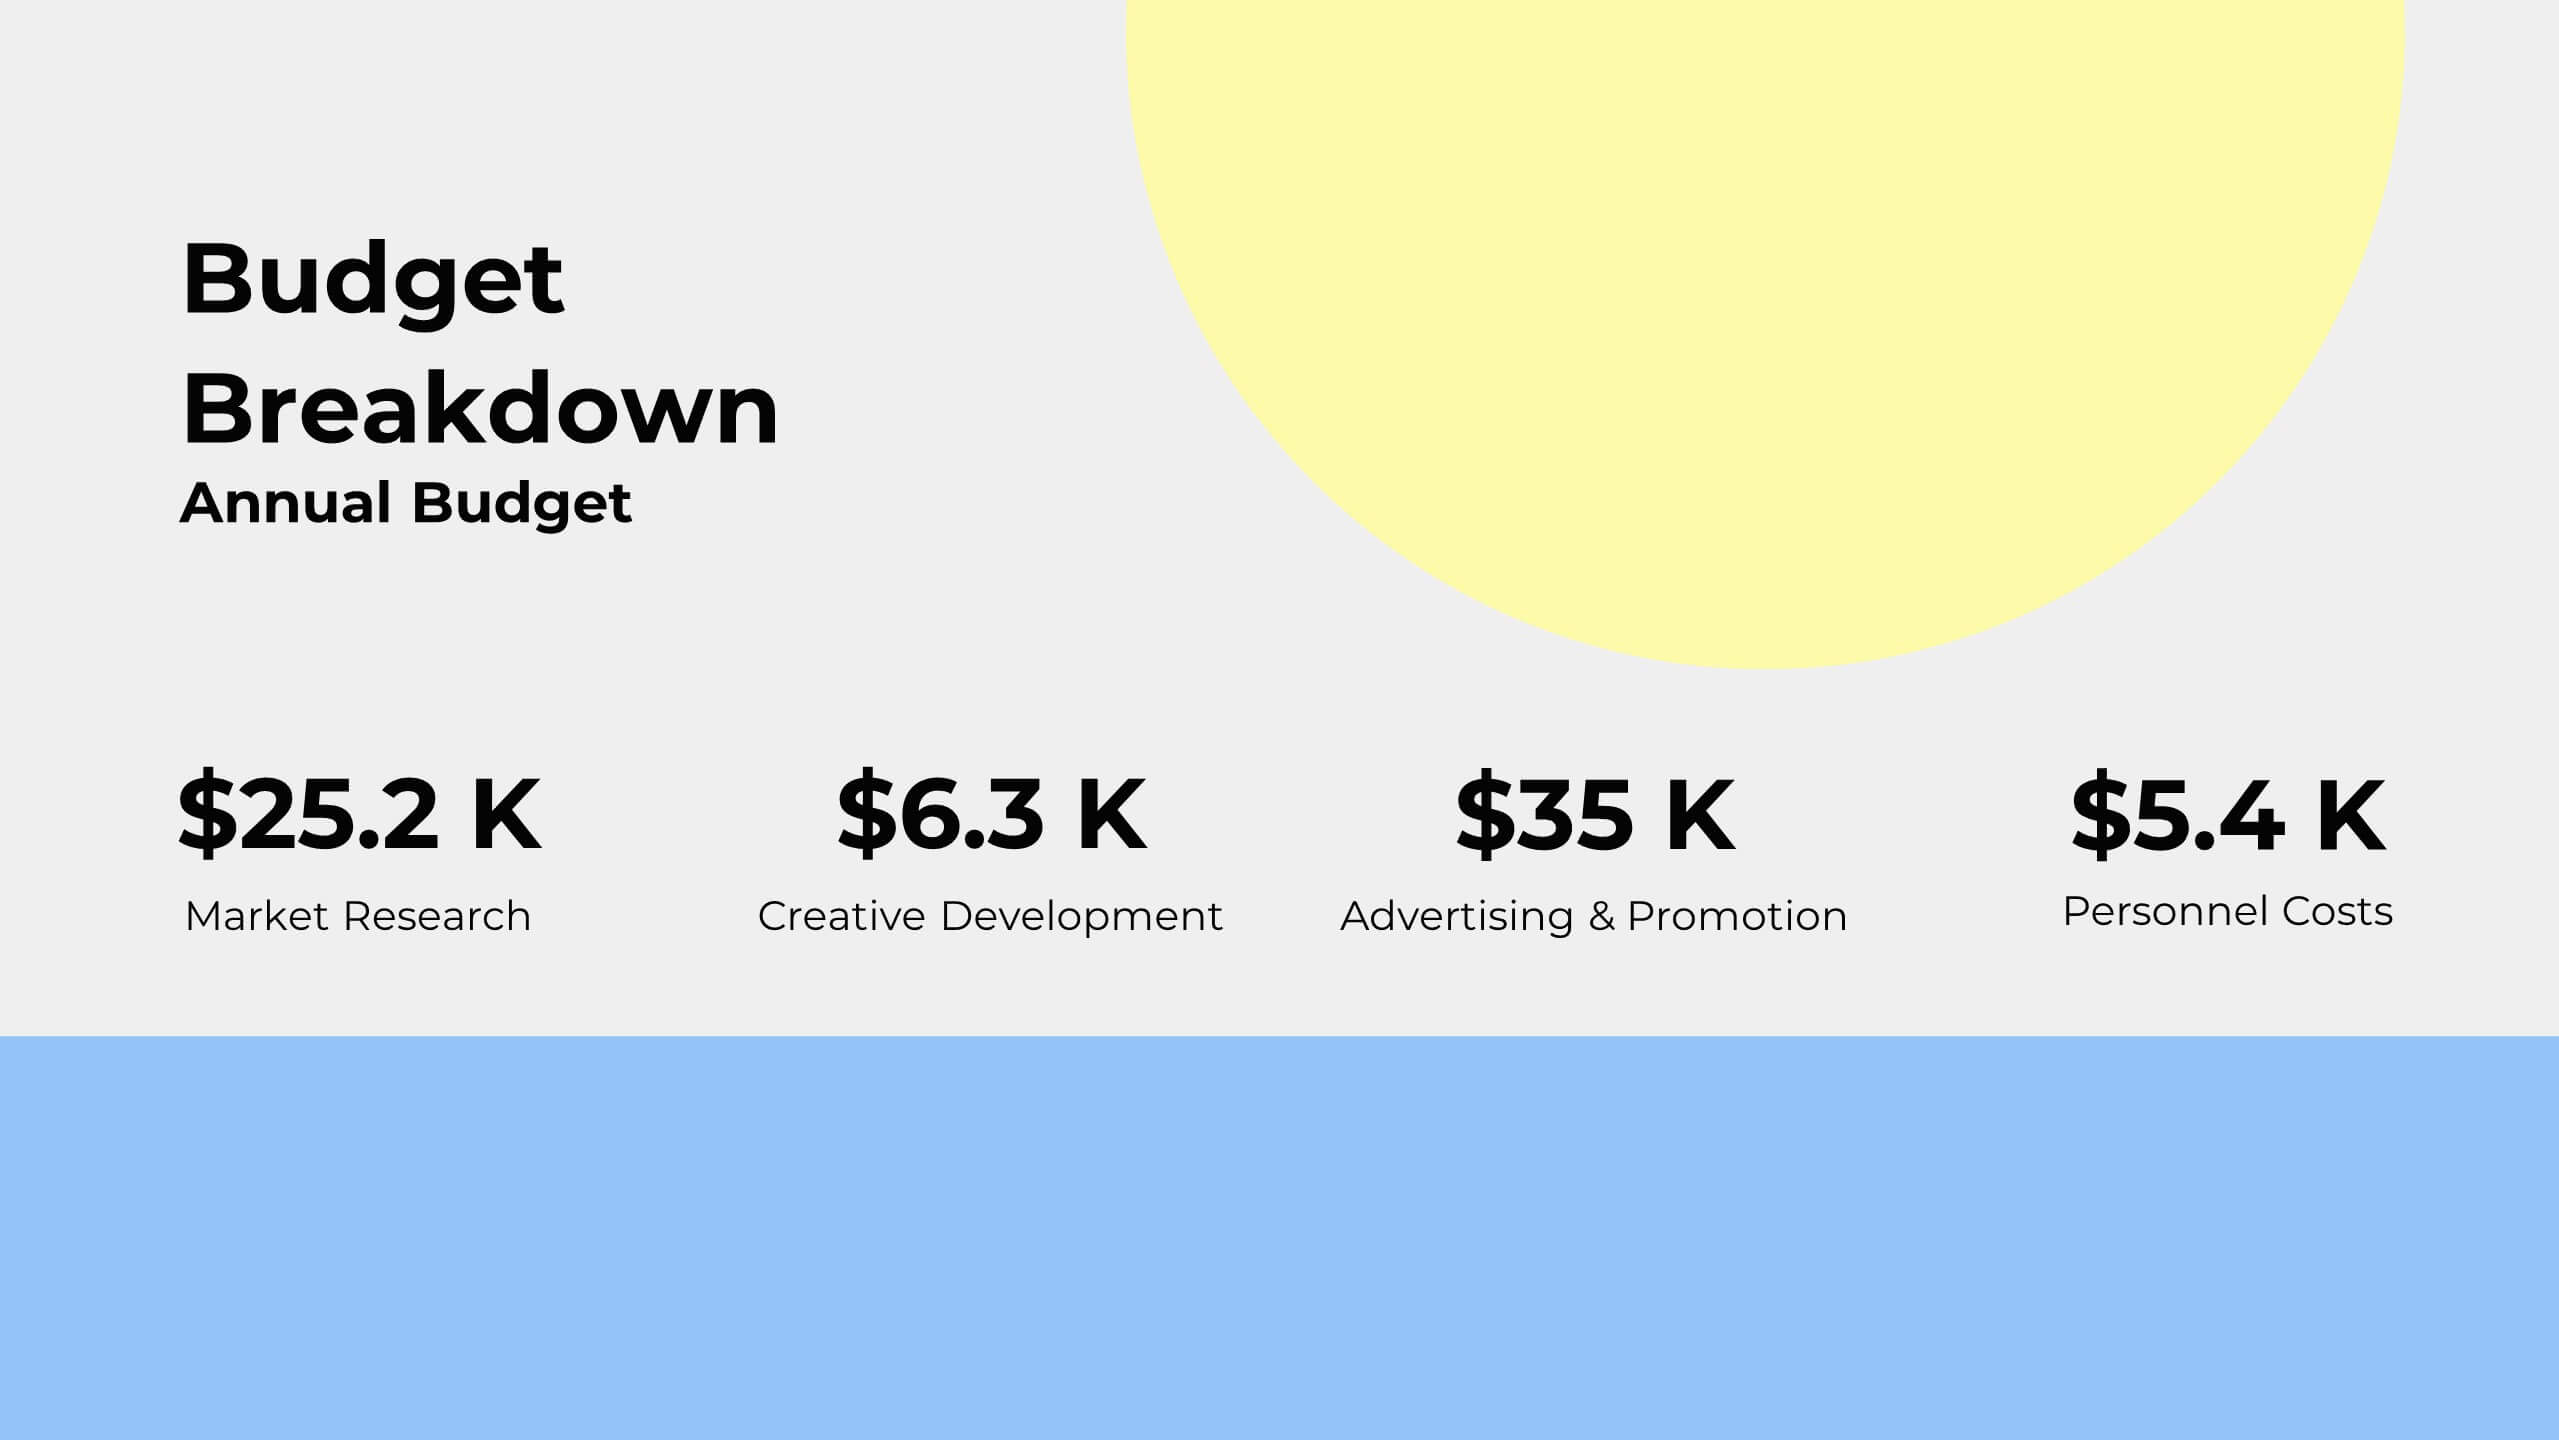
Inspire Business Proposal Presentation
Excite your audience with a compelling business proposal! This template includes sections for objectives, scope of work, timeline, budget, and more. Present your business plan clearly and effectively. Compatible with PowerPoint, Keynote, and Google Slides, it’s designed to impress stakeholders and secure approval for your project. Transform ideas into reality today!


27 diapositivas
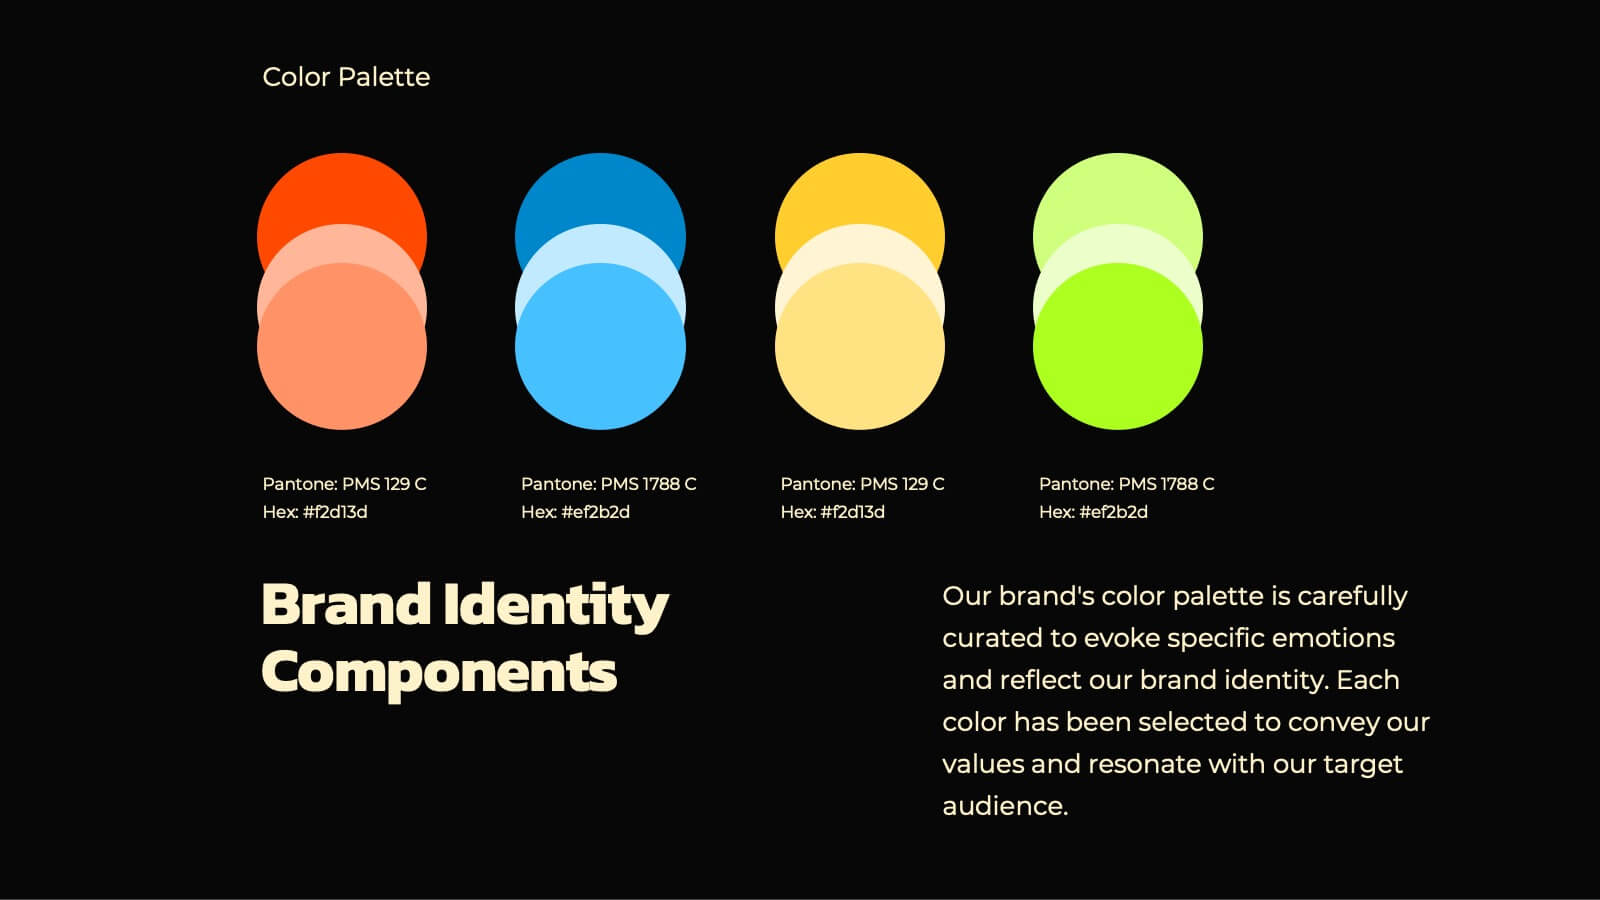
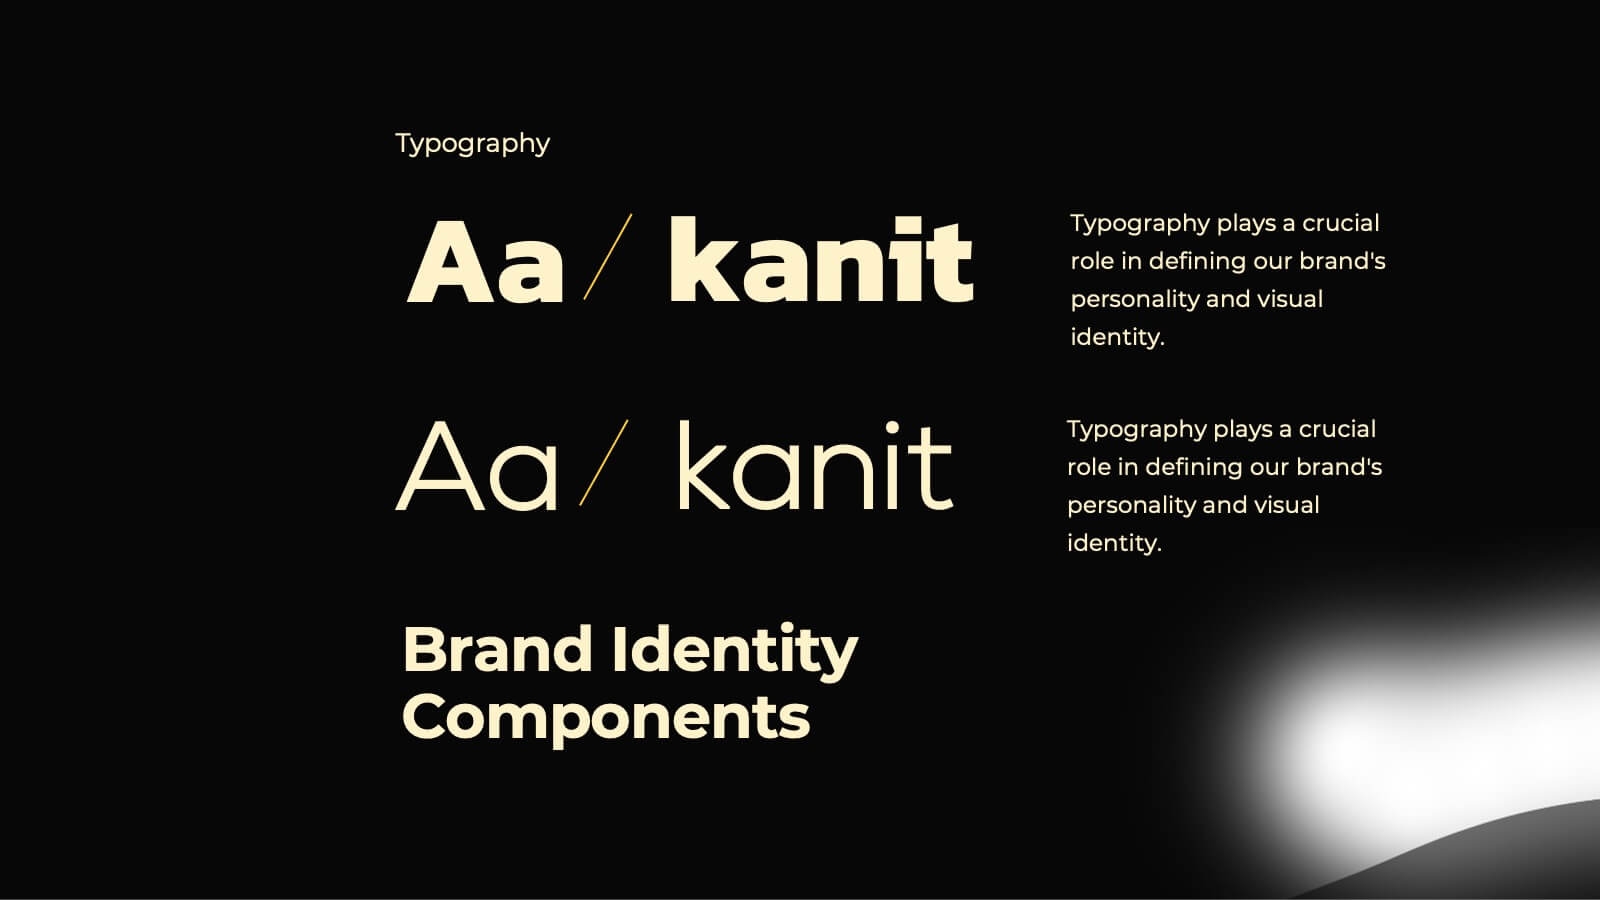
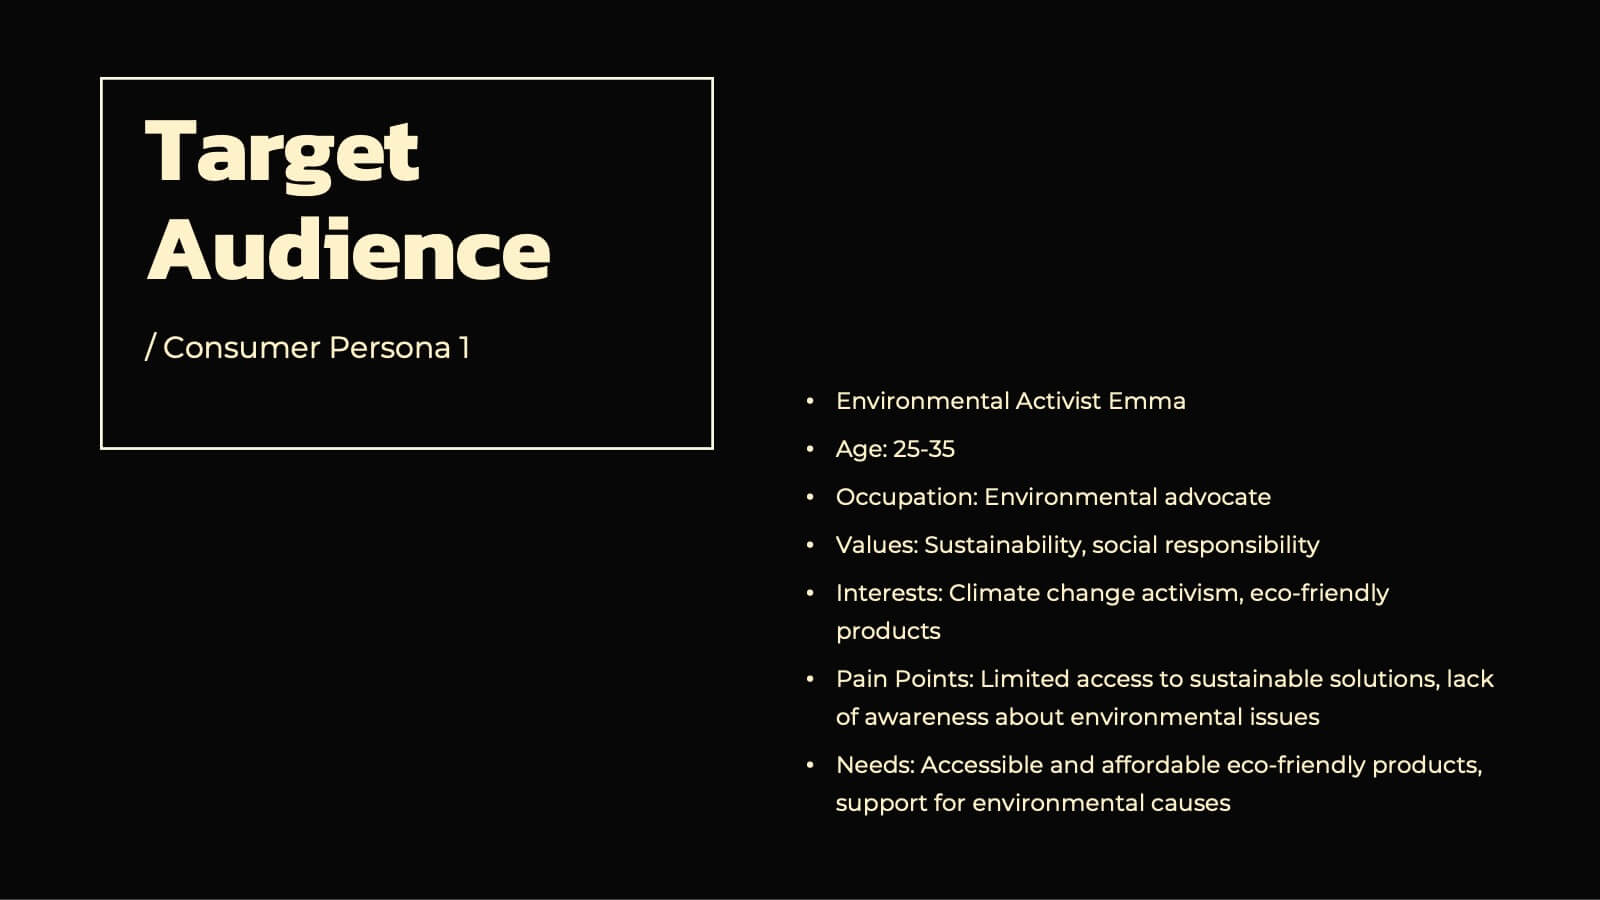
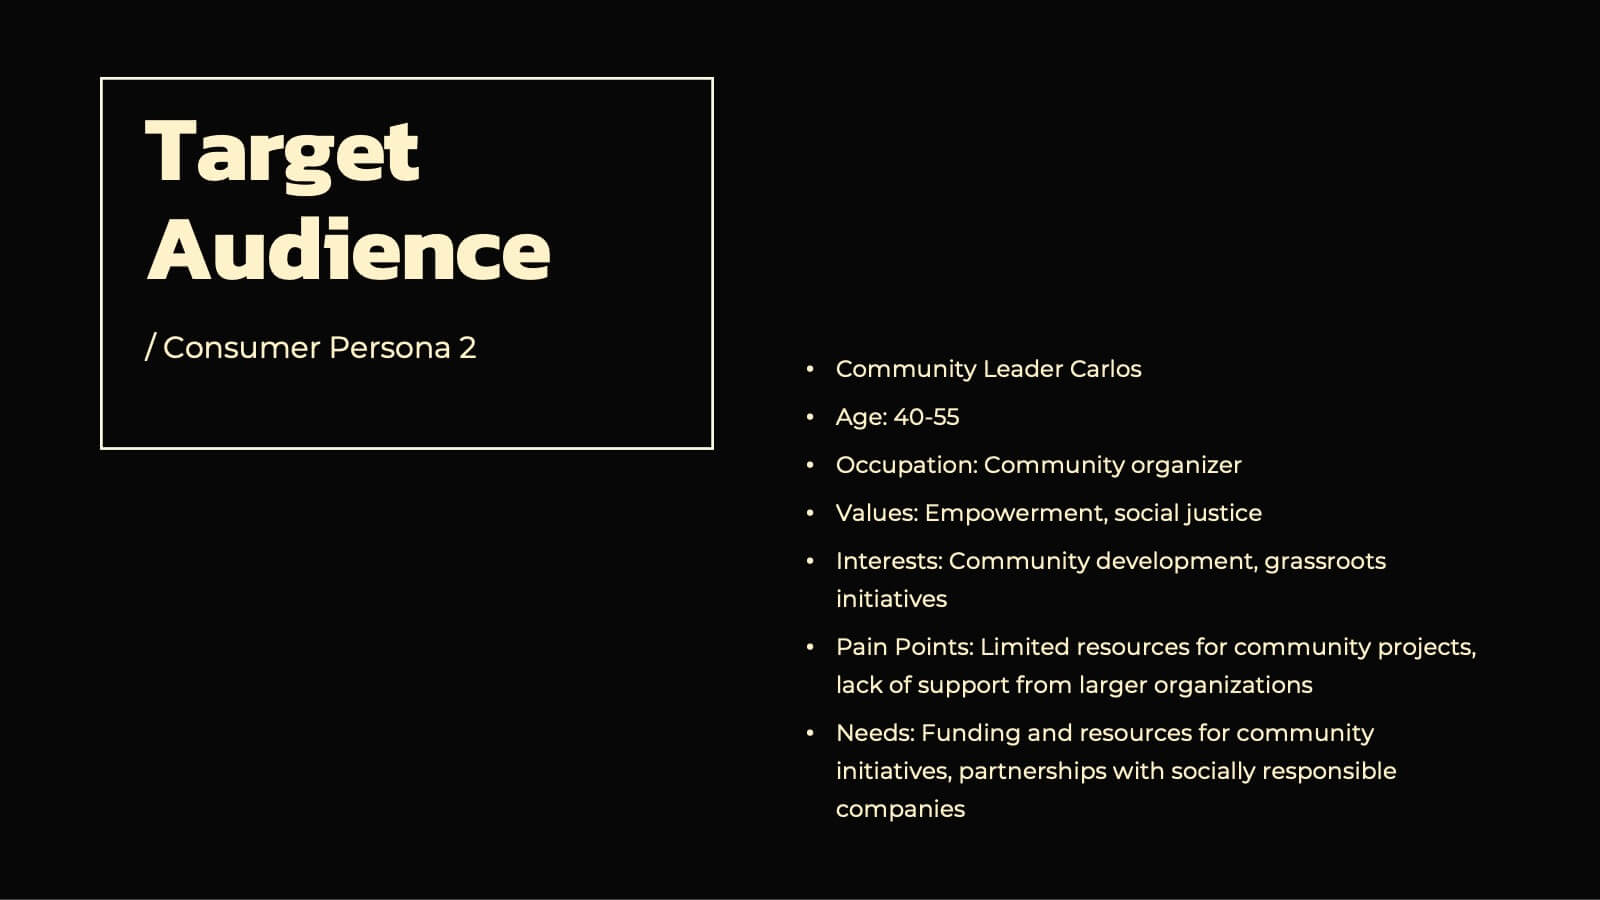
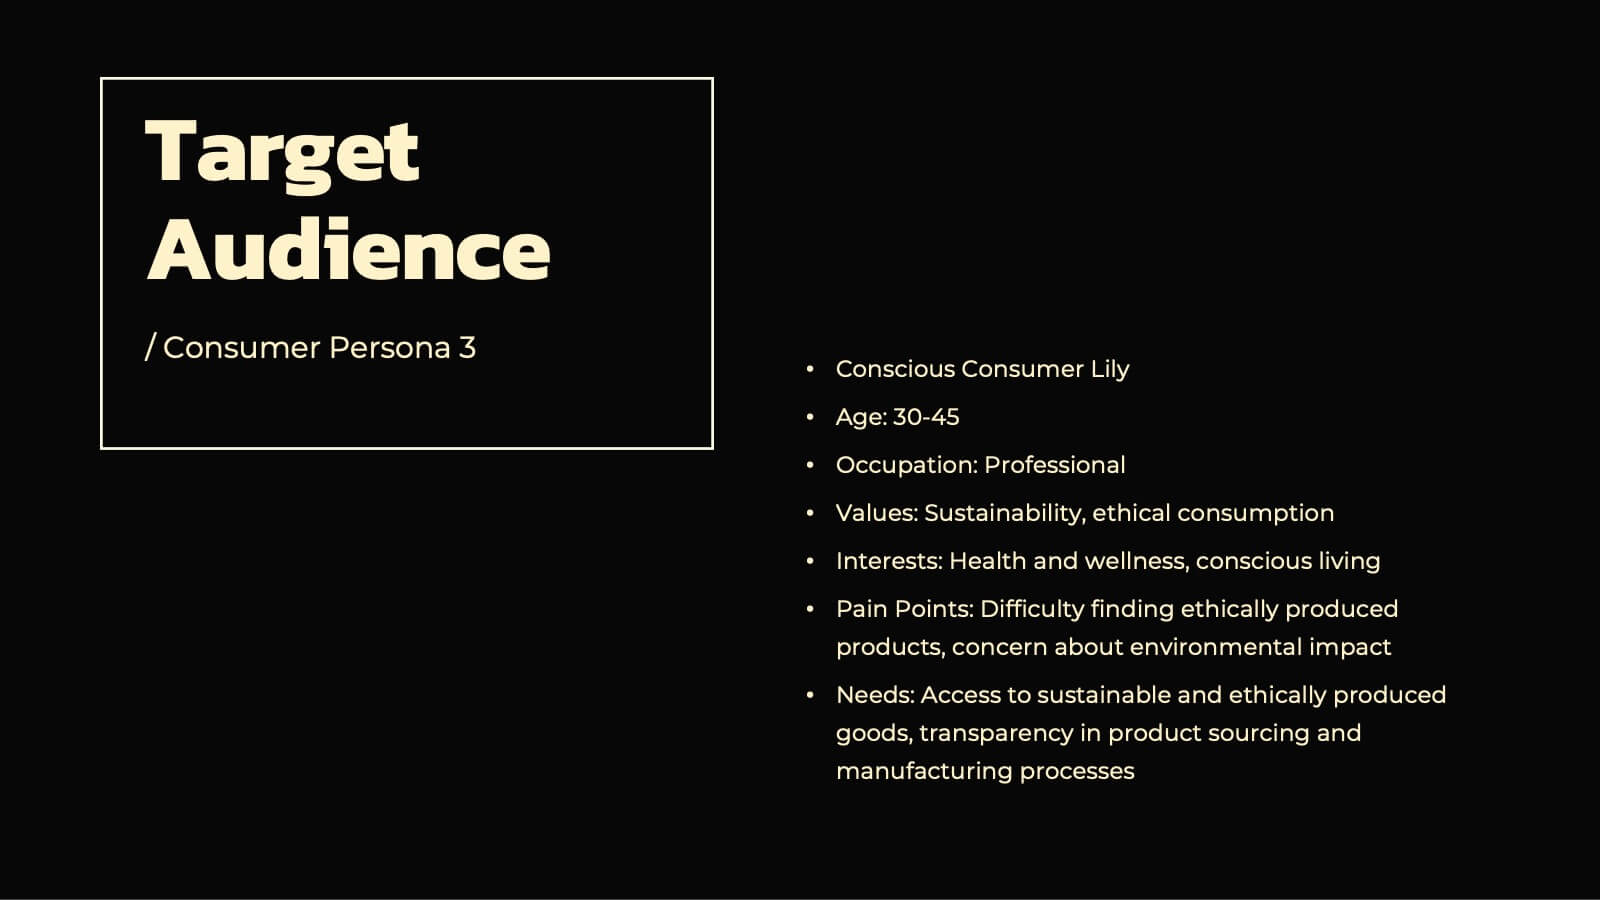
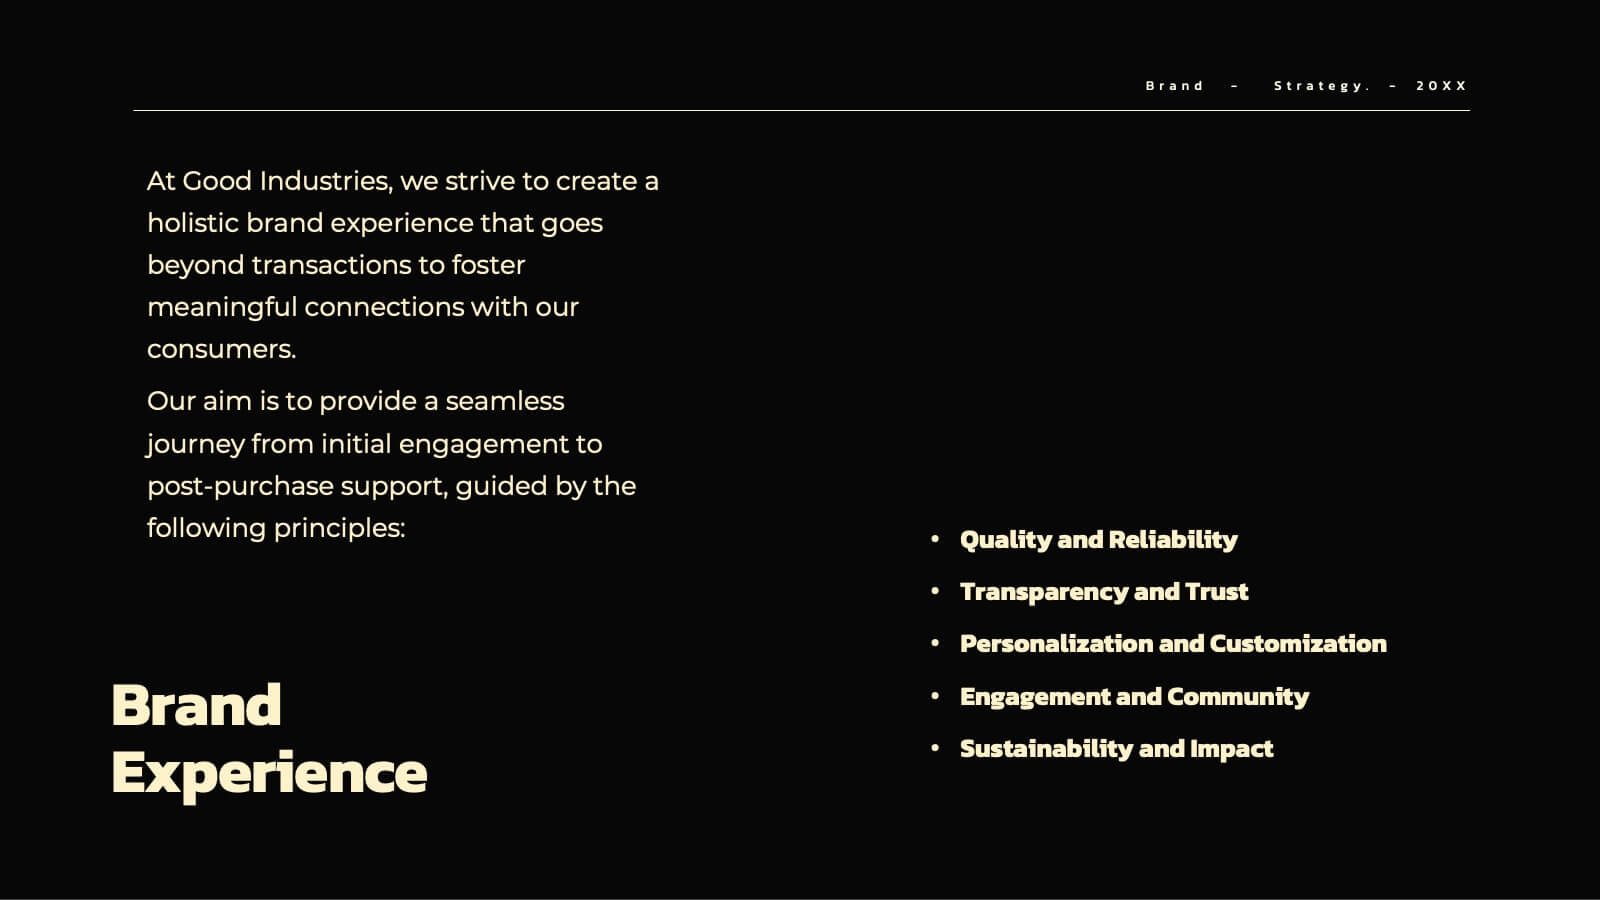
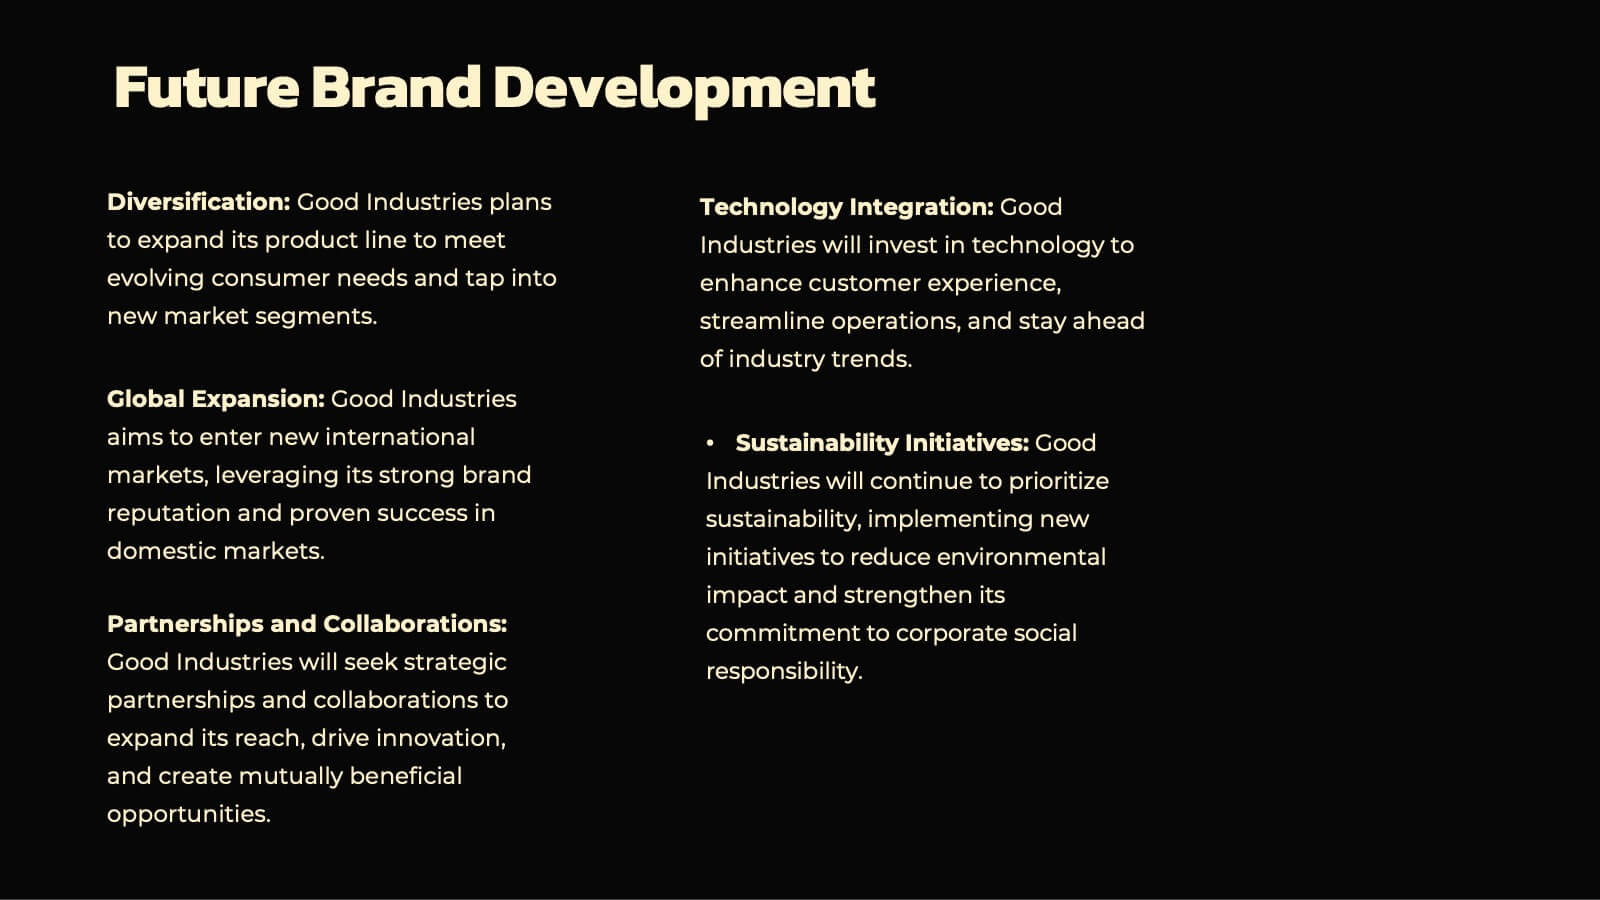
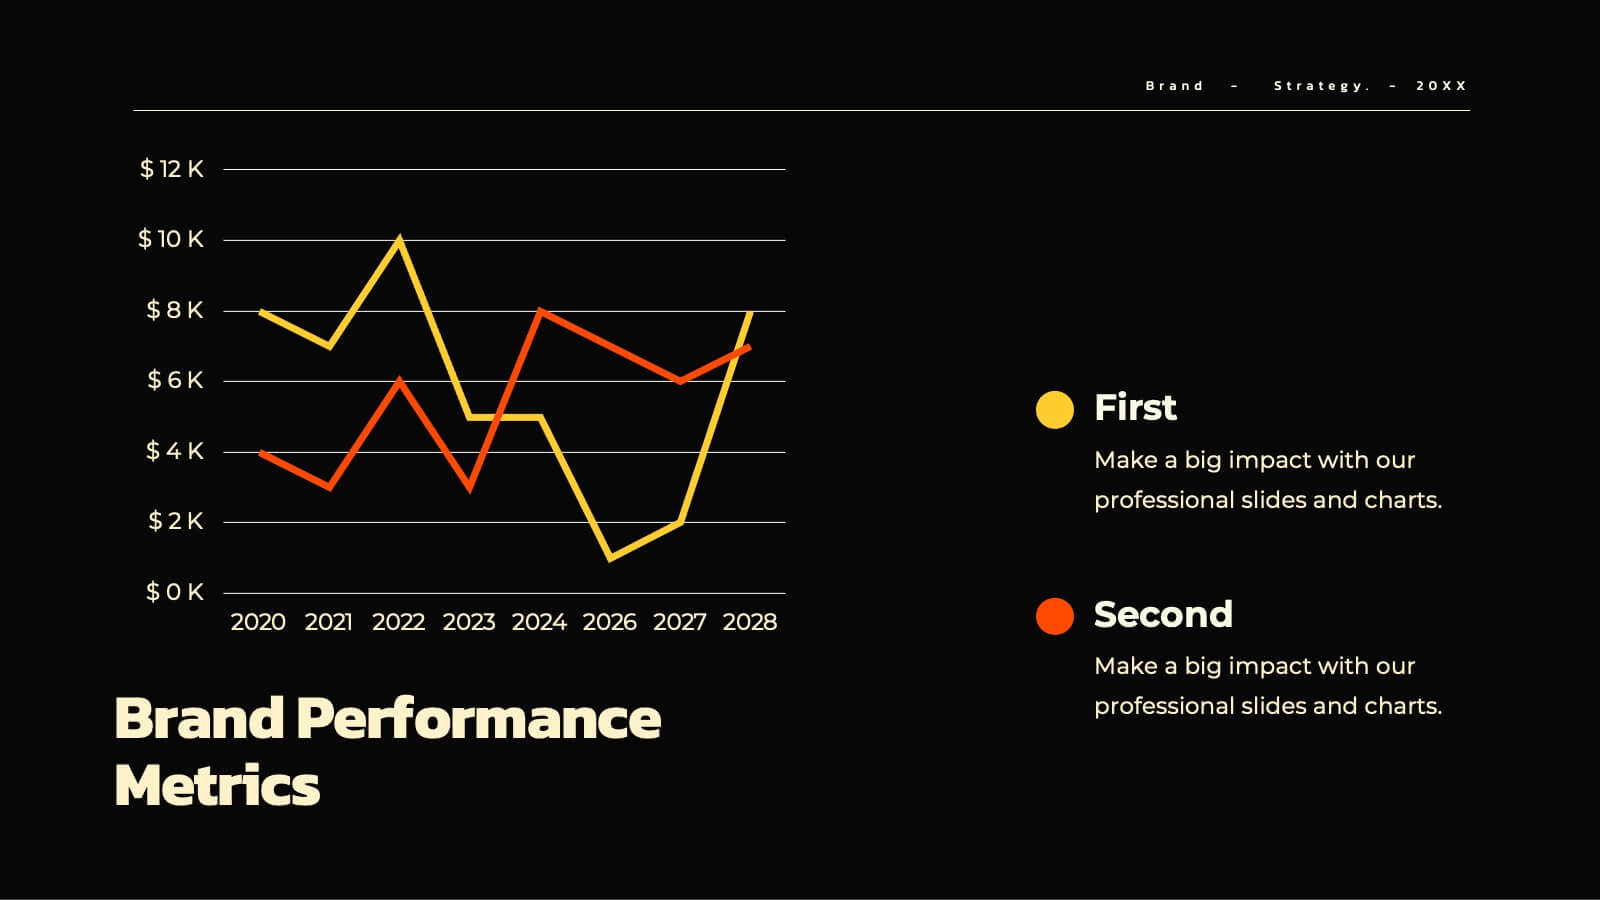
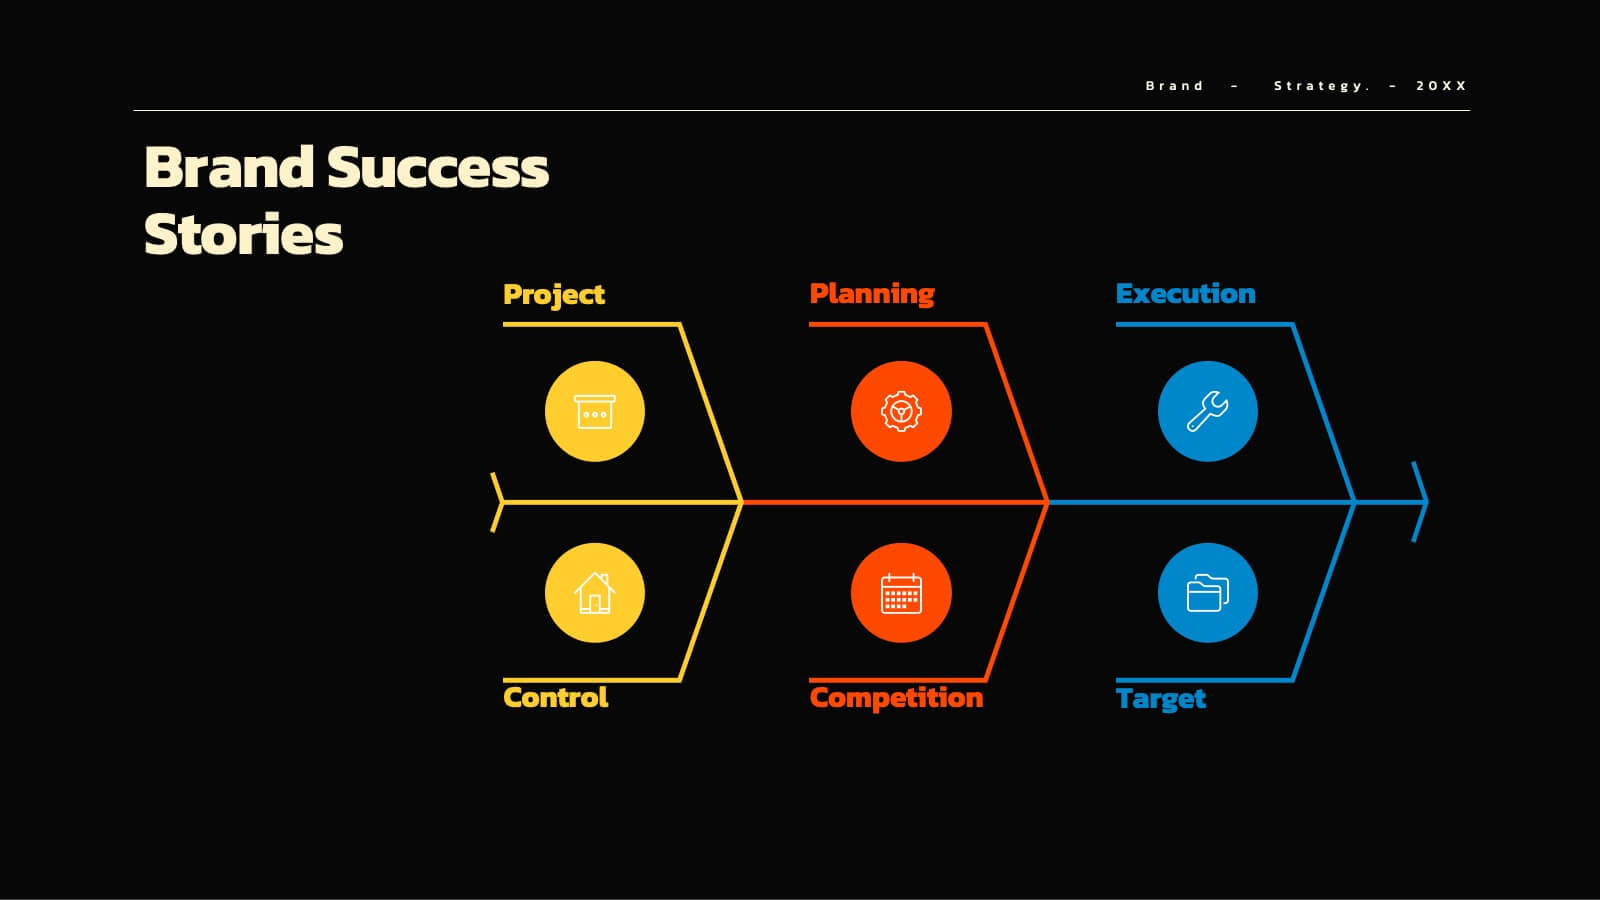
Aqua Brand Strategy Report Presentation
Make waves with this fresh, aqua-inspired presentation template, perfect for delivering a standout brand strategy report! Designed to help you showcase your brand's vision, market positioning, and strategic goals, it features a clean, modern layout that grabs attention. Compatible with PowerPoint, Keynote, and Google Slides for effortless customization.


8 diapositivas
Customer Market Segmentation Analysis
Visualize your audience insights with precision using the Customer Market Segmentation Analysis Presentation. This slide features a sleek, layered funnel design with percentage bars and arrow pointers—ideal for illustrating demographic splits, buyer behavior, or psychographic segments. With space for four data-driven categories and custom labels, this template is perfect for marketers, analysts, and product teams looking to present actionable customer data. Fully editable in PowerPoint, Keynote, and Google Slides, and easy to adapt to any color scheme or branding.


23 diapositivas
Meteor New Product Proposal Presentation
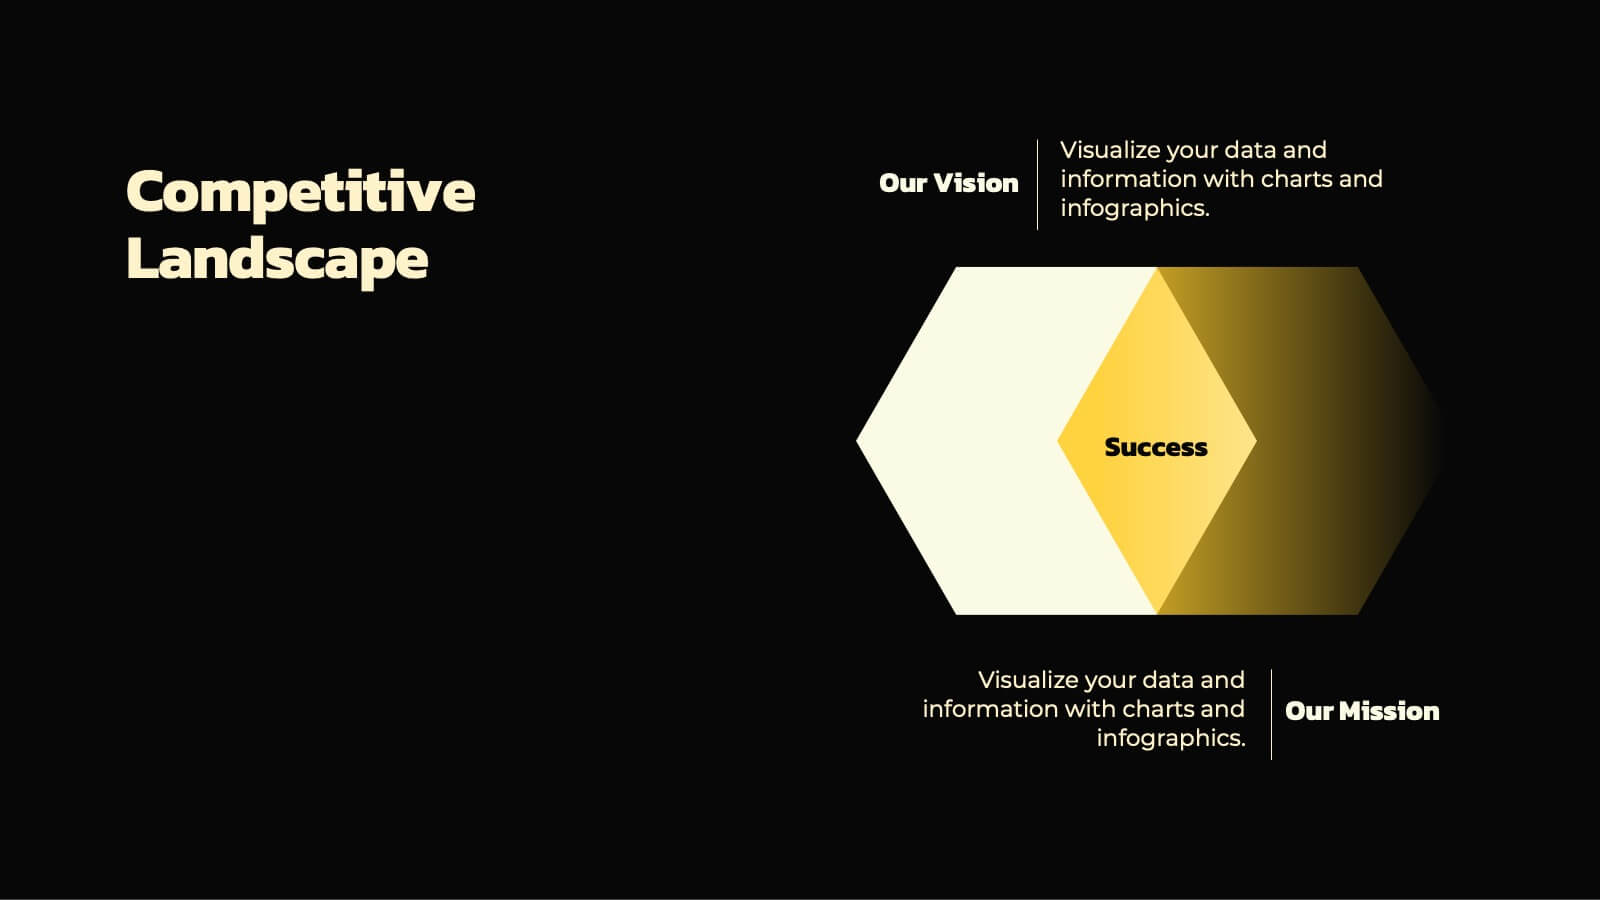
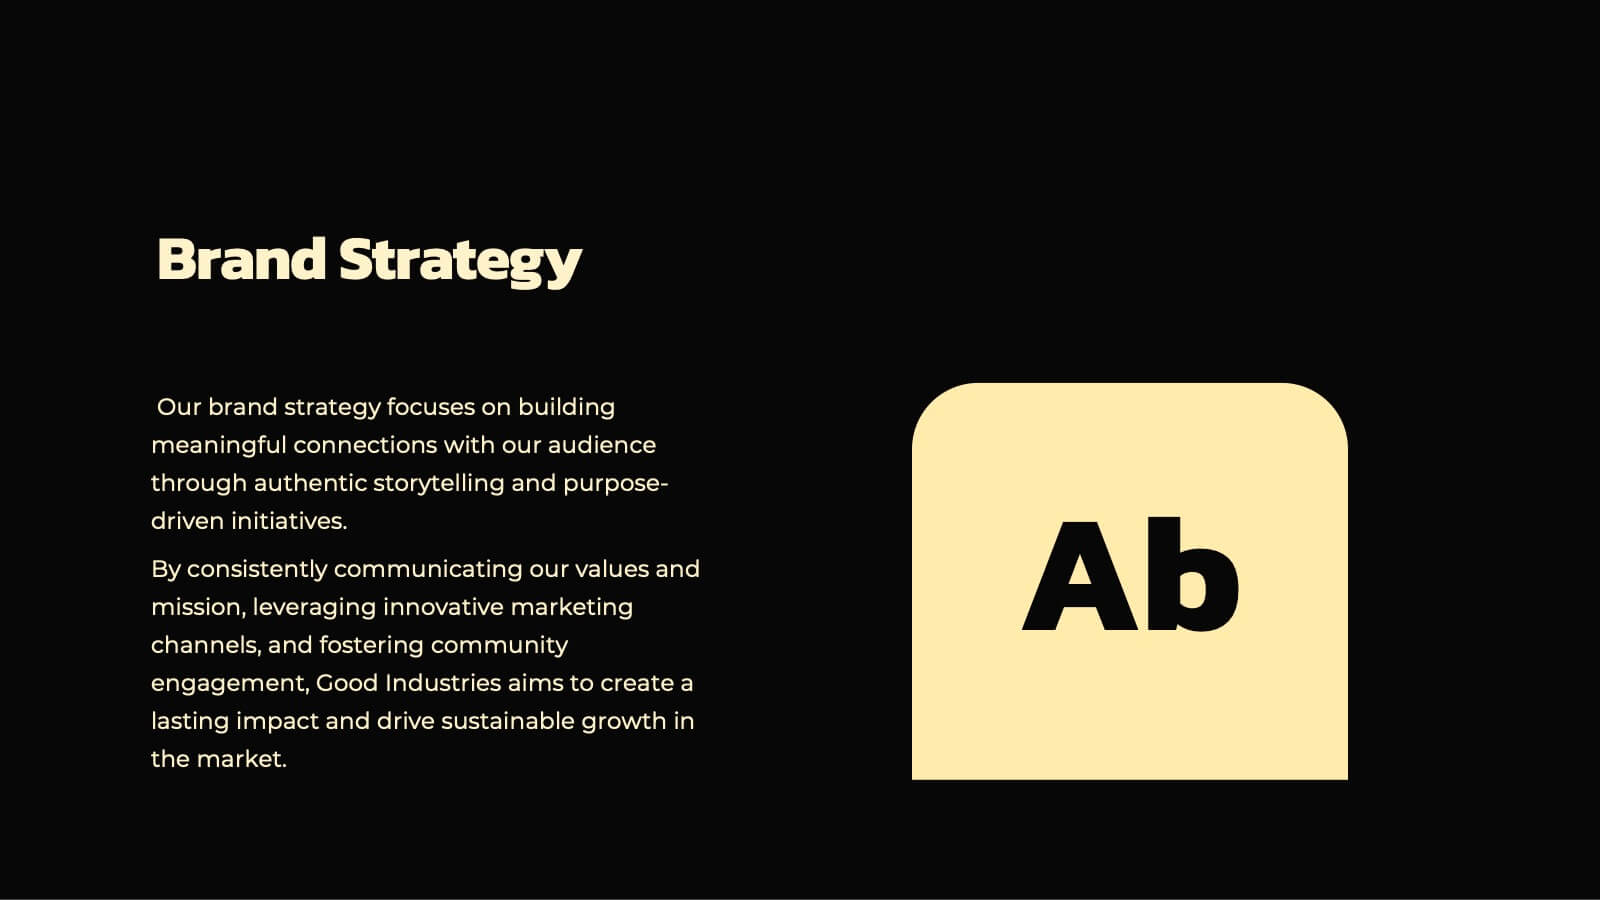
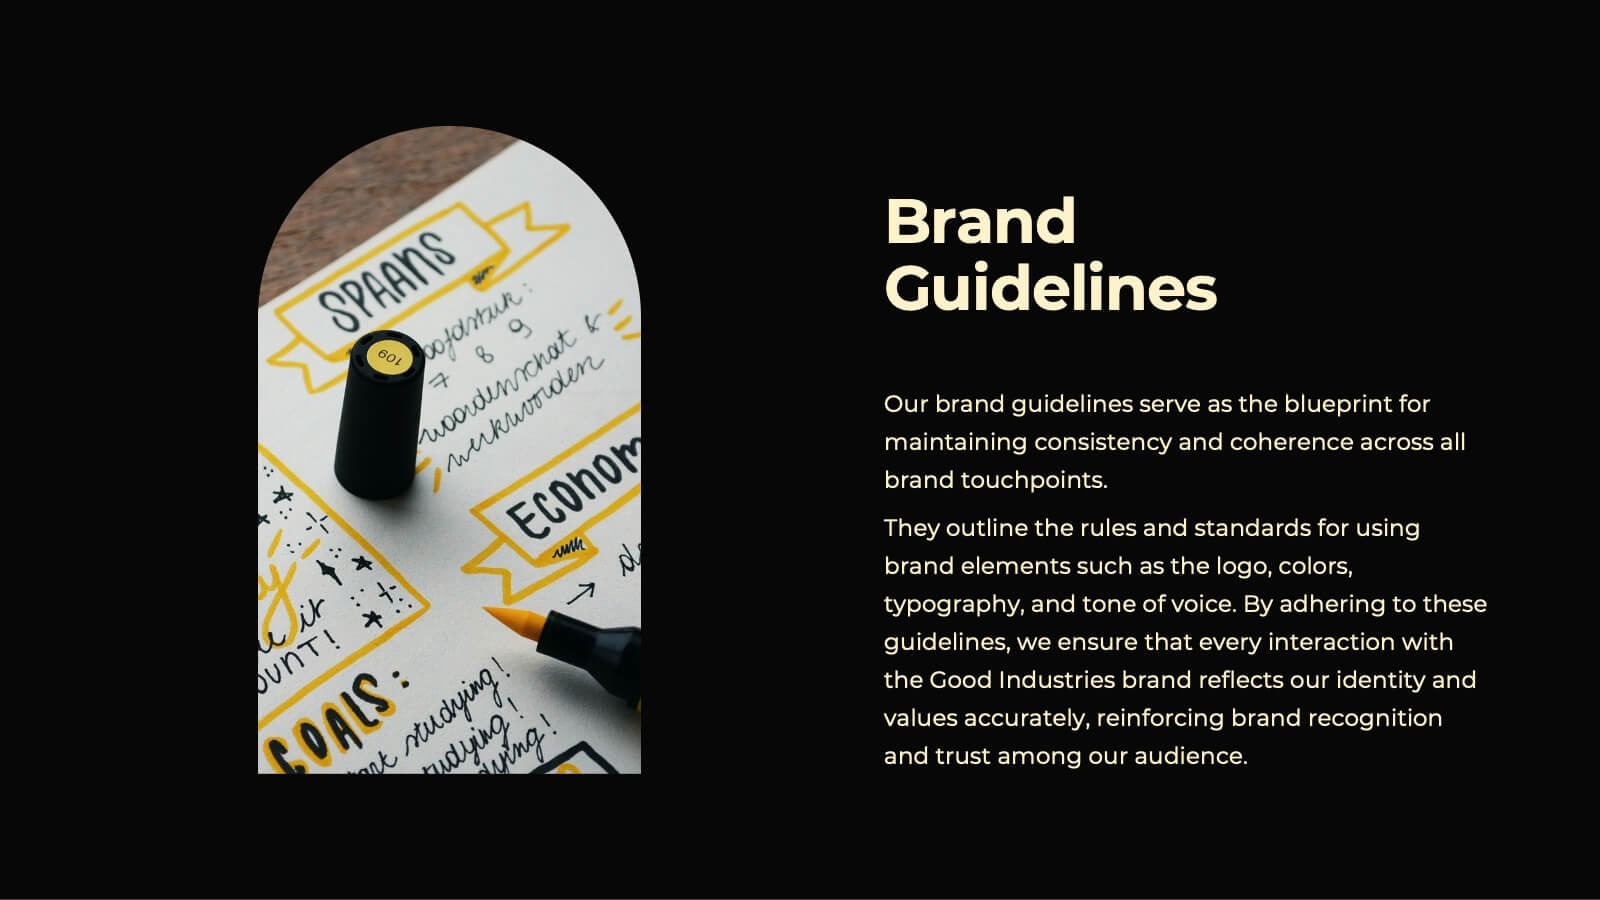
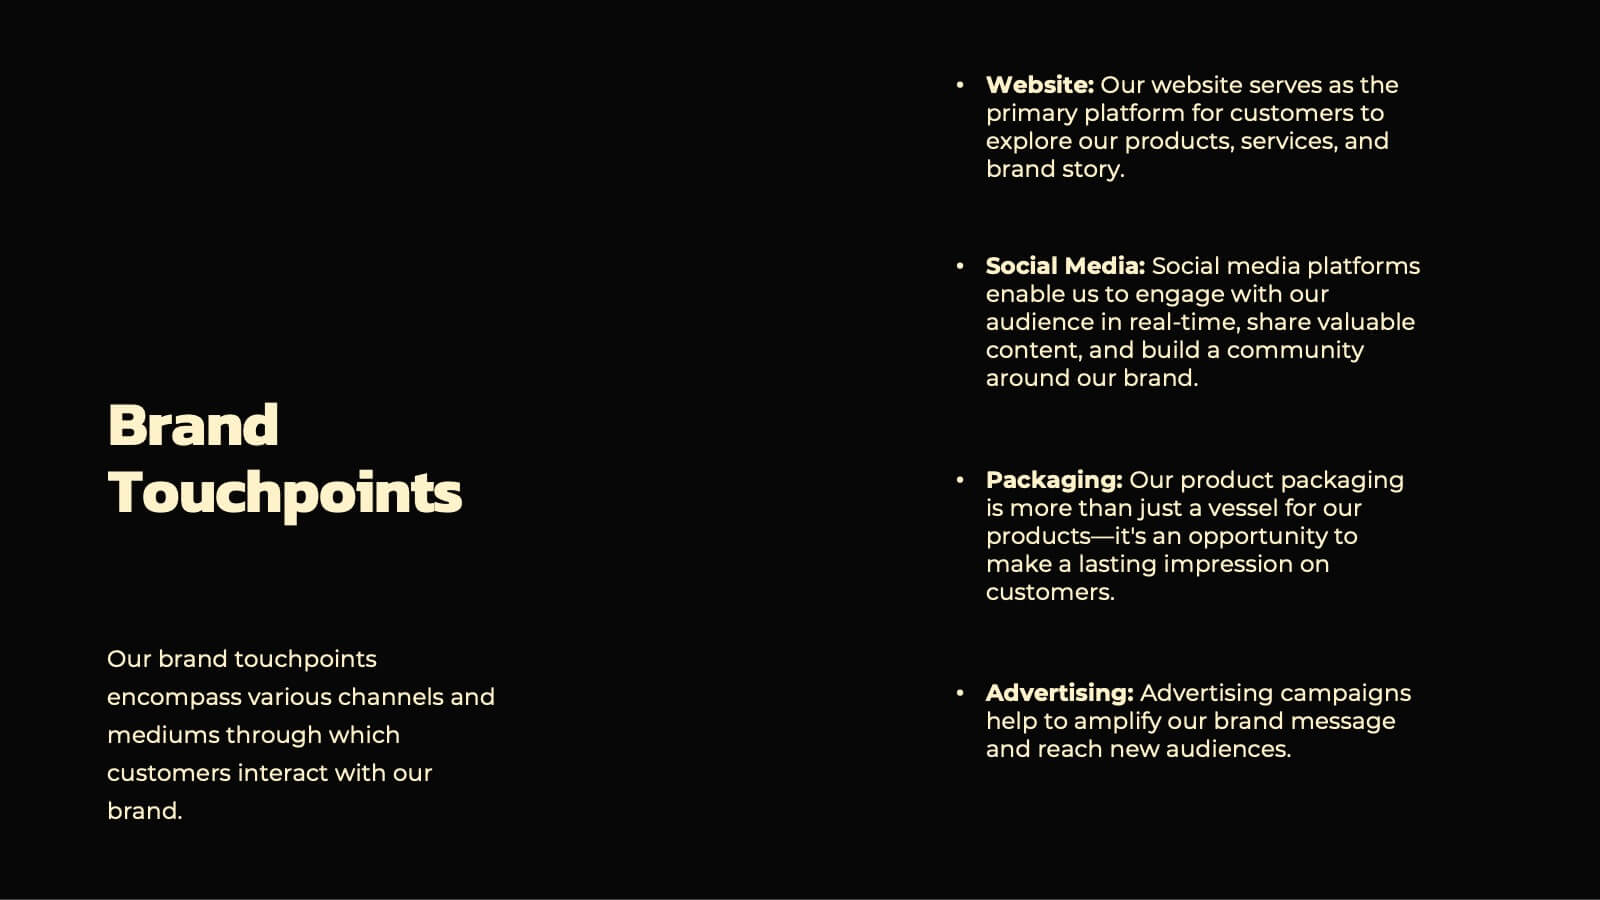
The Meteor New Product Proposal template is the perfect tool for presenting your innovative ideas in a bold and professional manner. With its striking yellow and black color scheme, this template grabs attention while maintaining a clean and modern aesthetic. It’s designed to help you effectively communicate your product’s potential, covering key aspects such as problem statement, solution, market opportunity, competitive landscape, and unique selling proposition. The template also includes sections for financials, growth projections, and risk analysis, ensuring that every critical detail is covered. Ideal for startups, product managers, and marketers, this template is fully compatible with PowerPoint, Keynote, and Google Slides, making it easy to customize and present on any platform. Impress investors, stakeholders, or team members with a comprehensive and visually compelling proposal that highlights the strengths and opportunities of your new product.


6 diapositivas
Process Direction Flow Mapping
Showcase linear progress with clarity using the Process Direction Flow Mapping Presentation. This layout features a clean, step-by-step directional flow with five stages, ideal for outlining project phases, business workflows, or timeline milestones. Each stage is color-coded with editable text areas, making it easy to customize and adapt for PowerPoint, Keynote, or Google Slides.


20 diapositivas
Team Meeting Presentation
Streamline your team meetings with this professional presentation template, designed in striking purple tones. It covers all essential aspects from agenda setting to feedback collection, ensuring efficient and effective communication. Compatible with PowerPoint, Google Slides, and Keynote, this template is perfect for keeping your team aligned and focused.


8 diapositivas
Core Pillars of Business Success Presentation
Highlight your company’s foundation with the Core Pillars of Business Success presentation. This slide features four bold, column-style visuals labeled A through D—each representing a critical component of your business strategy. Ideal for illustrating structure, vision, and stability, it helps communicate growth factors like leadership, innovation, operations, and finance. Fully editable in PowerPoint, Keynote, and Google Slides, it's perfect for consultants, executives, and strategic planners.


23 diapositivas
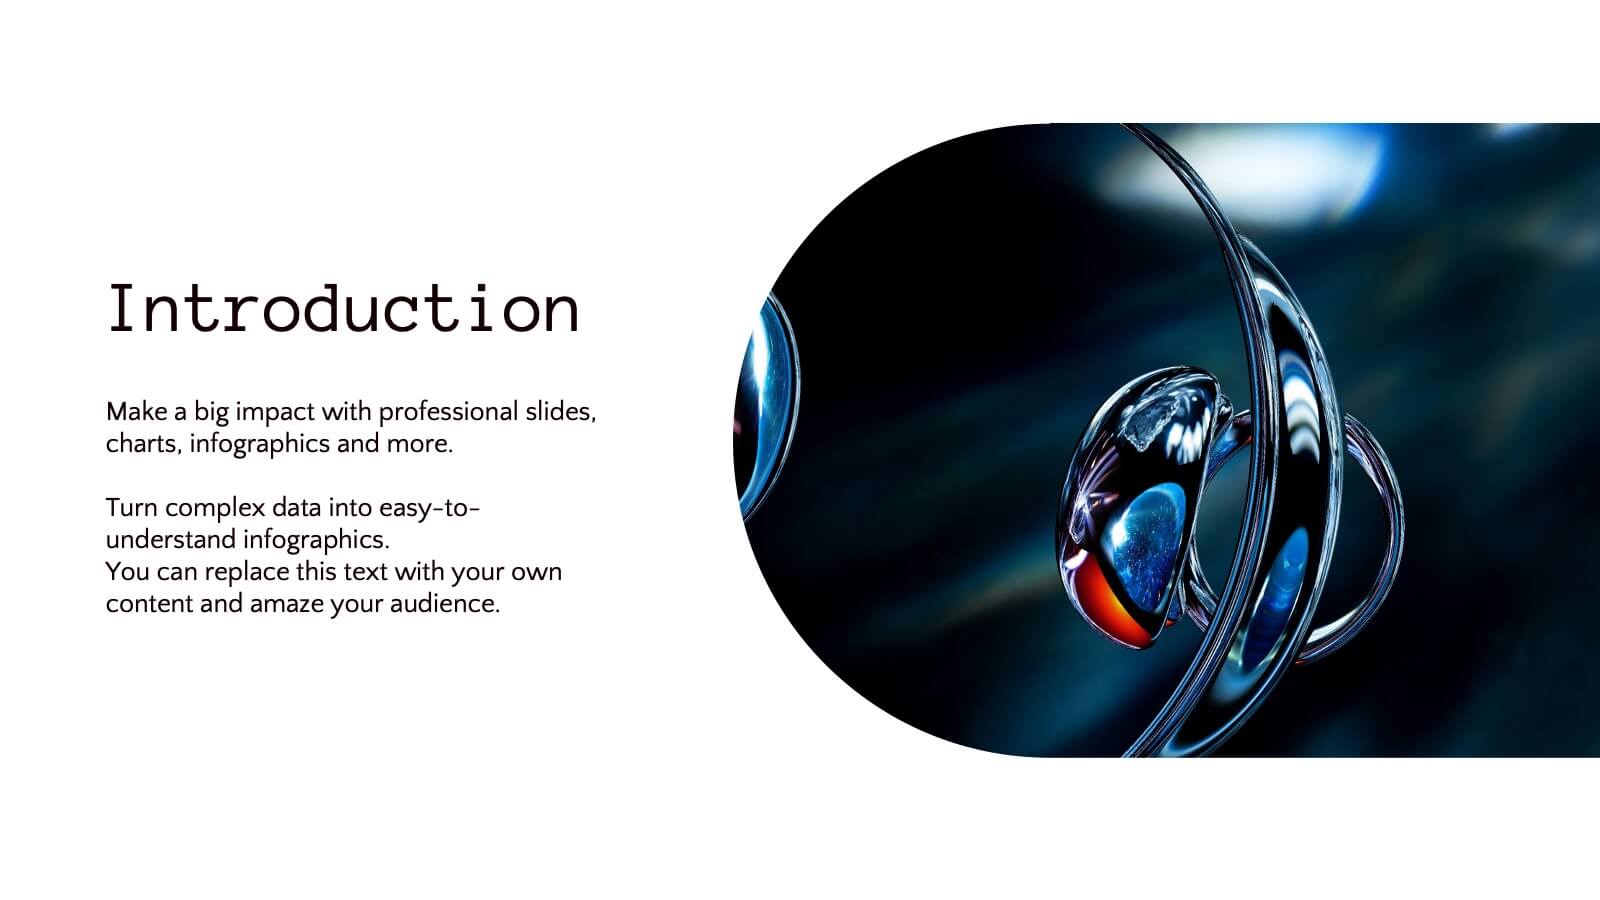
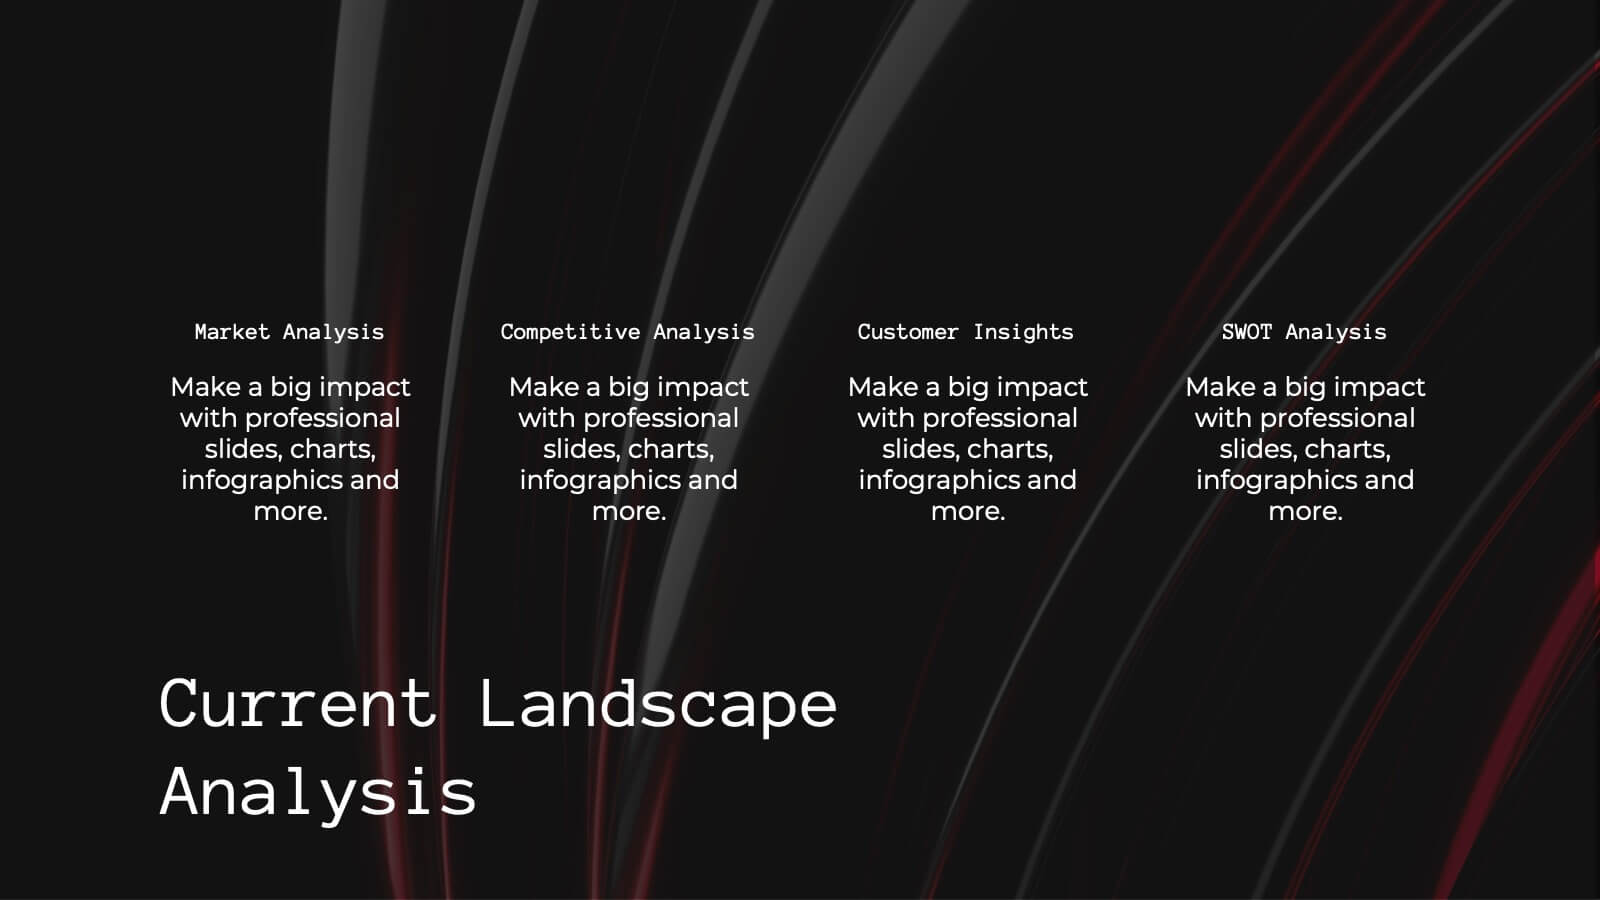
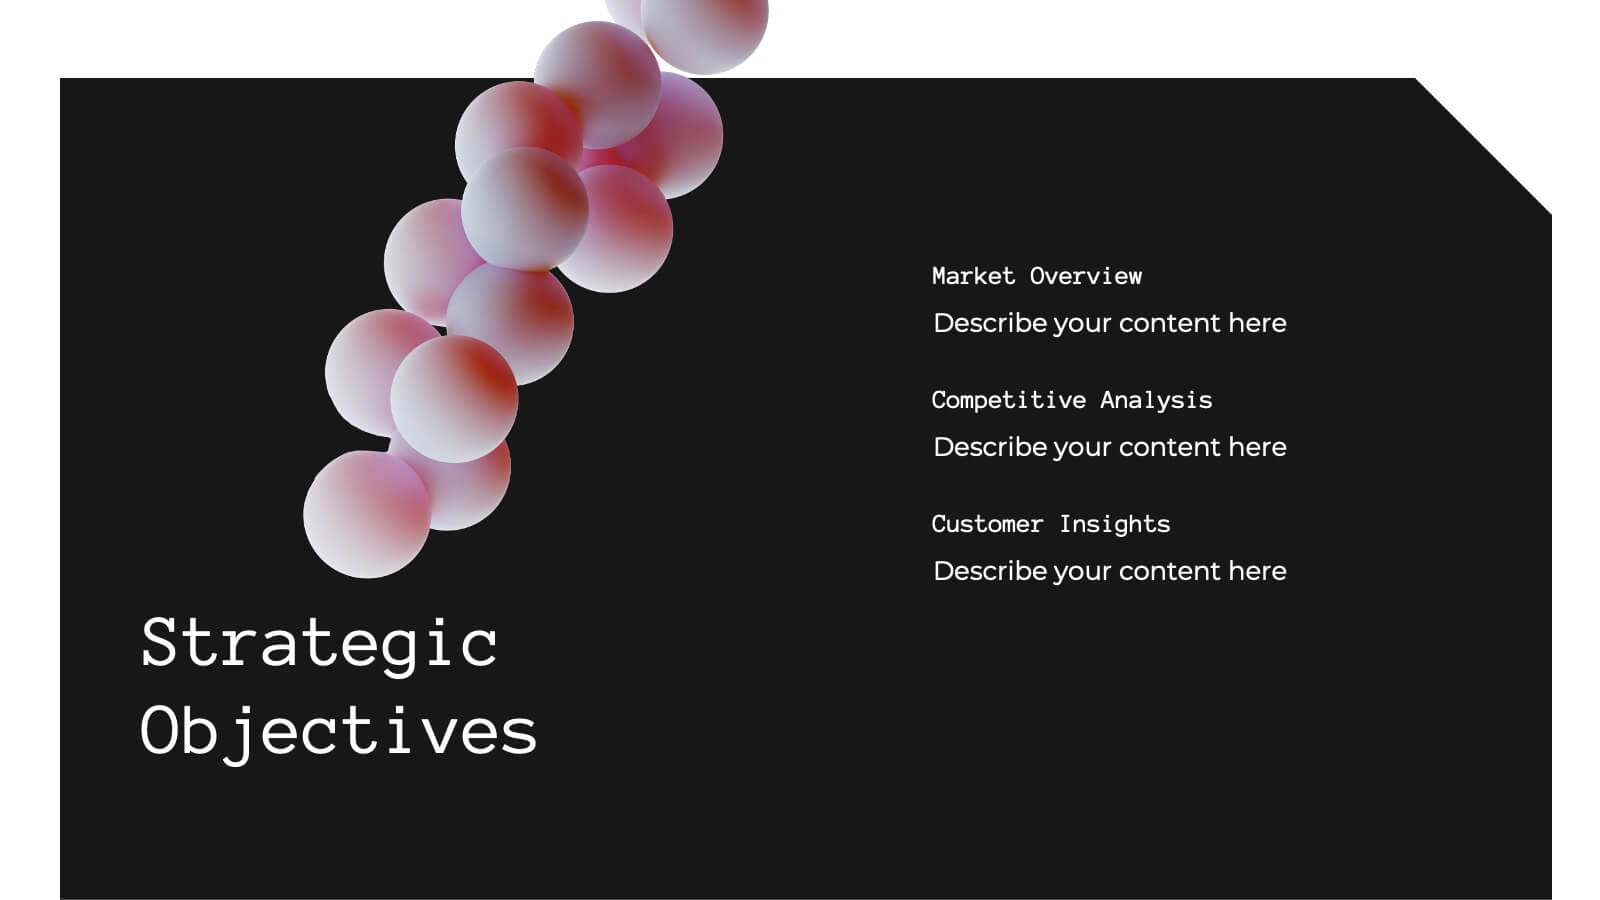
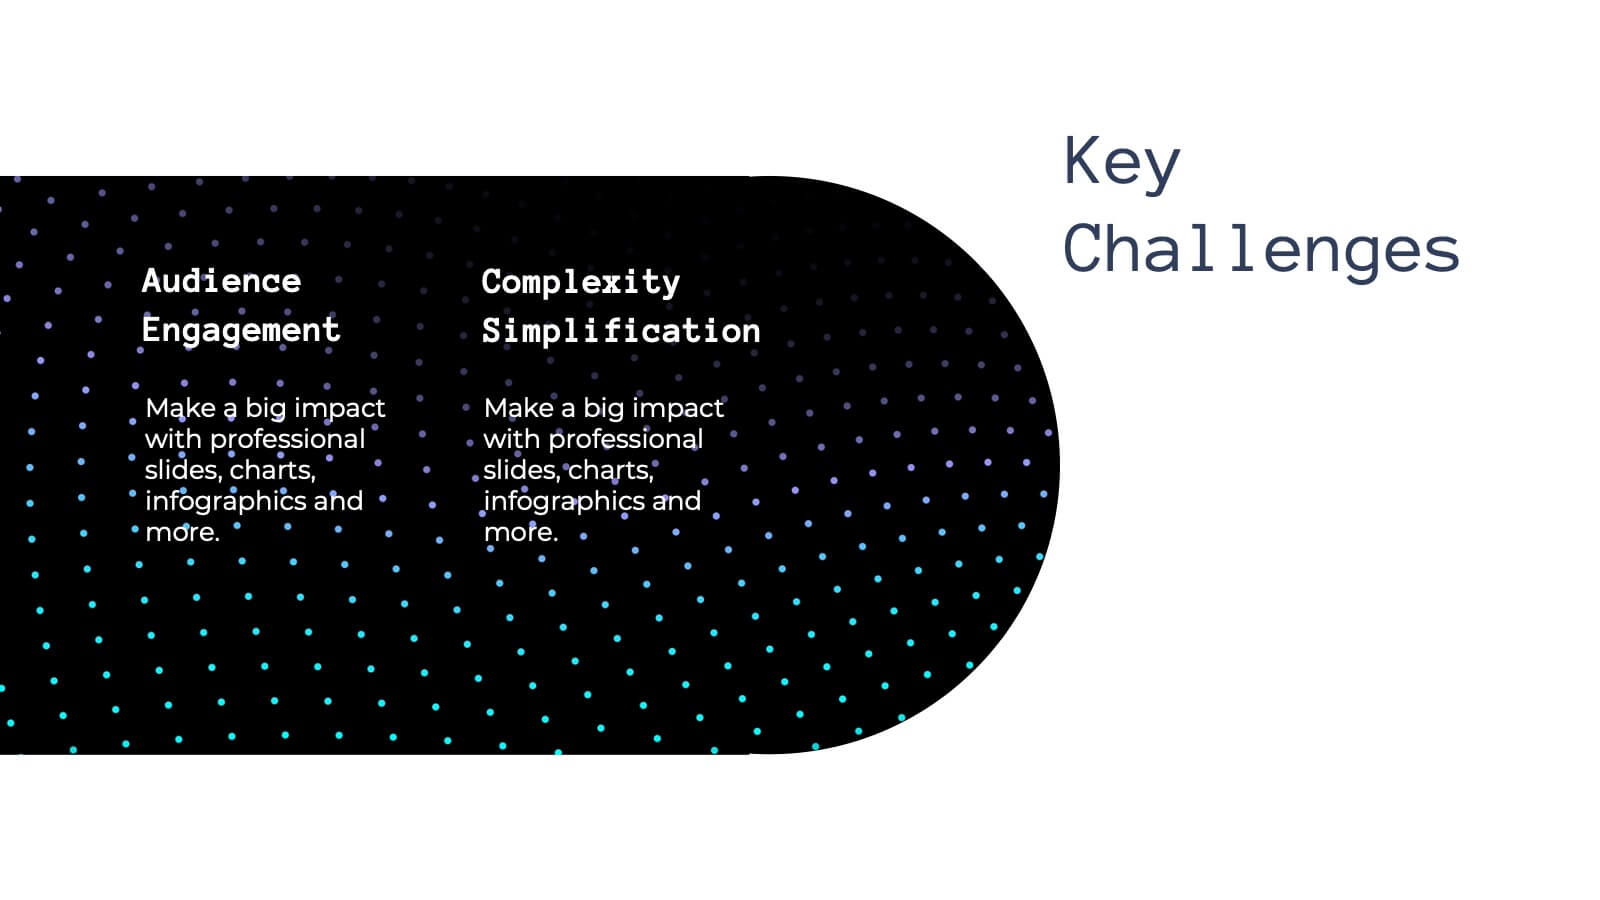
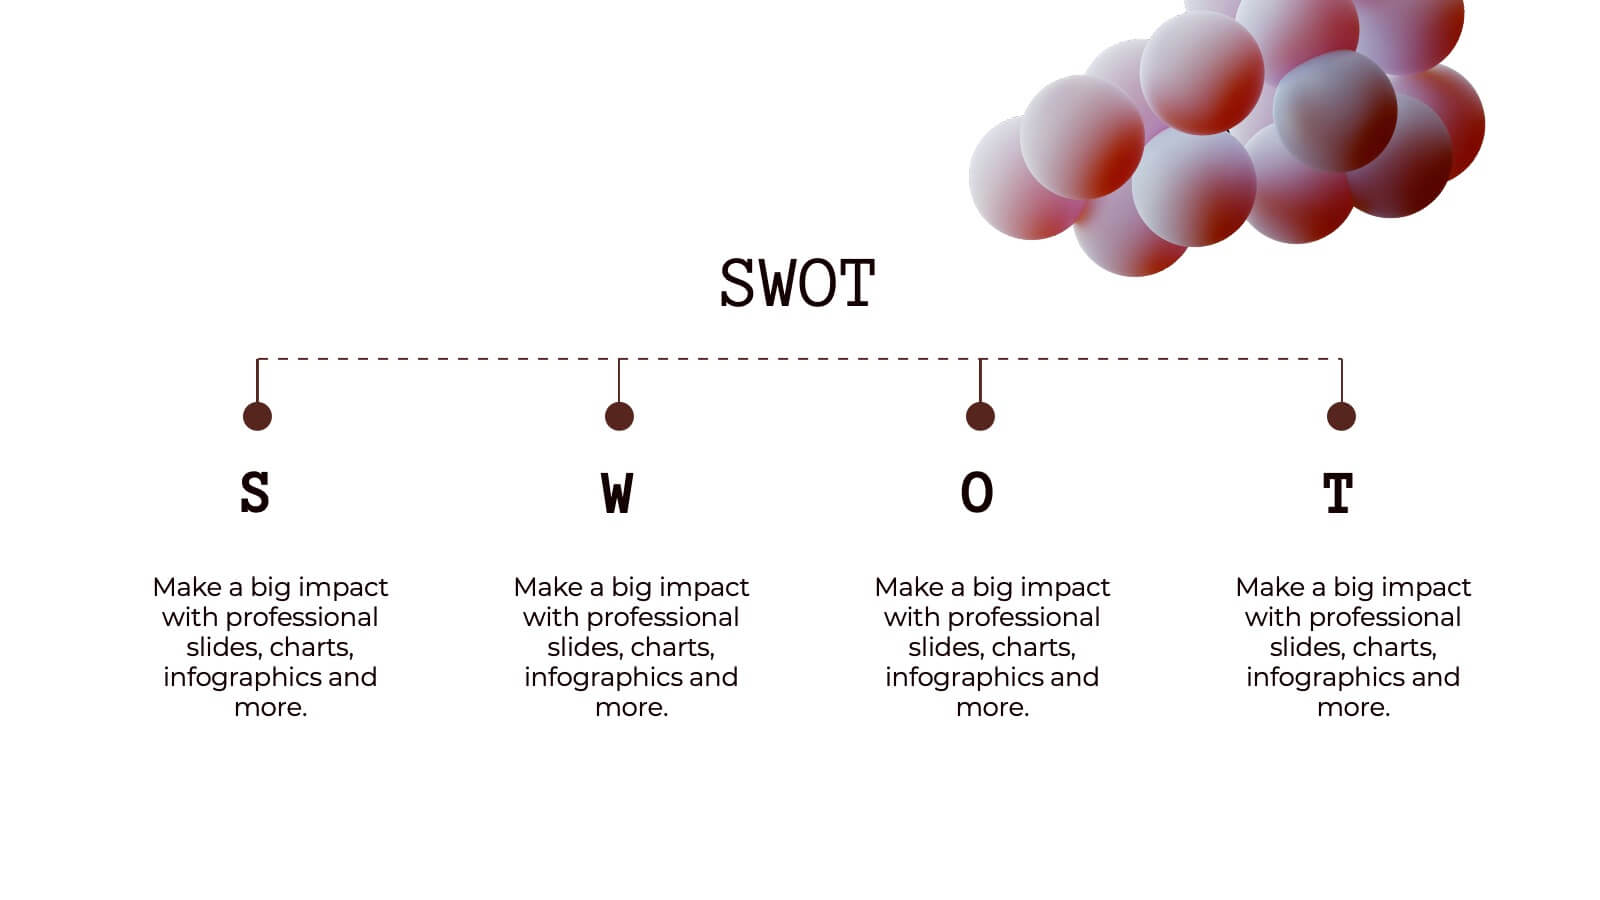
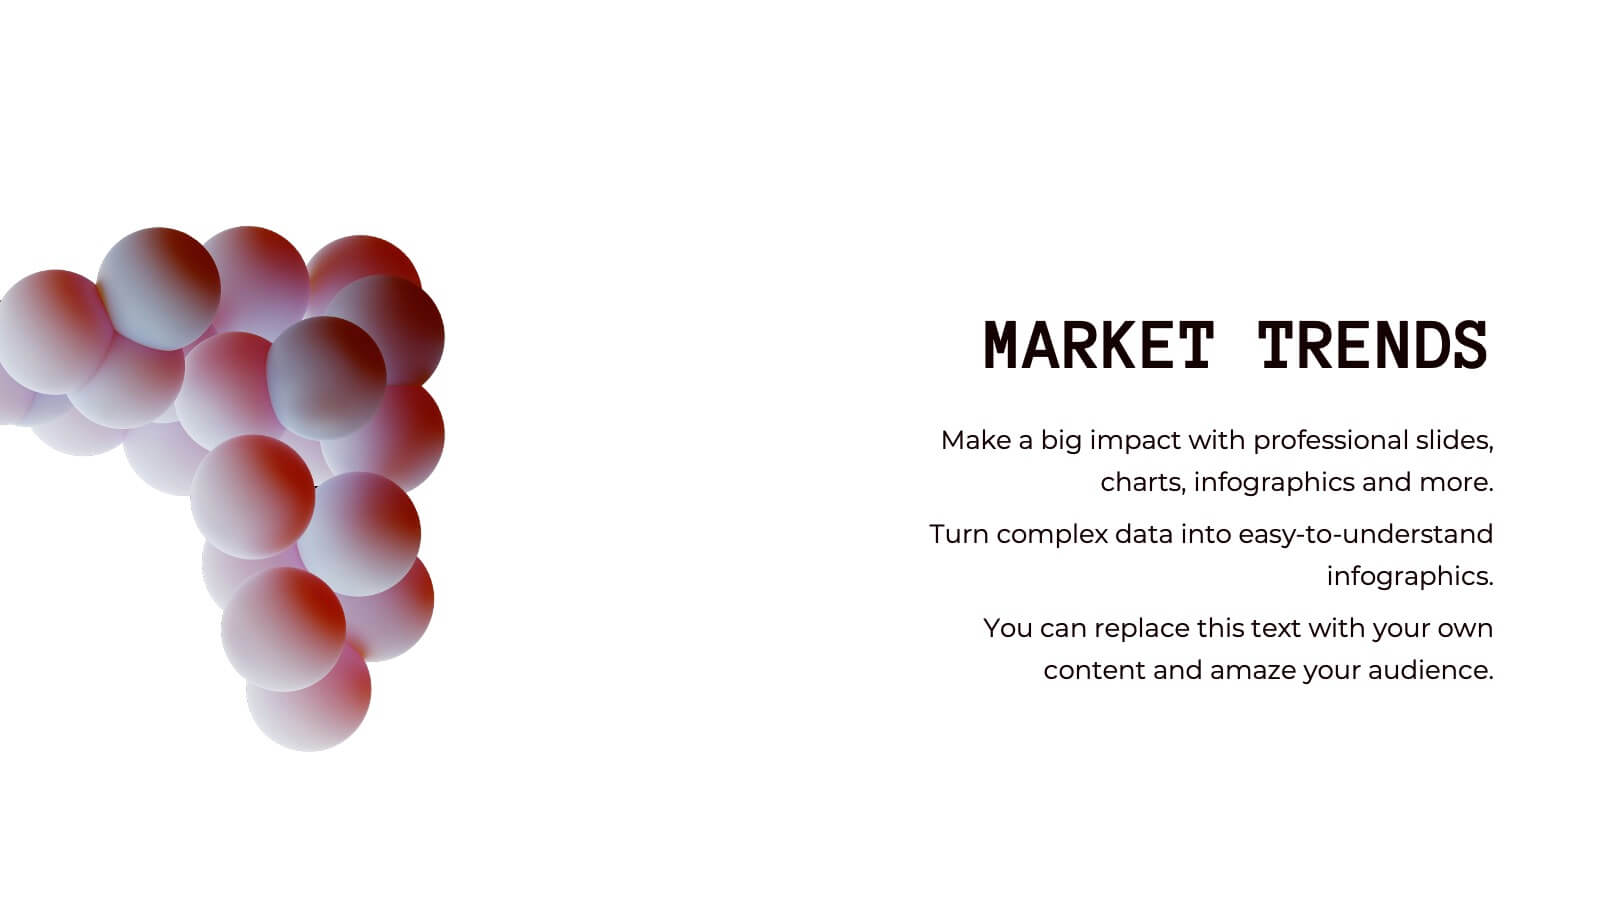
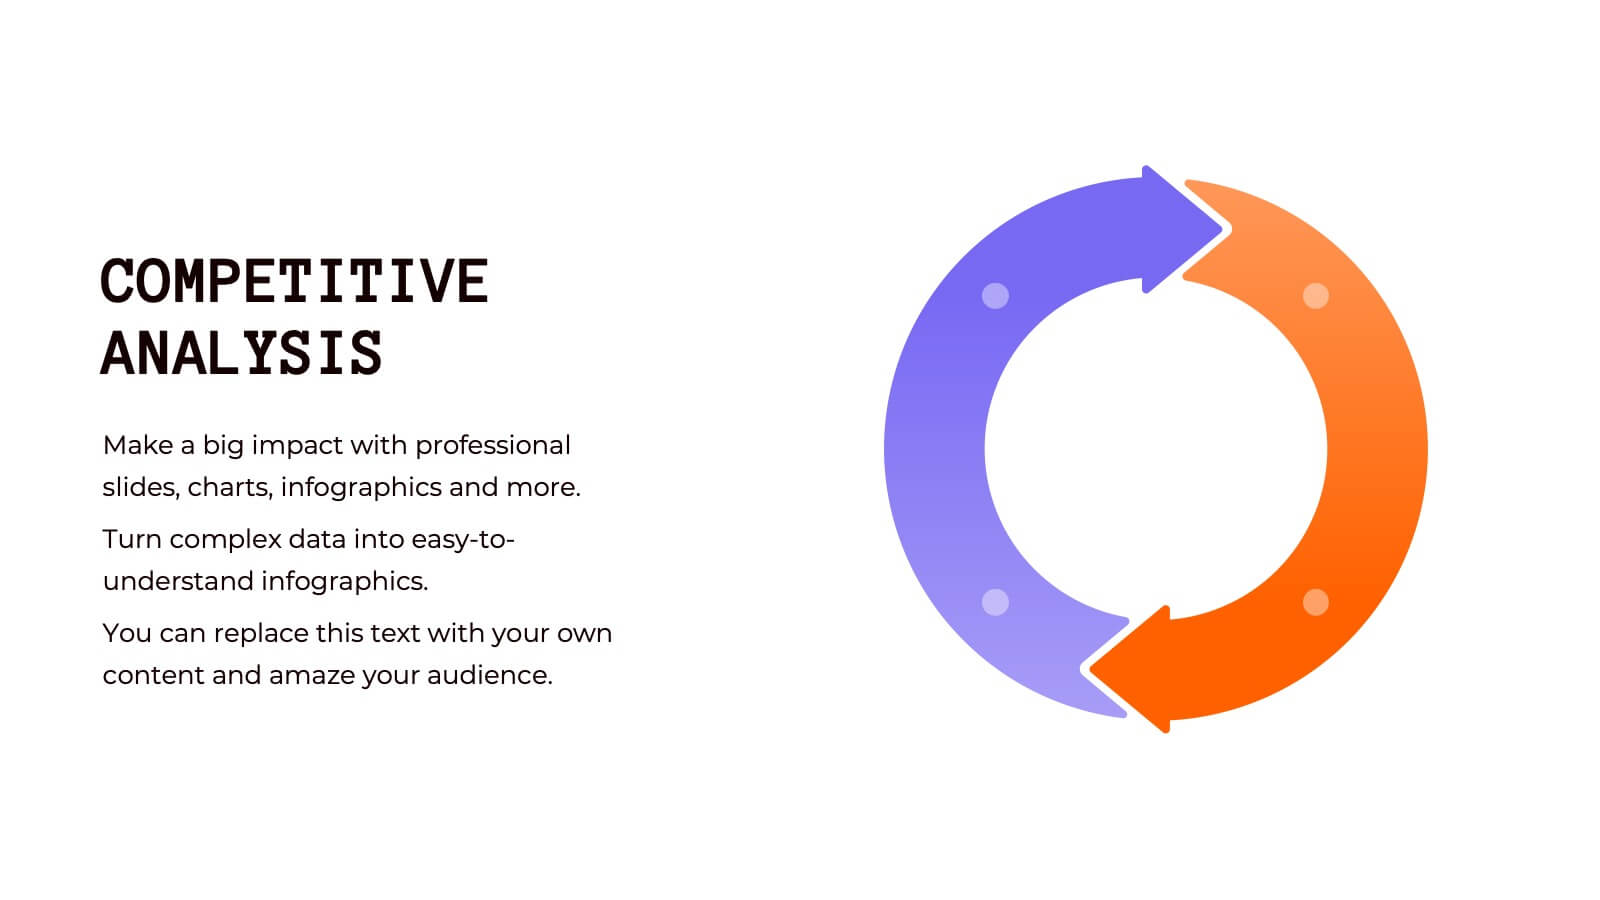
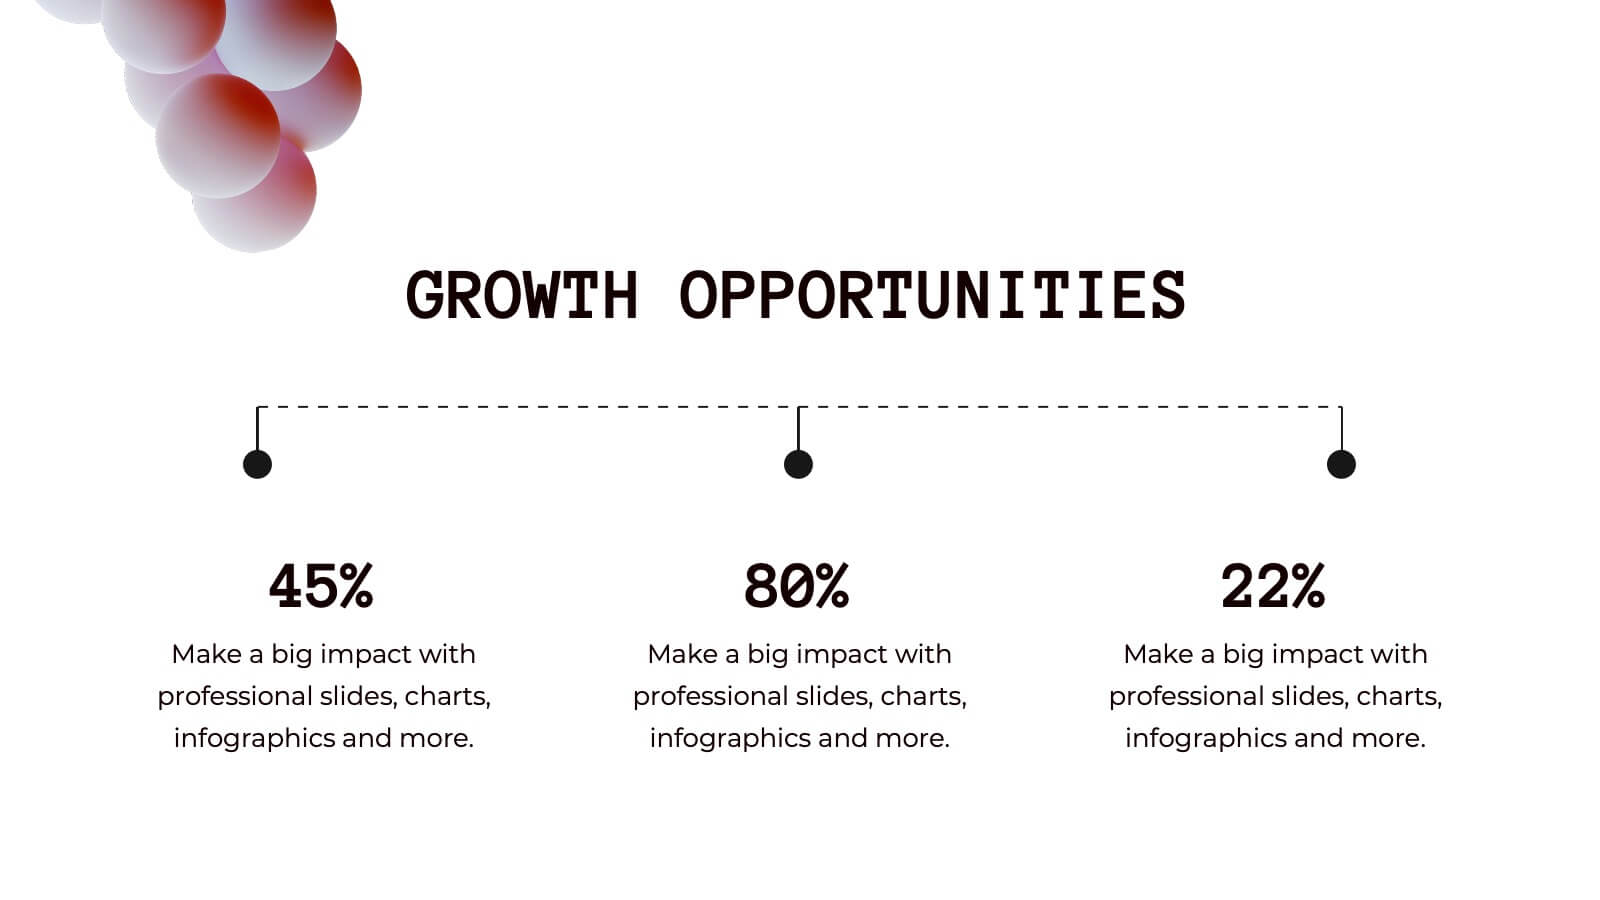
Halo Digital Strategy Presentation
Elevate your digital strategy presentations with this vibrant, professional template. Perfect for showcasing market trends, SWOT analysis, and strategic objectives, it features a modern layout with a cohesive color scheme. Highlight key elements like growth opportunities, value propositions, and performance metrics to captivate your audience. Compatible with PowerPoint, Keynote, and Google Slides, it ensures seamless presentations on any platform.


26 diapositivas
Human Resources Colorful Vectors
Dive into the dynamic realm of human resources, where talent thrives and organizations find their heartbeat. Radiating with a playful palette of sunny yellow, refreshing green, blush pink, and crisp white, our template captures the vibrancy and diversity of the HR world. Adorned with colorful graphics, relatable icons, and insightful image placeholders, it's a testament to the human touch in every organization. Expertly tailored for Powerpoint, Keynote, or Google Slides. An invaluable tool for HR professionals, recruitment agencies, corporate trainers, or anyone focused on building and nurturing talent. Engage, empower, and elevate; let your HR endeavors shine.


6 diapositivas
Target Audience Demographics Presentation
The "Target Audience Demographics" presentation employs an innovative spiral chart design to display key demographic data in an engaging and easy-to-understand format. Each segment of the spiral represents a different demographic characteristic with percentages clearly marked, enabling quick insights into audience composition. This design is well-suited for marketing presentations or any scenario where understanding audience segments is crucial. The placeholders are conveniently set up to add specific details or insights, making the template not only visually appealing but also highly functional for strategic planning and audience analysis.


20 diapositivas
Sphene Sales Proposal Presentation
Take your sales pitch to the next level with this elegant and structured presentation template! Featuring sections on sales objectives, process, pricing strategies, and performance metrics, this template is ideal for impressing potential clients and closing deals. It’s easy to customize and works seamlessly with PowerPoint, Keynote, and Google Slides for hassle-free presentation creation.


3 diapositivas
Organized Bullet Point Summary Presentation
Present key facts clearly with the Organized Bullet Point Summary Presentation. Designed for structured communication, this layout visually breaks down your main points with icons, color blocks, and percentage highlights. Perfect for reporting metrics, comparing ideas, or prioritizing tasks. Fully editable in PowerPoint, Keynote, and Google Slides.


4 diapositivas
Cybersecurity and Data Protection Presentation
Safeguard your digital assets with this Cybersecurity and Data Protection template. Designed for IT security professionals, compliance officers, and business leaders, this slide illustrates key security measures, risk mitigation strategies, and data protection protocols. Featuring a modern cloud security theme, it effectively conveys network safety, encryption, and compliance frameworks. Fully editable and compatible with PowerPoint, Keynote, and Google Slides for seamless customization.

21 diapositivas
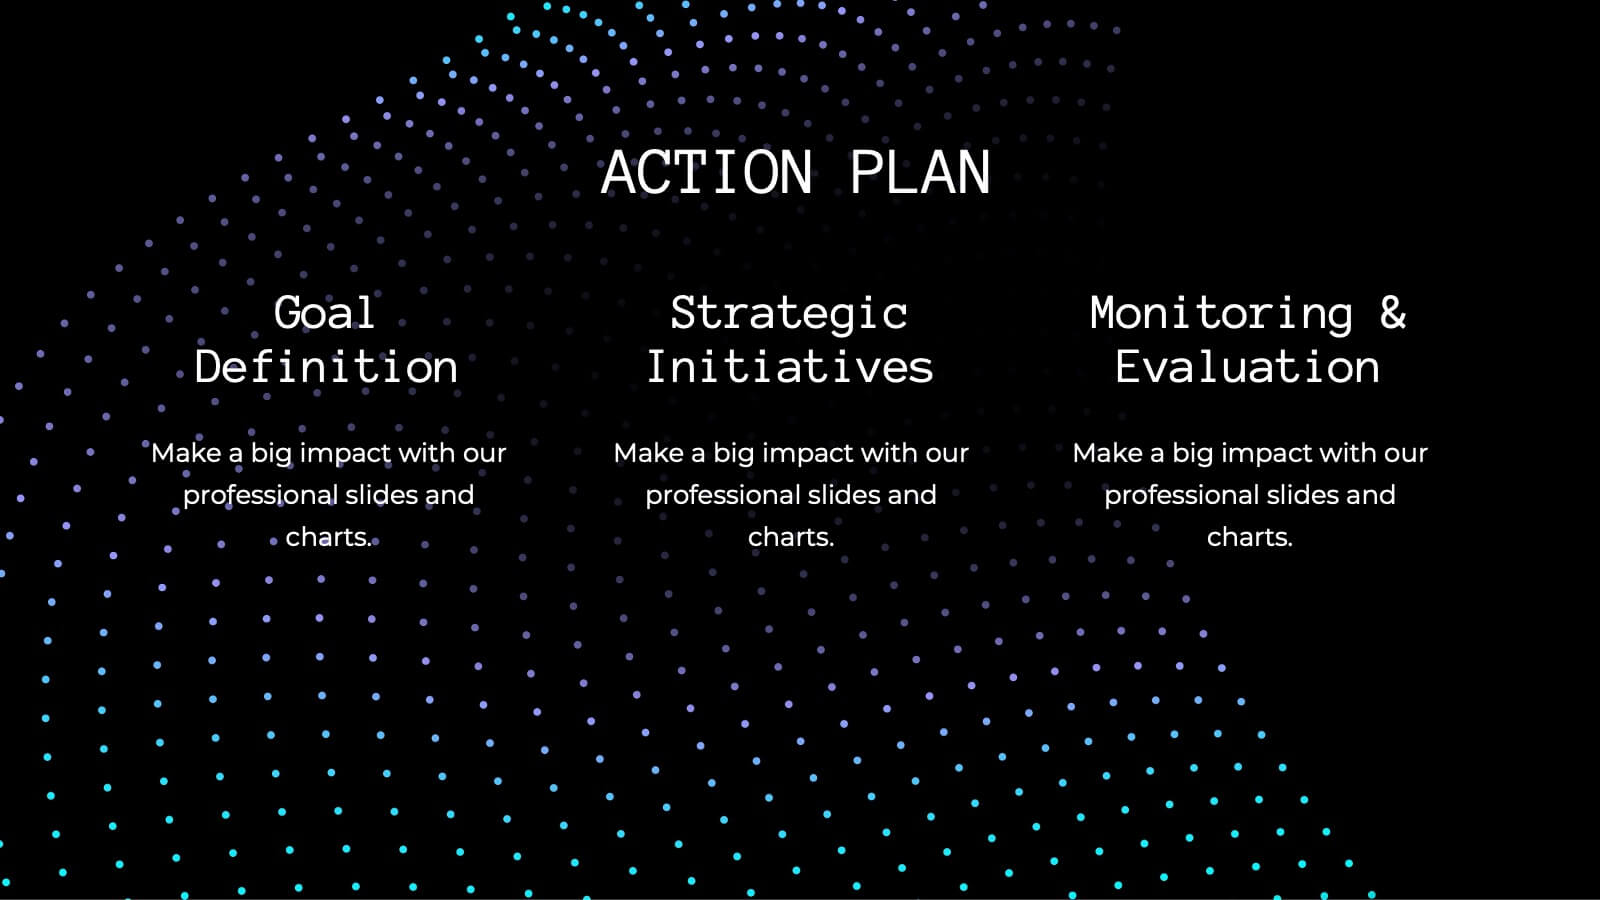
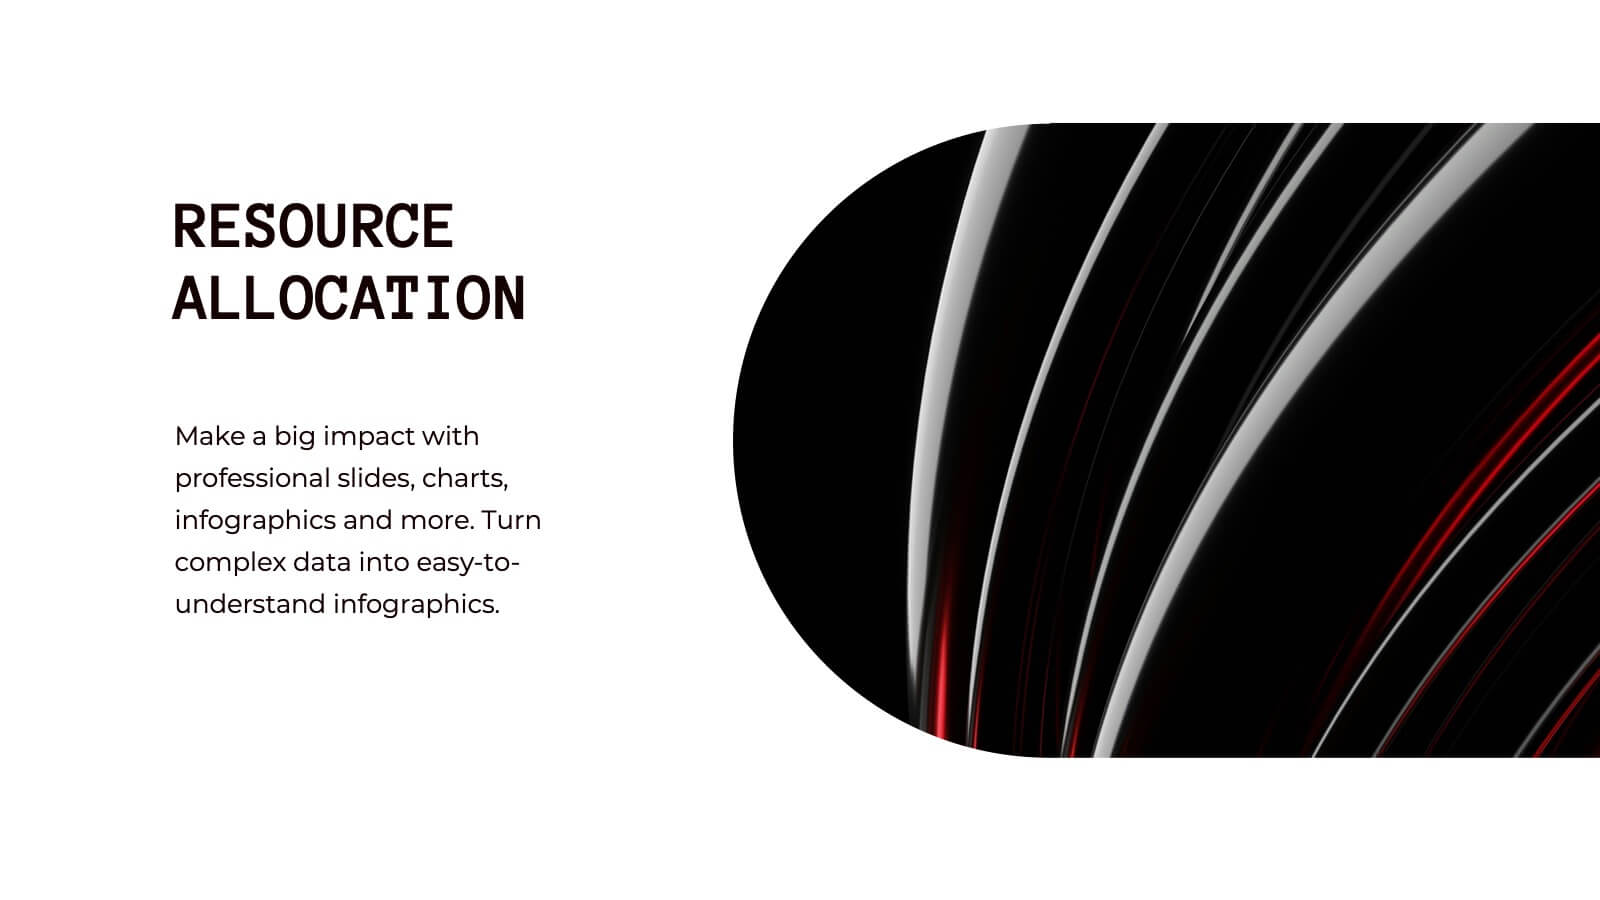
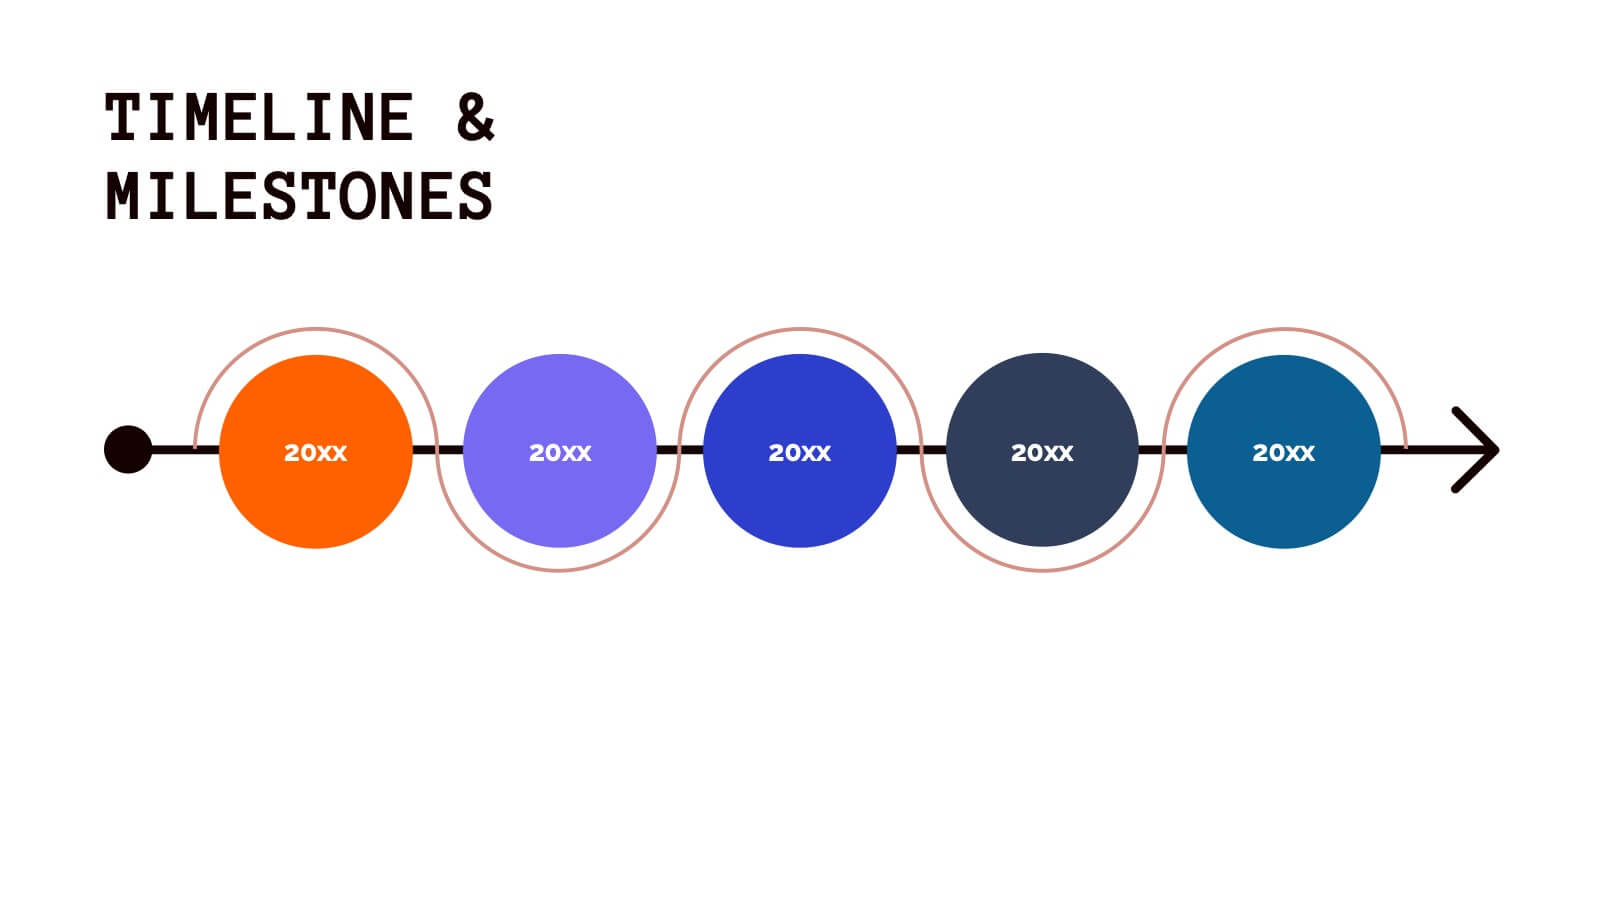
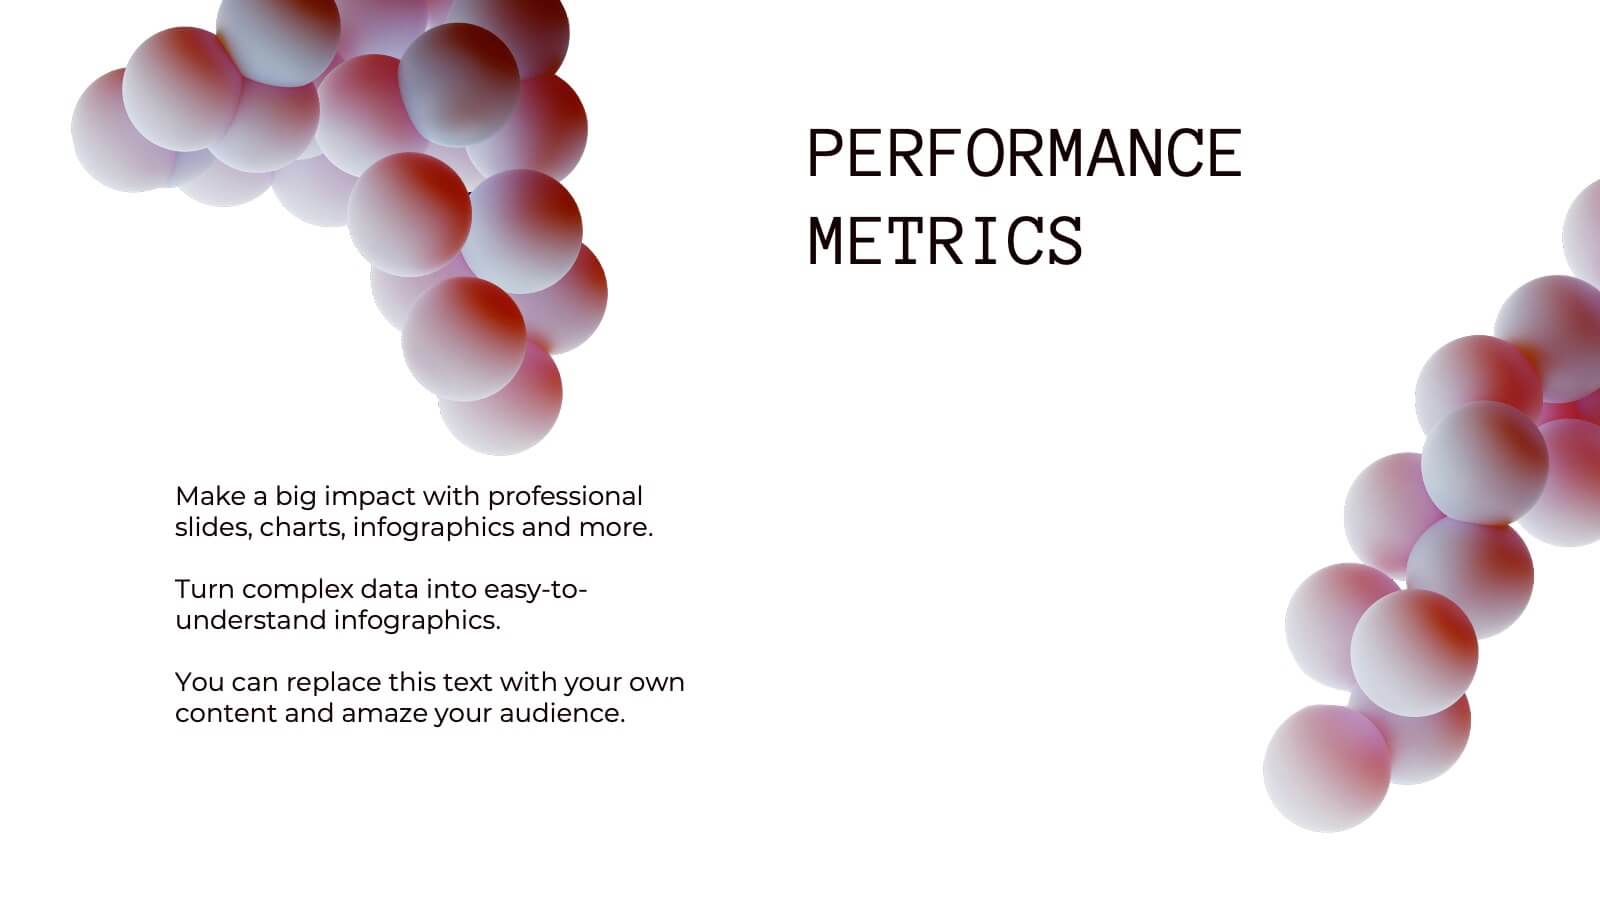
Mermaid Corporate Strategy Proposal Presentation
Present your corporate strategy with confidence using this sleek, modern proposal template! It covers strategic objectives, market trends, SWOT analysis, and resource allocation, ensuring a comprehensive overview of your plan. Fully customizable and compatible with PowerPoint, Keynote, and Google Slides, this template is ideal for launching new initiatives and achieving business goals.


5 diapositivas
Operations Performance KPI Visual Layout Presentation
Visualize operational KPIs with this clean and modern layout. Highlight four key metrics using pie chart visuals, percentage headers, and customizable labels. Perfect for business operations reviews, performance tracking, or team updates. Fully editable and compatible with PowerPoint, Keynote, and Google Slides for seamless, data-driven presentations.