


Características


¿Tienes alguna pregunta?
Recomendar


6 diapositivas
Creative Solutions for Business Challenges Presentation
Present your strategy with impact using the Creative Solutions for Business Challenges Presentation. Featuring a dynamic cloud and gear diagram, this layout helps illustrate interconnected solutions and innovative thinking. Ideal for brainstorming, strategic planning, and team problem-solving discussions. Fully editable in PowerPoint, Keynote, and Google Slides.


8 diapositivas
Professional Business Executive Summary Presentation
Make your insights stand tall with a bold, clean layout that feels like a data-driven story in motion. This executive summary slide is perfect for breaking down complex ideas into three clear steps, using sleek vertical bars to add visual rhythm. Compatible with PowerPoint, Keynote, and Google Slides for easy editing.


5 diapositivas
AIDA Marketing Funnel Presentation
The "AIDA Marketing Funnel Presentation" template is expertly designed to streamline the visualization of the AIDA model, which stands for Attention, Interest, Desire, and Action. This template aids marketers in presenting and analyzing the effectiveness of marketing strategies to capture the consumer's journey from awareness to the final action of purchasing. Each stage of the funnel is clearly defined and color-coded, making it simple to insert specific strategies or results that relate to each step of the consumer engagement process. Ideal for marketing presentations, this template helps in explaining complex concepts in a digestible format, ensuring that the audience can easily follow along and understand key marketing tactics and outcomes.


6 diapositivas
Quarterly Sales Overview Presentation
Bring your numbers to life with a clear, colorful layout that makes quarterly progress instantly easy to understand. This presentation helps you break down trends, compare performance across quarters, and highlight key insights with simple bar visuals. Perfect for reports and meetings, and fully compatible with PowerPoint, Keynote, and Google Slides.


4 diapositivas
Business KPI Metrics Dashboard Presentation
Track and present your key performance indicators clearly with this Business KPI Metrics Dashboard Presentation. Featuring modern gauge visuals, color-coded performance bars, and sectioned data blocks, this template helps you showcase financial, customer, and operational KPIs in a single glance. Fully editable and ideal for business reviews, team updates, and performance reports. Compatible with PowerPoint, Keynote, and Google Slides.


12 diapositivas
Business Issue Root Cause Identification Presentation
Pinpoint Business Challenges with Precision using this Business Issue Root Cause Identification presentation template. Designed to uncover underlying problems efficiently, this template features structured visuals, hierarchical frameworks, and clear labeling to facilitate root cause analysis. Whether you're a business strategist, operations manager, or consultant, this template helps identify, analyze, and resolve critical business issues. Fully customizable and compatible with PowerPoint, Keynote, and Google Slides, ensuring a seamless and professional presentation experience.


5 diapositivas
Safety Compliance Overview Presentation
Keep your organization protected and compliant with this modern and visual presentation design. Ideal for outlining safety protocols, training programs, and regulatory standards, it helps simplify complex processes into clear, engaging visuals. Fully customizable and compatible with PowerPoint, Keynote, and Google Slides for professional and polished presentations.


22 diapositivas
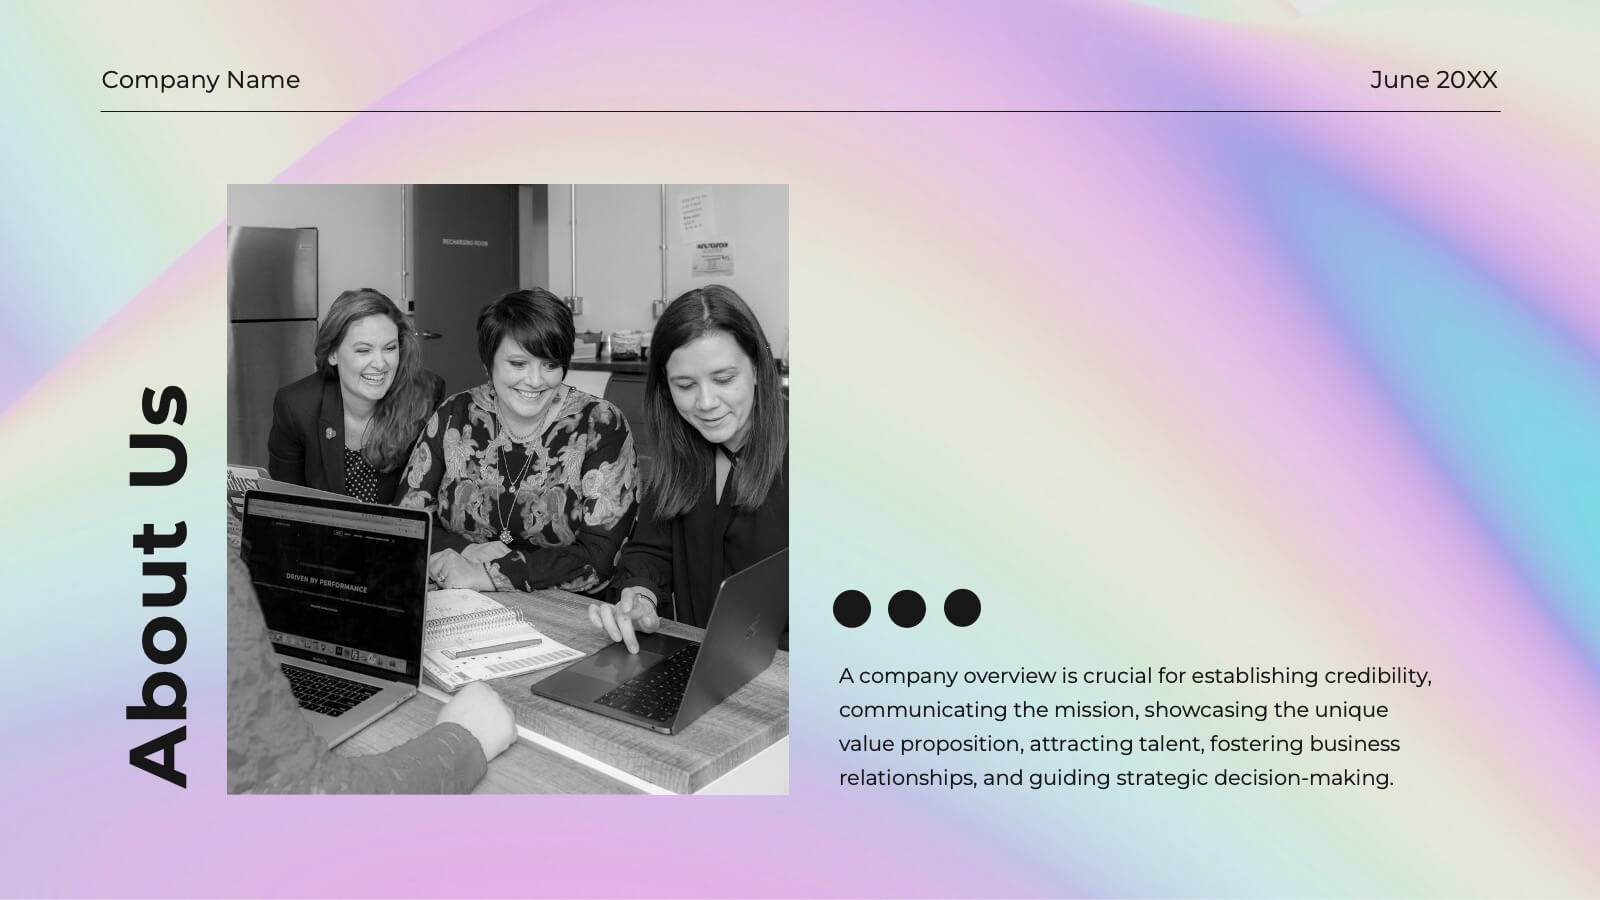
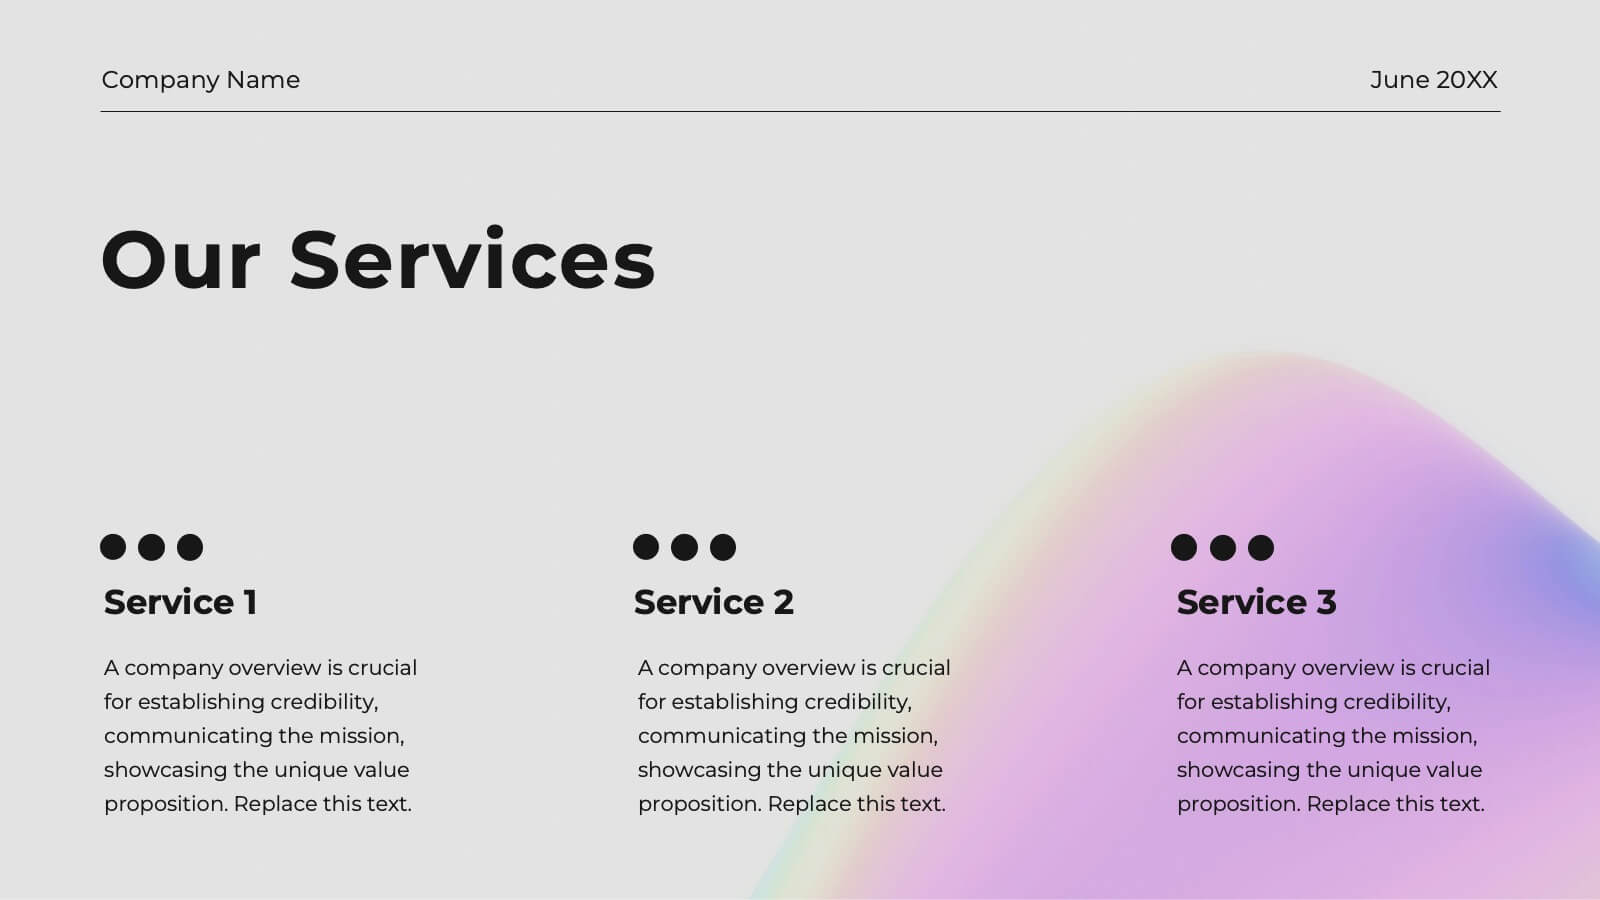
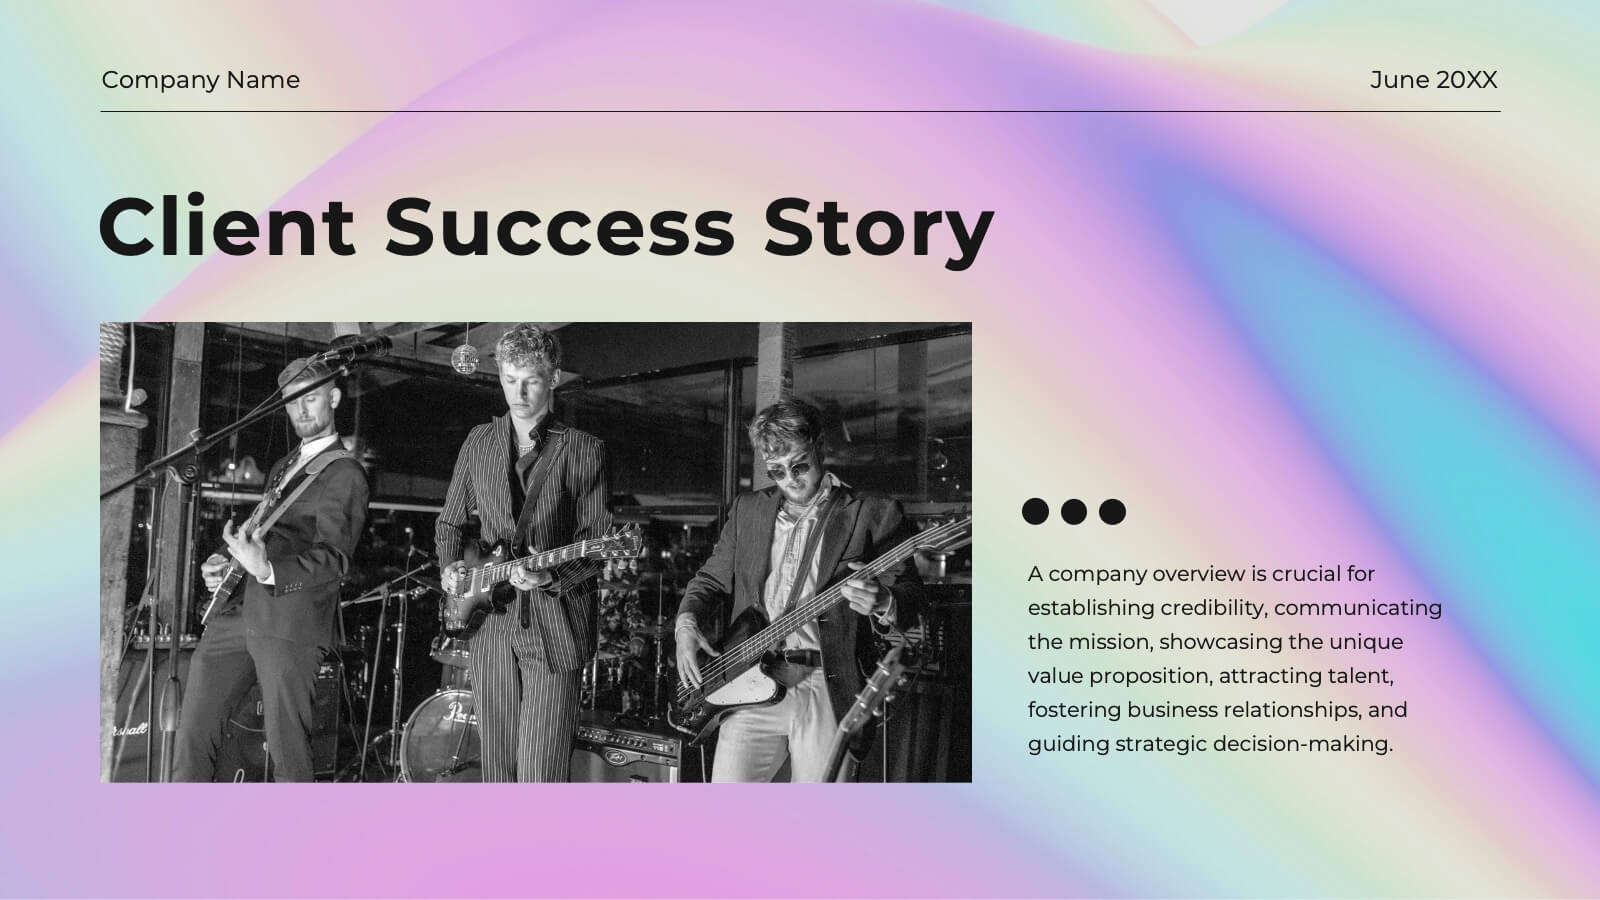
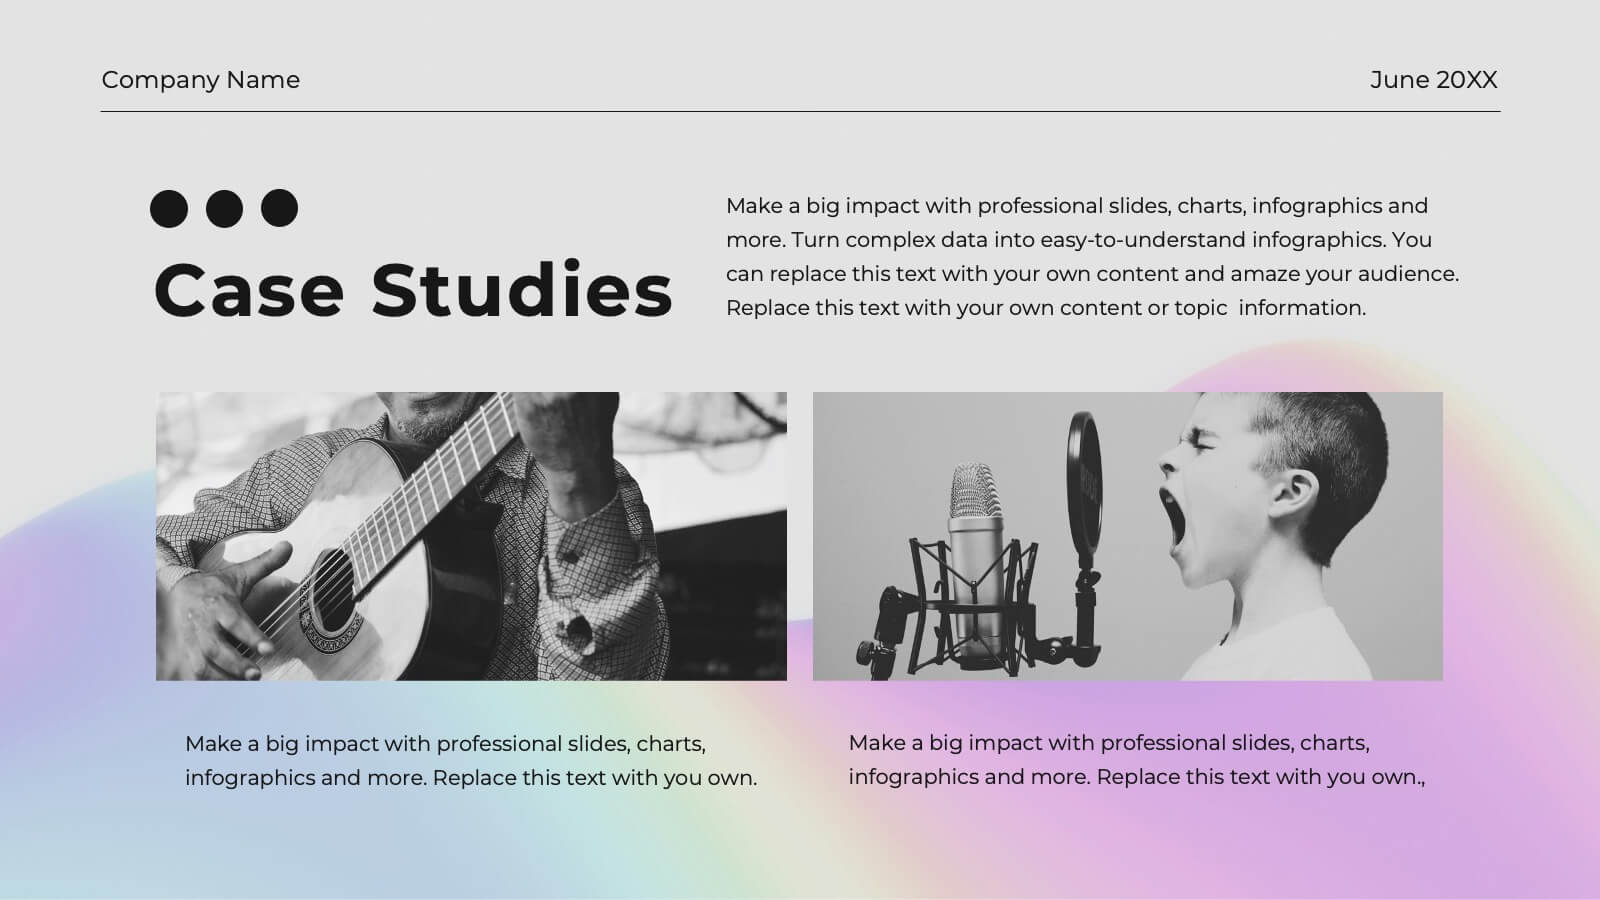
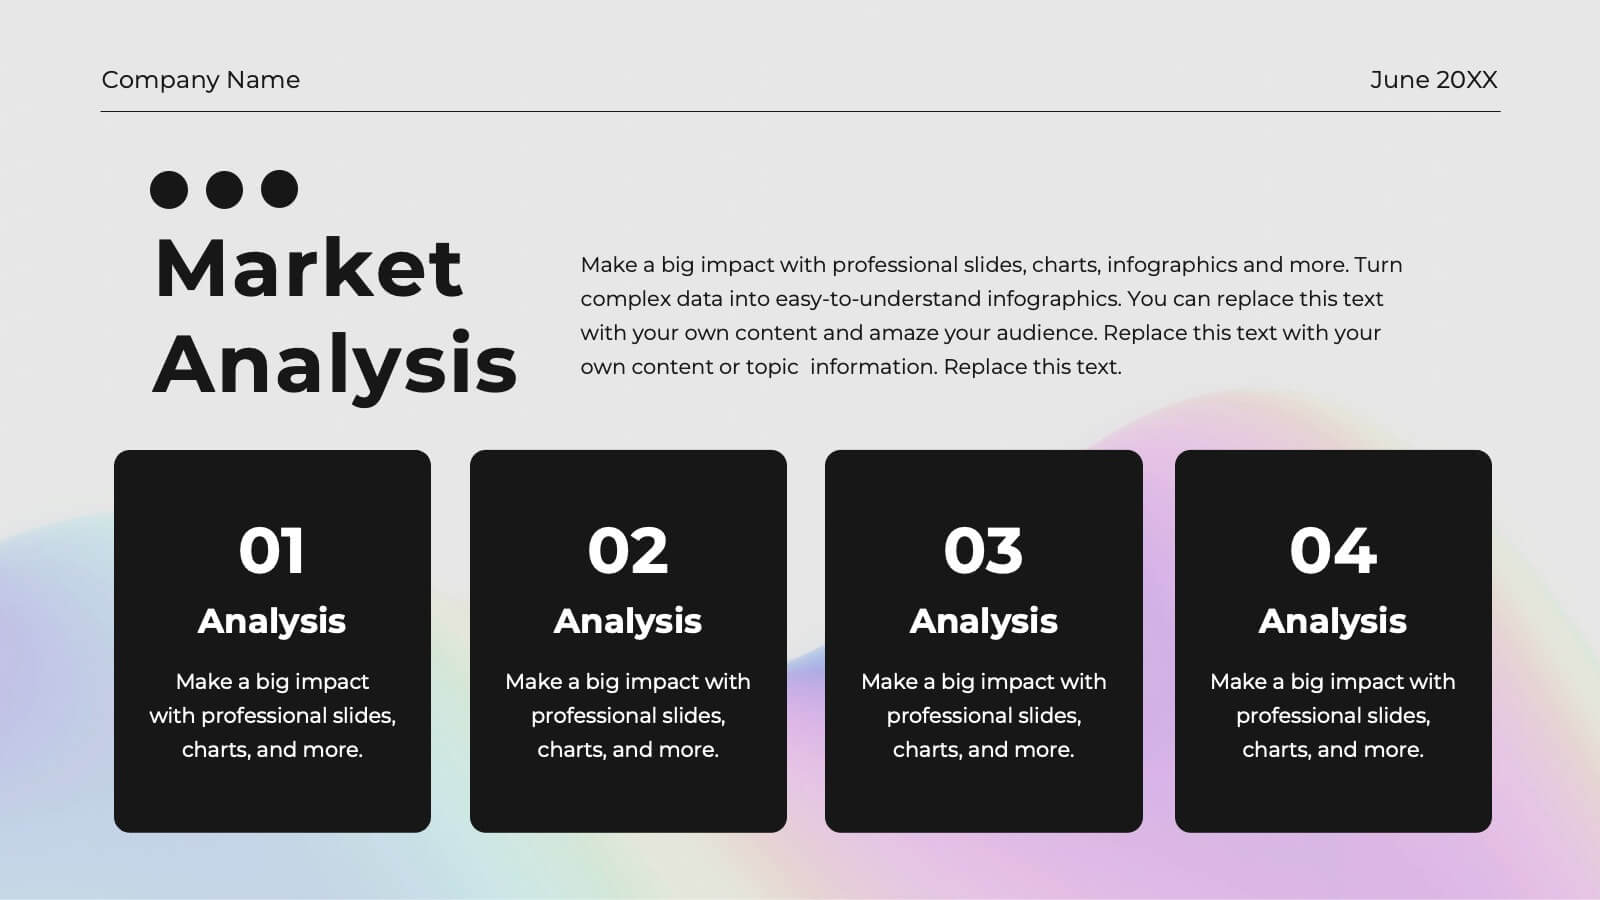
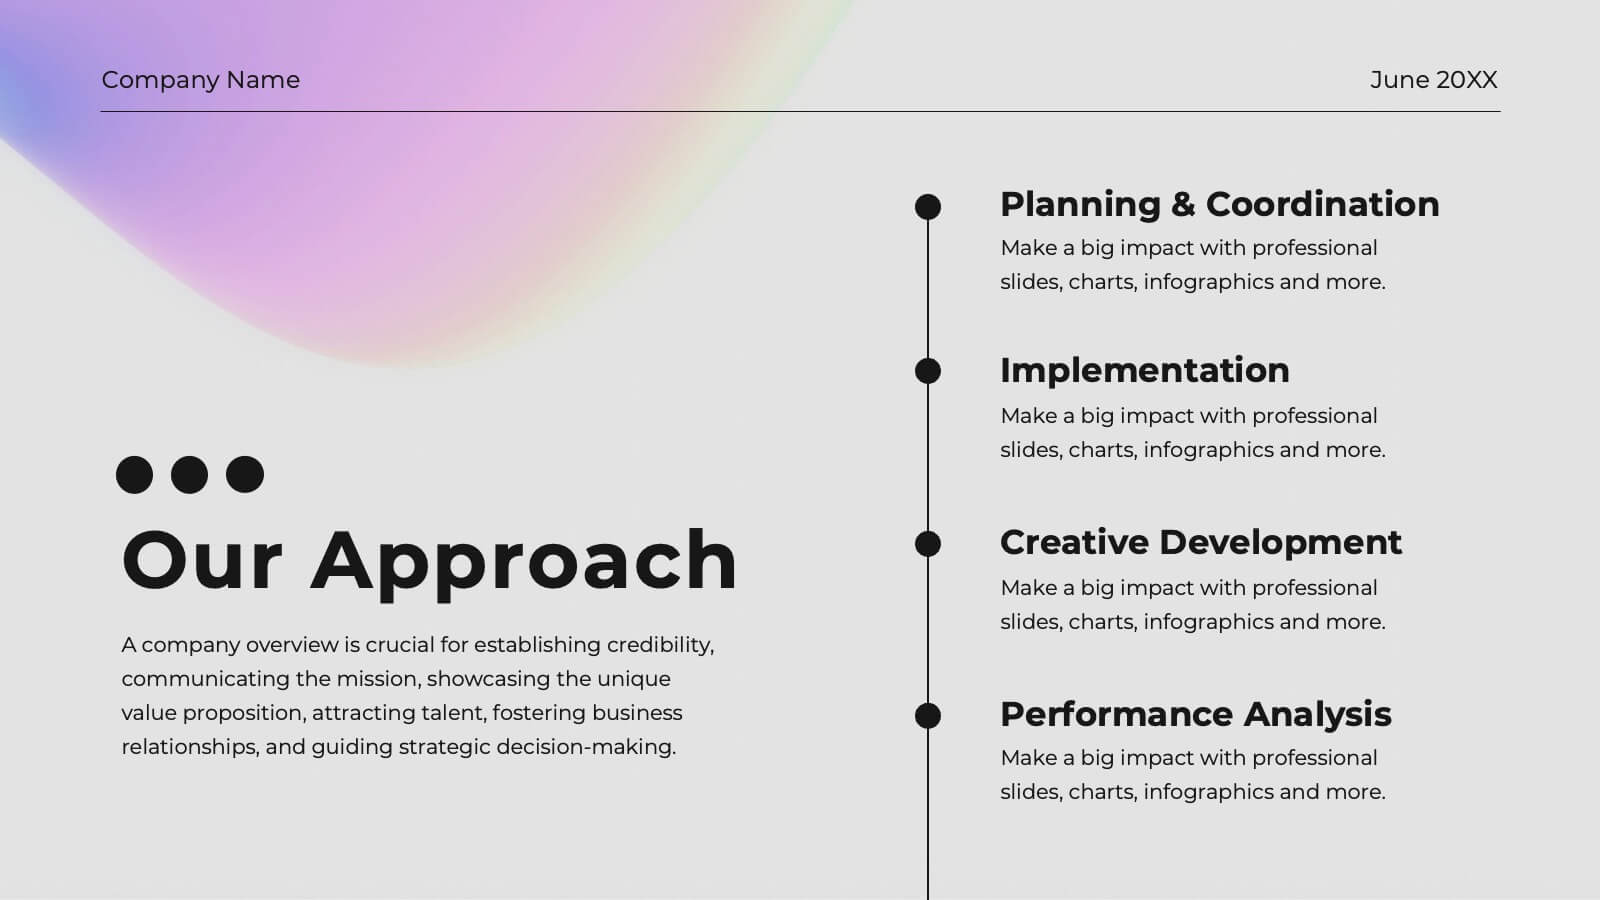
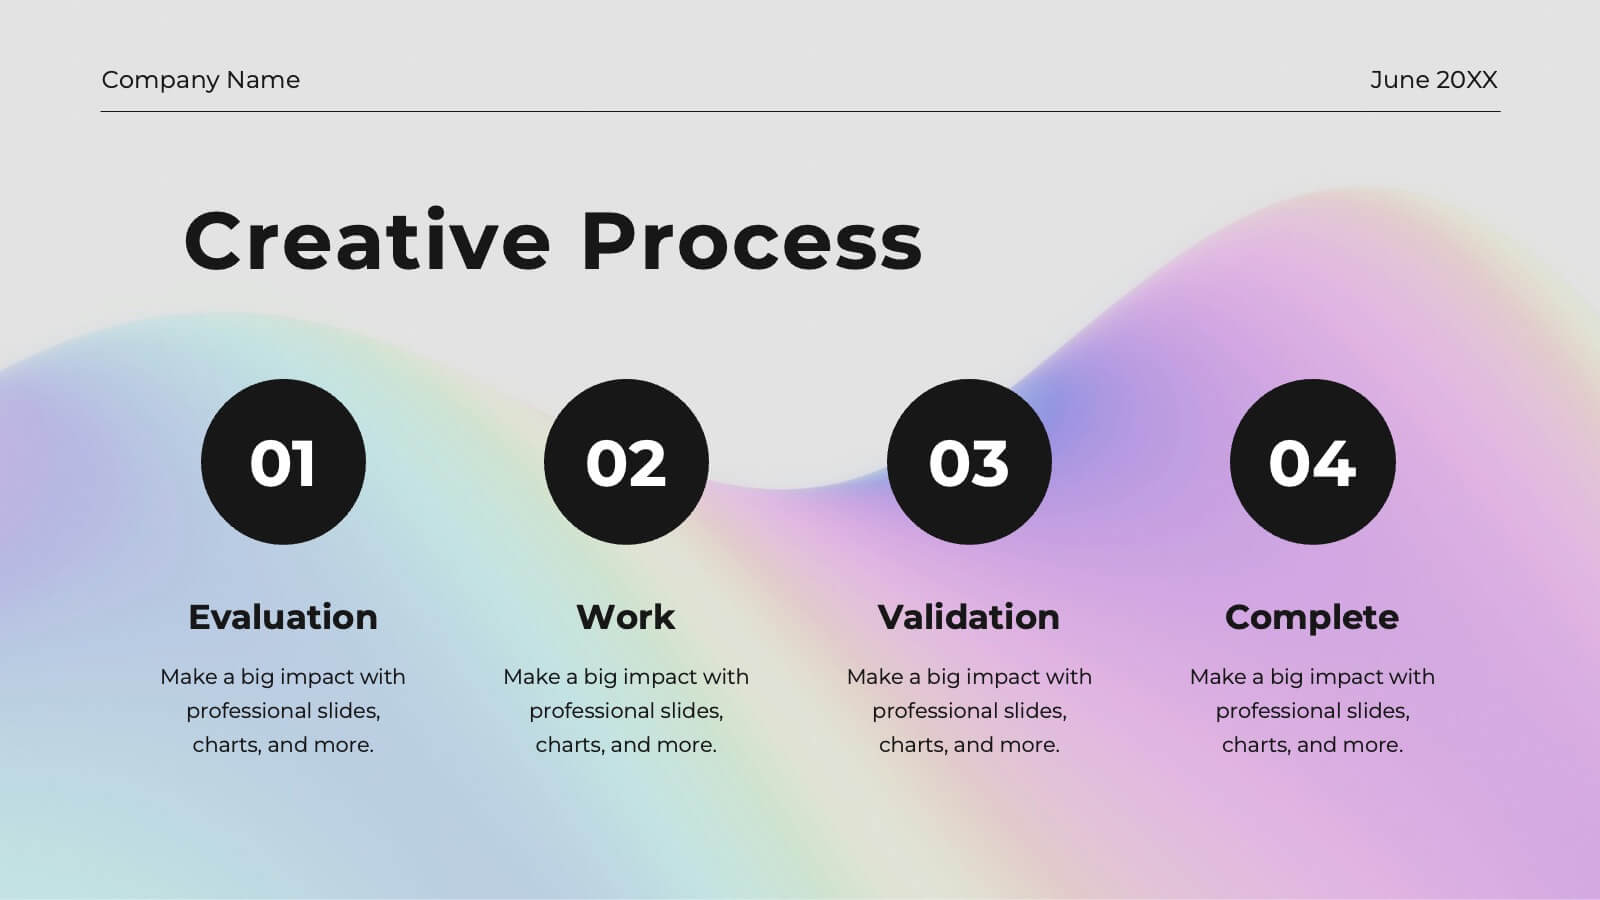
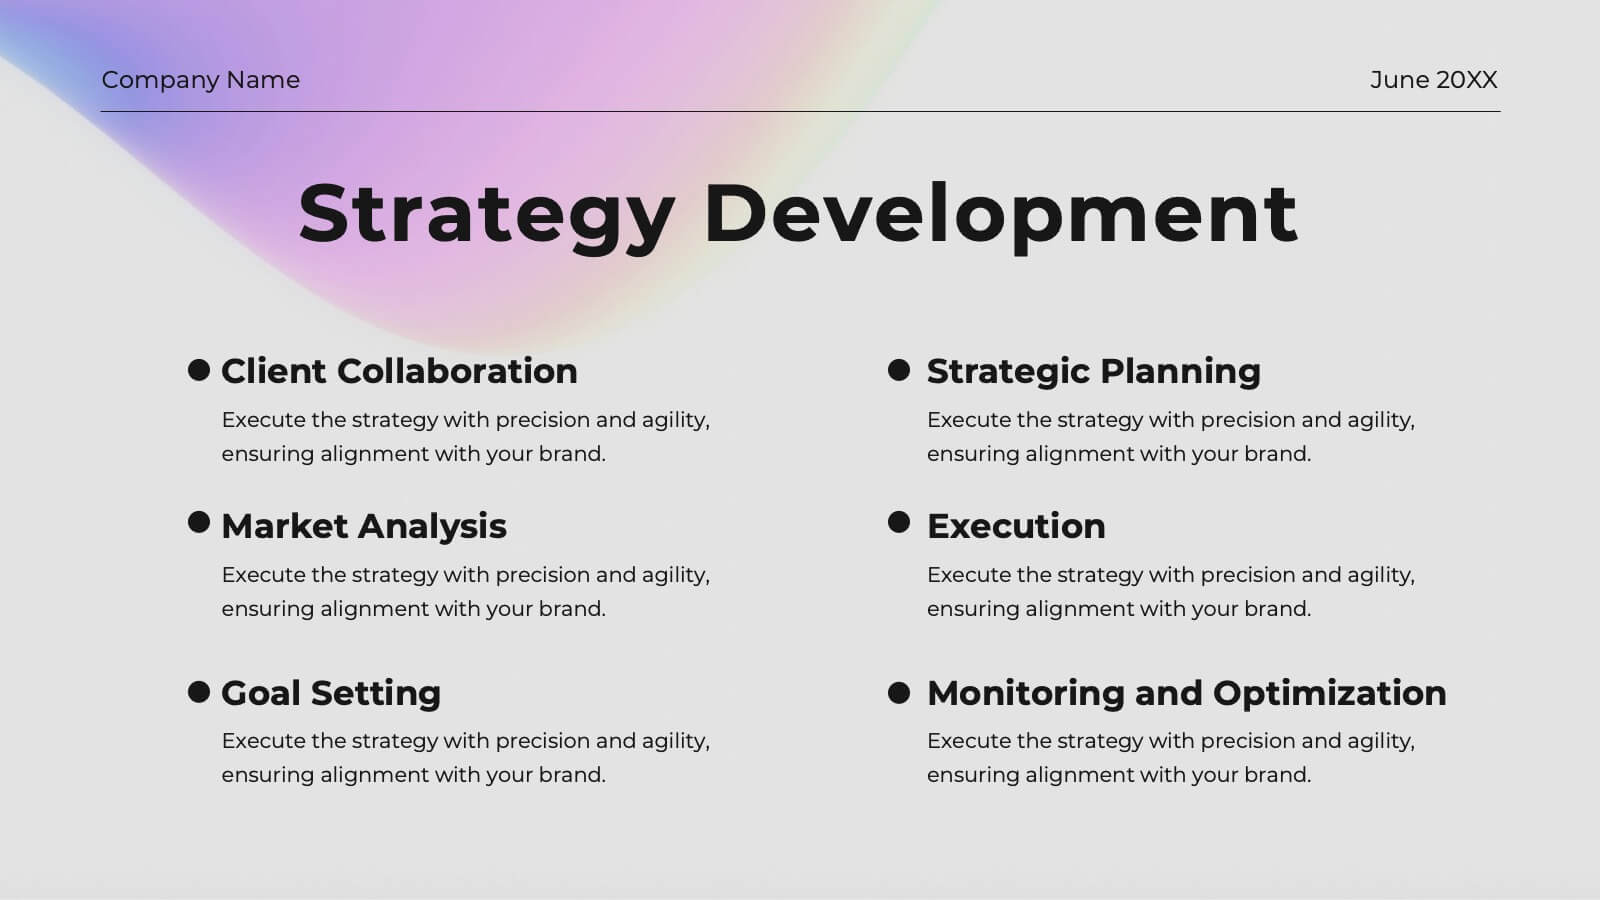
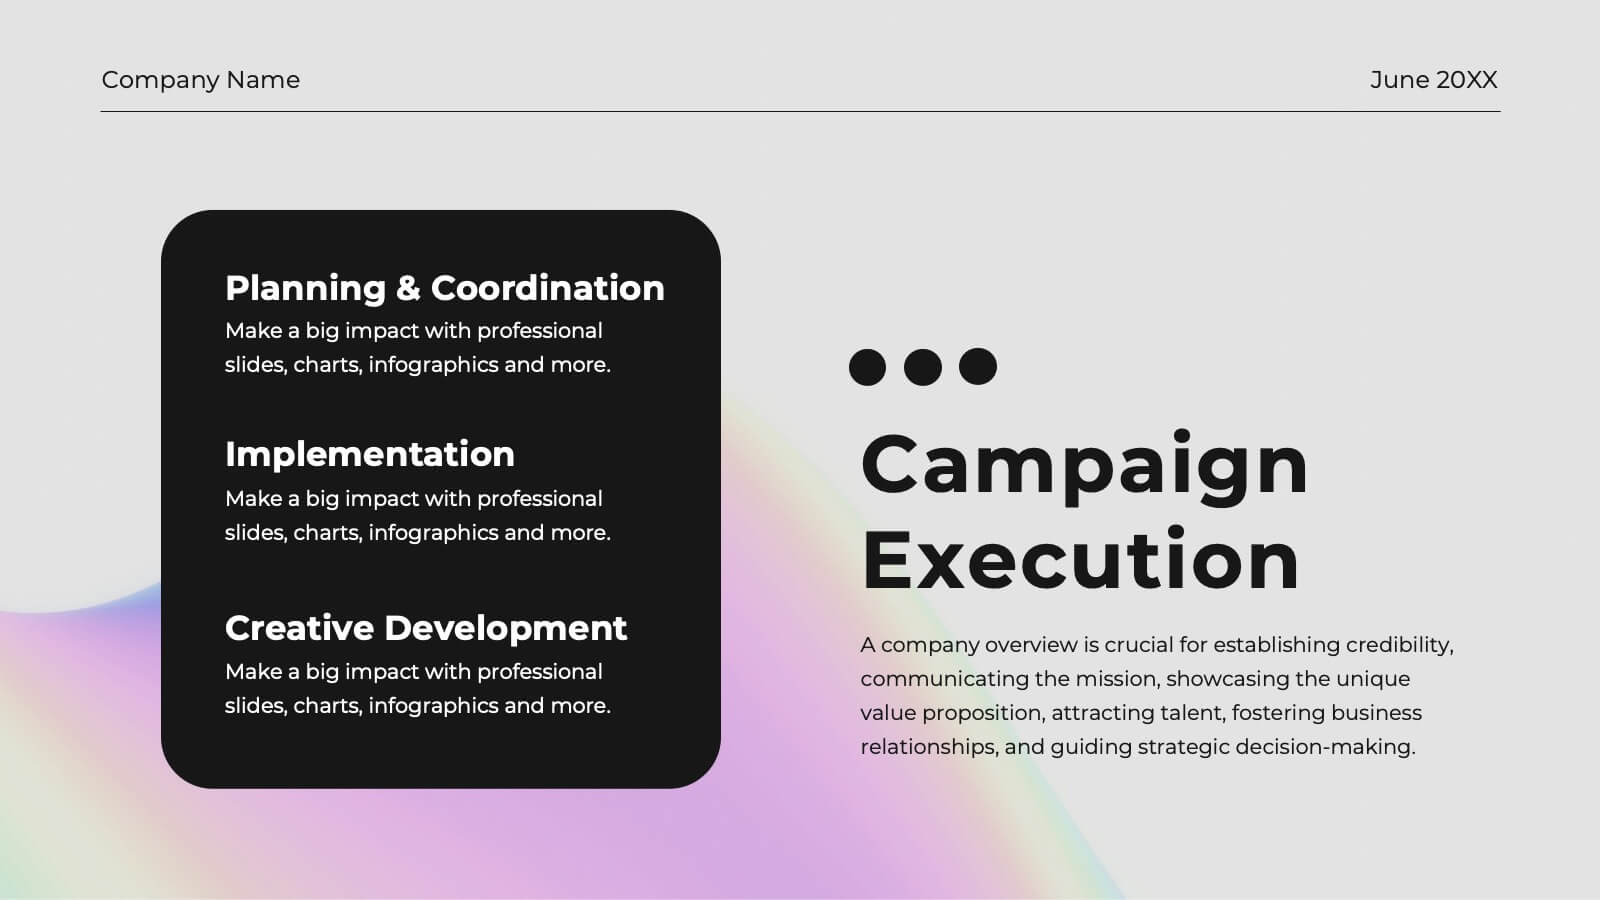
Frost Advertising Agency Proposal Presentation
Dazzle your clients with this radiant agency proposal template! Perfect for presenting your mission, services, and market analysis, it includes slides for case studies, strategy development, and campaign execution. Impress stakeholders with vibrant visuals and detailed content. Compatible with PowerPoint, Keynote, and Google Slides for seamless presentations on any platform.


8 diapositivas
Target Demographic Insights
Get a clear view of your audience with the Target Demographic Insights Presentation. This template uses a visual bullseye layout to highlight key demographic data through concentric circles and percentages. Ideal for marketers, brand strategists, or analysts, it helps you communicate audience segmentation and market reach effectively. Fully editable in PowerPoint, Keynote, and Google Slides.


4 diapositivas
Decision Analysis Framework Presentation
Make every choice smarter with this structured and visually balanced template designed to showcase options, outcomes, and key insights. Ideal for strategy meetings or data-driven reports, it helps you present decisions with confidence and clarity. Fully editable and compatible with PowerPoint, Keynote, and Google Slides for seamless customization.


6 diapositivas
Event Planning Agenda Presentation
Organize every detail with the Event Planning Agenda Presentation. Featuring a 6-step layout styled like a calendar, this template clearly outlines each agenda point with vibrant blocks and icons for visual impact. Ideal for conferences, workshops, or launches. Fully editable in PowerPoint, Keynote, and Google Slides.


23 diapositivas
Lexicon Startup Pitch Deck Template Presentation
The Startup Pitch Deck Presentation Template provides a modern and professional design with 23 fully customizable slides, ideal for startups seeking funding or presenting their business idea. Key sections include company overview, problem statement, solution, market opportunity, business model, and unique selling proposition (USP). It also covers competitive landscape, product features, financials, milestones, and funding requirements, ensuring a comprehensive pitch. The vibrant orange and gray color scheme adds energy and creativity to the presentation. Compatible with PowerPoint, Keynote, and Google Slides, this template is perfect for impactful startup pitches.


6 diapositivas
PESTEL Management Infographic
PESTEL analysis is a framework used to assess and analyze the external macro-environmental factors that can impact an organization, industry, or market. This infographic template provides an overview of the PESTEL analysis framework and its application in strategic management. This template provides a clear and concise explanation of the PESTEL analysis framework, detailing each component of the acronym for you to use. It highlights the significance of considering these external factors when formulating business strategies and making informed decisions. Compatible with Powerpoint, Keynote, and Google Slides.


21 diapositivas
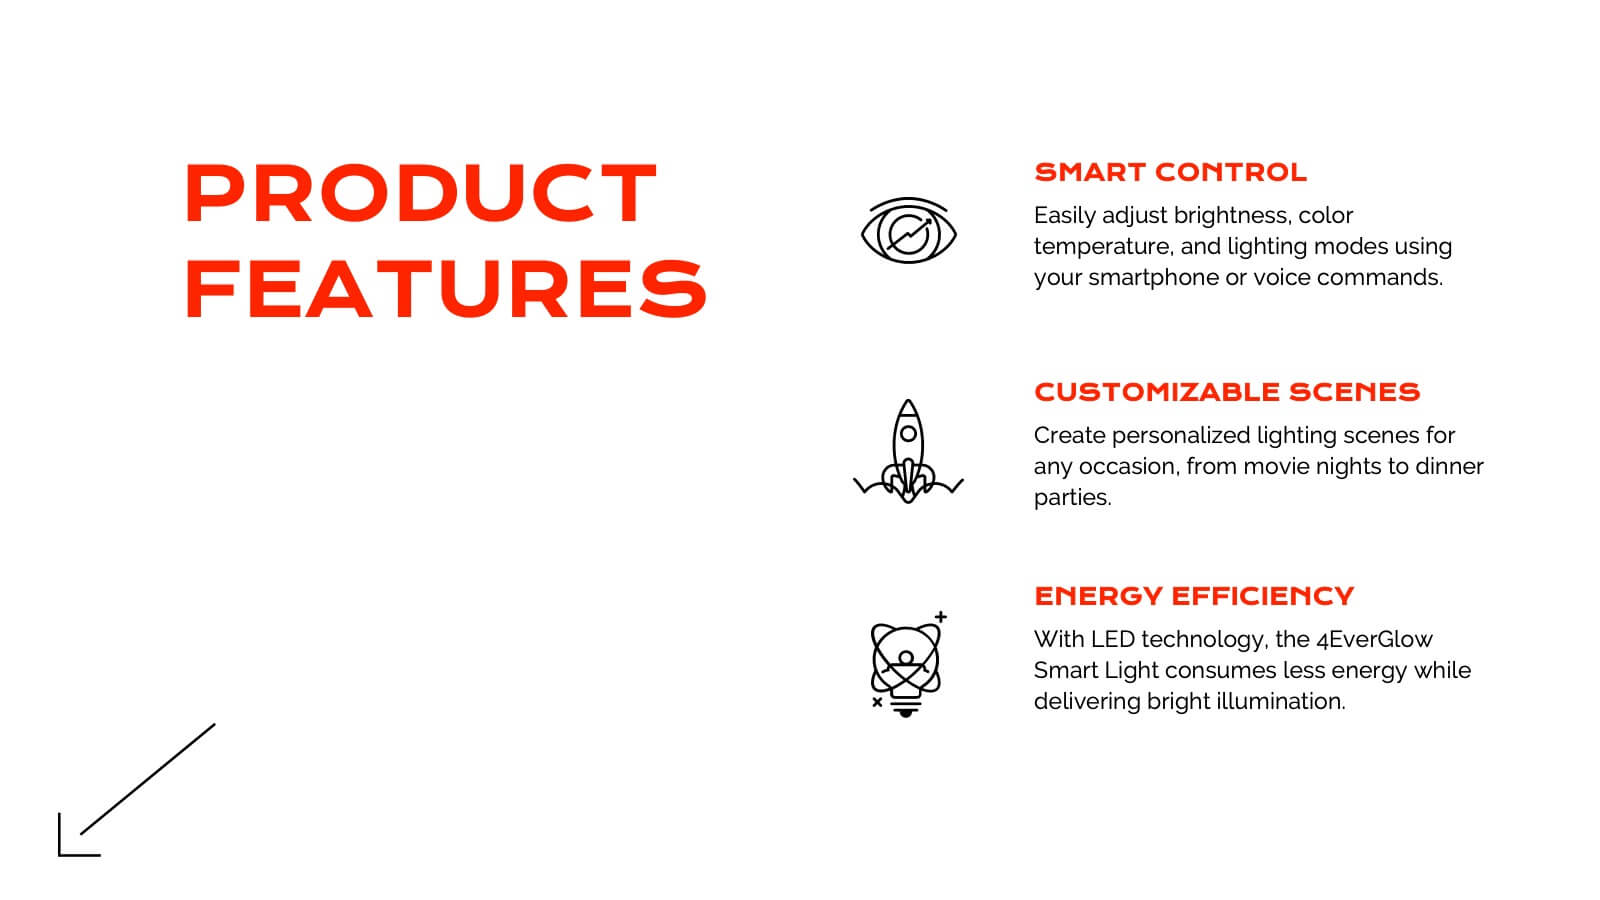
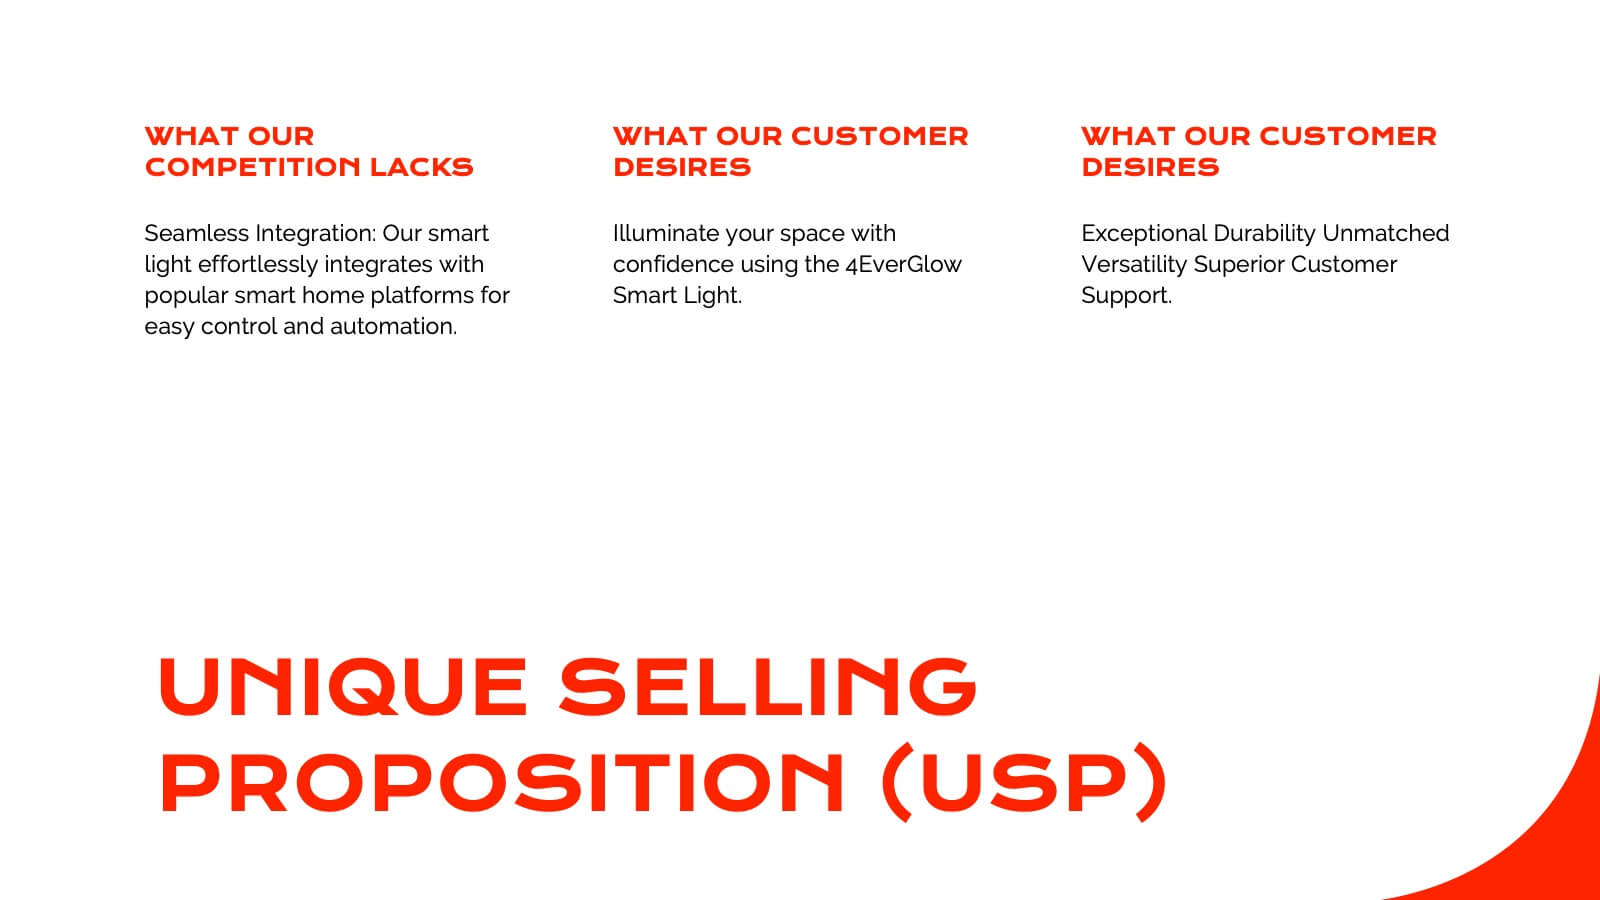
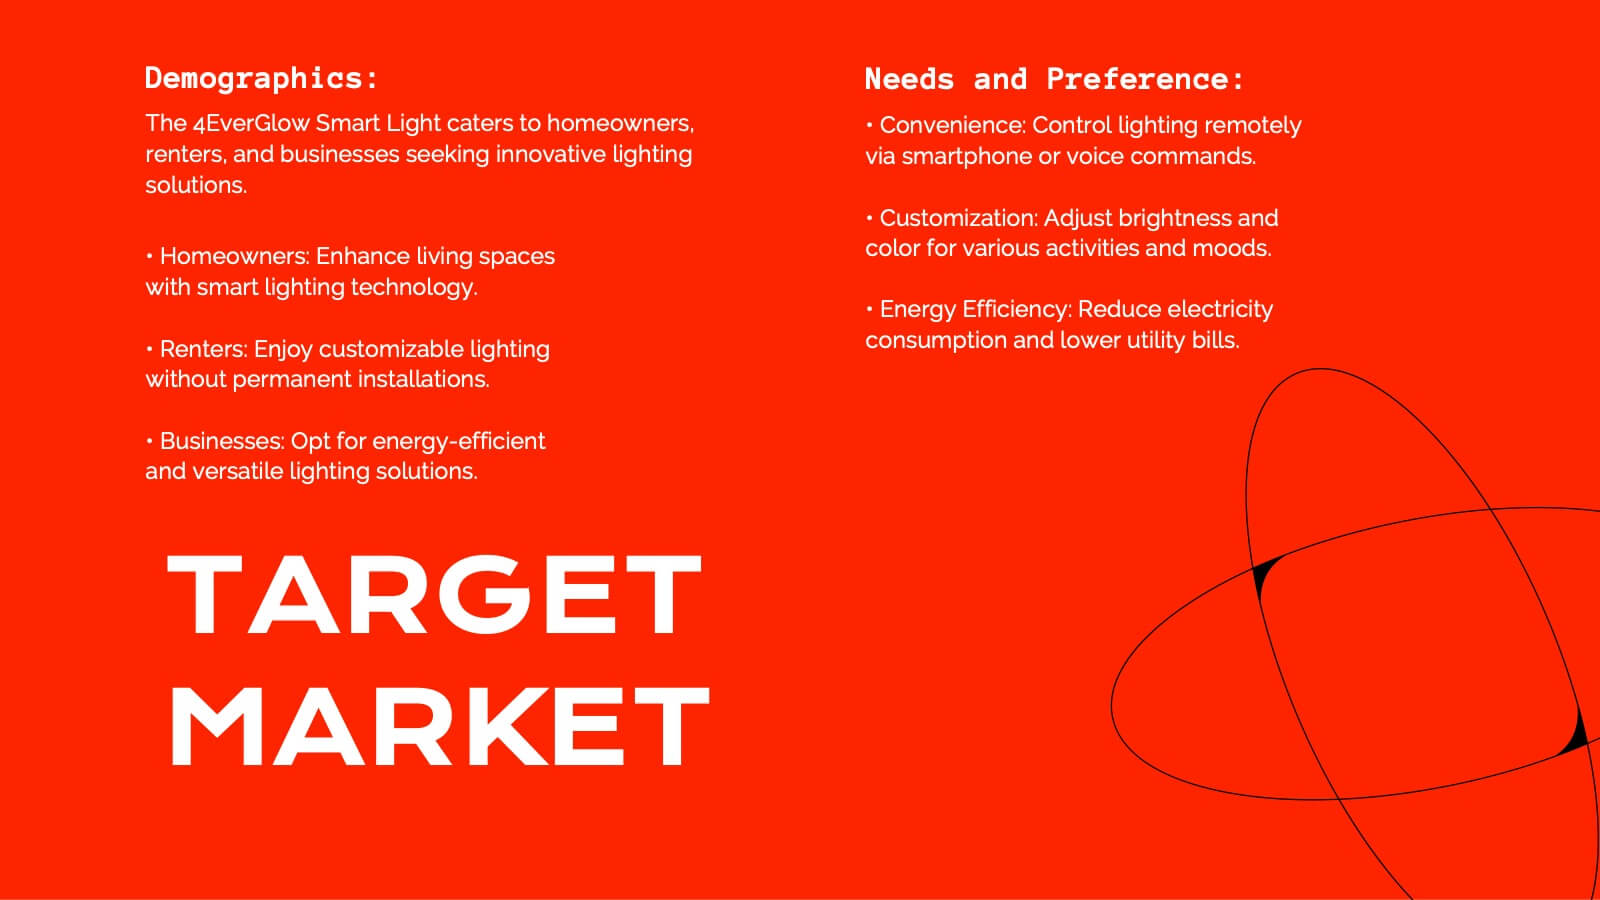
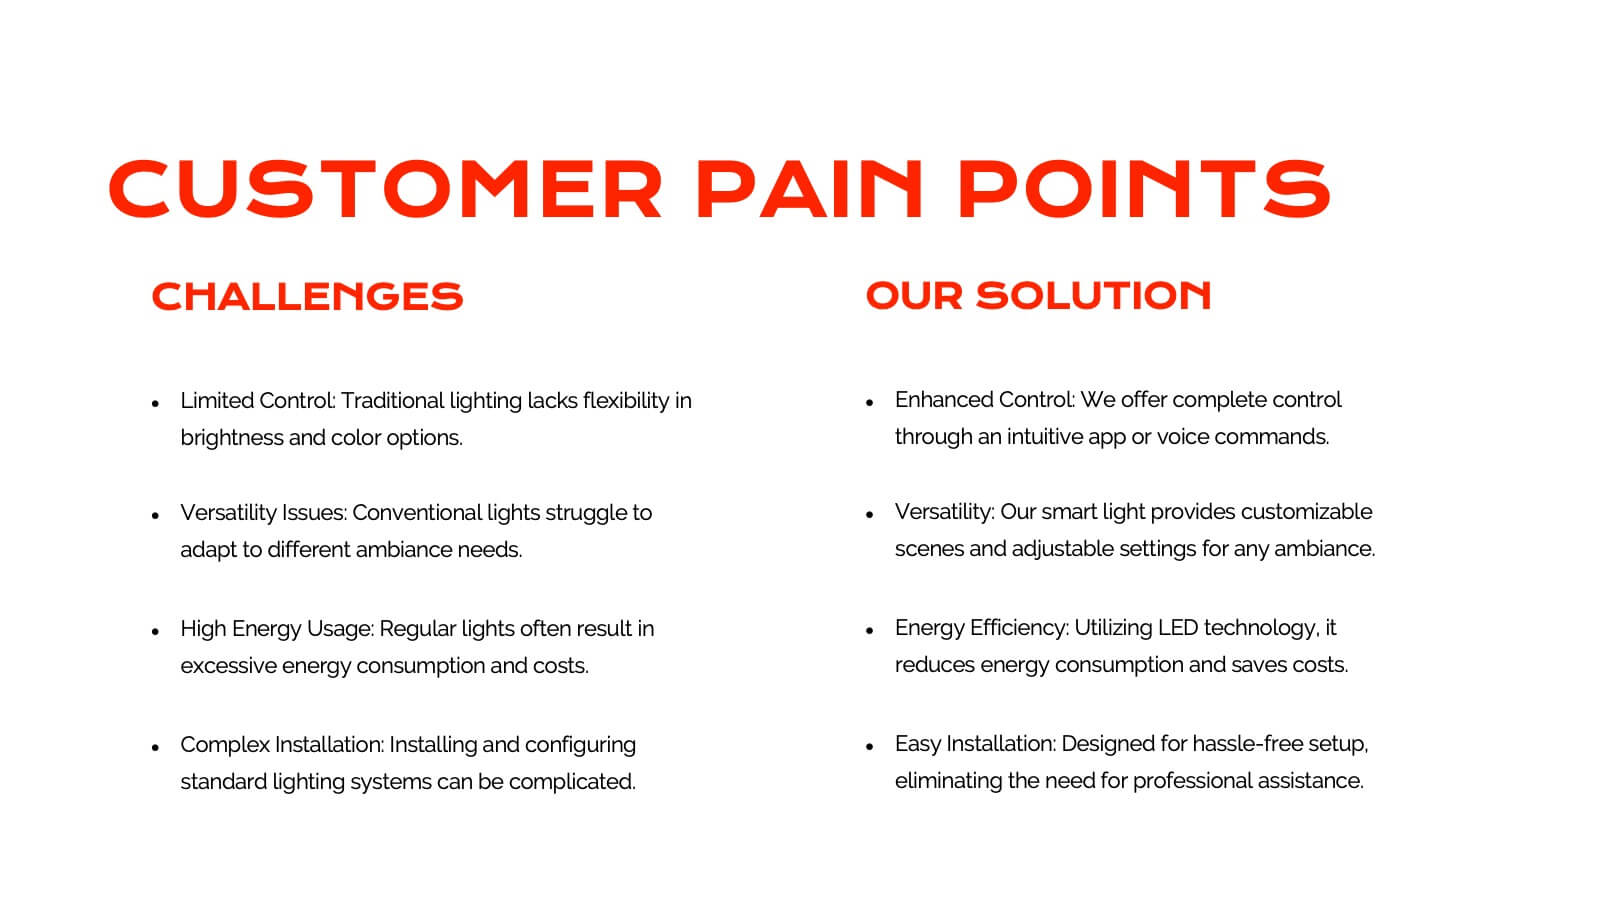
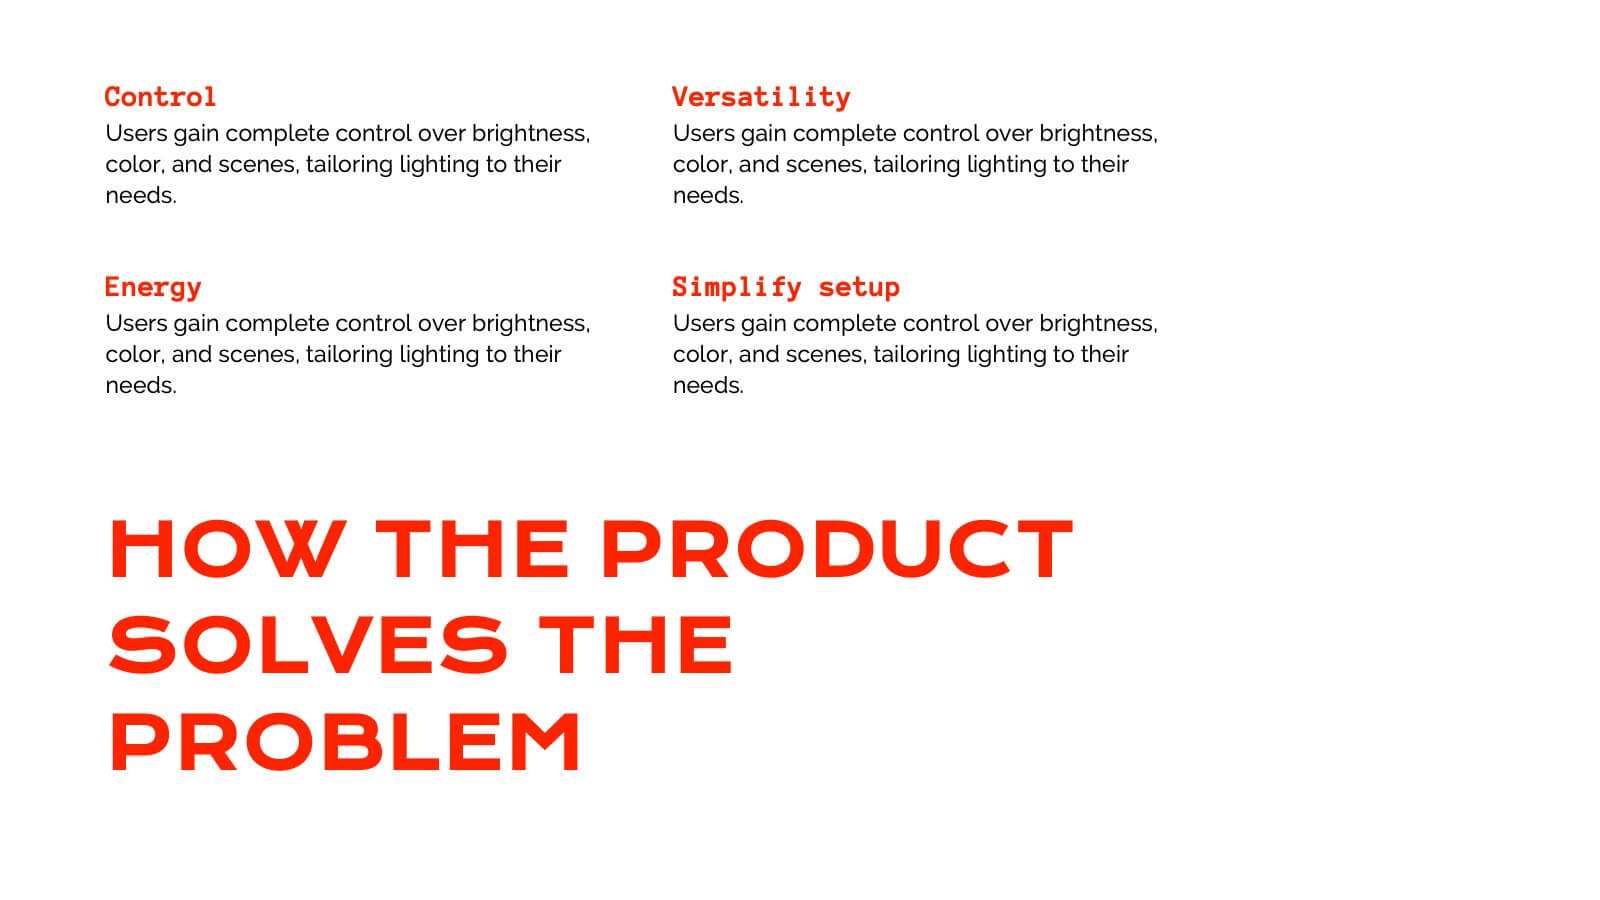
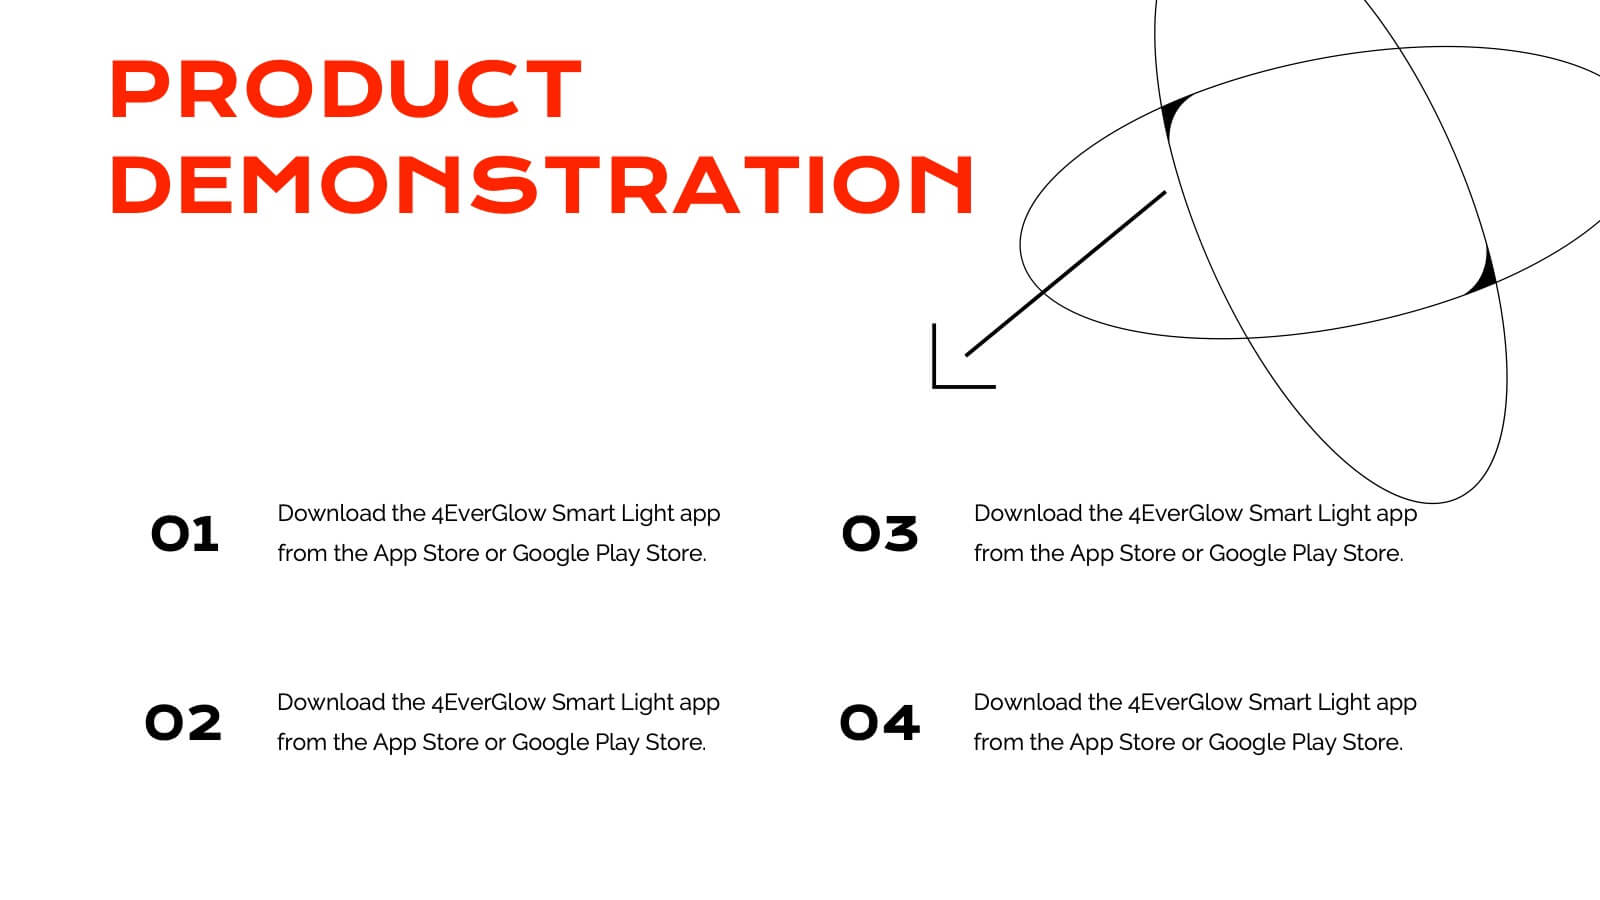
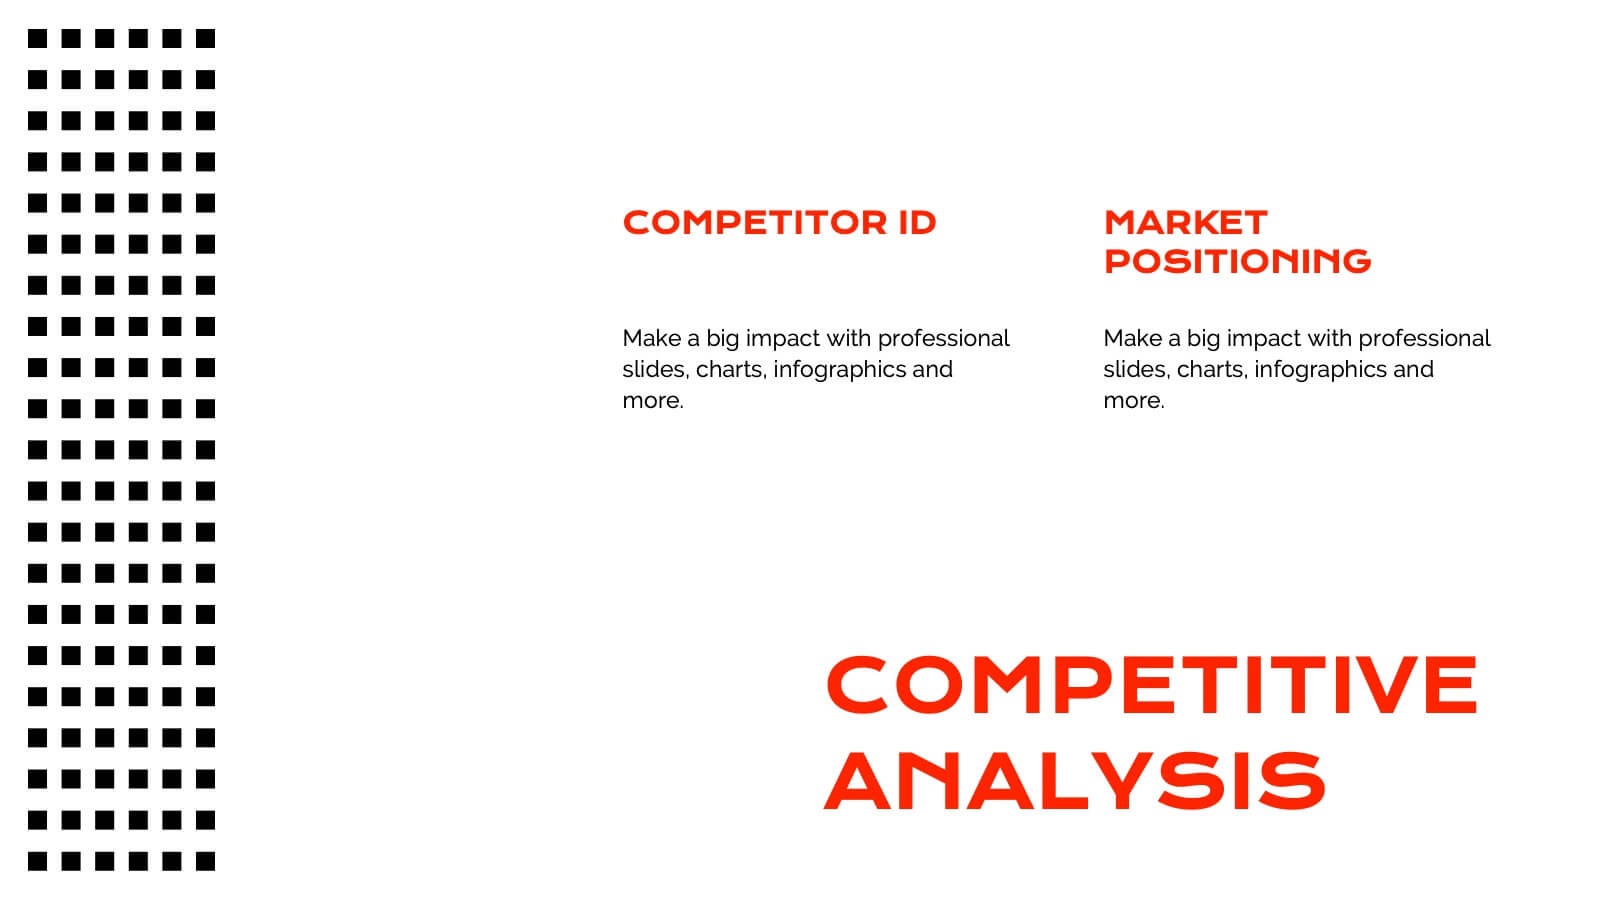
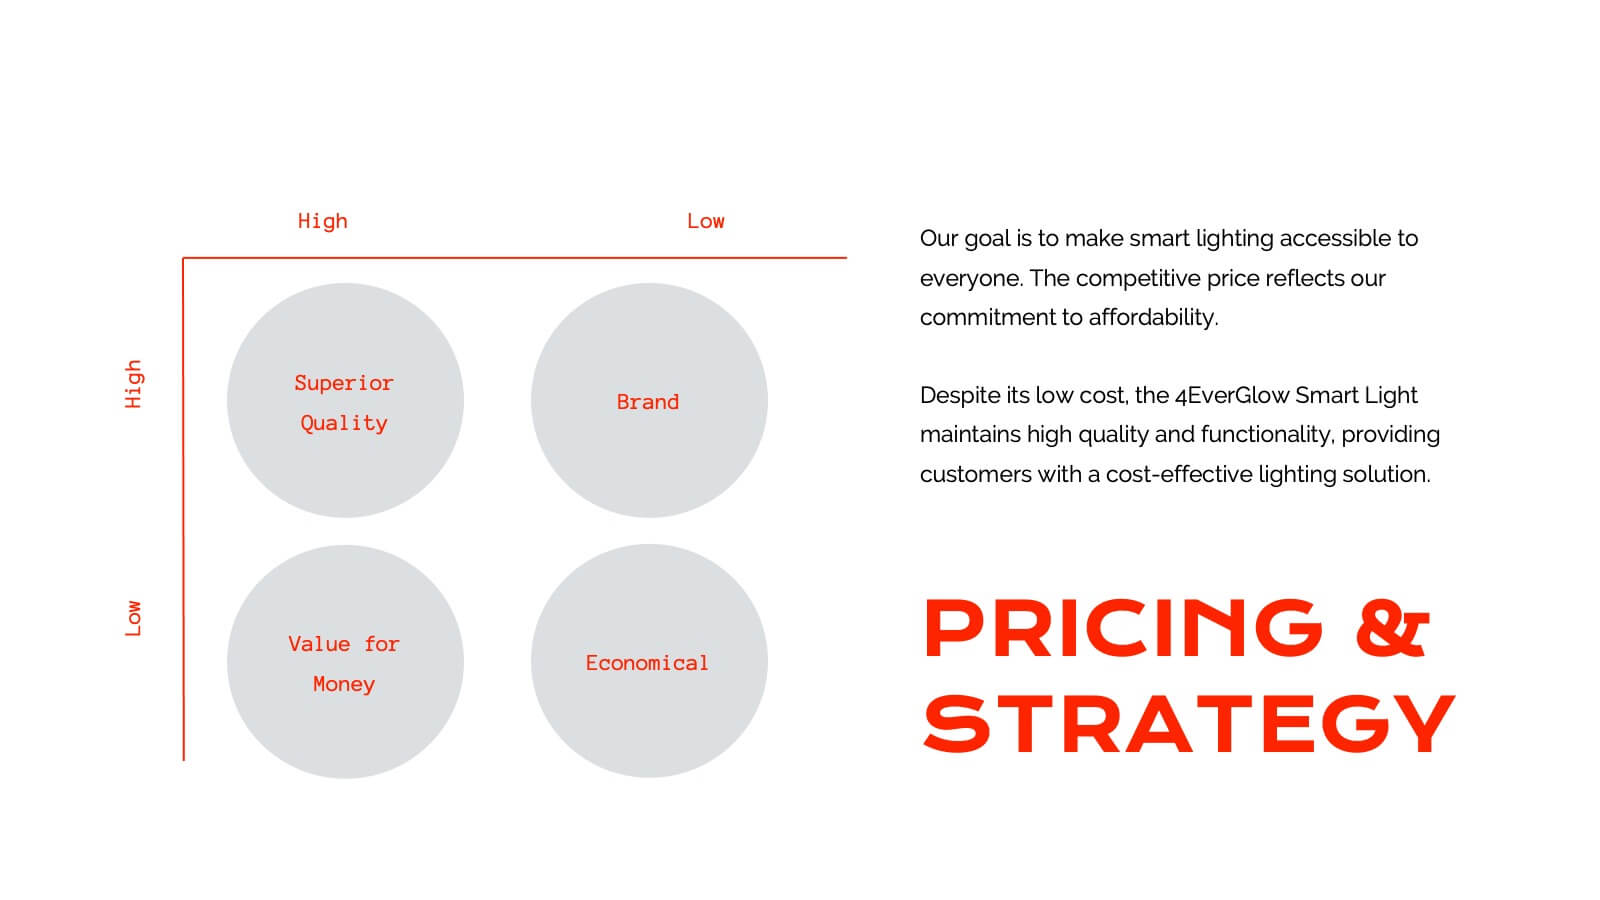
Juventas Product Roadmap Presentation
Get ready to dazzle your audience with a visually striking presentation that takes them through the entire product journey! This template covers essential areas such as product features, target market analysis, and competitive positioning. With its sleek, modern design, it's perfect for capturing attention and delivering clear information. Compatible with PowerPoint, Keynote, and Google Slides for effortless use across platforms.


6 diapositivas
Mind Map Ideas Infographic
A Mind Map is a visual representation of ideas, concepts, and relationships, often created around a central topic or theme. This infographic mind map template offer a versatile and effective method for organizing, analyzing, and visualizing information, making them valuable tools for learning, problem-solving, and creative exploration. The structure of this template consists of the central idea or topic placed at the center of the map. This template provides a structured way to showcase and organize ideas using the mind mapping technique. Compatible with Powerpoint, Keynote, and Google Slides.


6 diapositivas
Decision-Making Using Tree Diagrams Presentation
Clarify complex decisions with the Decision-Making Using Tree Diagrams Presentation. This slide design features a clear, hierarchical structure that helps visualize choices, outcomes, and decision paths step by step. Perfect for business strategy, risk analysis, or logic-based planning. Fully editable in PowerPoint, Keynote, and Google Slides.


8 diapositivas
SaaS Pricing Model Presentation
Enhance your SaaS offerings' visibility with our 'SaaS Pricing Model' presentation template. This streamlined design clearly compares different subscription levels, making it simple for potential clients to evaluate features against price points. Ideal for tech startups and SaaS providers, this template supports PowerPoint, Keynote, and Google Slides, ensuring wide compatibility.