


Características


¿Tienes alguna pregunta?
Recomendar


22 diapositivas
Synchrony New Product Proposal Presentation
Present your innovative ideas effectively with this sleek and organized product proposal template, tailored to showcase every aspect of your new product. From introduction to execution, this template covers every detail, ensuring your proposal is both comprehensive and visually appealing. Key features include slides for product overview, features, target audience analysis, and customer pain points. Additionally, it provides sections for competitive analysis, pricing strategy, and distribution channels, equipping you with all the tools to communicate your value proposition clearly. Technical specifications and production processes are also included, perfect for presenting intricate details. Compatible with PowerPoint, Google Slides, and Keynote, this template is fully customizable to align with your brand’s aesthetics. Whether pitching to stakeholders, potential investors, or internal teams, this presentation ensures your proposal is structured, impactful, and engaging. Save time and leave a lasting impression with this professional design, suitable for any new product launch.


4 diapositivas
Remote Learning Classroom Engagement Presentation
Make virtual classrooms more engaging with this clear, conversation-inspired visual. Designed for educators, trainers, and e-learning professionals, this infographic helps highlight interaction points, participation levels, or communication flows in remote learning. Easy to customize and fully compatible with PowerPoint, Keynote, and Google Slides.
4 diapositivas
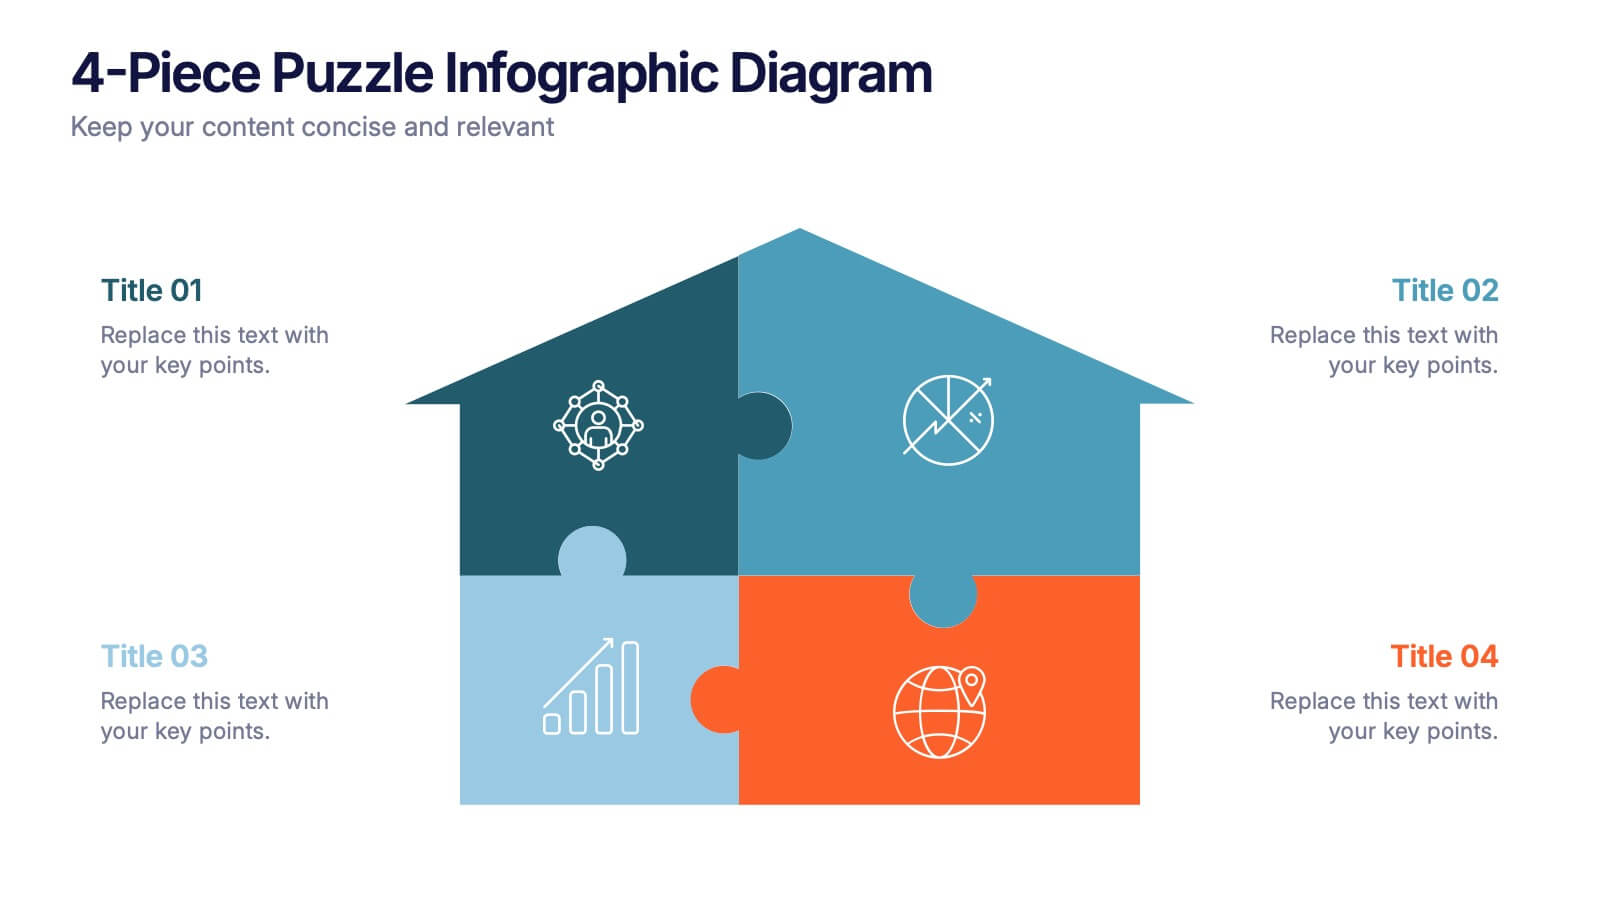
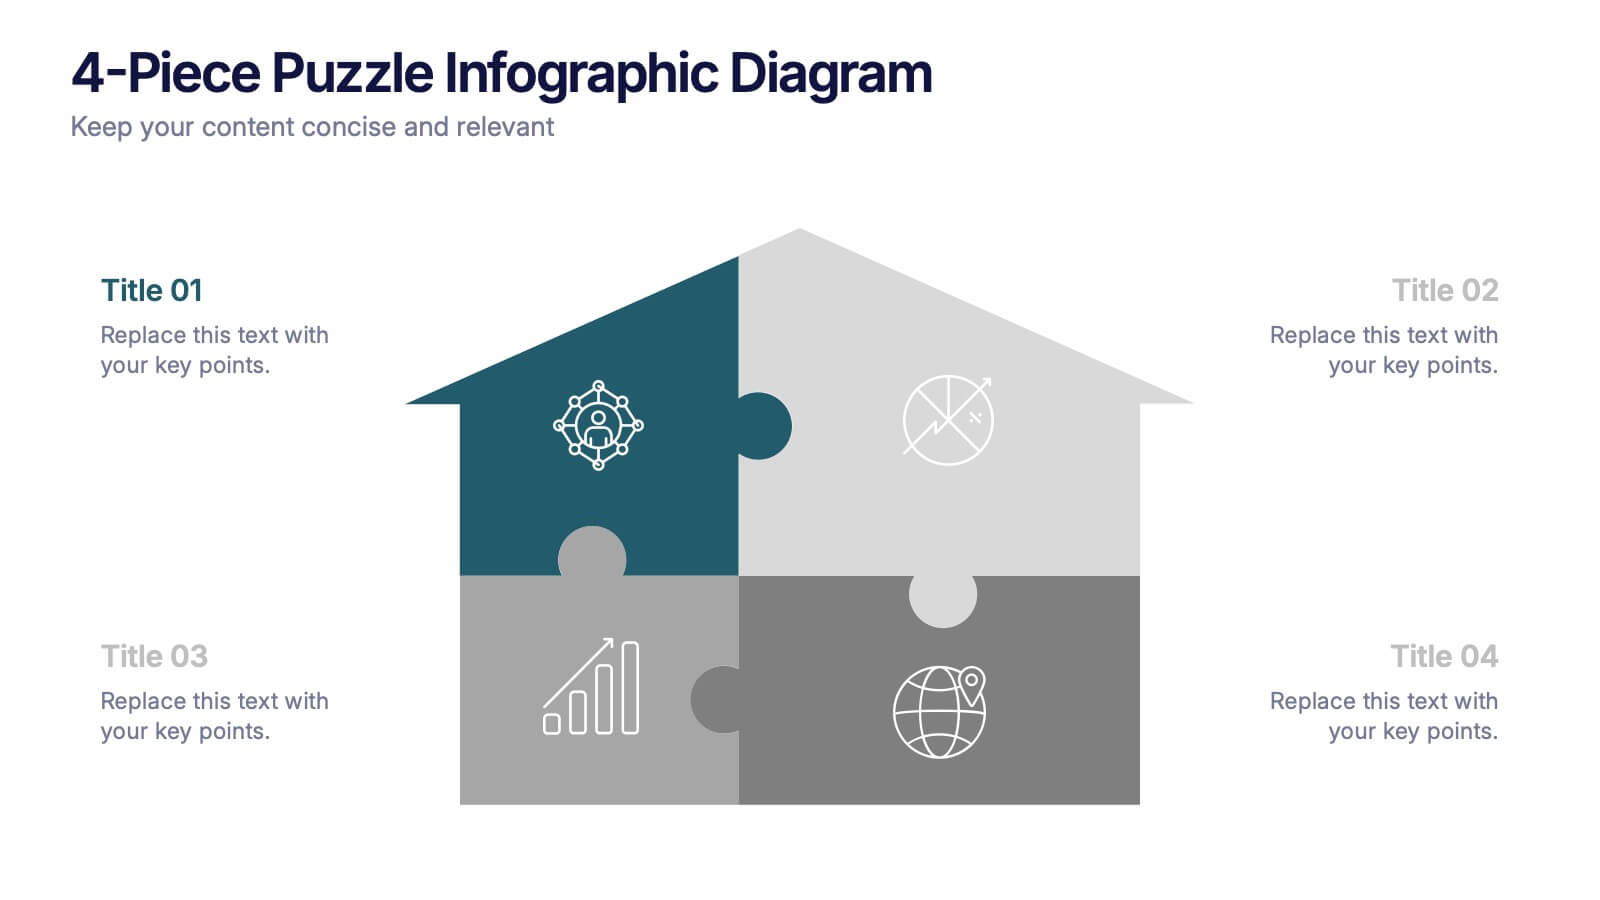
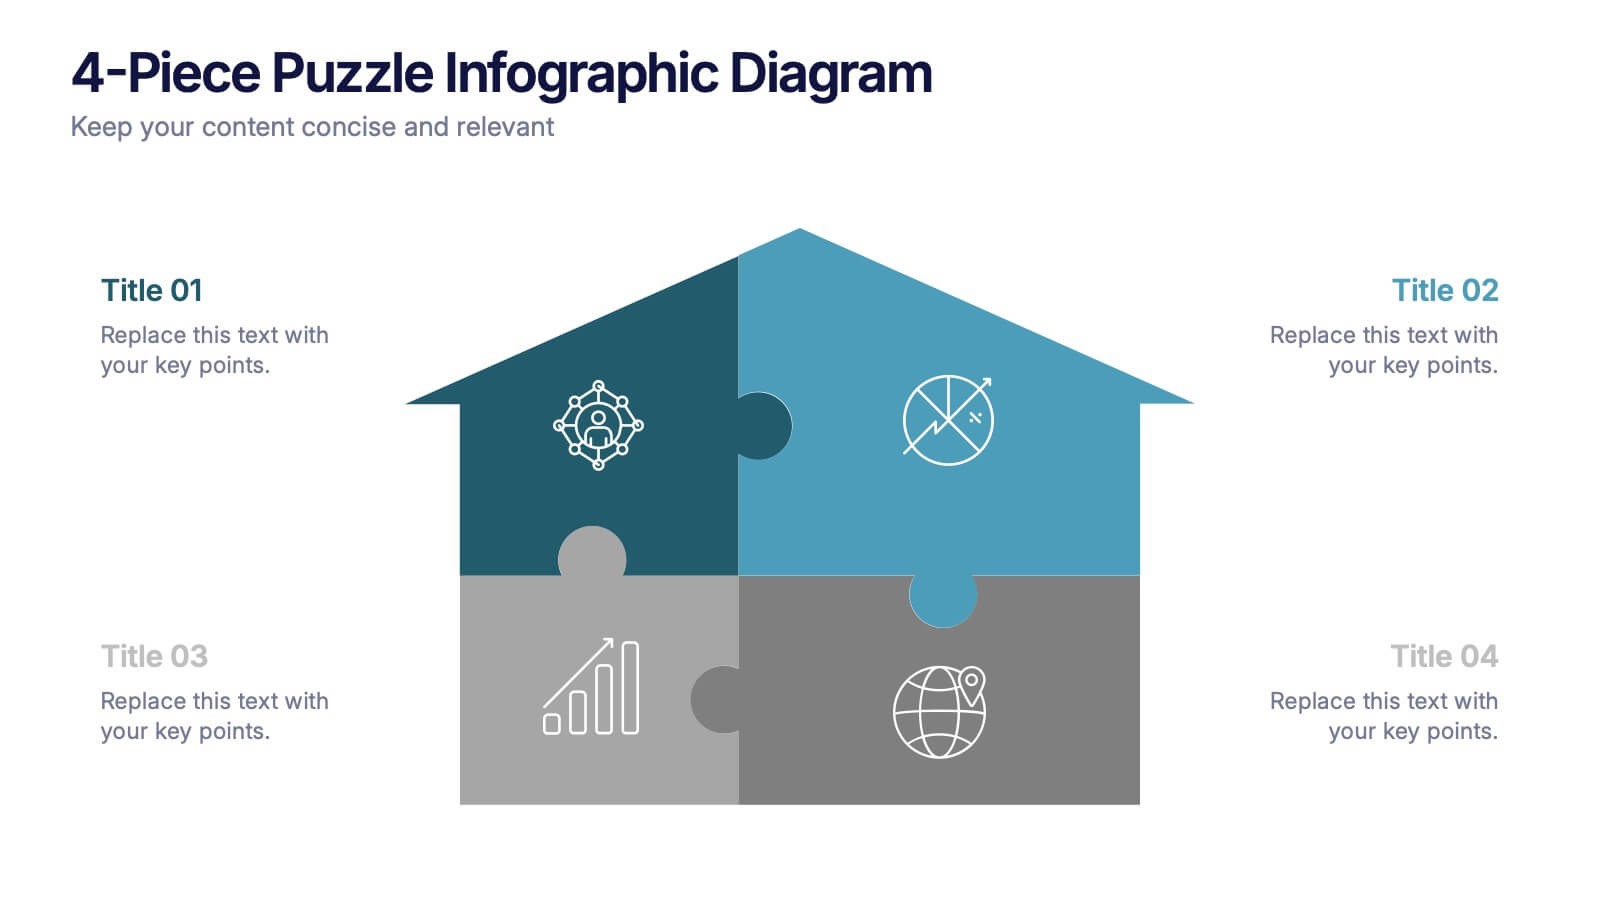
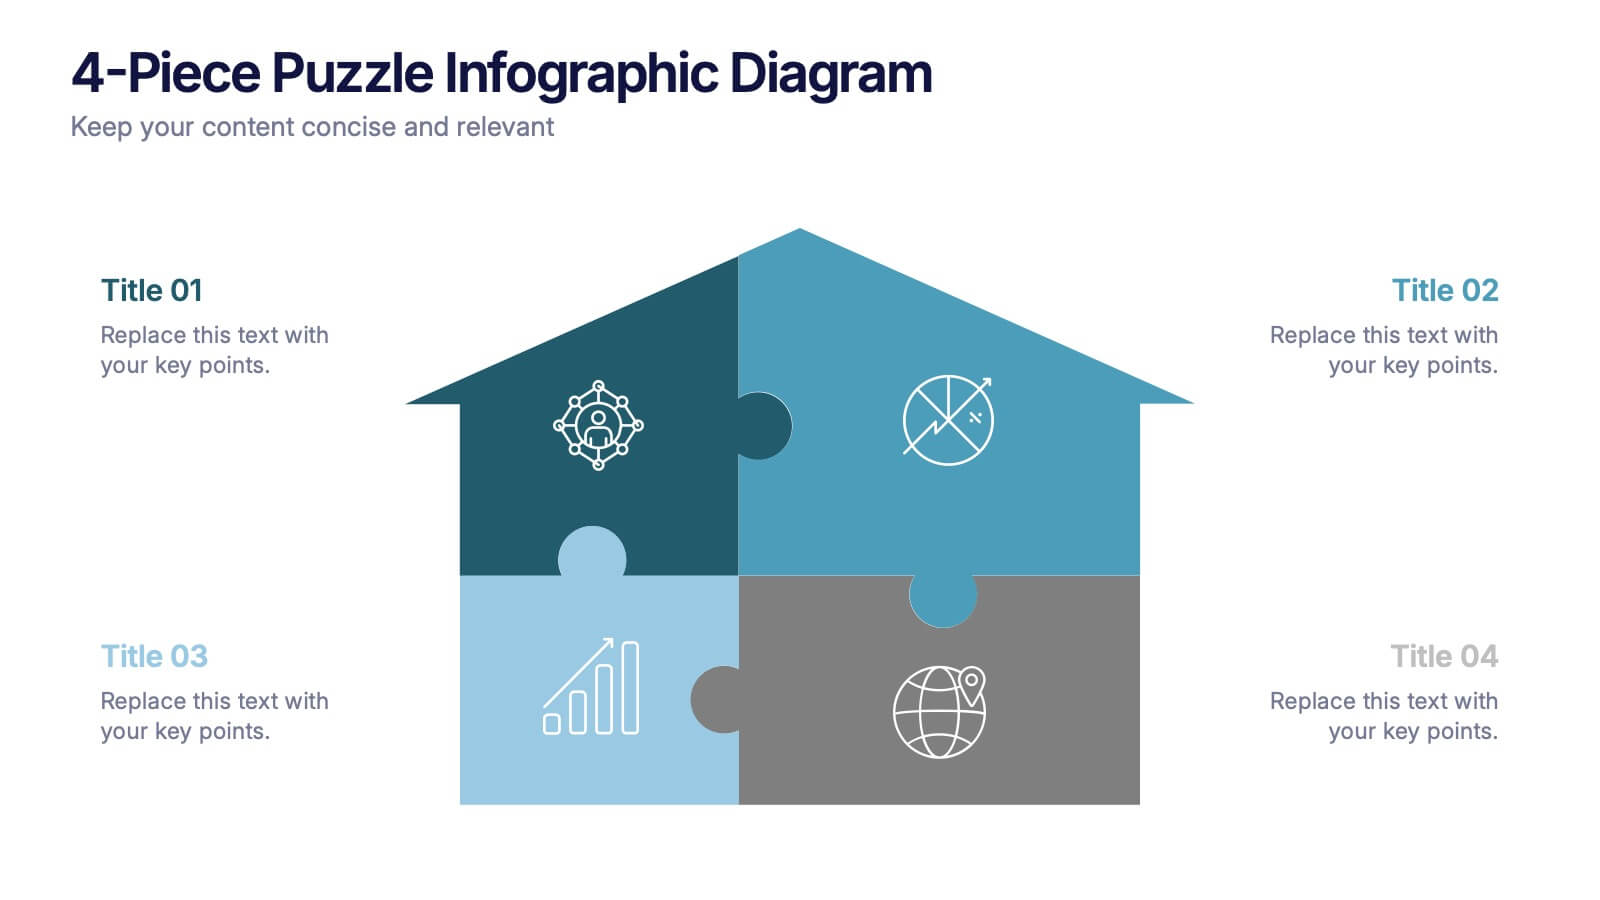
4-Piece Puzzle Infographic Diagram Presentation
Bring clarity and impact to your message with a visual layout that snaps big ideas together like a puzzle. This presentation helps you break complex concepts into four connected sections, making explanations easier and more engaging for any audience. Ideal for planning, insights, or strategy sessions. Fully compatible with PowerPoint, Keynote, and Google Slides.


5 diapositivas
Customer Perceived Value Analysis Presentation
Capture the essence of customer perception with this visually engaging template. Designed for businesses aiming to assess and enhance value propositions, it breaks down key insights into digestible segments. Perfect for marketing strategies and consumer behavior analysis, this template is fully compatible with PowerPoint, Keynote, and Google Slides for seamless customization.


5 diapositivas
Insurance Policy Infographics
Dive into the intricacies of insurance with our insurance policy infographics. Rendered in a professional palette of blue and an array of engaging colors, this creative, vertical template simplifies the often complex world of insurance policies. Ideal for insurance agents, companies, and educators, it provides a visual aid to explain coverage specifics, terms, and conditions or to compare policy offerings clearly and effectively. The infographic includes aesthetically pleasing graphics, symbolic icons, and designated spaces for factual data, making it a quintessential tool for enhancing audience understanding and promoting informed decision-making.


26 diapositivas
Operational Efficiency Tips Purple Presentation
Optimize your team's workflow and showcase your strategies for improved performance with this operational efficiency template. The vibrant purples and dynamic design invite viewers into a world where streamlined processes and clear objectives lead to success. Lay out the steps of your action plan, from the CEO's vision to the team's execution, with a variety of slides designed for clear communication. Charts and diagrams turn complex data into easy-to-follow visuals, while mockups provide a real-world view of your tools and platforms. Tailored for use in popular presentation software, this set of slides is an excellent aid for managers and consultants aiming to present plans that boost productivity and cut down waste. It’s all about making the complex simple and achieving more with less, helping your audience see the path to a leaner and more effective operation.


5 diapositivas
RAPID Decision-Making Roles Overview Presentation
Clarify accountability and streamline decisions with the RAPID Decision-Making Roles Overview Presentation. This visual layout breaks down the five essential roles—Recommend, Agree, Perform, Input, and Decide—into a clear quadrant diagram. Ideal for project teams, leadership alignment, or decision-making workshops. Fully editable in PowerPoint, Google Slides, Keynote, and Canva.


4 diapositivas
Executive Business Planning Roadmap Presentation
Outline your strategic initiatives with this Executive Business Planning Roadmap. Ideal for mapping product development, quarterly goals, or department plans, this slide helps visualize key stages across multiple projects. Easy to edit in PowerPoint, Keynote, and Google Slides—perfect for leadership updates, planning meetings, or executive-level presentations.


5 diapositivas
Visual Decision-Making with Harvey Balls Presentation
Simplify complex evaluations with this Harvey Ball comparison chart. Ideal for product comparisons, feature assessments, or decision-making matrices, this slide presents up to 6 items and 4 features with intuitive visual cues. Fully editable in PowerPoint, Keynote, or Google Slides, it’s perfect for business, marketing, and strategy teams seeking clear and compelling insights.


8 diapositivas
Business Challenge and Issue Definition Presentation
Break down complex problems with clarity using this Business Challenge and Issue Definition presentation. Designed to highlight key issues step by step, this layout helps your audience follow your reasoning with ease. Ideal for internal reviews or strategy alignment, it’s fully editable in Canva, PowerPoint, and Google Slides.


7 diapositivas
Strategy Wheel Infographics Presentation Template
The Strategy Wheel is a tool you can use for your personal life and work life to get clarity on how you create unique value for the world. This strategy seeks to generate consistent value while limiting risk. Use the strategy wheel as a tool to help your company develop unique strategies. Your Strategy Wheel should be a reflection of your purpose and your approach for unique value creation. This template is perfect if you want to center your purpose and evaluate why you and your business exist. This template comes with a variety of different strategy wheels you can customize and make your own.


7 diapositivas
North America Language Map Infographic
Embark on a visual odyssey across the vast terrains of North America with our expertly crafted map infographic. Painted in the expansive blue, the lush green, the vibrant yellow, and the warm orange, our template captures the essence of North America's diverse geographies and cultures. Adorned with accurate infographics, distinct icons, and region-specific image placeholders, it provides a panoramic view of the continent's multifaceted landscape. Flawlessly tailored for Powerpoint, Keynote, or Google Slides. An indispensable tool for educators, travelers, geographers, or businesses targeting the North American market. Navigate with purpose; let every slide be a step into North America's captivating expanse.


7 diapositivas
Anatomy Infographic Presentation Template
Anatomy infographics are visual representations of the different systems and structures of the human body. They are designed to convey complex information in an easily manner and visually appealing way. Our anatomy template include images, diagrams, and text to provide an overview of the different systems of the human body, such as the skeletal, muscular, and cardiovascular systems. Our template can be used for a variety of purposes, including education, medical training, and patient education. The text, colors and images can be easily modified to suit your needs and preferences!


7 diapositivas
AIDA Marketing Model Infographic Presentation
The AIDA chart is a marketing and sales tool that represents the four stages a consumer goes through during the purchasing process: Attention, Interest, Desire, and Action. This template is designed to give your audience an overview of the four step sales process, while also explaining what they can expect in depth. It features a visual aid, professional design and a clear layout. Put together an infographic based on the AIDA model and use it to create your own marketing material. Simple to use, customize, and present. This template can be downloaded in Powerpoint, Keynote or Google Slides.


5 diapositivas
Innovative Concept Pitch Presentation
Present your big ideas with impact using this lightbulb puzzle infographic. Perfect for concept development, product ideation, or startup pitches. The layered segments help structure your content clearly. Fully customizable in PowerPoint, Keynote, and Google Slides—ideal for innovation roadmaps, creative planning, or visualizing business concepts.


6 diapositivas
Investment Property Infographics
Step into the world of real estate with enthusiasm! This infographic opens doors to a wealth of opportunities. From the allure of rental income to the tax advantages that can boost your financial gains, we unveil the secrets that make investment properties a wise choice. Becoming a successful investor requires knowing the terrain. Dive into the nuances of property location, type, and market conditions. Gain insights into financing options, from traditional mortgages to innovative strategies. Uncover the art of property valuation, where location, condition, and appreciation potential hold the keys to your success. With this engaging infographic compatible with PowerPoint, Keynote, and Google Slides, sharing your real estate wisdom has never been easier. Empower yourself with the knowledge to unlock the potential of investment properties and set sail on a journey towards financial freedom.


4 diapositivas
OKRs Alignment for Performance Goals Presentation
Visualize and align your objectives with precision using the OKRs Alignment for Performance Goals Presentation. This template illustrates how Objectives, Key Activities, and Results converge toward a shared target, helping you communicate goals clearly to teams and stakeholders. Perfect for quarterly planning, team alignment, and executive reviews. Fully editable in Canva, PowerPoint, Keynote, and Google Slides.