


Características


¿Tienes alguna pregunta?
Recomendar


20 diapositivas
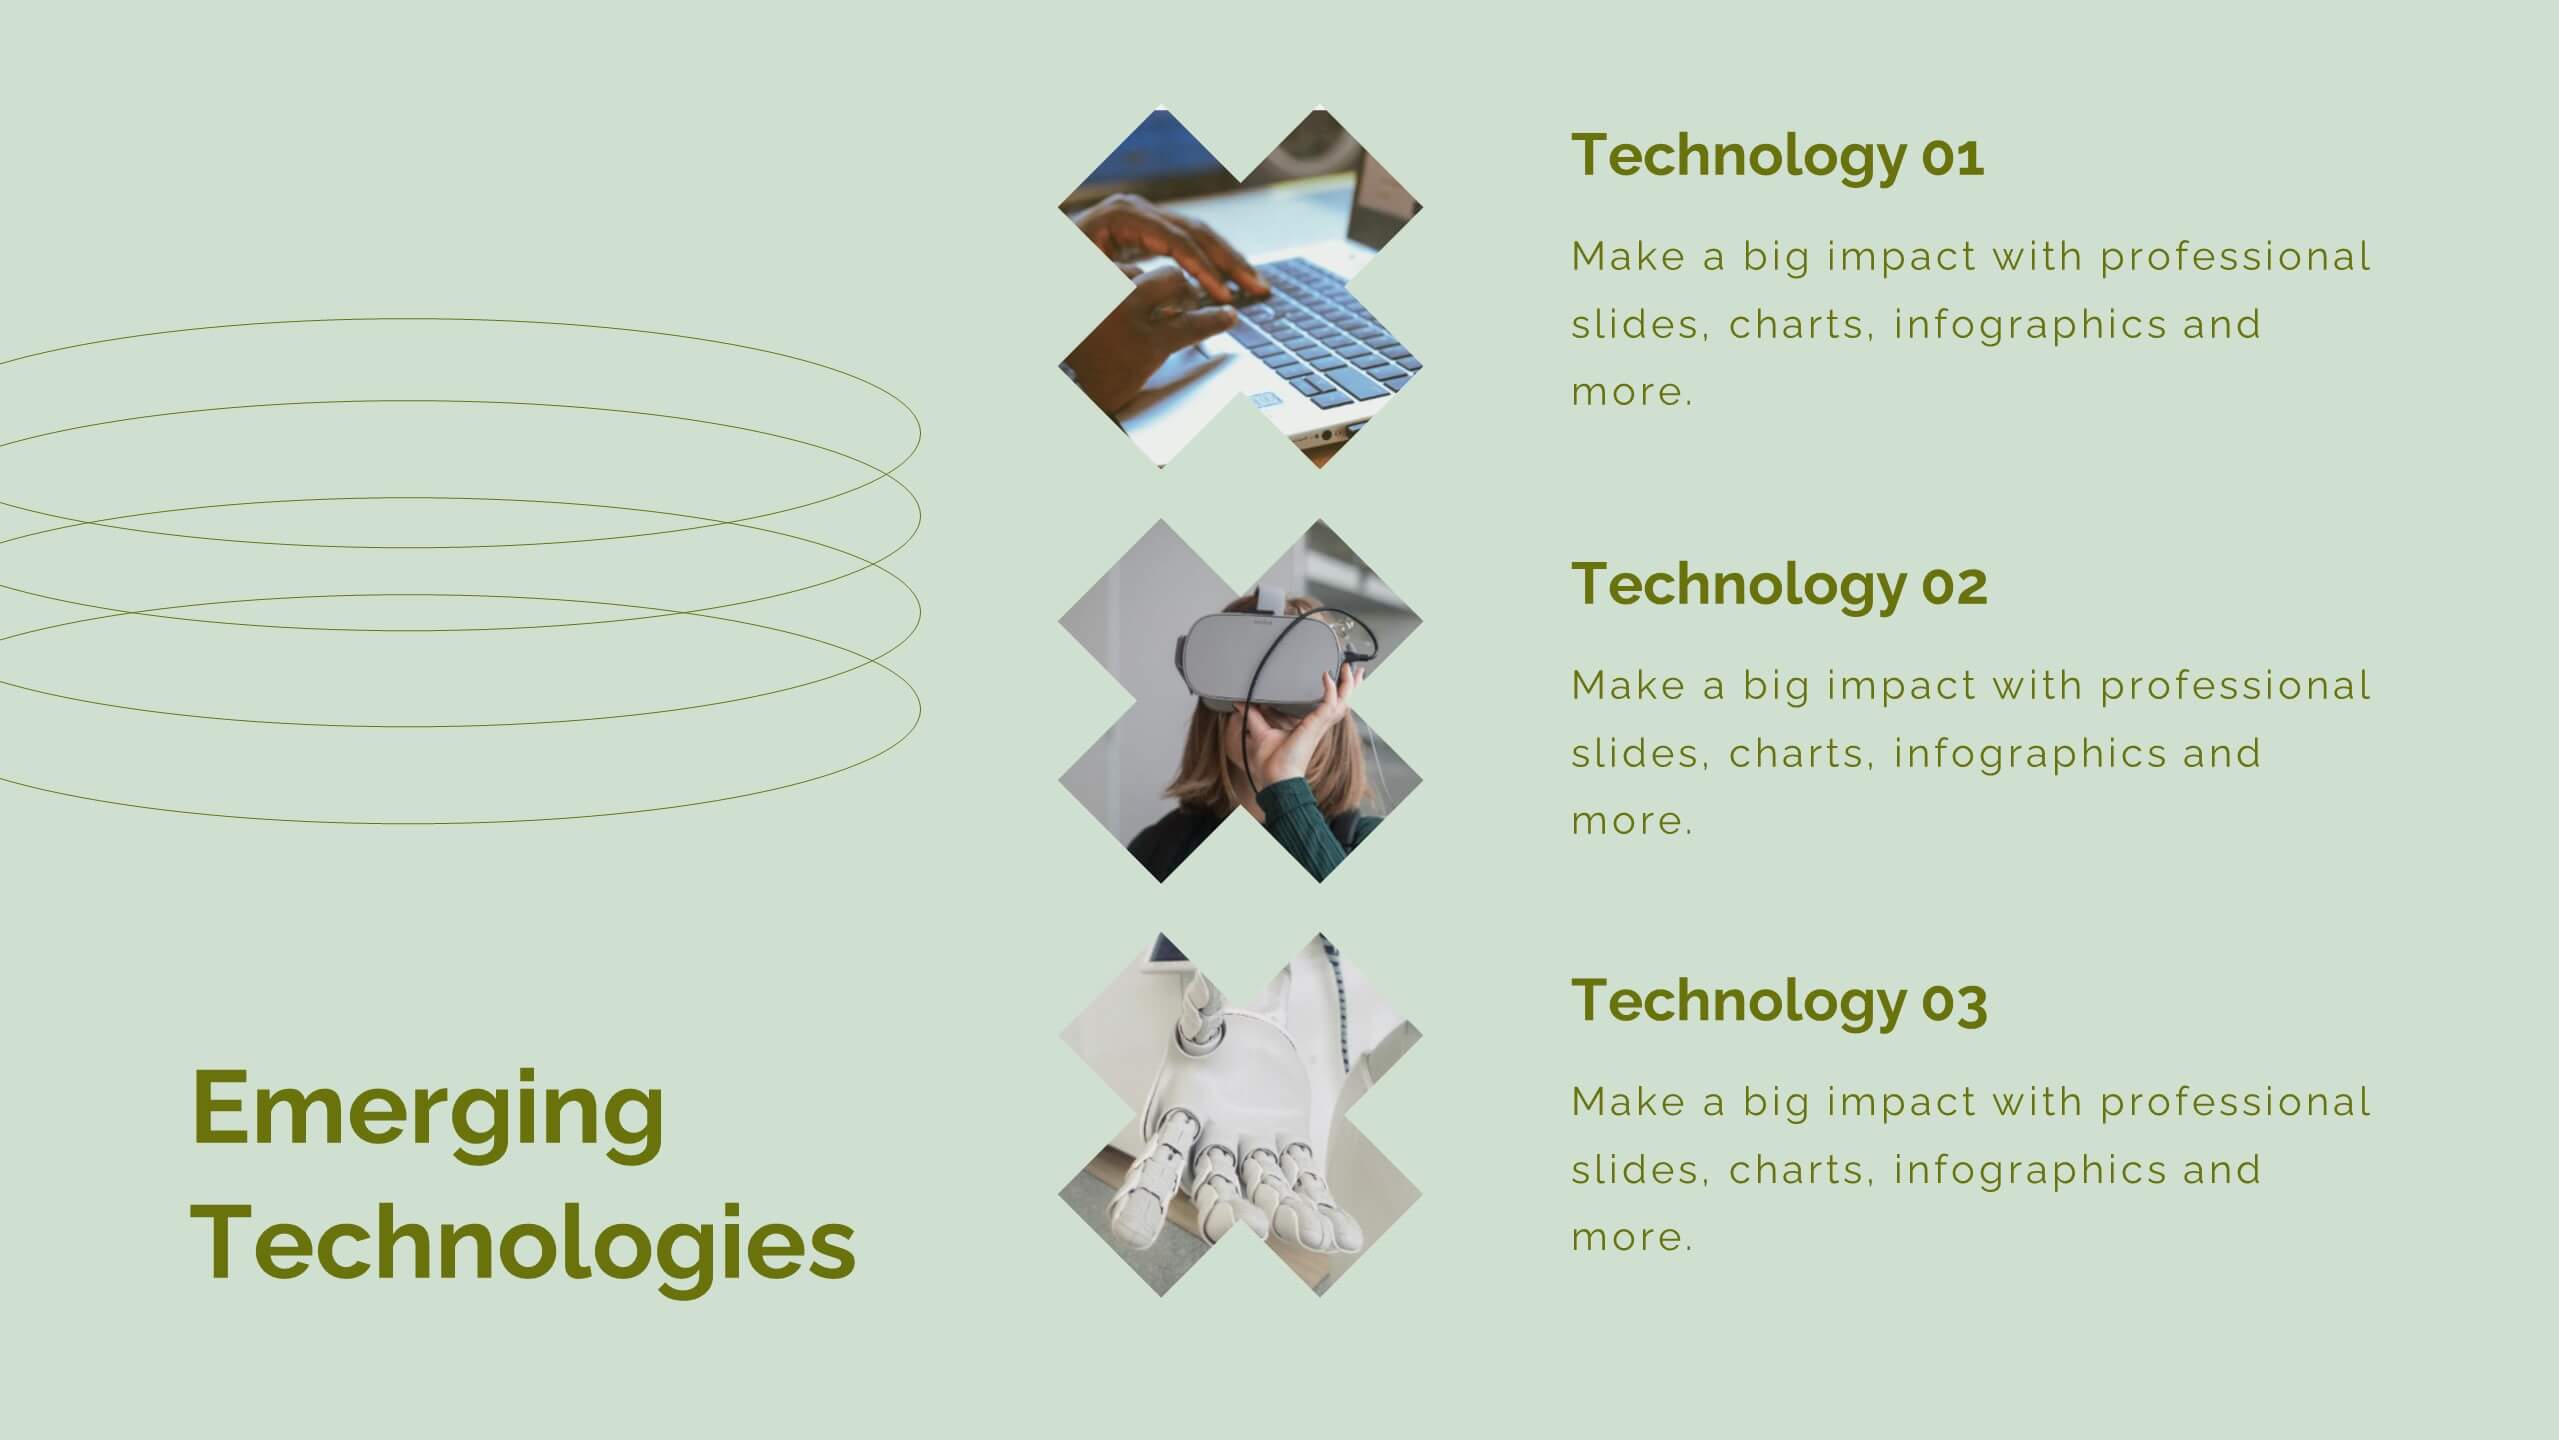
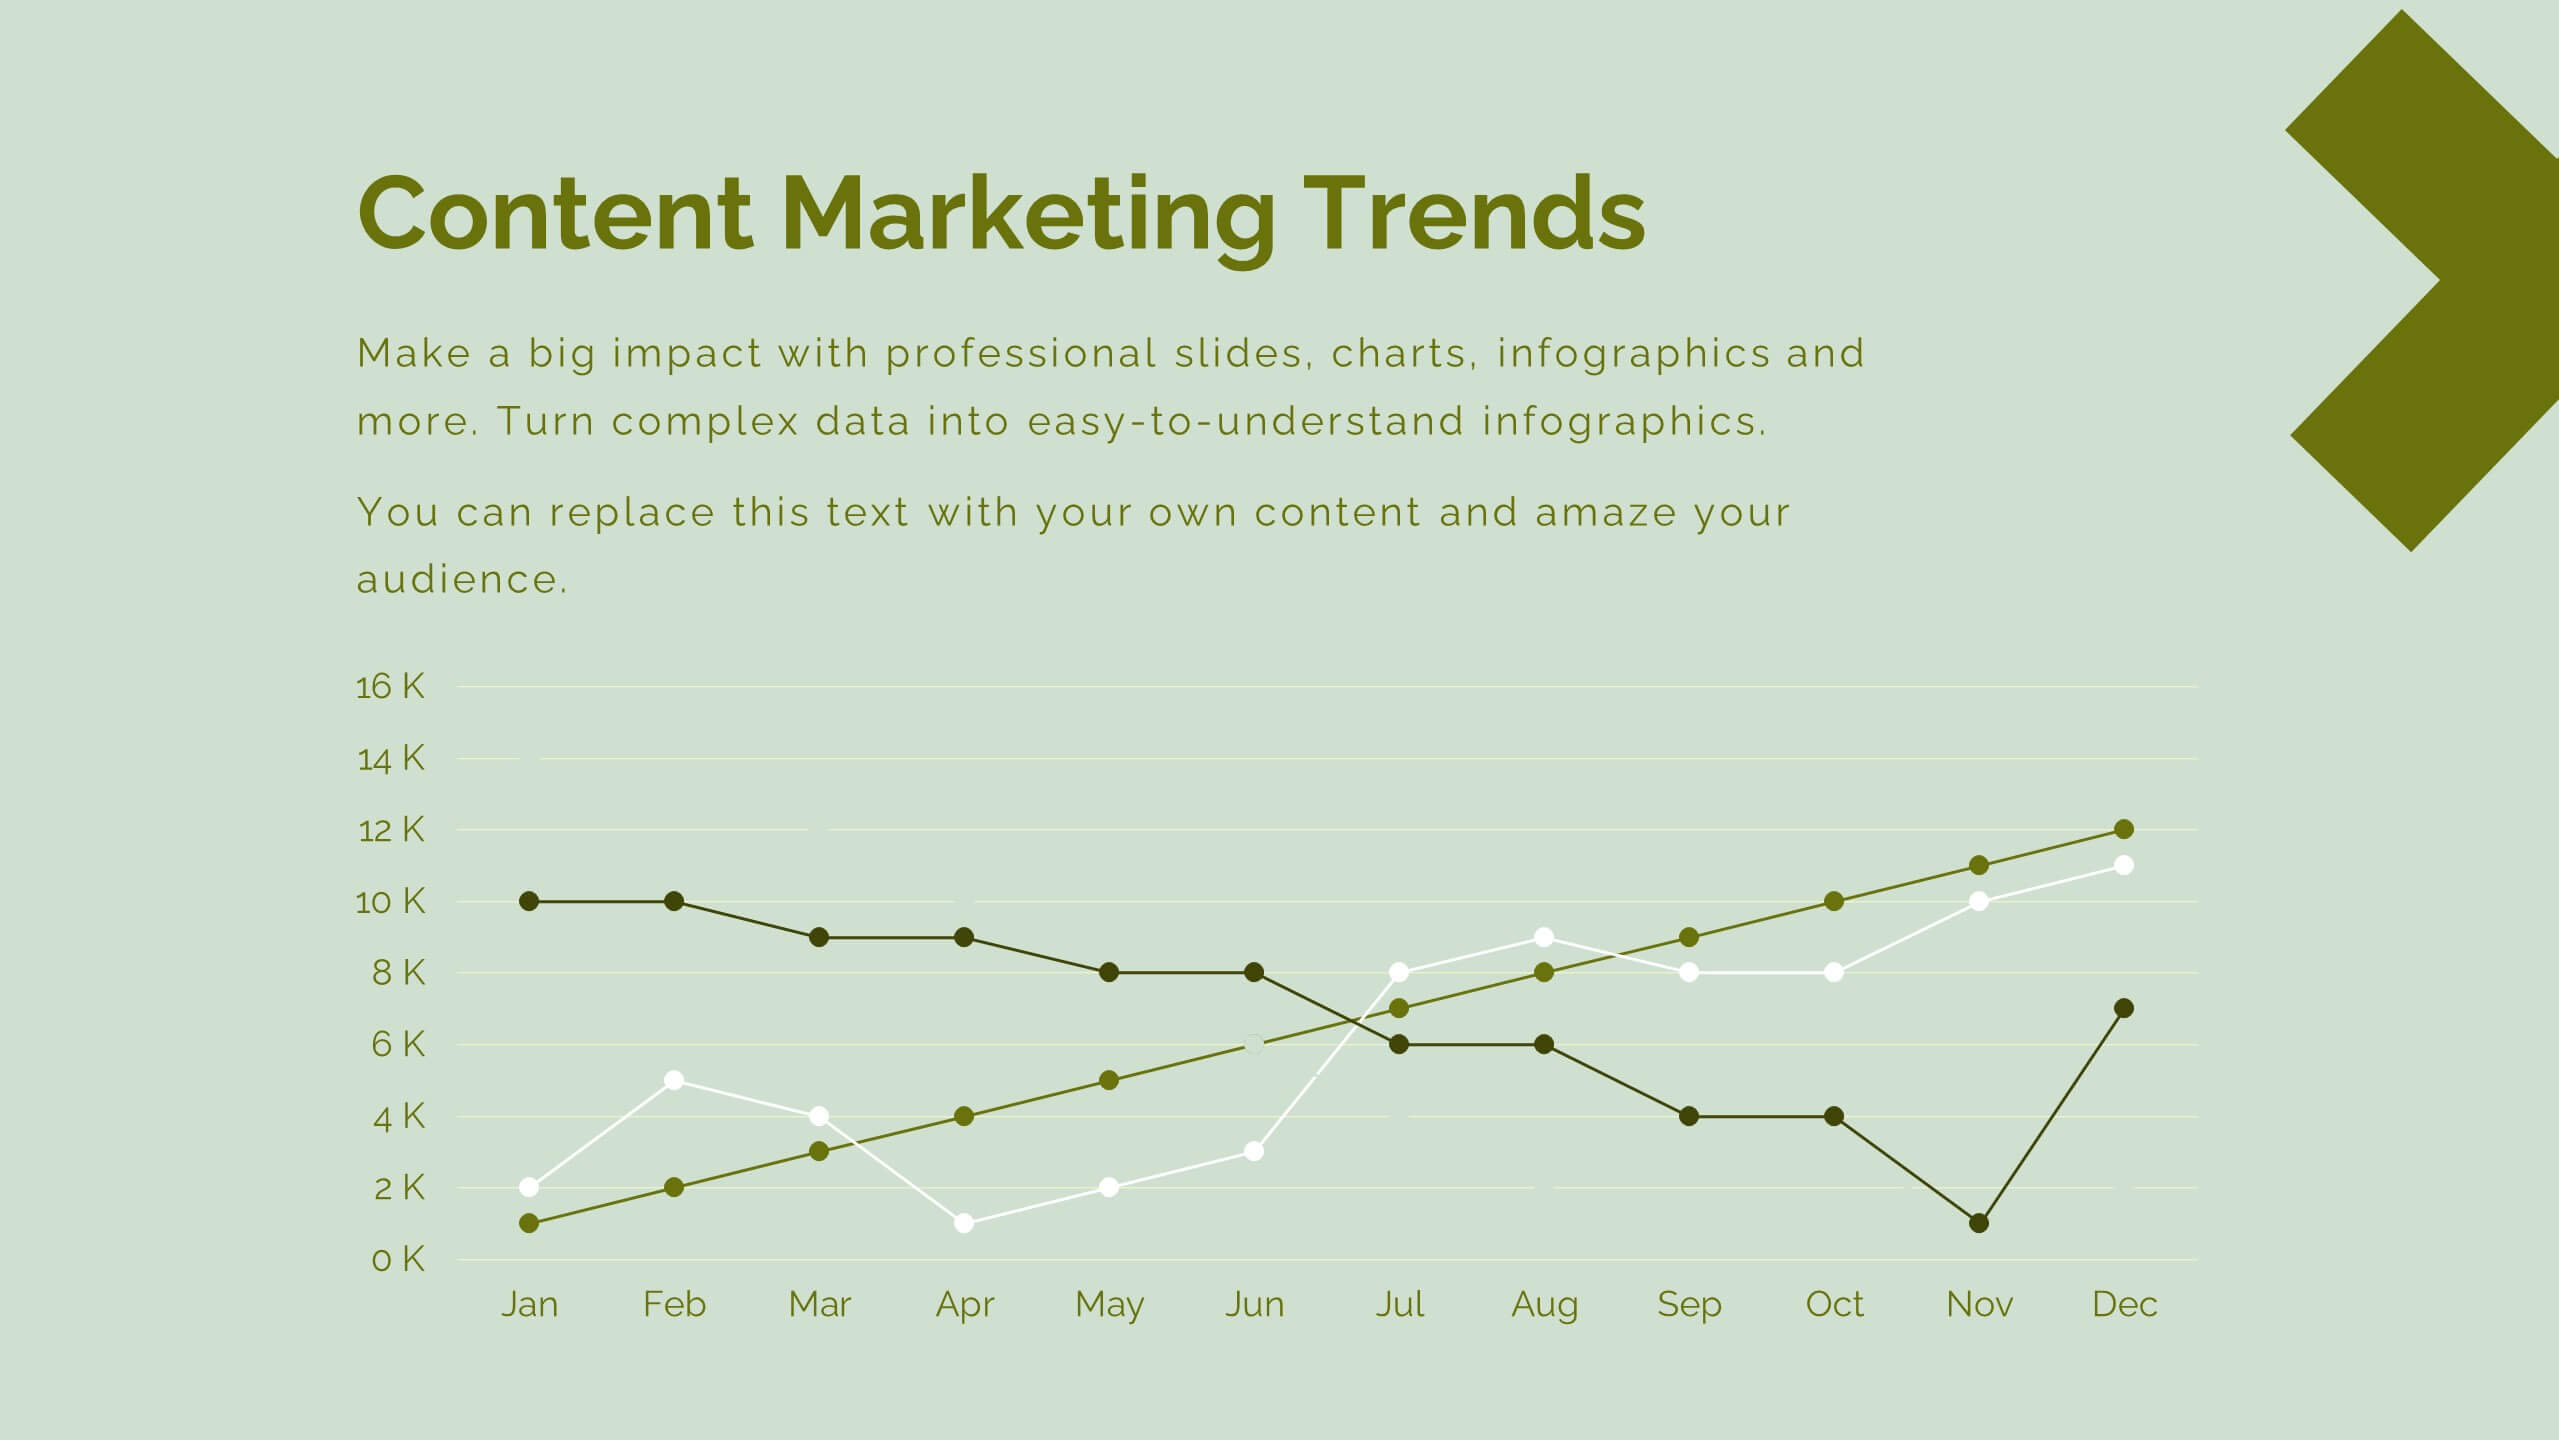
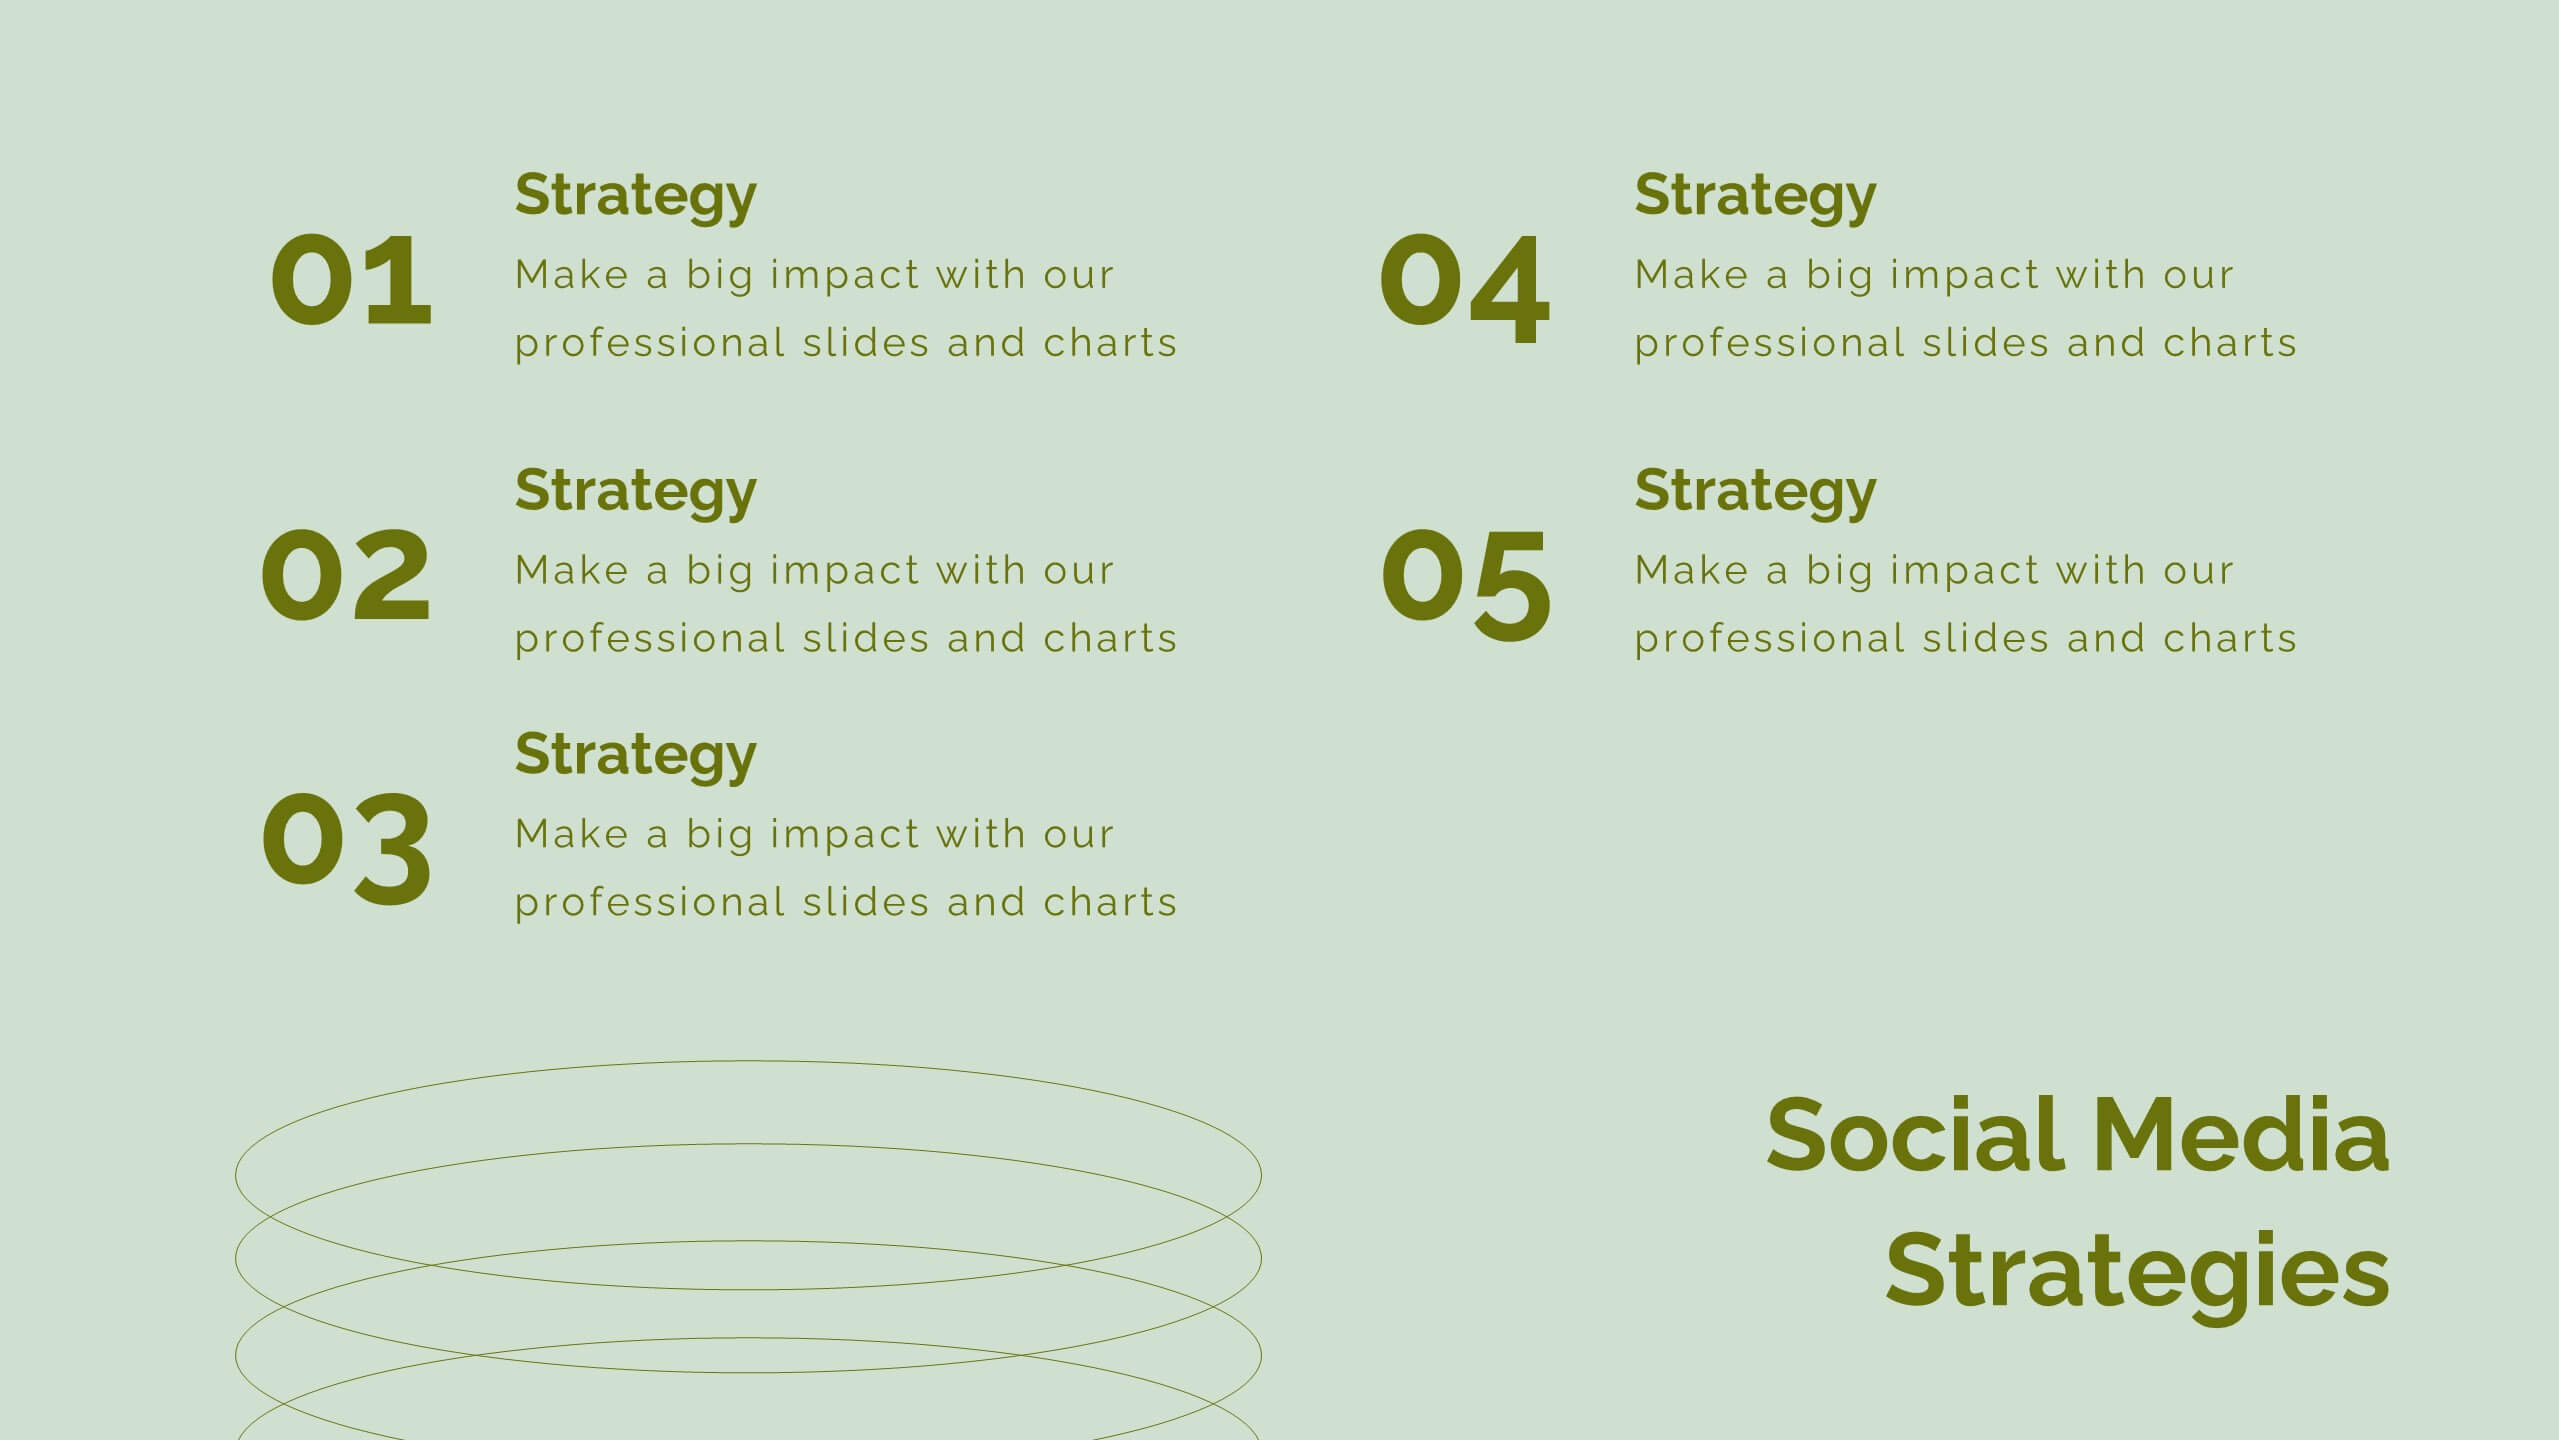
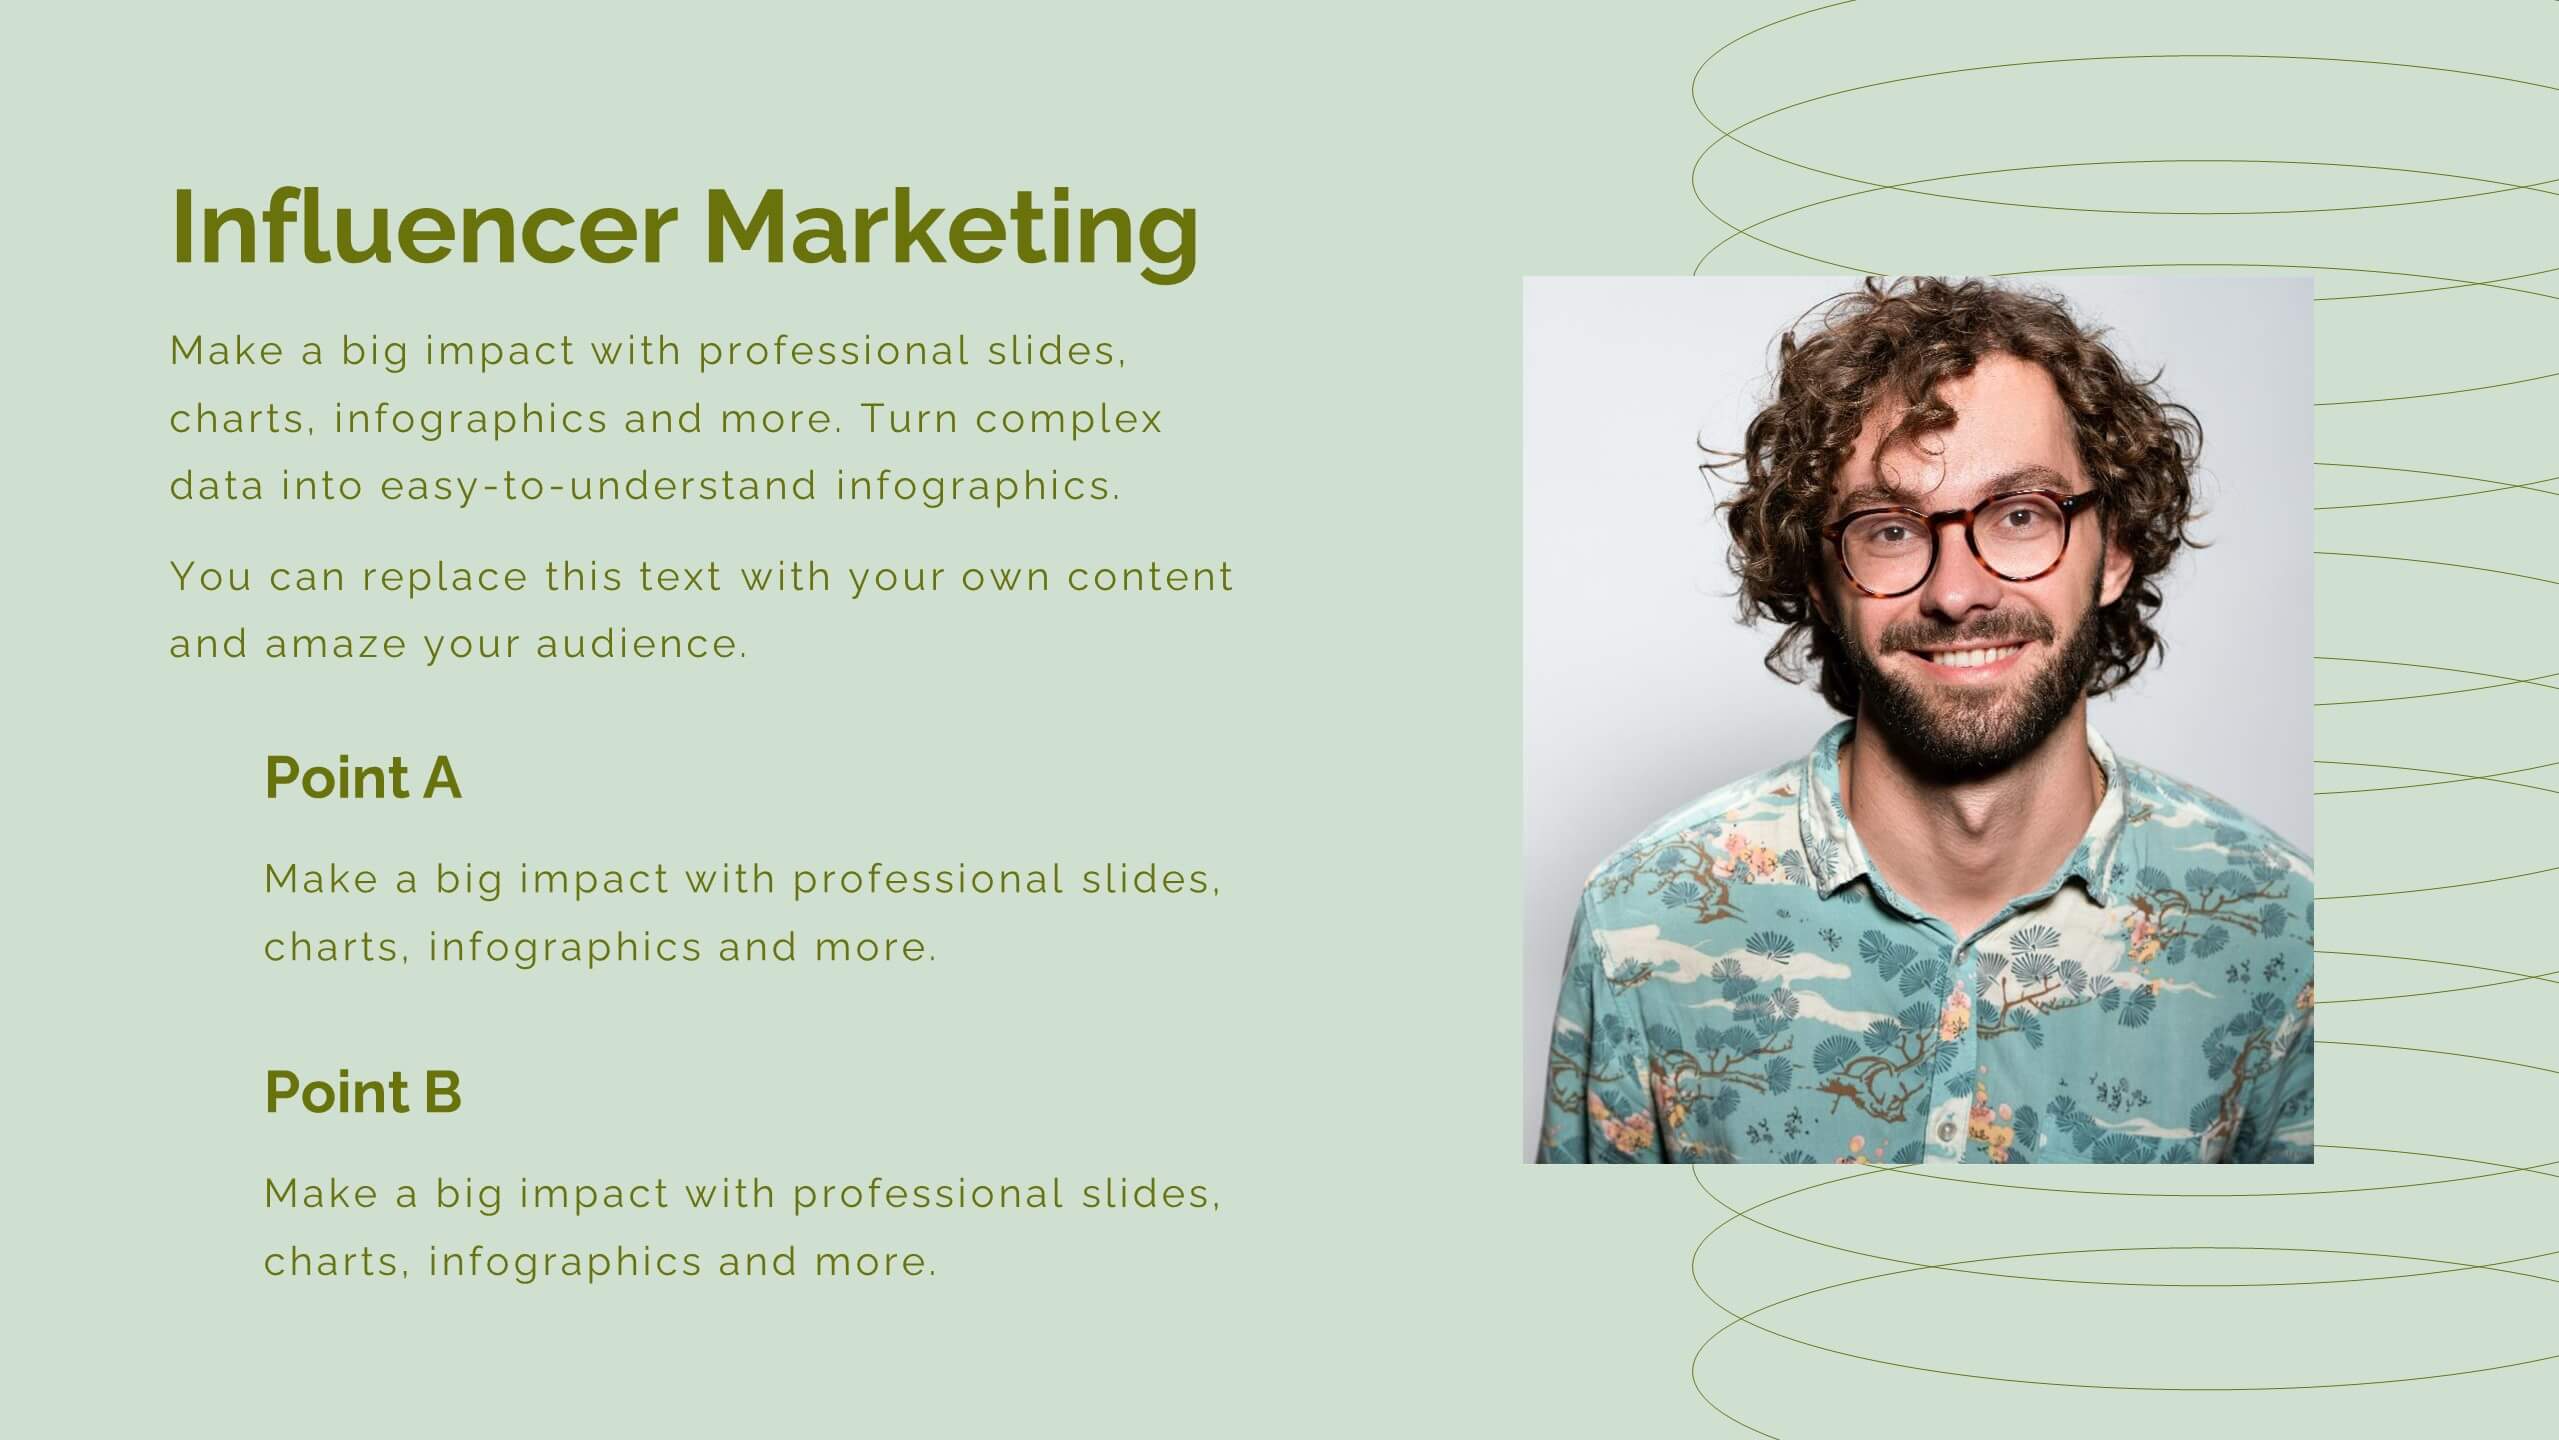
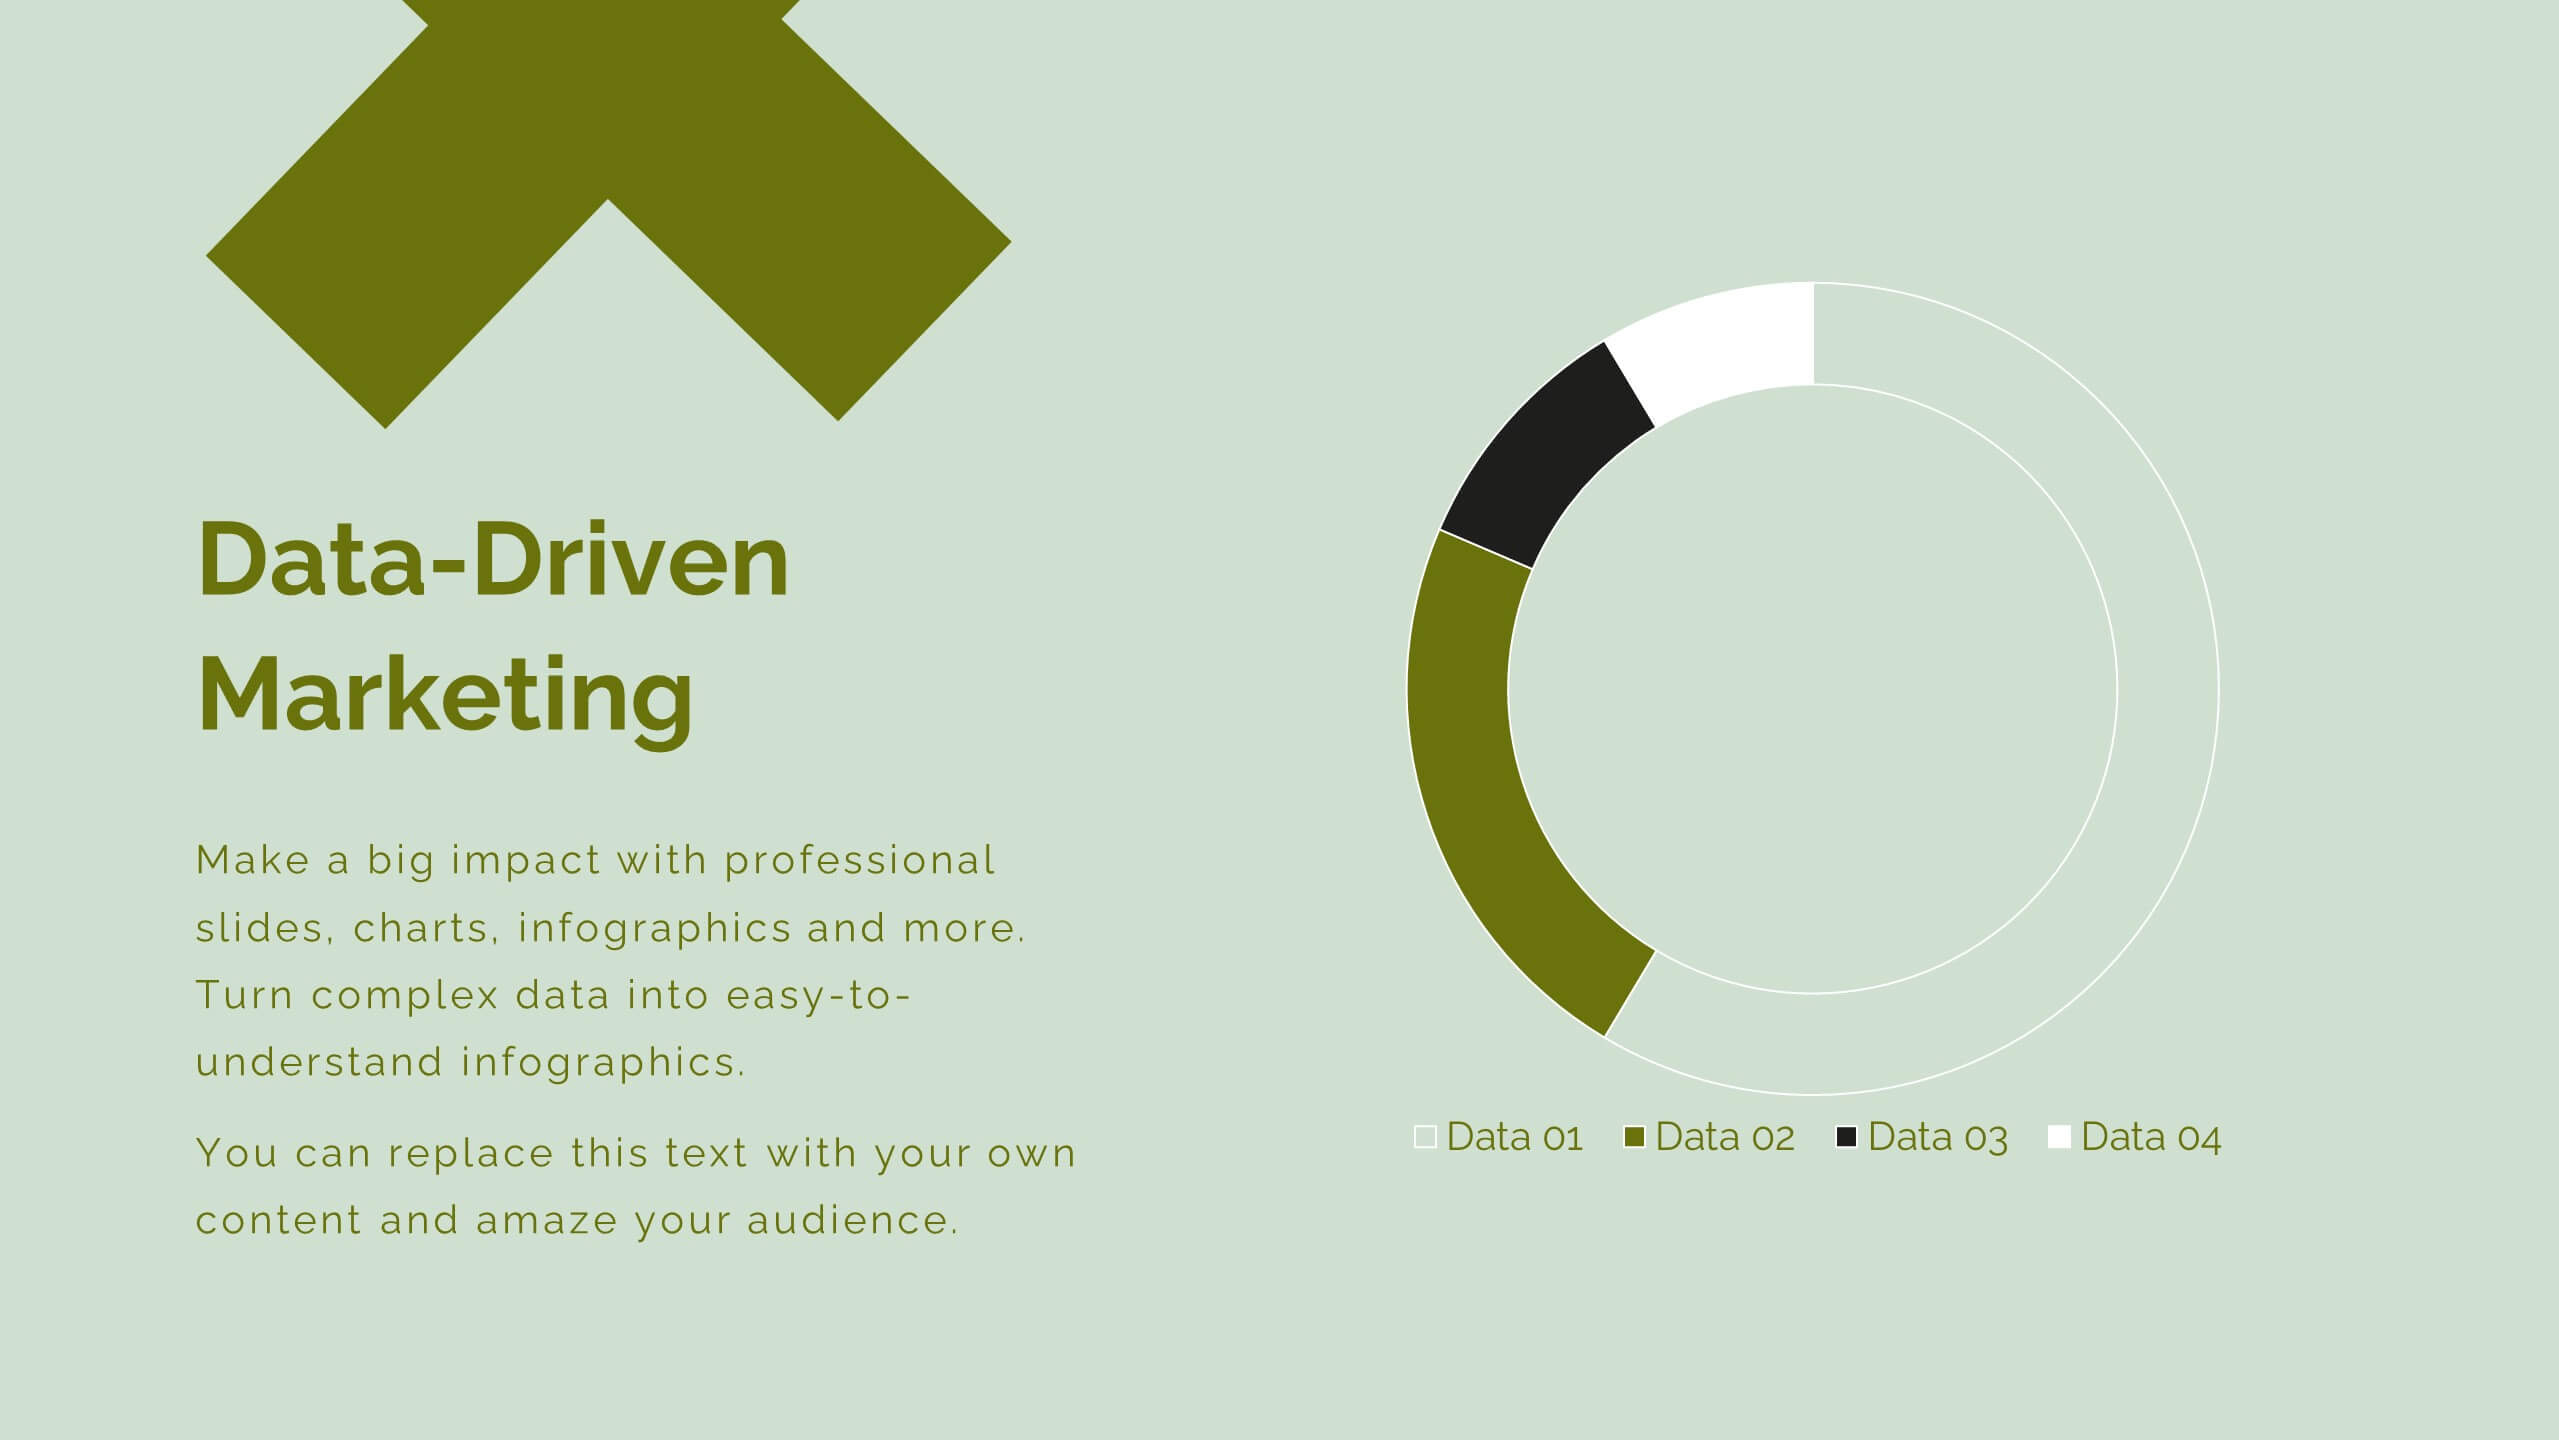
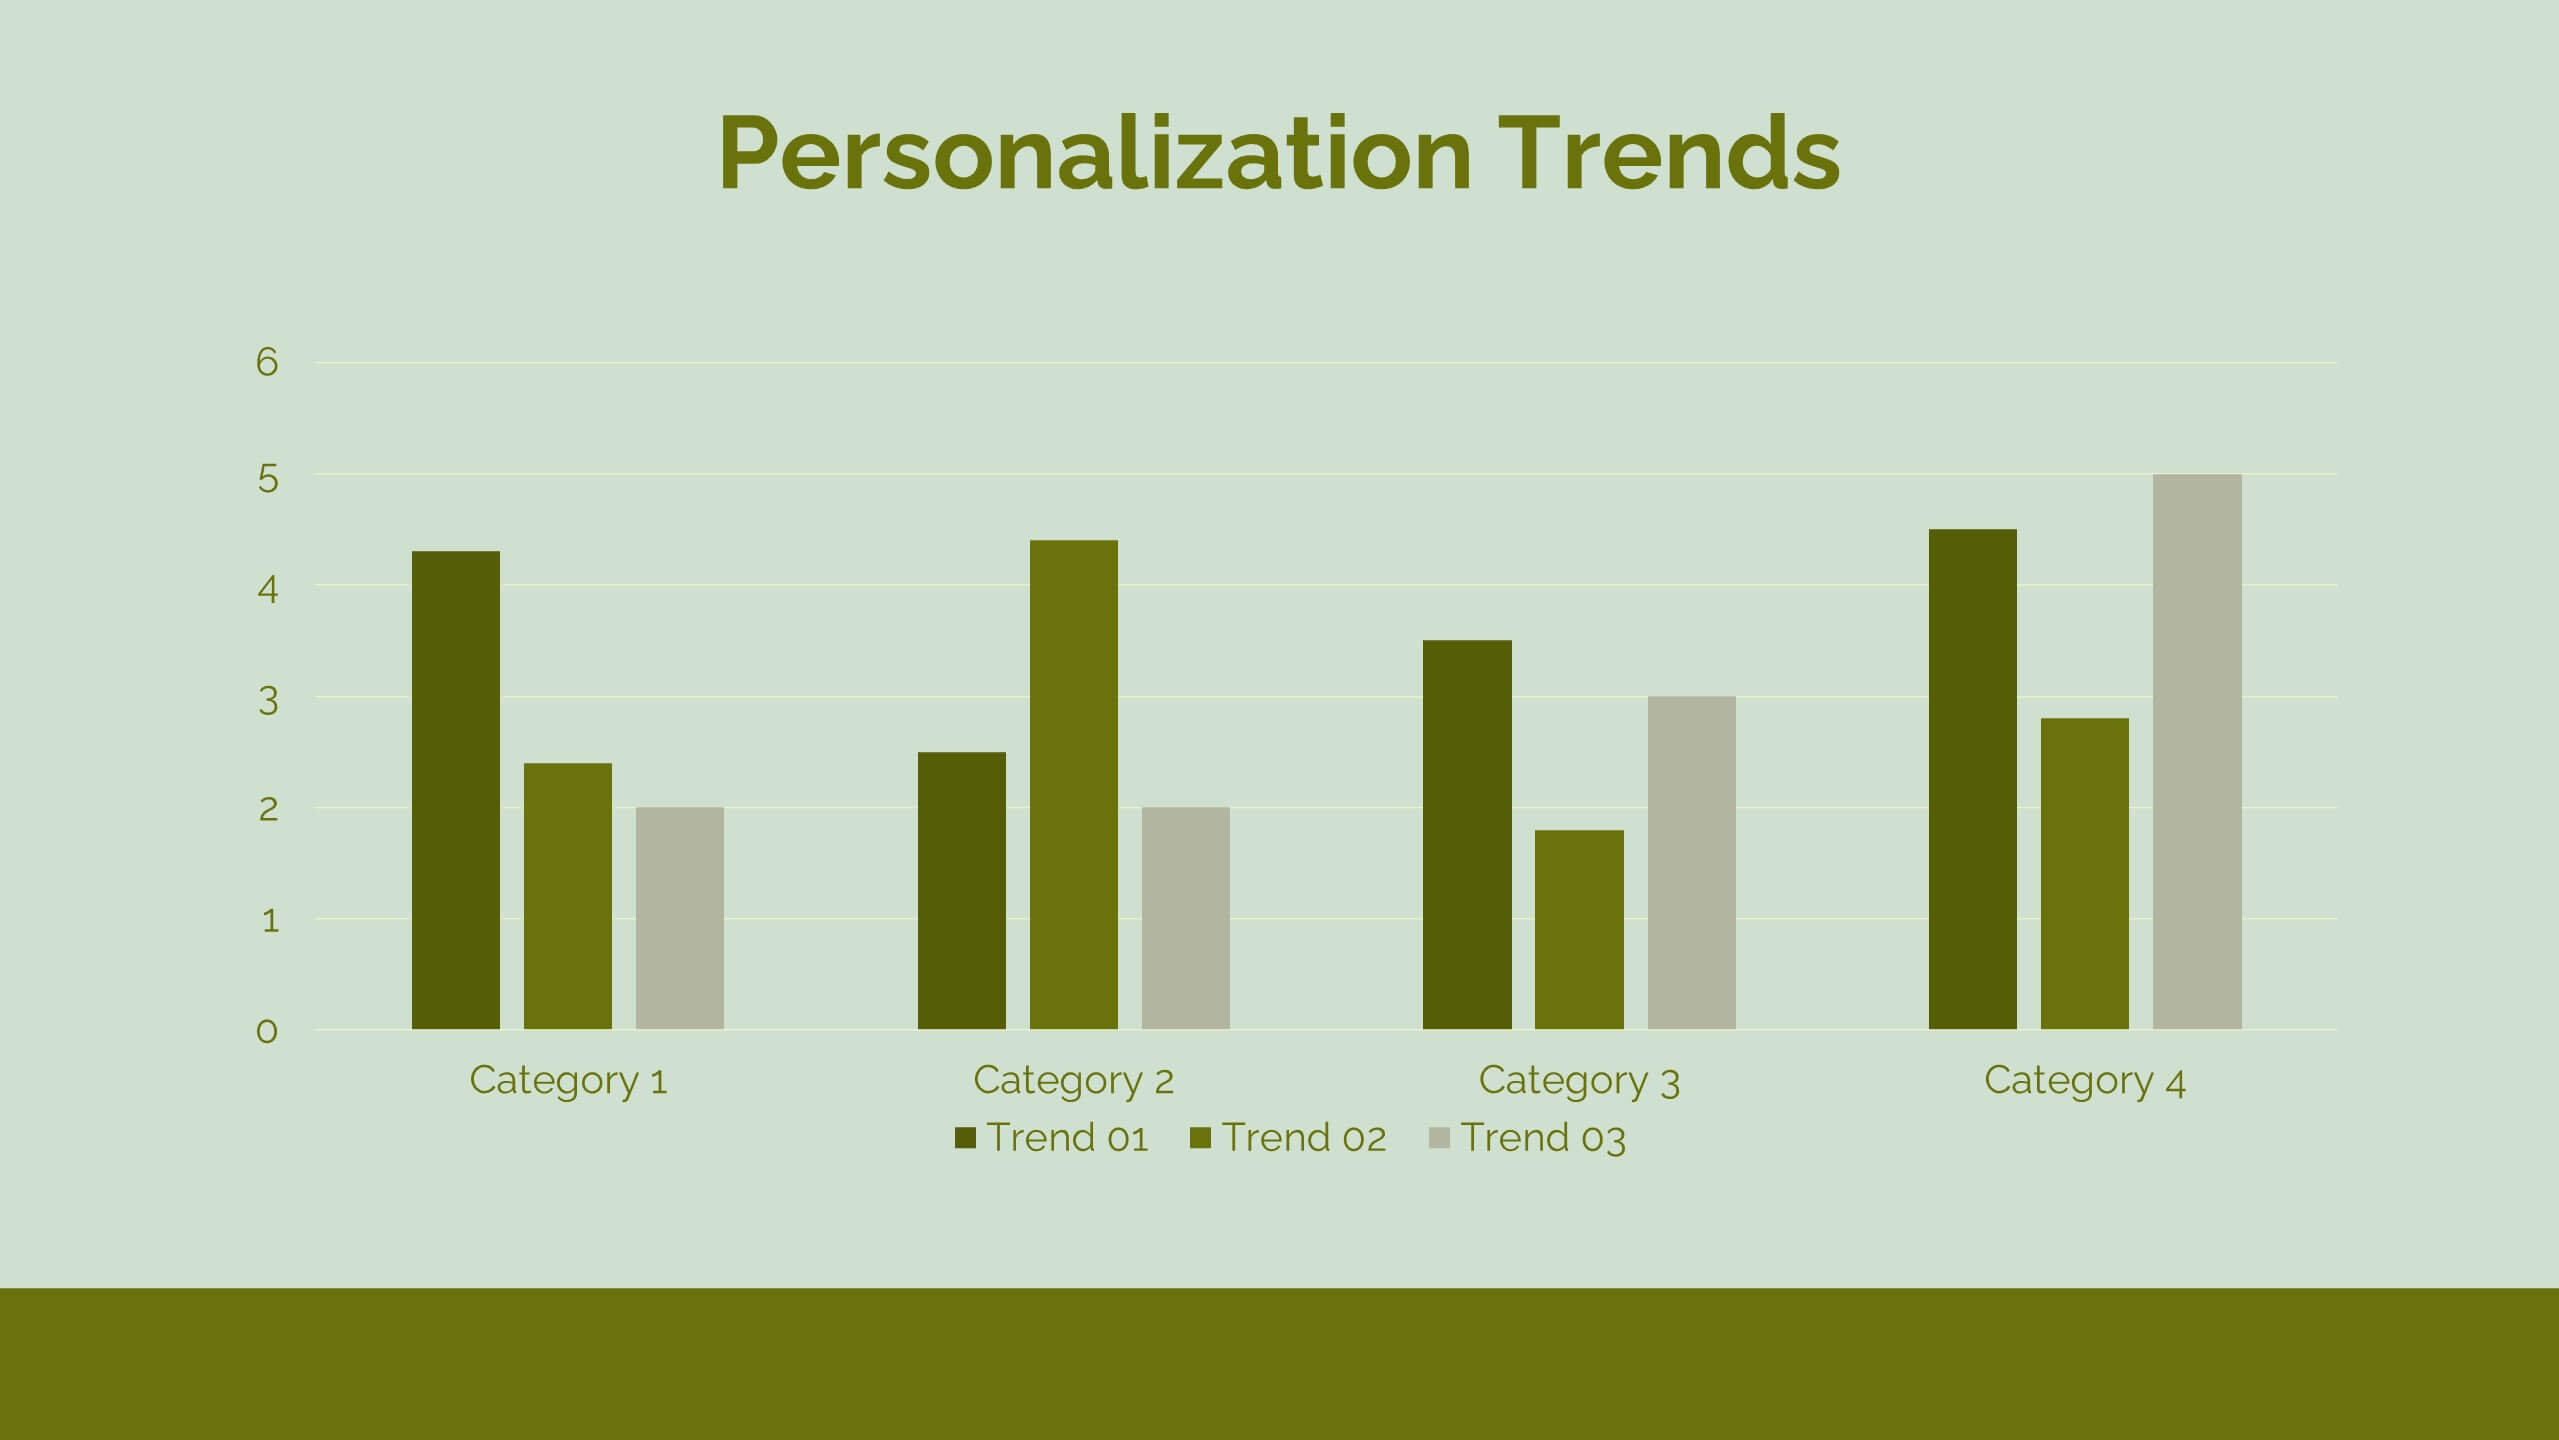
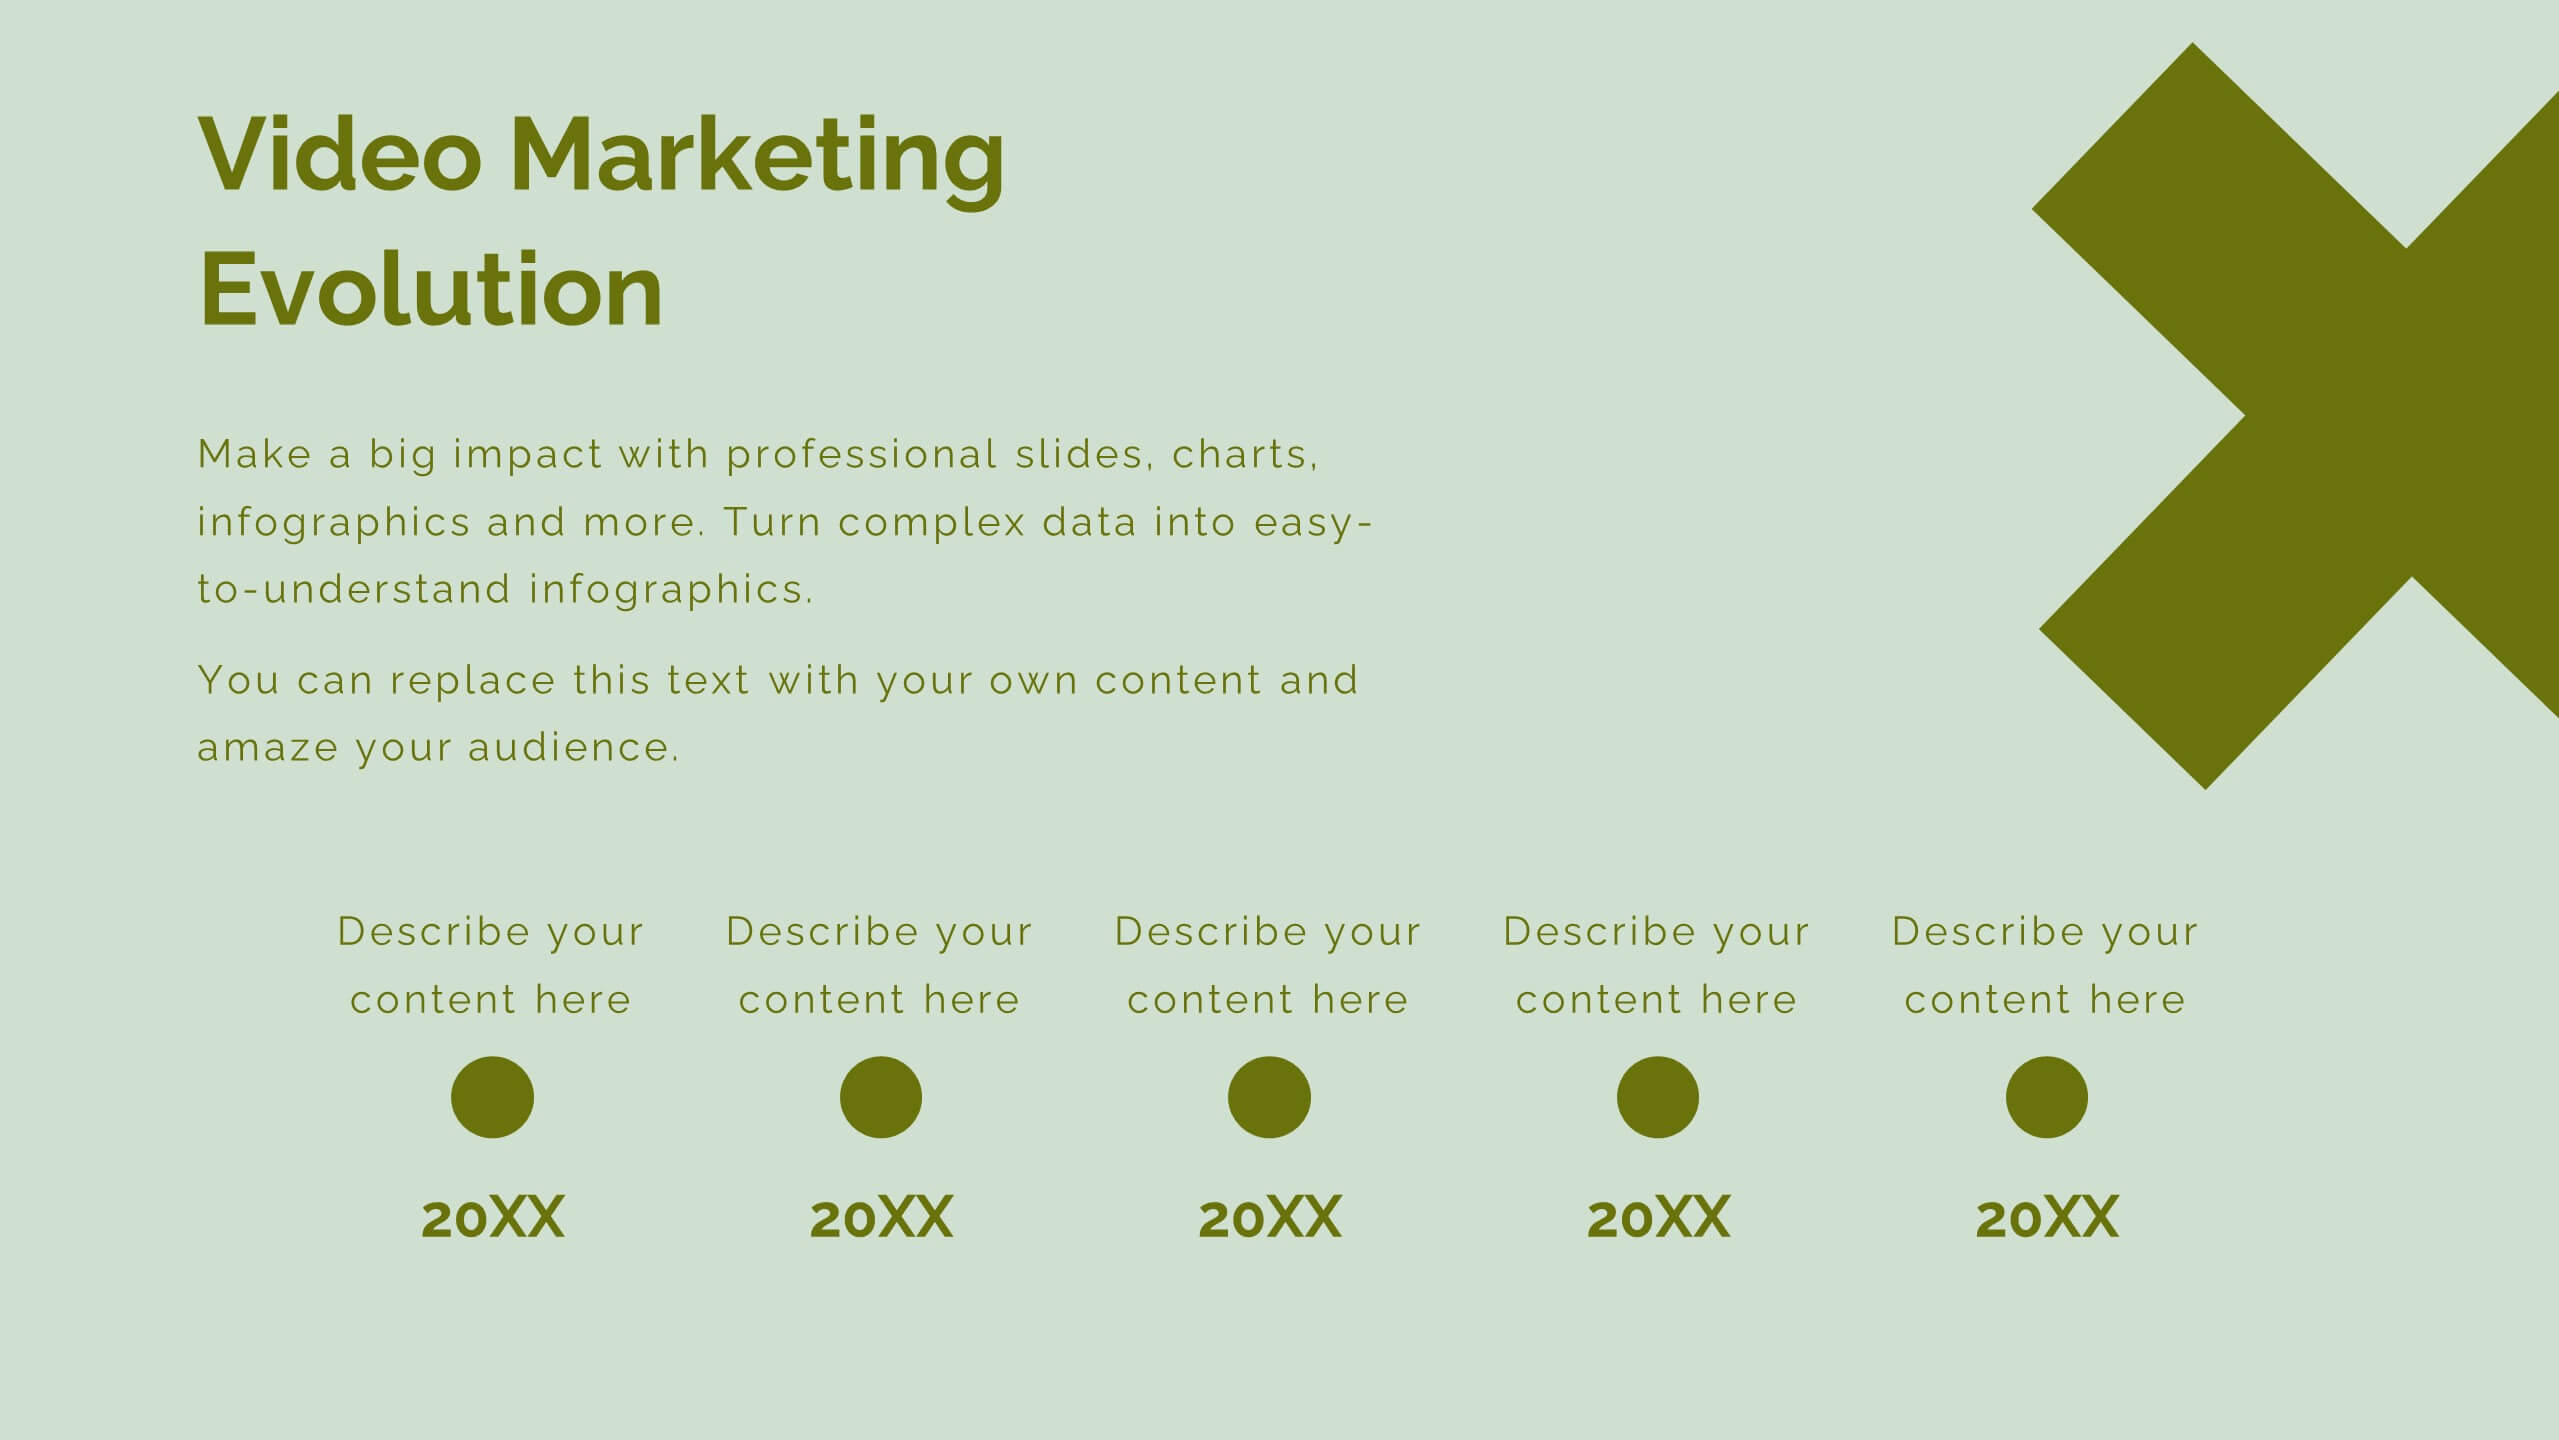
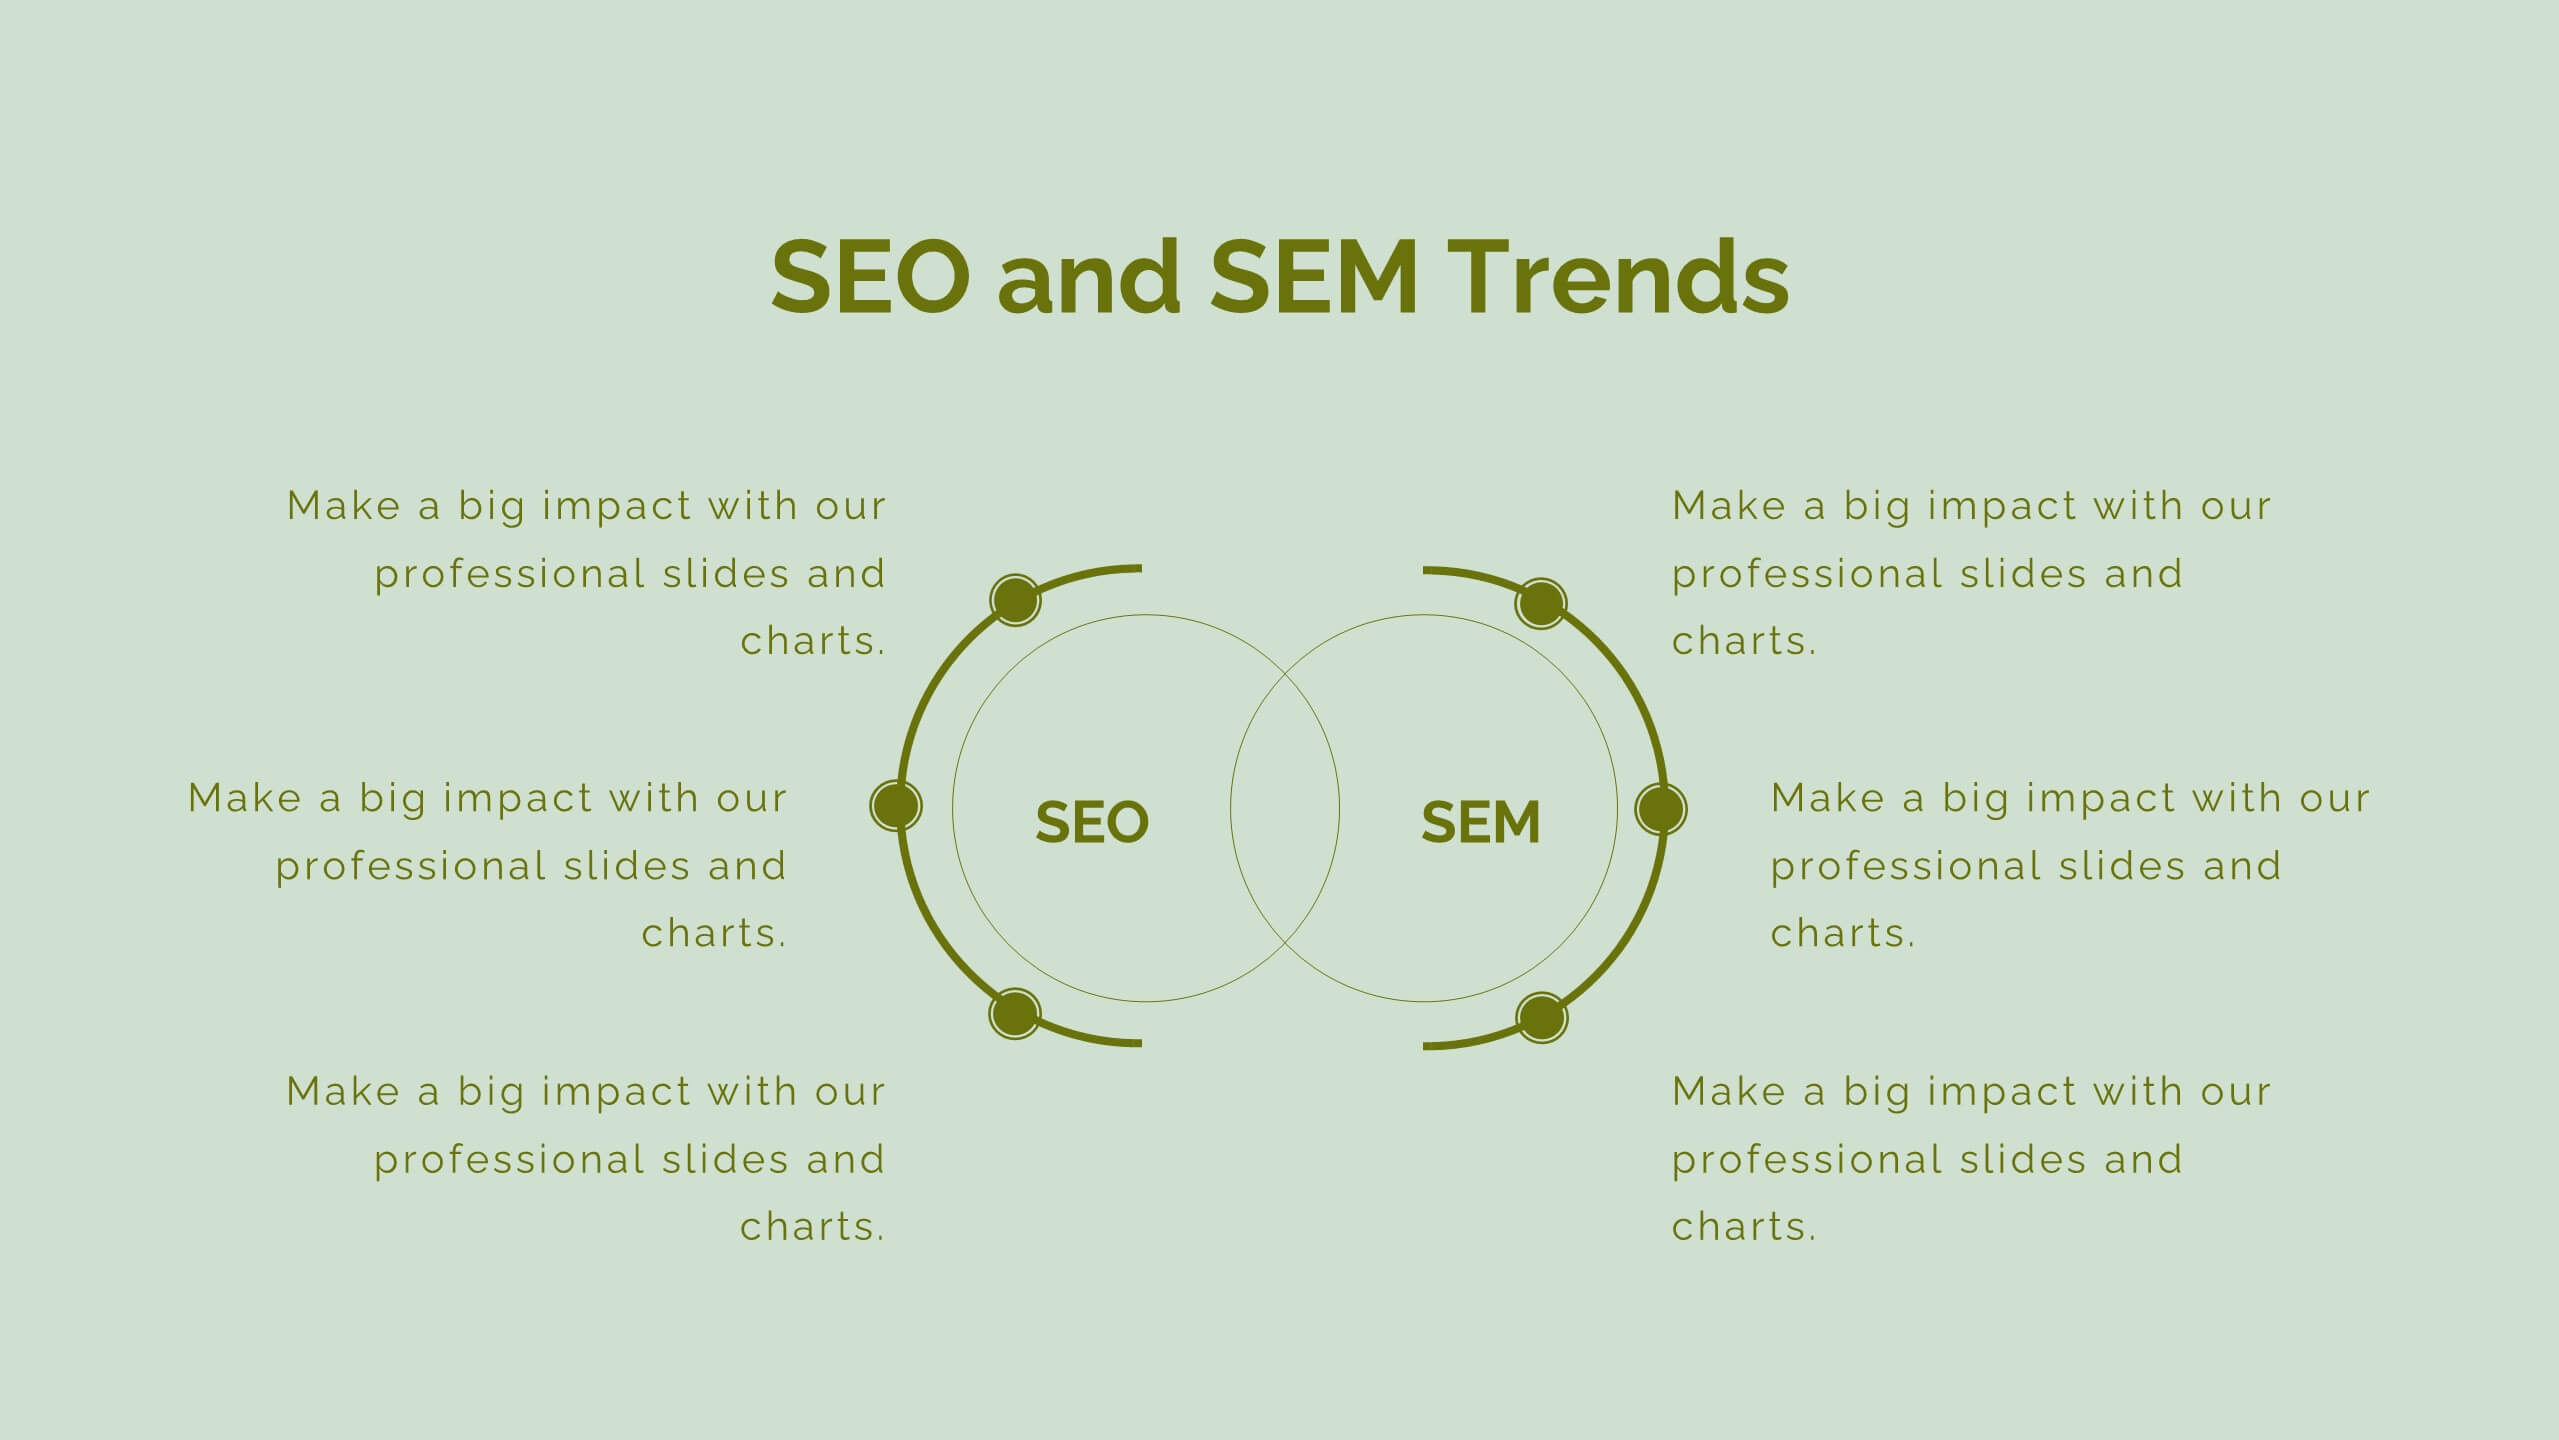
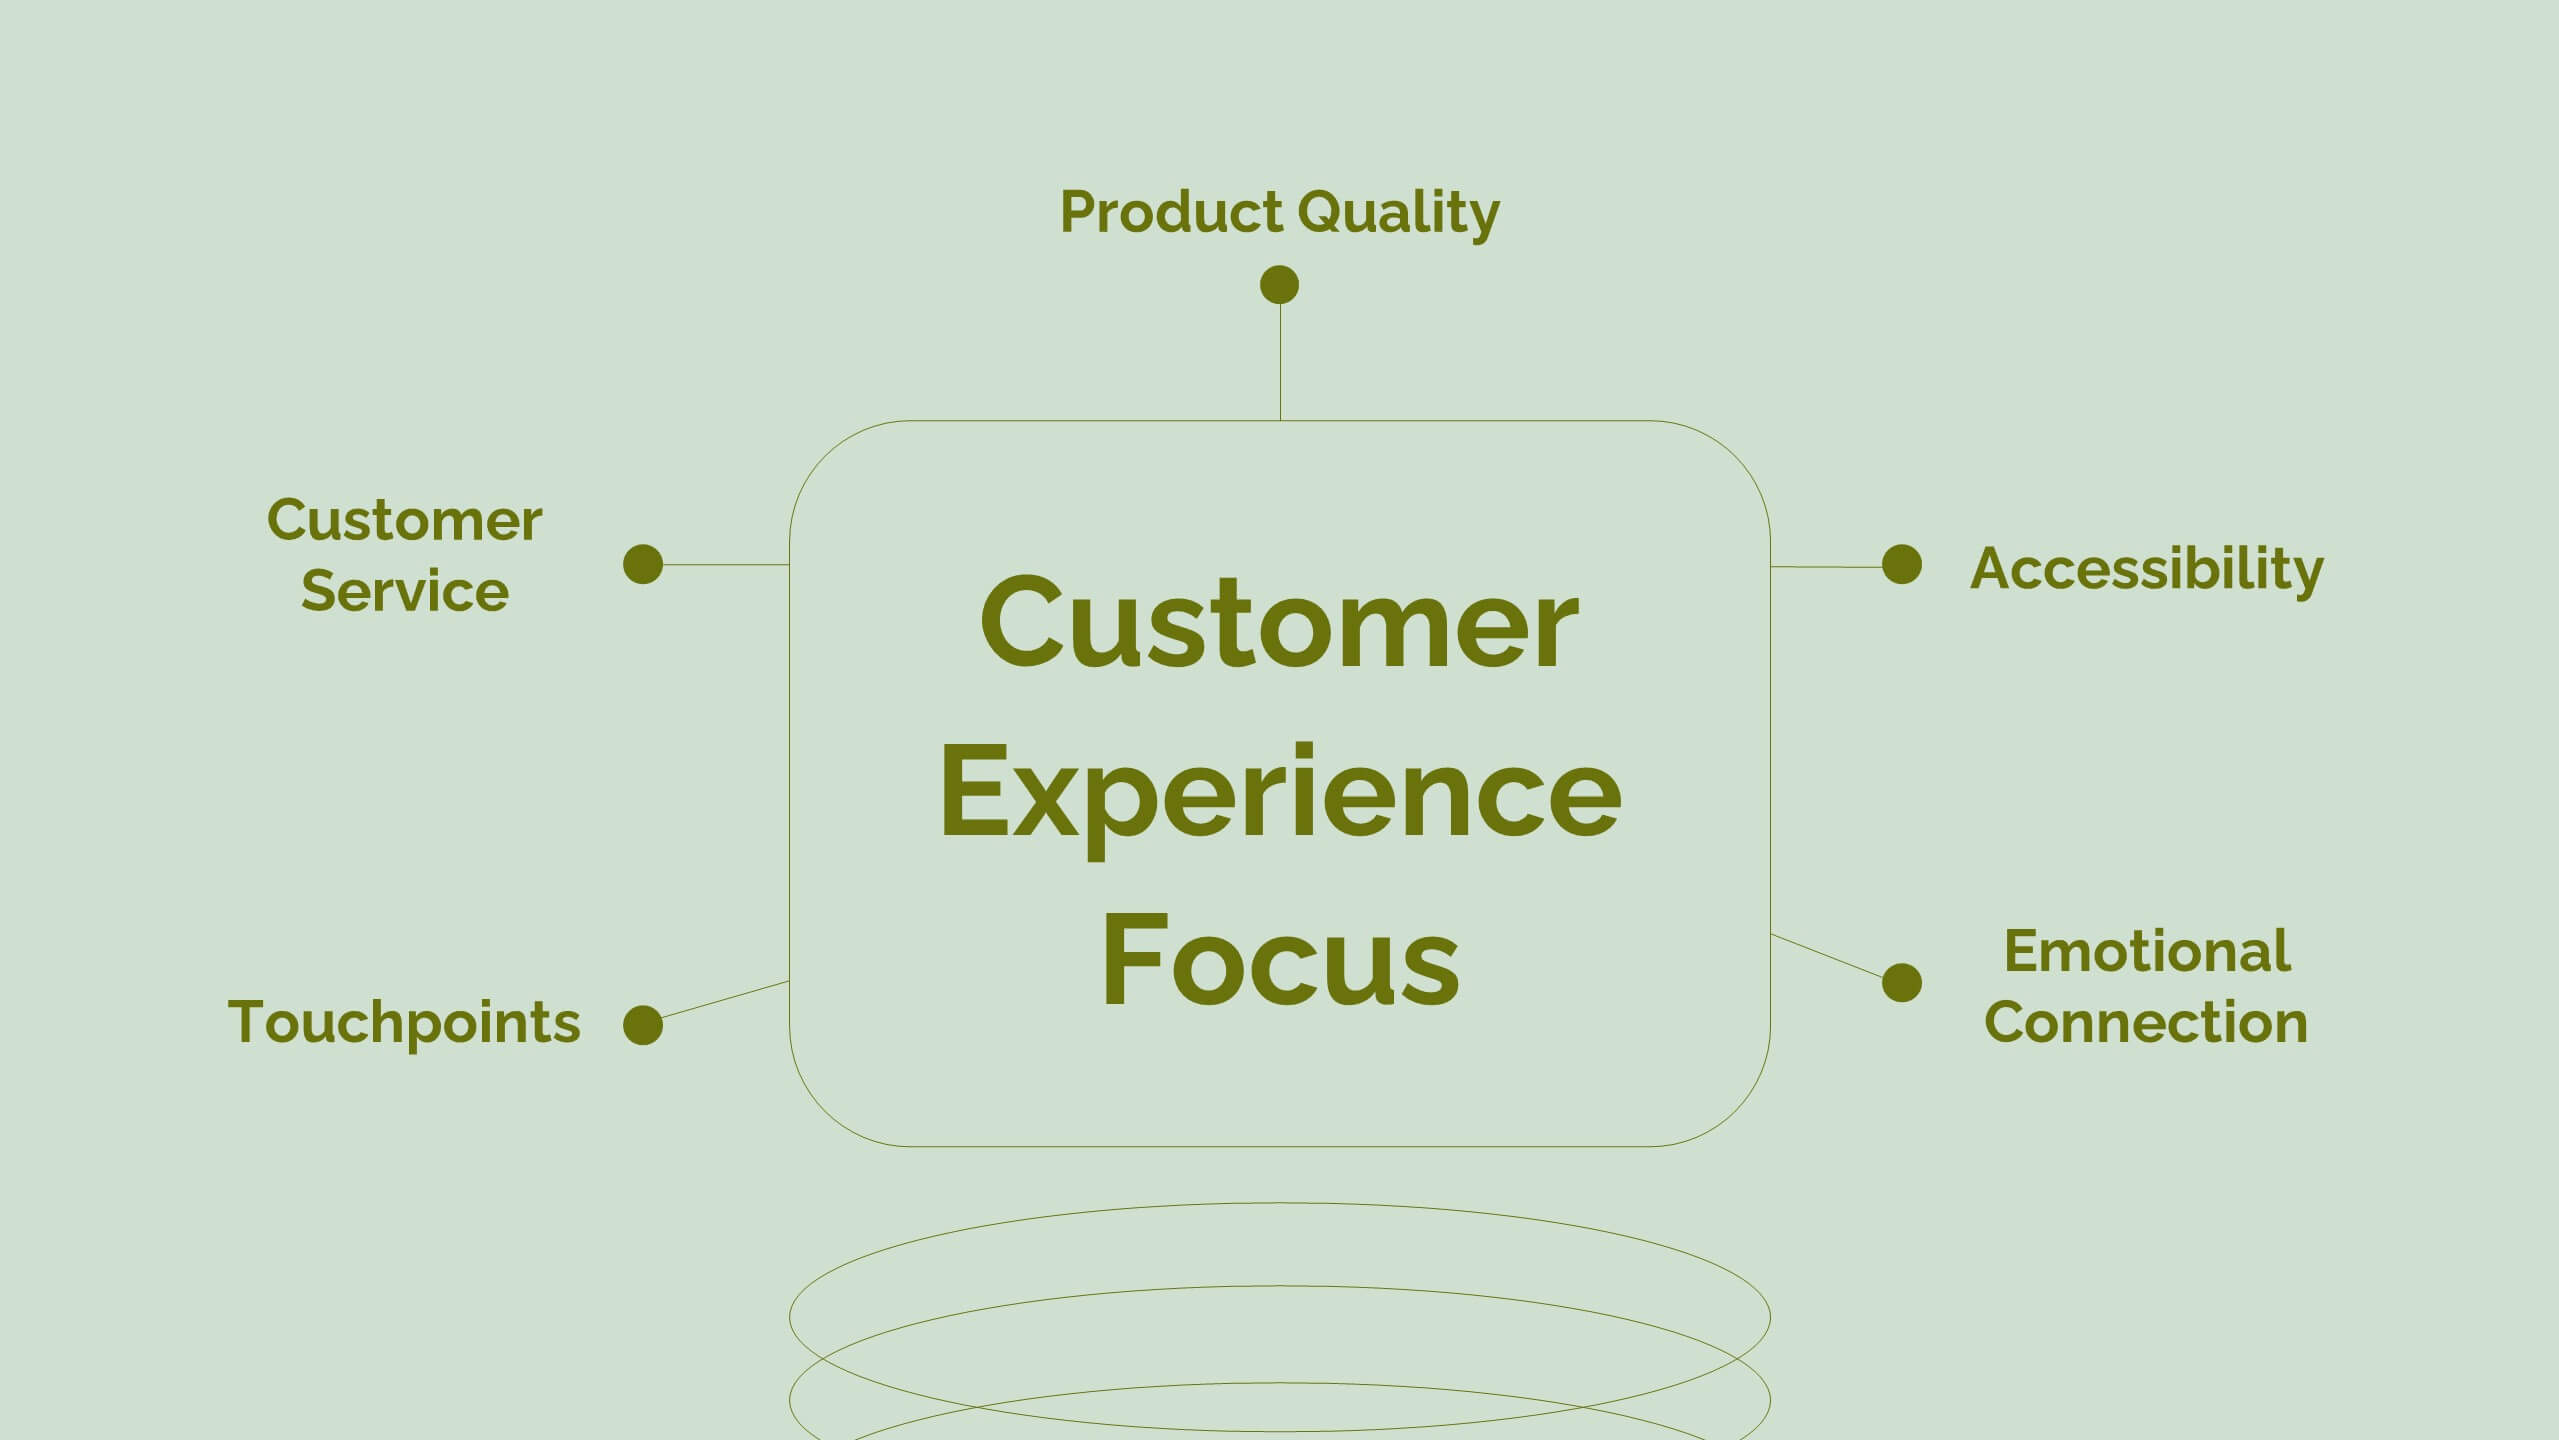
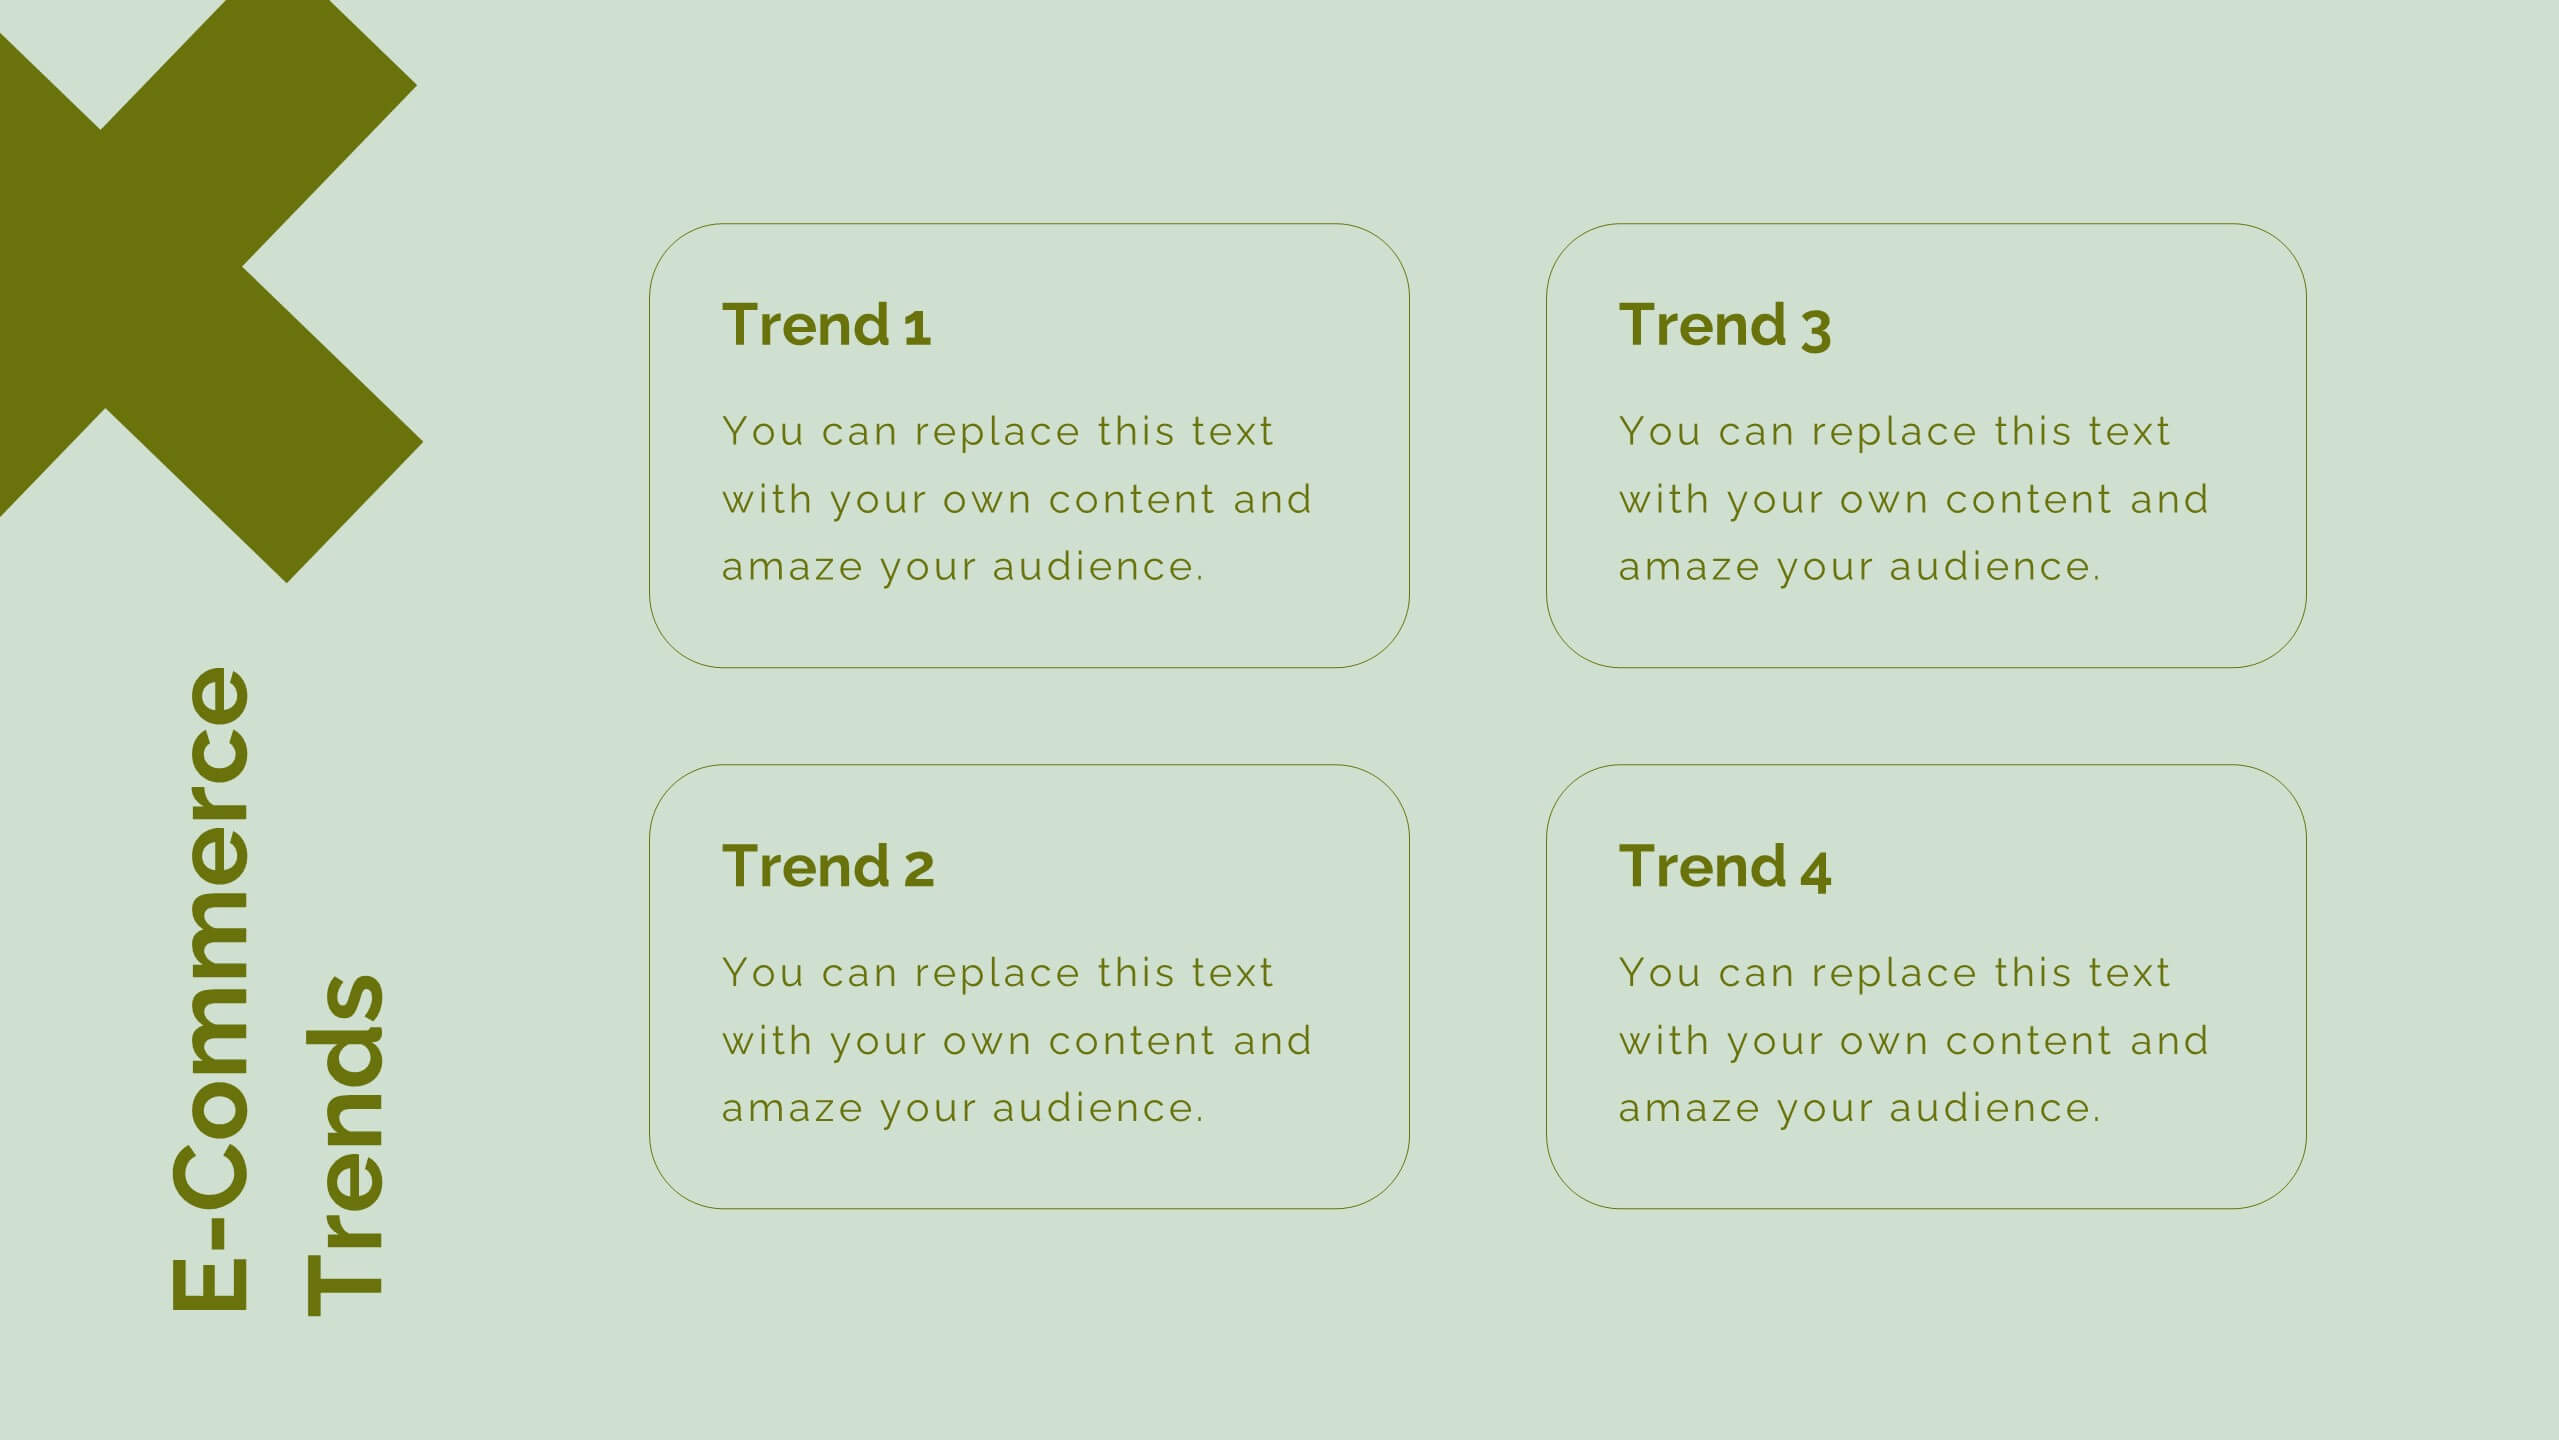
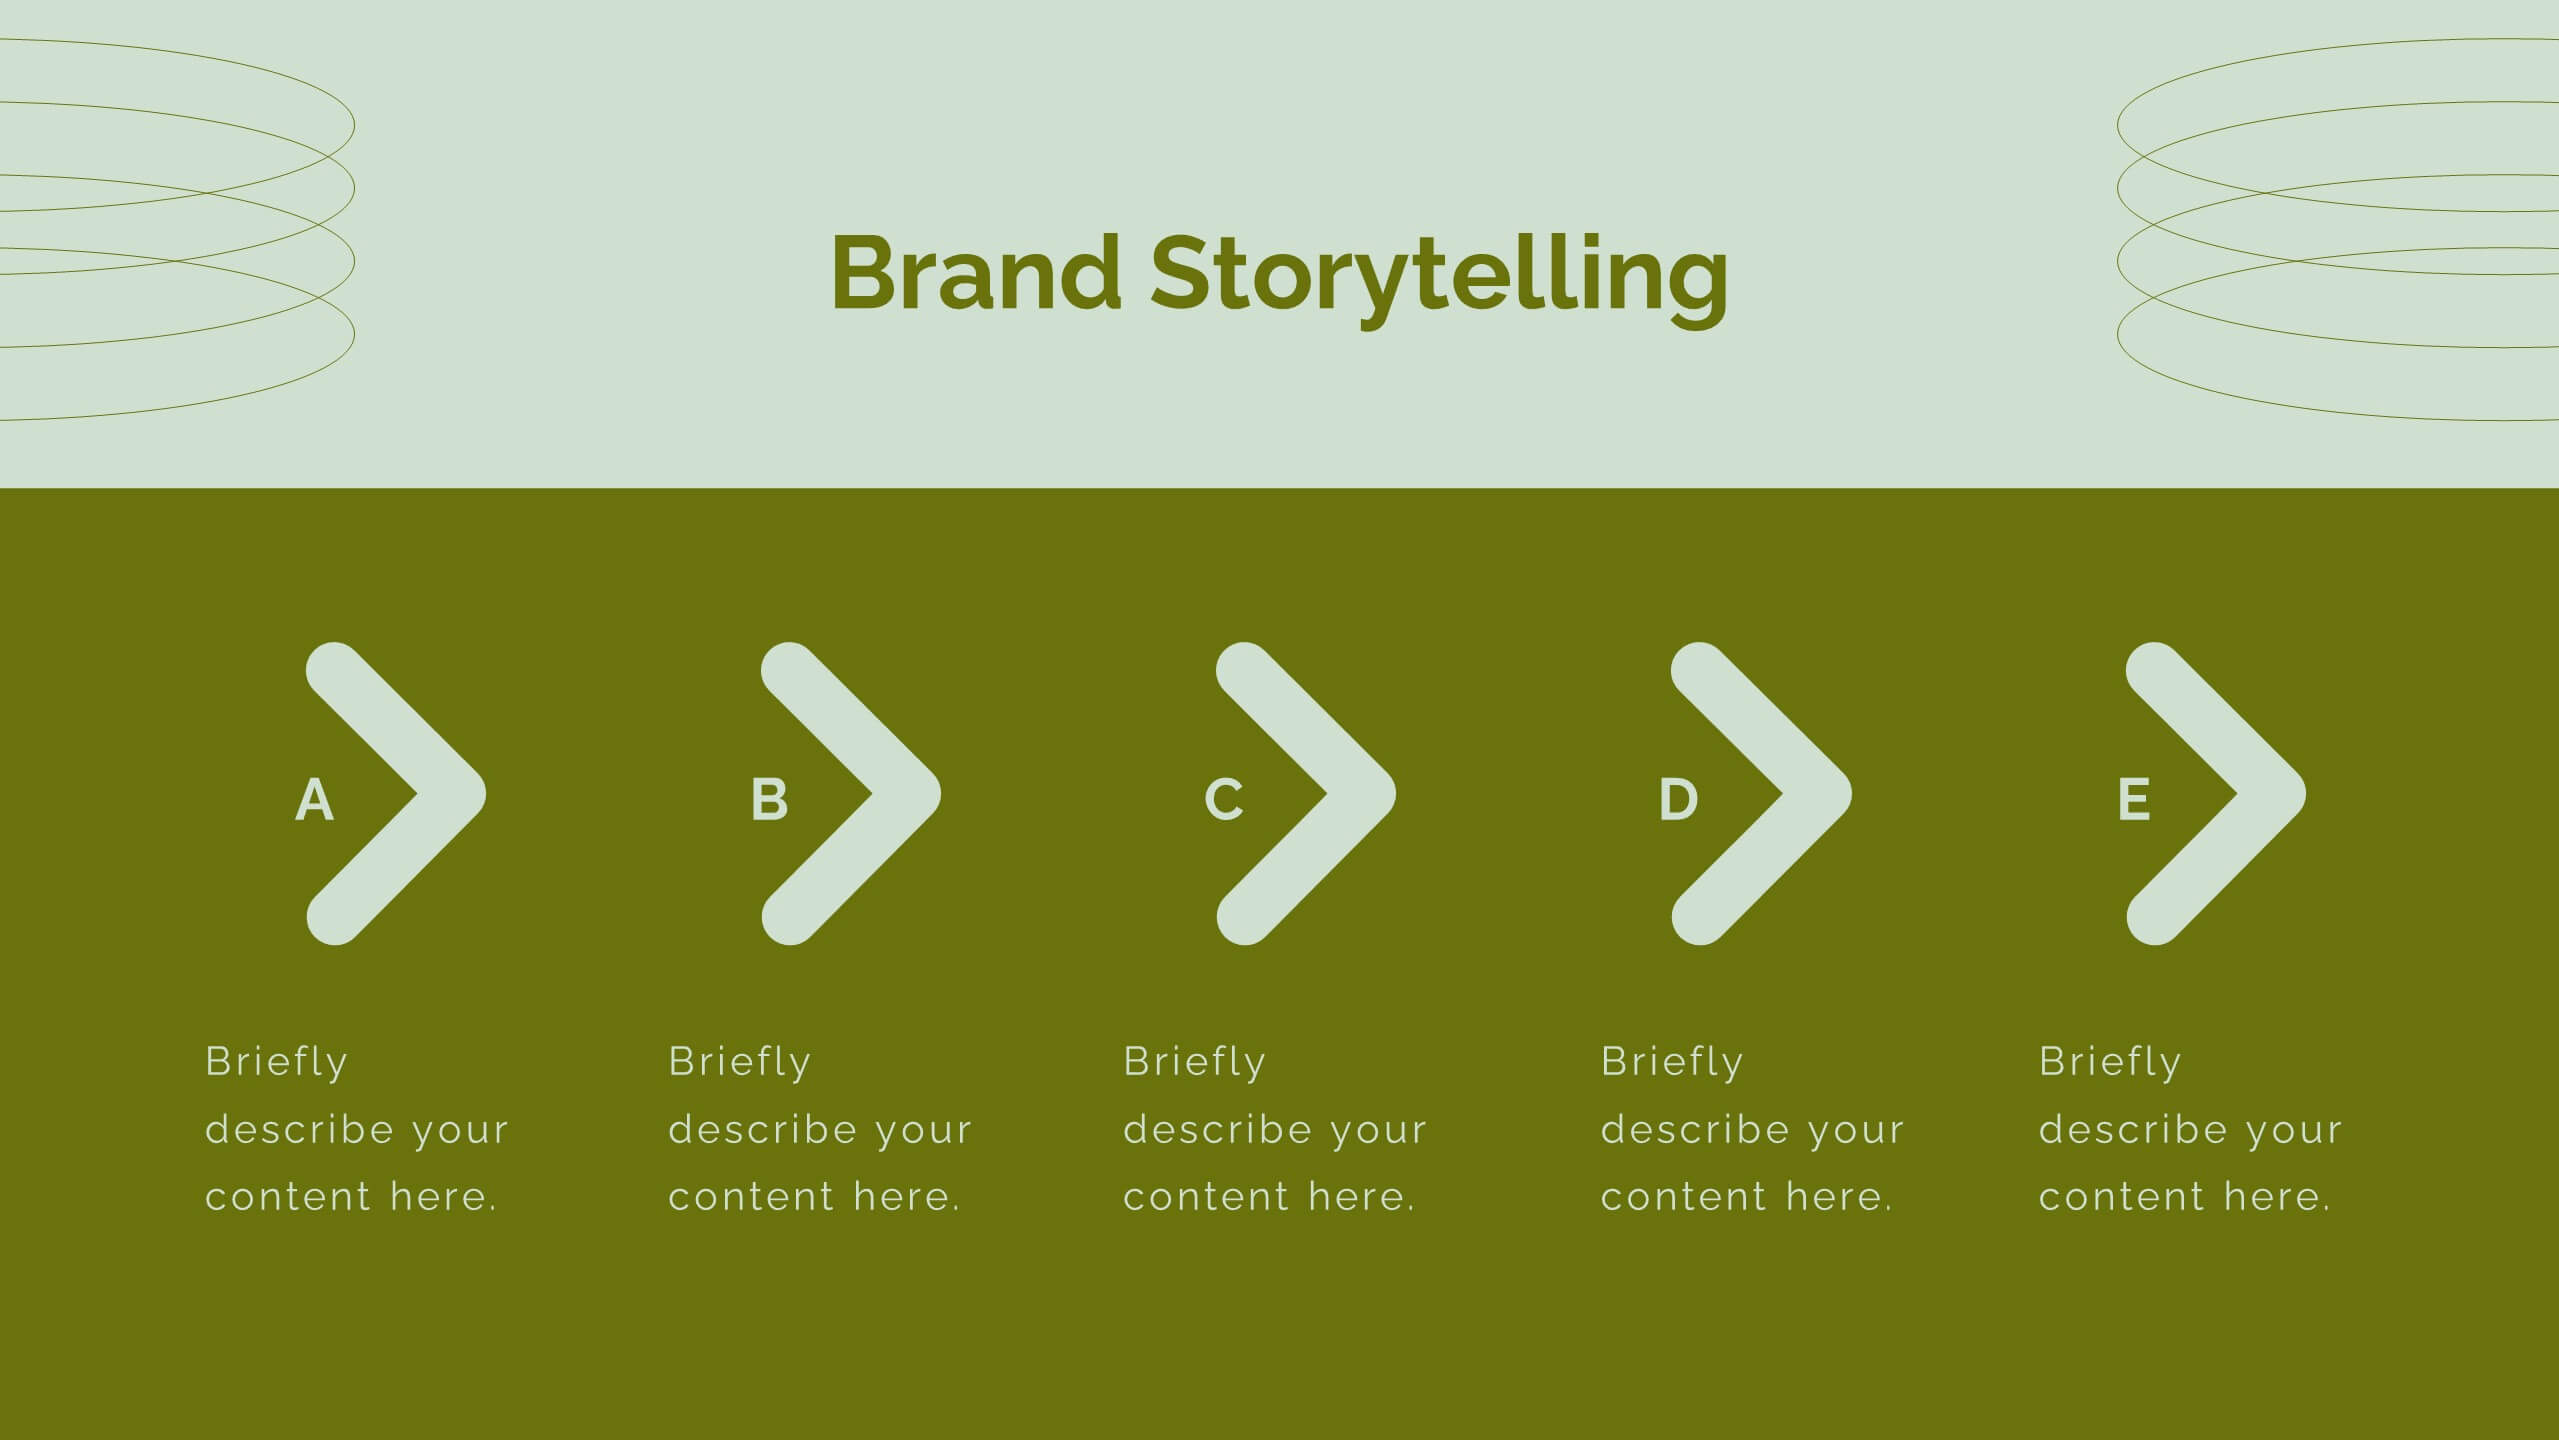
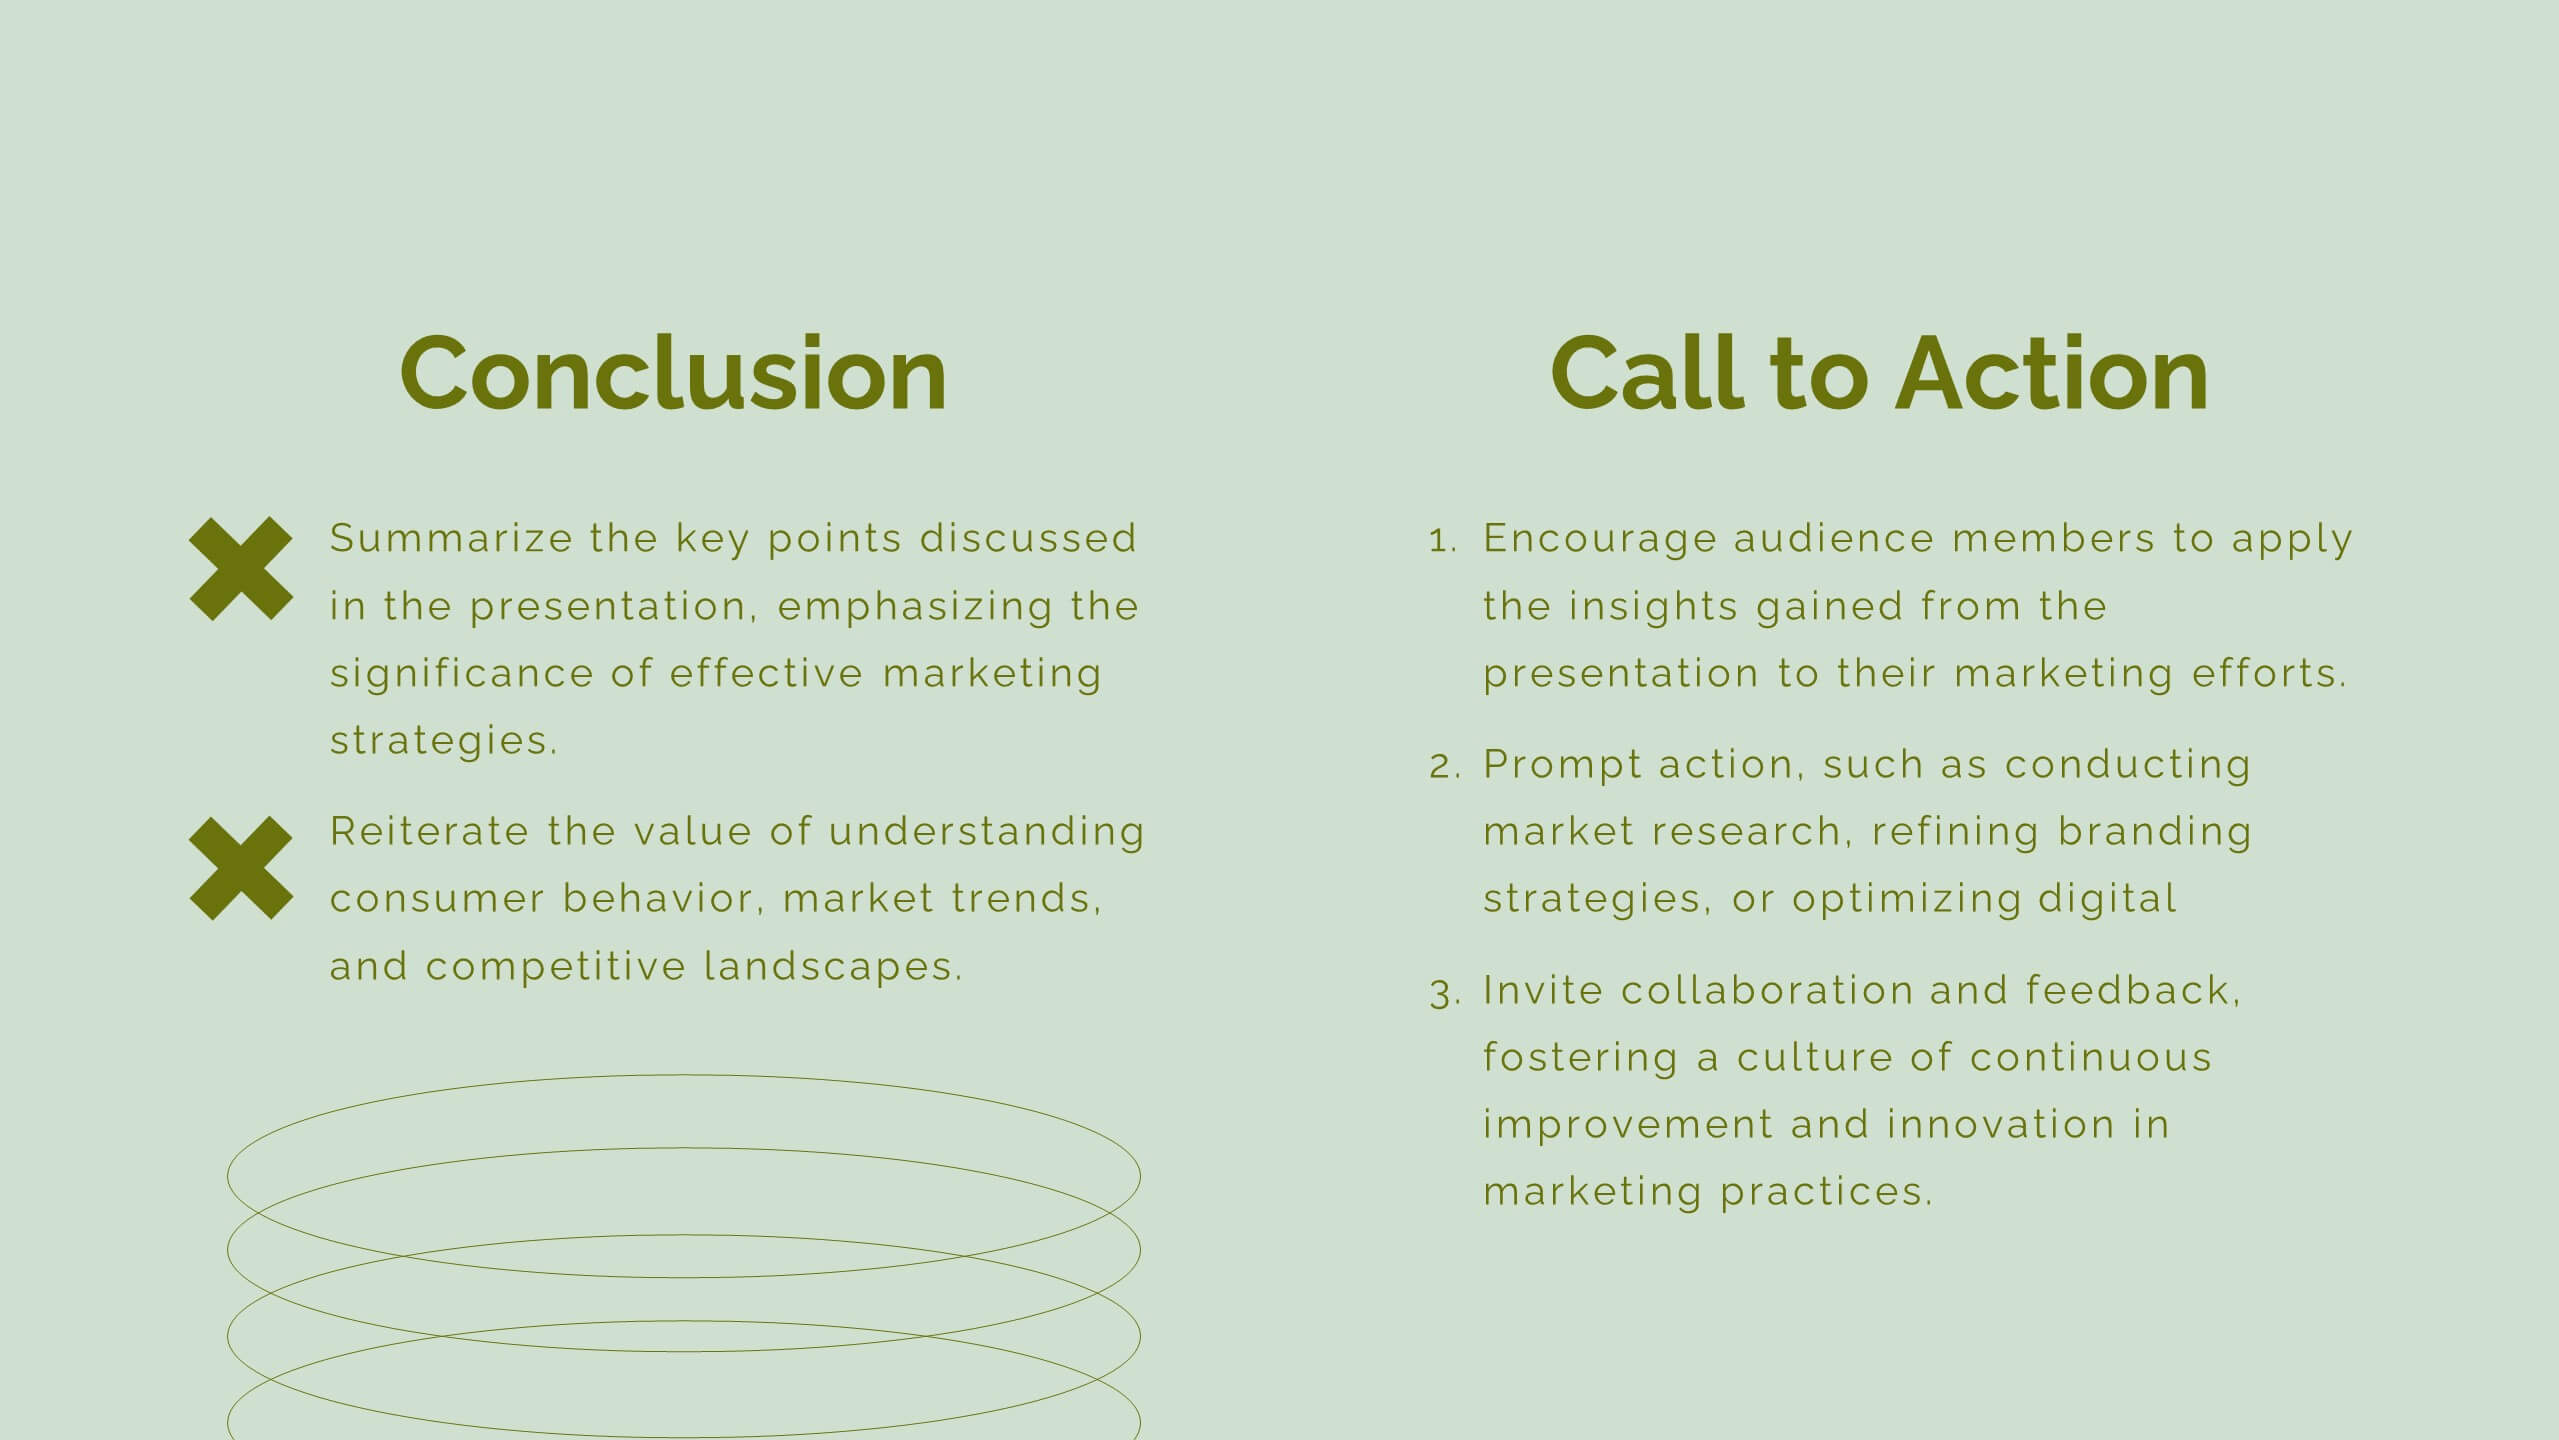
Aura Digital Marketing Strategy Plan Presentation
Revamp your digital marketing strategies with this dynamic template! Covering everything from industry overviews and consumer behavior analysis to emerging technologies and social media strategies, this template has it all. Perfect for creating compelling presentations that highlight data-driven marketing and brand storytelling. Compatible with PowerPoint, Keynote, and Google Slides.


5 diapositivas
A to Z Slide Concept Presentation
Bring your ideas to life with a bold, block-style visual that makes complex concepts feel simple and structured. This slide is perfect for breaking down processes, frameworks, or step-by-step explanations in a clear, memorable way. Fully editable and compatible with PowerPoint, Keynote, and Google Slides.


7 diapositivas
Enterprise Governance Infographics
A Governance Infographic provides information about the principles and practices of governance, particularly in the context of organizations or institutions. This governance template can be used to cover a wide range of topics related to governance, including organizational structures, decision-making processes, risk management, compliance, and ethical standards. You can use this to include information on the roles and responsibilities of different stakeholders, such as board members, executives, and employees, as well as the policies and procedures that govern their interactions.


8 diapositivas
Achievements and Goals Milestone
Illustrate your team's journey with this visually engaging milestone roadmap. Featuring a step-by-step block design with space for five key accomplishments, it's perfect for goal tracking, progress reviews, or roadmap presentations. Fully editable in PowerPoint, Keynote, and Google Slides.


7 diapositivas
Matrix Structure Diagram
A matrix diagram is a management planning tool that enables you to analyze and display the relationship between data sets. This is a visual way to display information that you can quickly and easily analyze. With this template, you can create awesome Matrix Diagrams that will help you group and analyze information in a clear and organized way. This template is the perfect tool If you want to impress your teacher or boss with Infographic presentations. Arrange your information in a way that makes sense to you. Get started by downloading and editing in Powerpoint, Keynote, or Google Slides.


7 diapositivas
Secondary Education Infographic
Secondary education, also known as high school education, plays a crucial role in a person's academic and personal development. This template is a useful tool for demonstrating the power of secondary education, as well as educational marketing strategies that offer students a range of tools to help them achieve success. This is ideal for infographics about career goals, student professional development, digital learning and more. Compatible with Powerpoint, keynote and google slides, you can create a powerful and engaging learning experience by presenting your data in a visually appealing way.


6 diapositivas
Africa Population Map Infographics
Discover the flexibility of our Africa Population Map infographic template, a dynamic tool for illustrating population distribution across the African continent. This template is compatible with widely used presentation software like PowerPoint, Keynote, and Google Slides, allowing you to effortlessly customize it according to your specific requirements. The Africa Population Map infographic template provides a solid foundation for visualizing population data, highlighting densely populated areas, urban centers, and demographic trends. Whether you're an educator, researcher, or simply curious about Africa's demographics, this template offers a user-friendly platform to create engaging presentations and informative materials. Impress your audience with this SEO-optimized Africa Population Map infographic template, thoughtfully designed for clarity and ease of use. Tailor it to showcase population variations, growth patterns, and regional insights, making it a valuable asset for your projects and presentations. Start crafting your personalized infographic today!


21 diapositivas
Solaris Business Operations Plan Presentation
Organize and streamline your operations with this comprehensive business operations plan presentation! It includes sections like objectives, session breakdowns, networking opportunities, and panel discussions, ensuring a clear and actionable framework. Perfect for conferences, team workshops, or strategic meetings, this template works seamlessly with PowerPoint, Keynote, and Google Slides.


8 diapositivas
Geographic South America Template Presentation
Explore your data through a clean, professional map that highlights key insights and regional details across South America. Ideal for presenting demographics, business distribution, or performance metrics, this design combines clarity with impact. Fully compatible with PowerPoint, Keynote, and Google Slides for easy editing and seamless presentation.


5 diapositivas
Strategic Framework Slide Presentation
Turn your strategy into a story that flows with clarity and precision using this clean, timeline-based presentation design. Ideal for illustrating project phases, corporate planning, or growth roadmaps, it keeps information structured and engaging. Fully editable and compatible with PowerPoint, Keynote, and Google Slides for seamless customization.


12 diapositivas
Employee Feedback Smile Score Presentation
Track employee sentiment with this engaging employee feedback smile score template! Featuring a visually intuitive gauge design, this layout helps HR teams and managers assess workplace satisfaction and identify areas for improvement. Ideal for performance reviews, team surveys, and organizational assessments. Fully customizable and compatible with PowerPoint, Keynote, and Google Slides.


7 diapositivas
SWOT Analysis Marketing Infographic Presentation
SWOT Analysis is a simple, but powerful strategic planning method. It helps identify your company’s strengths, weaknesses, opportunities and threats as you plan a course for the future. This template includes everything you need for your next project, including data and insight about your business. This template comes with 7 slides. It includes a title for each infographic and allows you to build your swot charts, add icons and convert the text into bullet points. You have complete control over all elements within each slide and can easily add, delete or modify content at any time!


7 diapositivas
Value Chain Infographic Presentation Template
The five primary activities of the value chain are: inbound logistics, operations, outbound logistics, marketing and sales, service. It is made up of four secondary activities: firm infrastructure, human resource management, technology development and procurement. The value chain is a tool for evaluating how a business operates. With this value chain template, you'll be able to identify various links in the value chain, and determine where an opportunity for product differentiation exists. This template helps lay out your actual value chain and identify where opportunities exist to improve.


5 diapositivas
Space Race Infographics
The Space Race refers to the competition between the United States and the Soviet Union during the Cold War era to achieve milestones in space exploration and technology. These vertical infographics are informative resources that explore the historic space race. They are designed to present key facts, milestones, and achievements of this significant period in space exploration history. The template features a captivating design with space-themed visuals, cosmic colors, and modern typography. The visuals are carefully selected to depict iconic spacecraft, astronauts, celestial bodies, and other relevant elements, creating an immersive infographic experience.


25 diapositivas
The Power of HIIT Presentation
Supercharge your fitness routine with this high-energy presentation on the power of HIIT. Covering key benefits like fat burning, muscle endurance, metabolism boost, and time-efficient workouts, this template helps break down the science behind high-intensity interval training. Fully customizable and compatible with PowerPoint, Keynote, and Google Slides for a seamless presentation experience.


5 diapositivas
IT Support and Systems Presentation
Streamline your tech communication with a clean, structured layout that highlights your IT services, support processes, and system workflows. Perfect for teams presenting solutions, infrastructure overviews, or technical strategies, this presentation brings clarity to complex topics. Fully compatible with PowerPoint, Keynote, and Google Slides for effortless editing and delivery.


10 diapositivas
Sustainability Management Metrics Framework
Showcase your environmental KPIs with the Sustainability Management Metrics Framework Presentation. This tree-inspired visual design is perfect for highlighting four key metrics across sustainability, compliance, or ESG reporting. Fully editable in PowerPoint, Keynote, or Google Slides, it’s ideal for eco-conscious business reviews, annual reports, or internal strategy updates.