


Características


¿Tienes alguna pregunta?
Recomendar


5 diapositivas
Supply Chain Management Infographics
Navigate the intricacies of logistics with our supply chain management infographics. This template, designed in a spectrum of strategic blues, combines a vertical, informative, and creative style, making complex data accessible. Is ideal for business analysts, and students who seek to visually convey the nuances of supply chain. The design incorporates detailed graphics and descriptive icons, all curated to facilitate a clearer understanding of supply chain. This infographic is the key to unlocking streamlined communication and enhanced comprehension of multifaceted logistical operations within corporate presentations, academic materials, or professional seminars.


6 diapositivas
Patient Care & Treatment Presentation
Highlight the pillars of patient care with this modern, block-style layout. Each icon-embedded cube represents a different treatment or healthcare process, perfect for outlining procedures, services, or stages of medical support. Fully editable in PowerPoint, Keynote, and Google Slides—customize colors, icons, and labels with ease to suit your medical presentation needs.


23 diapositivas
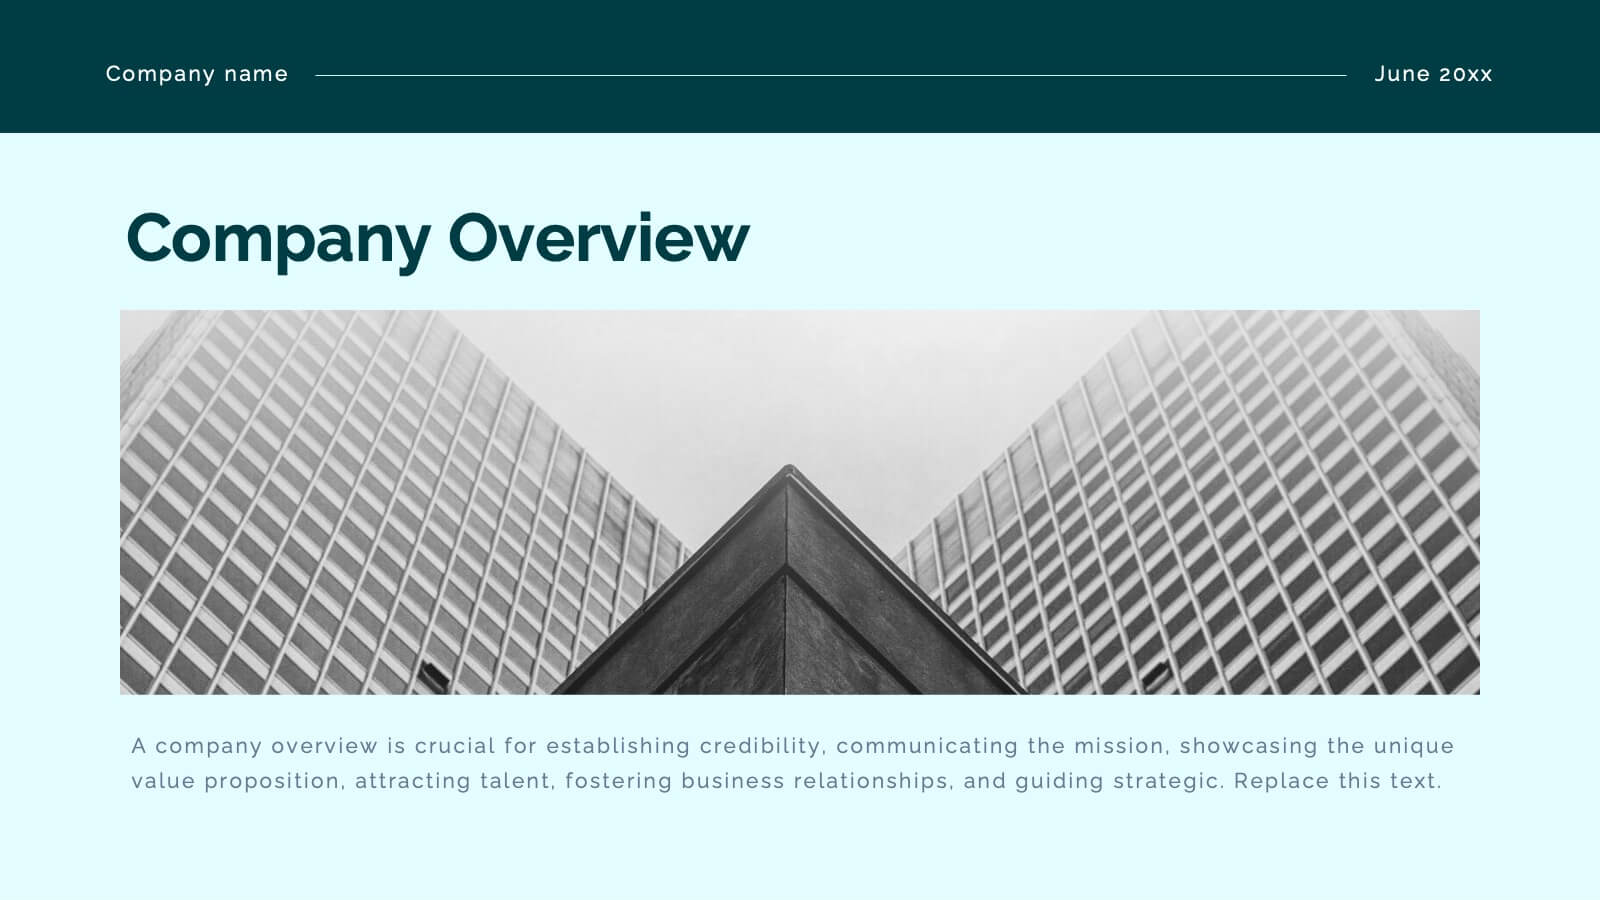
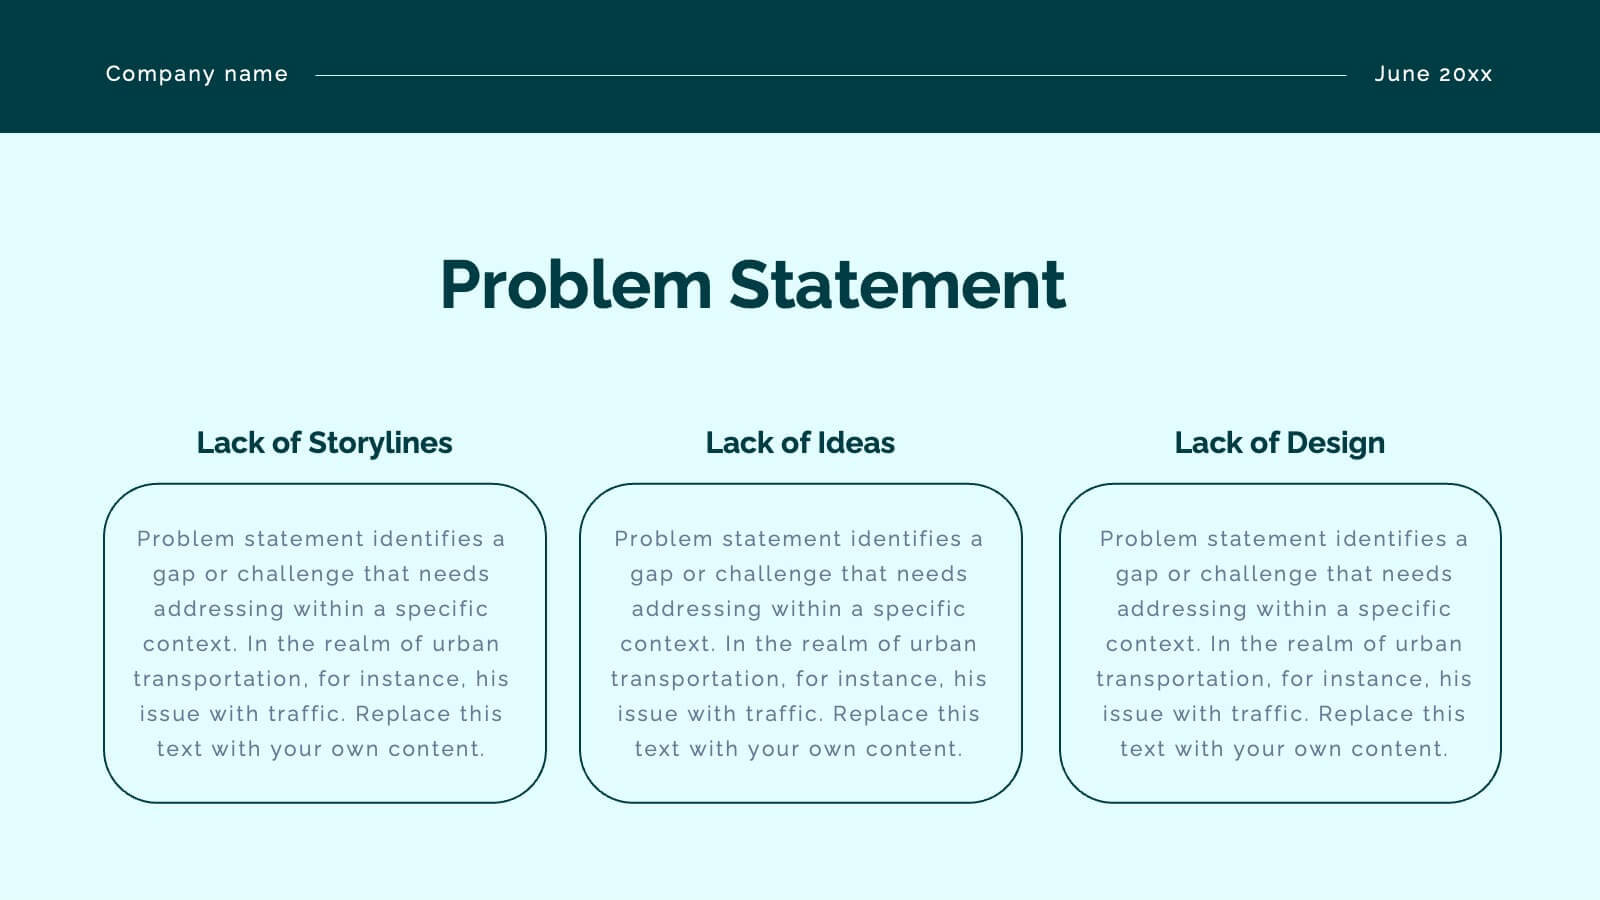
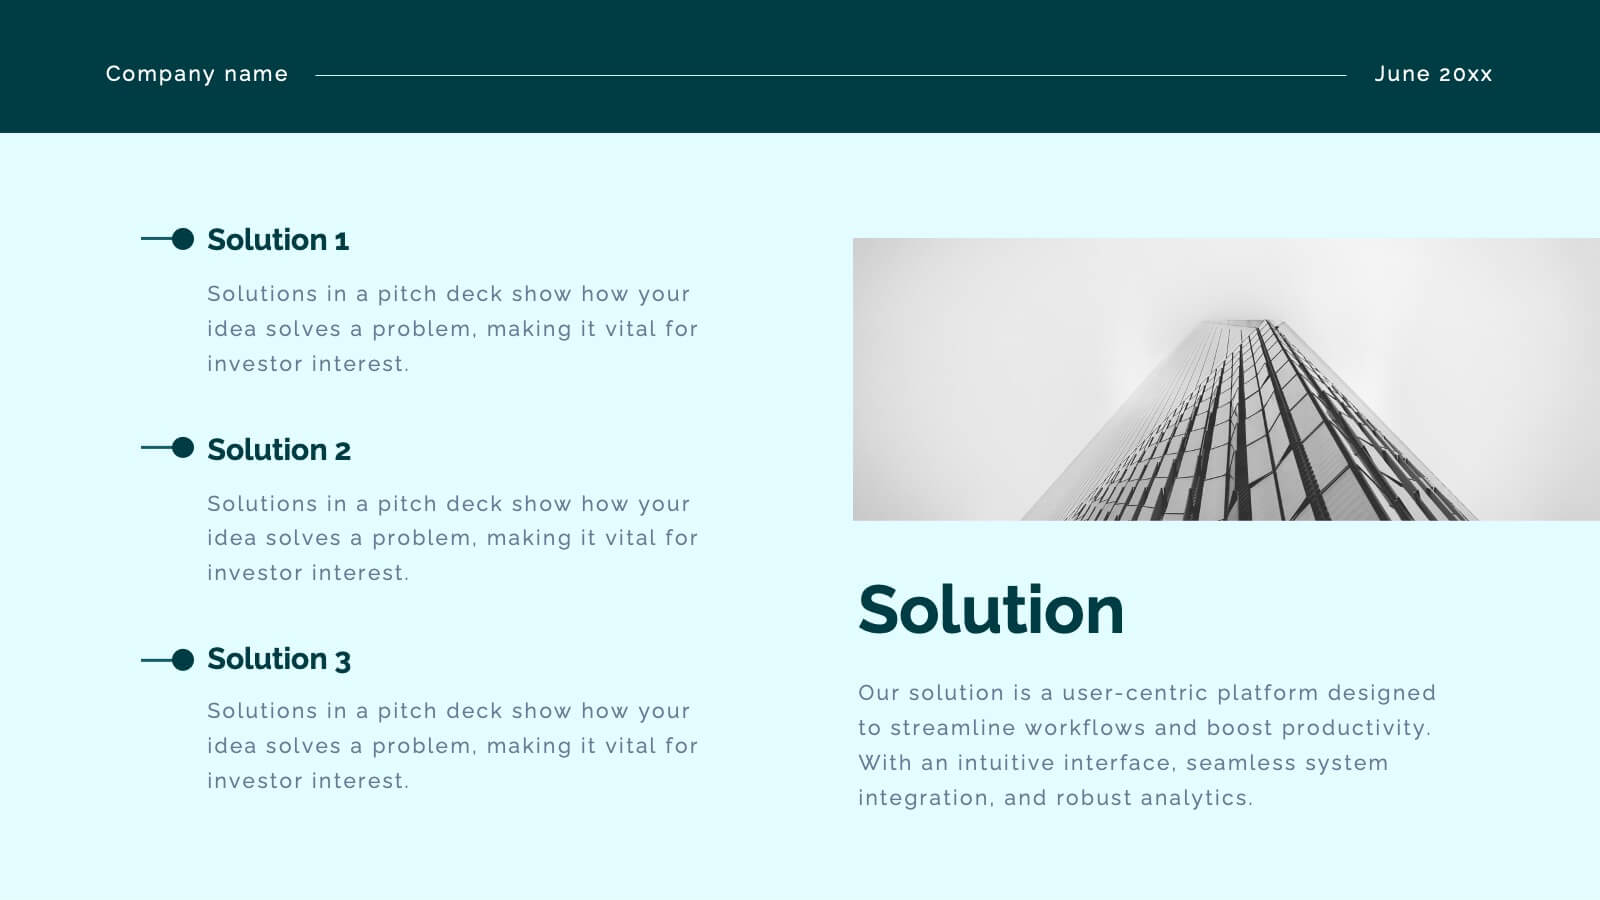
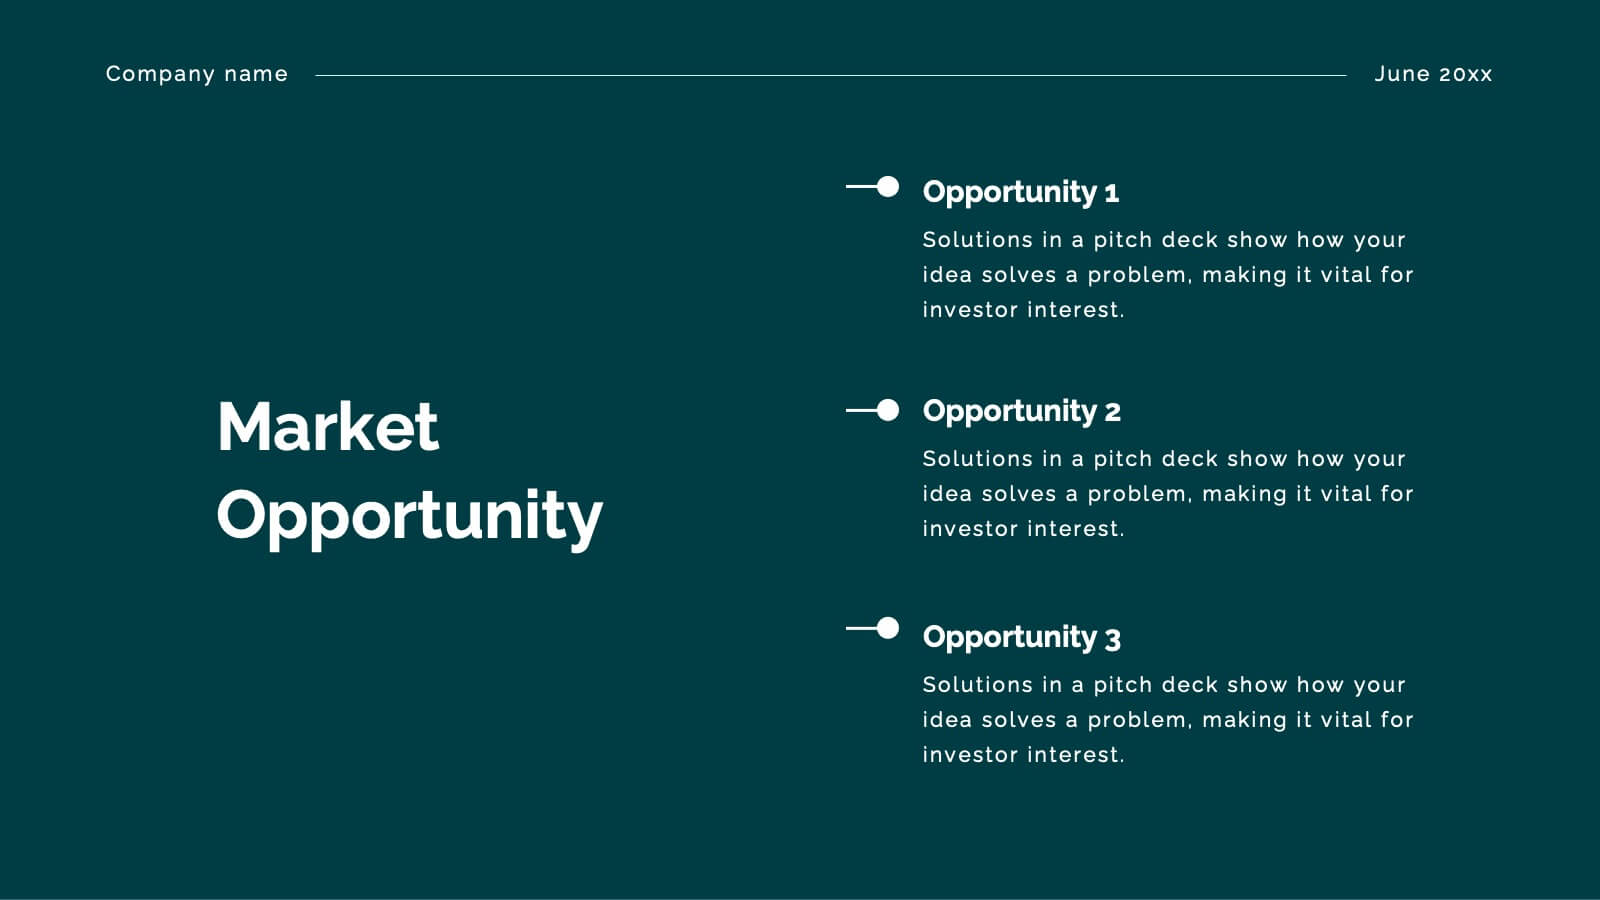
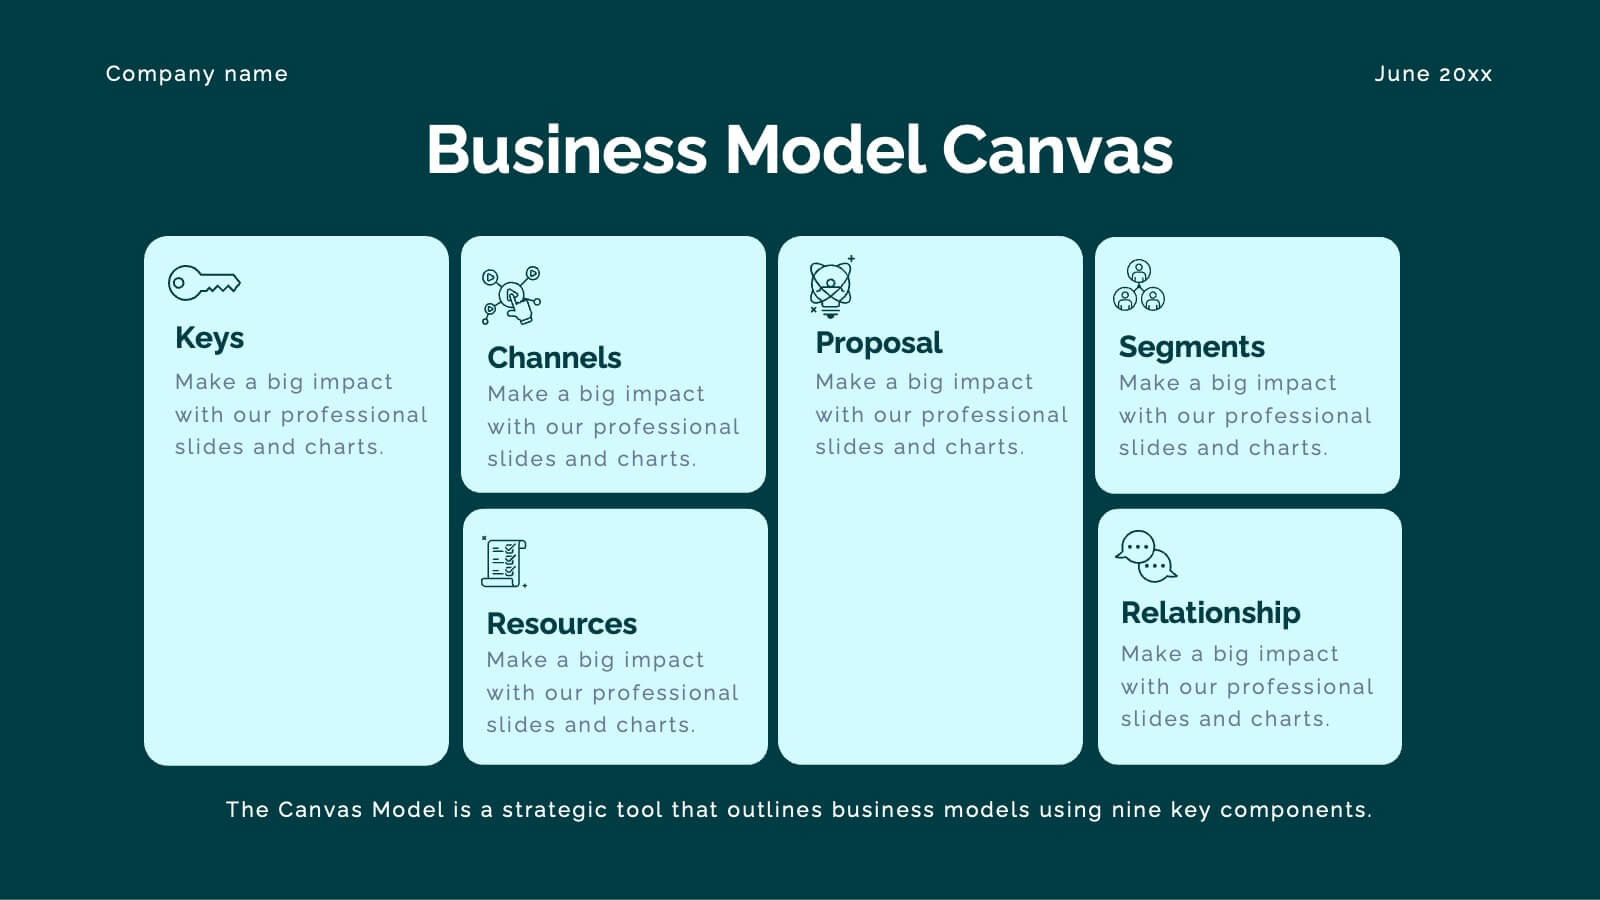
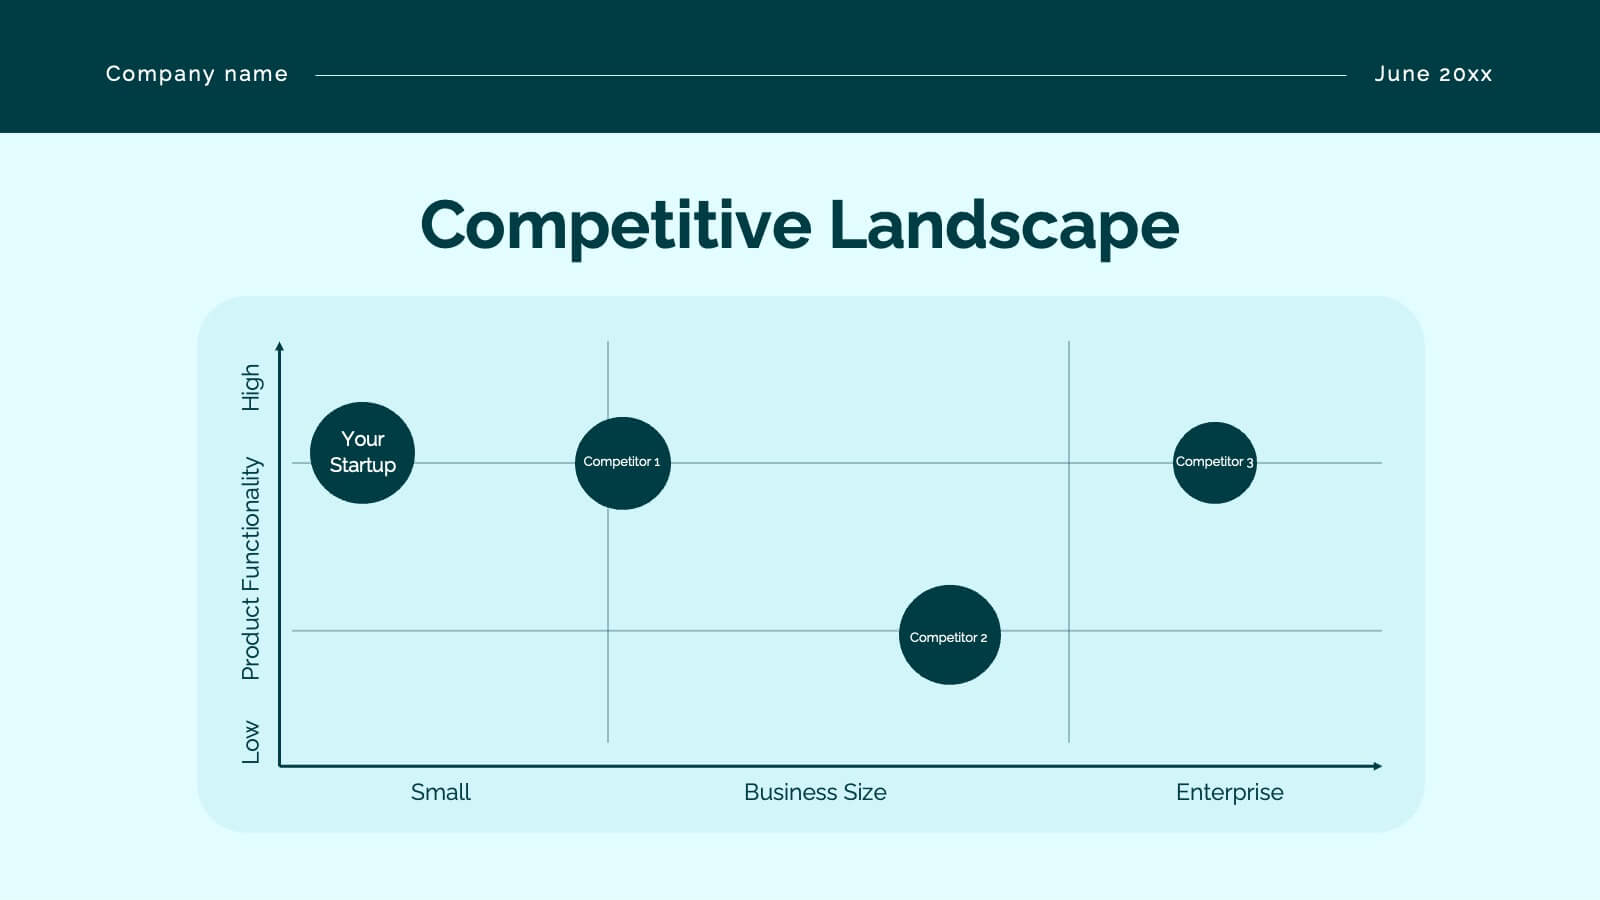
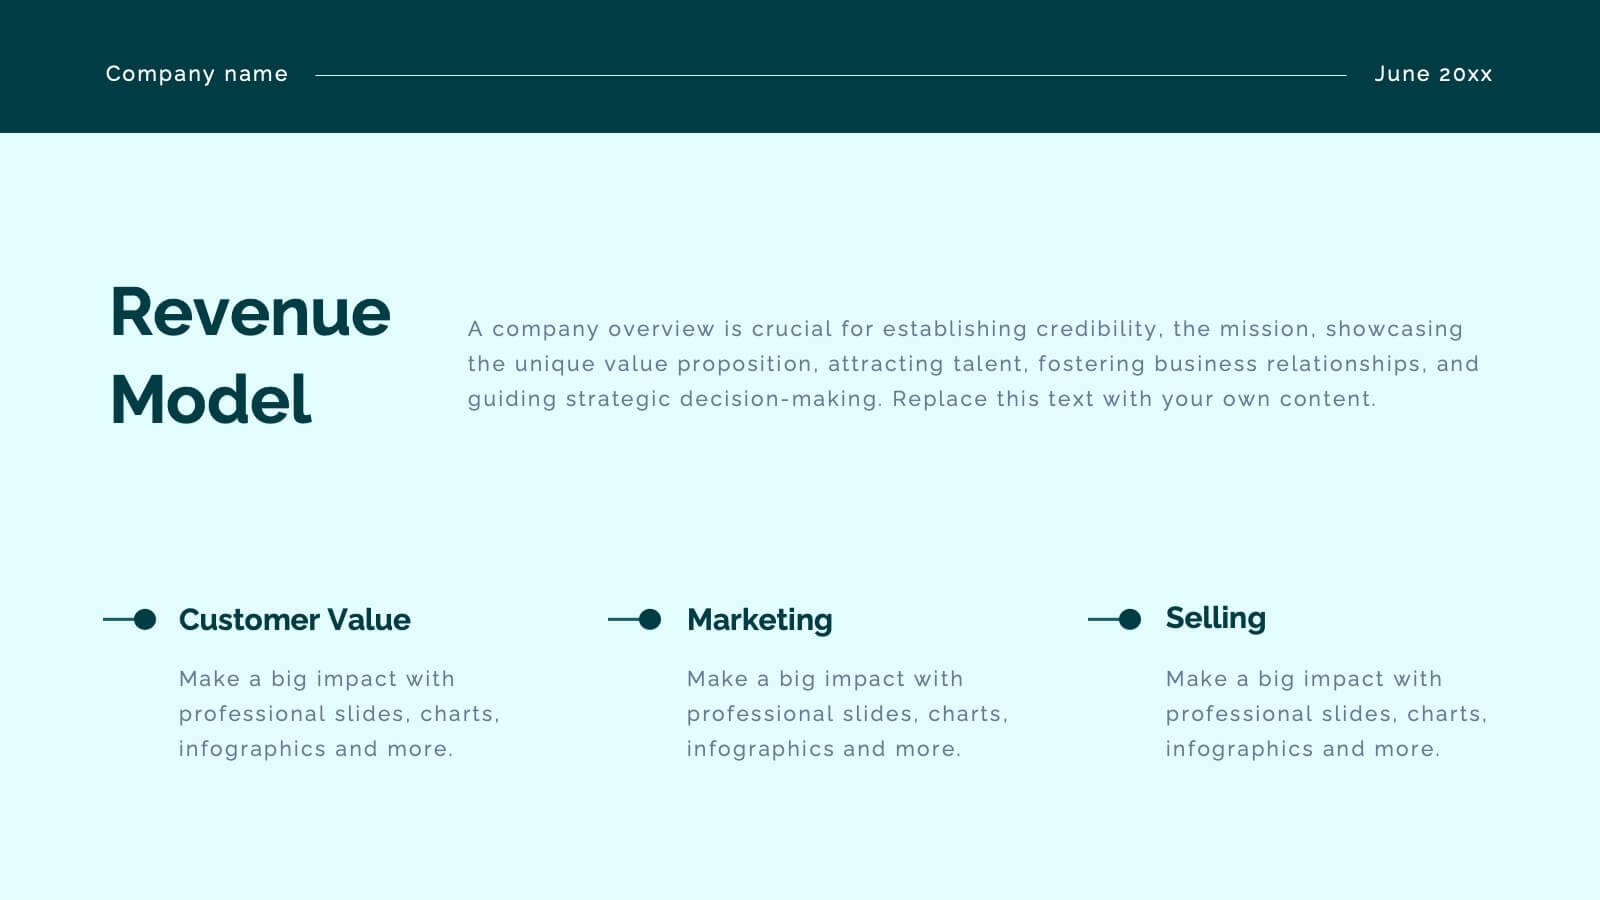
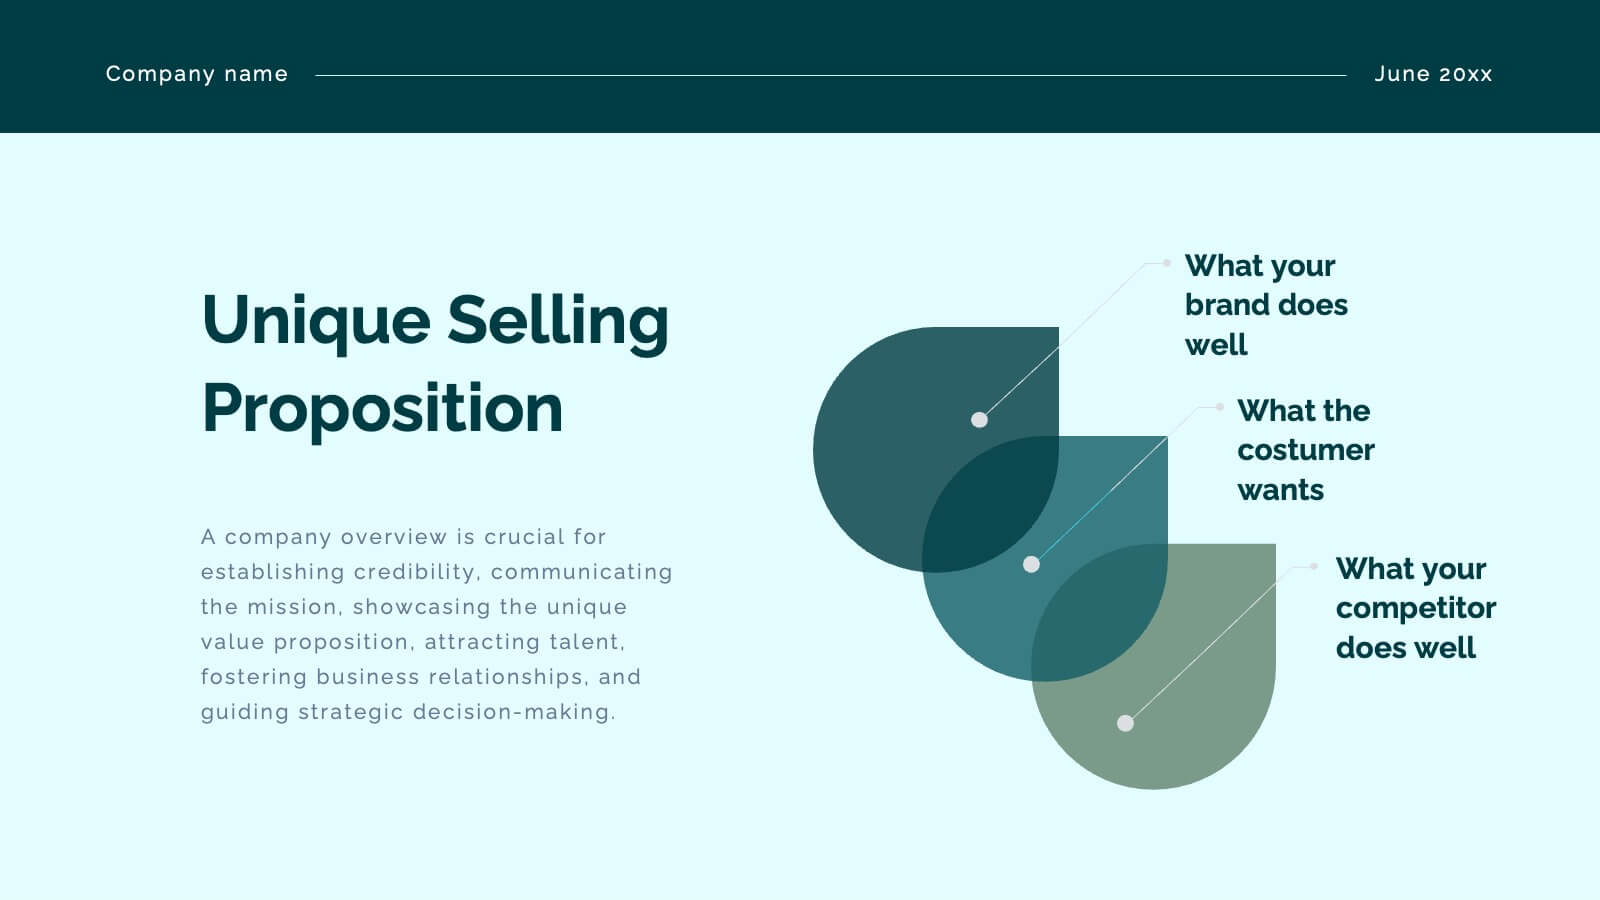
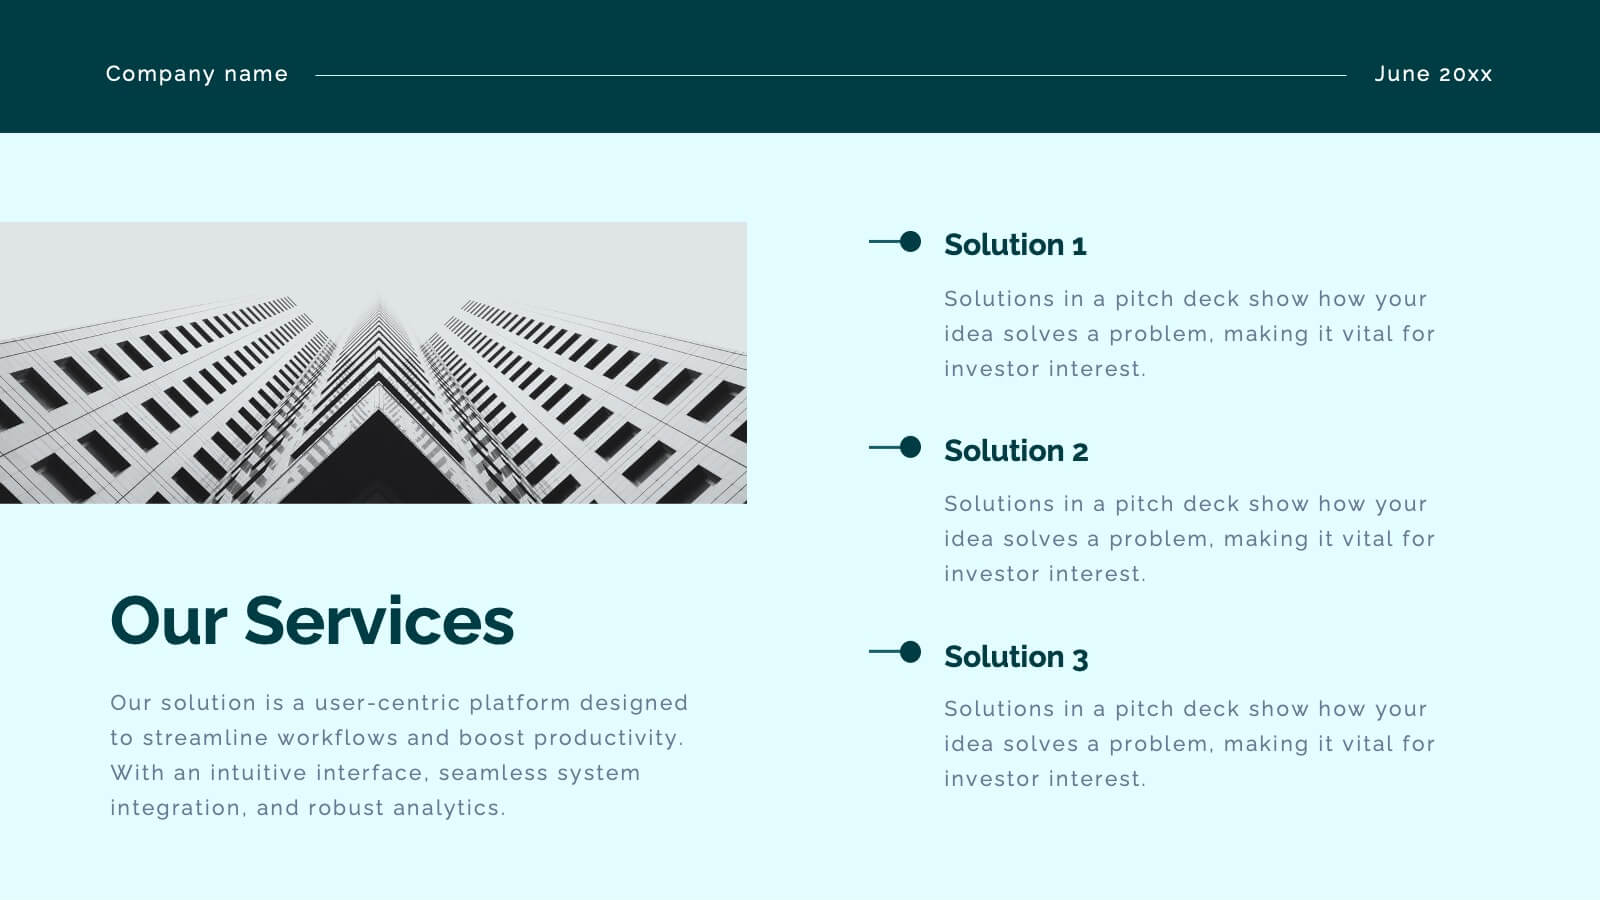
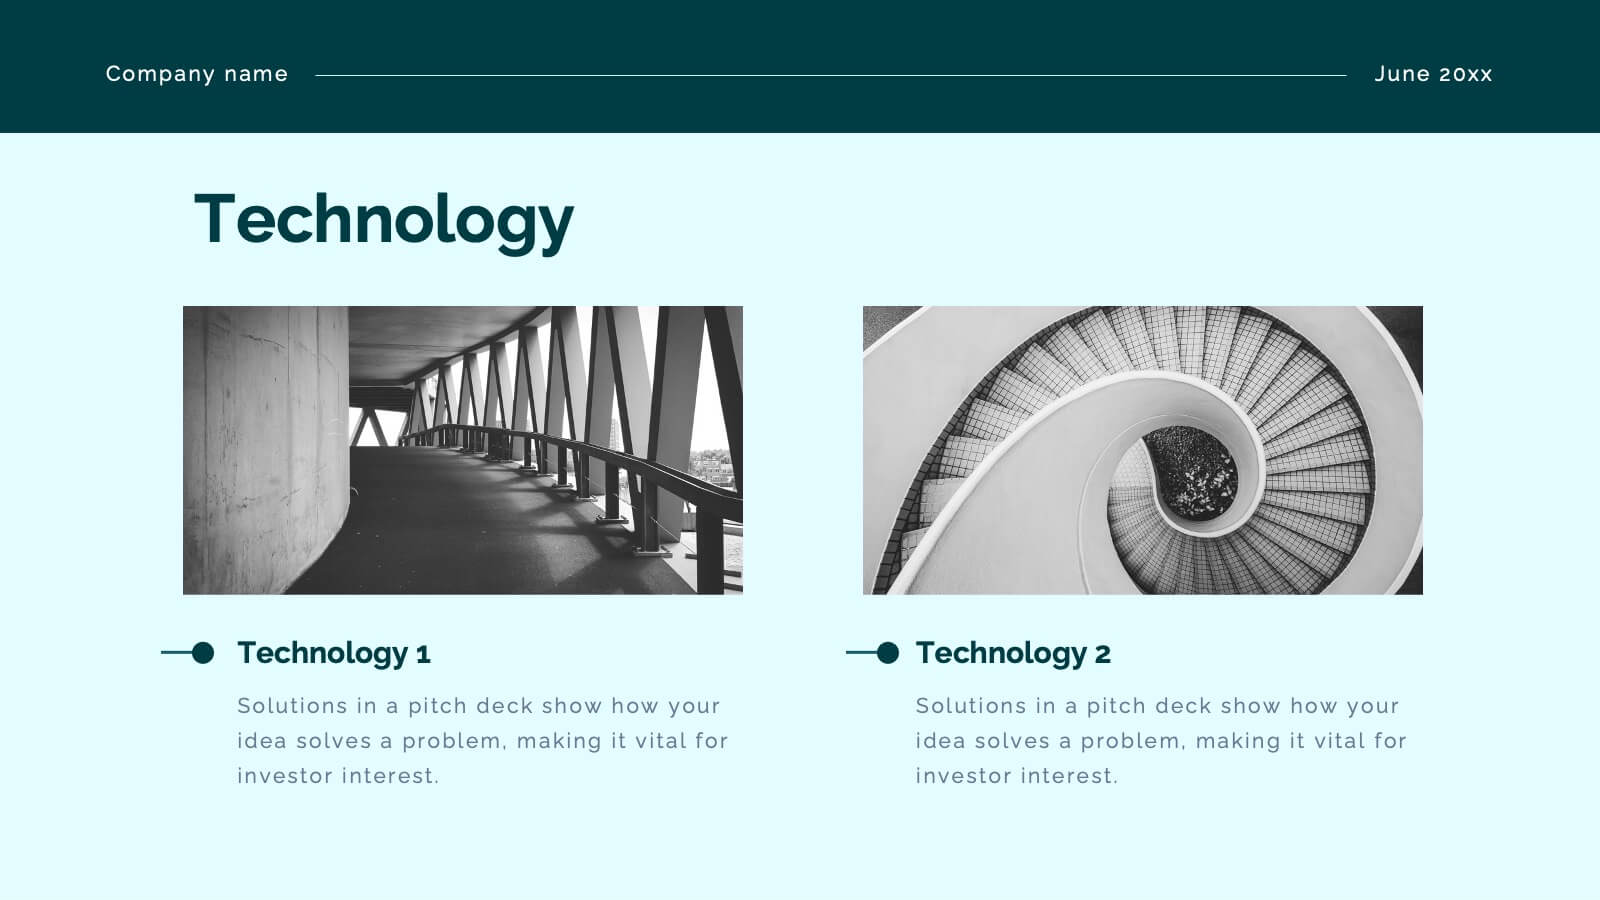
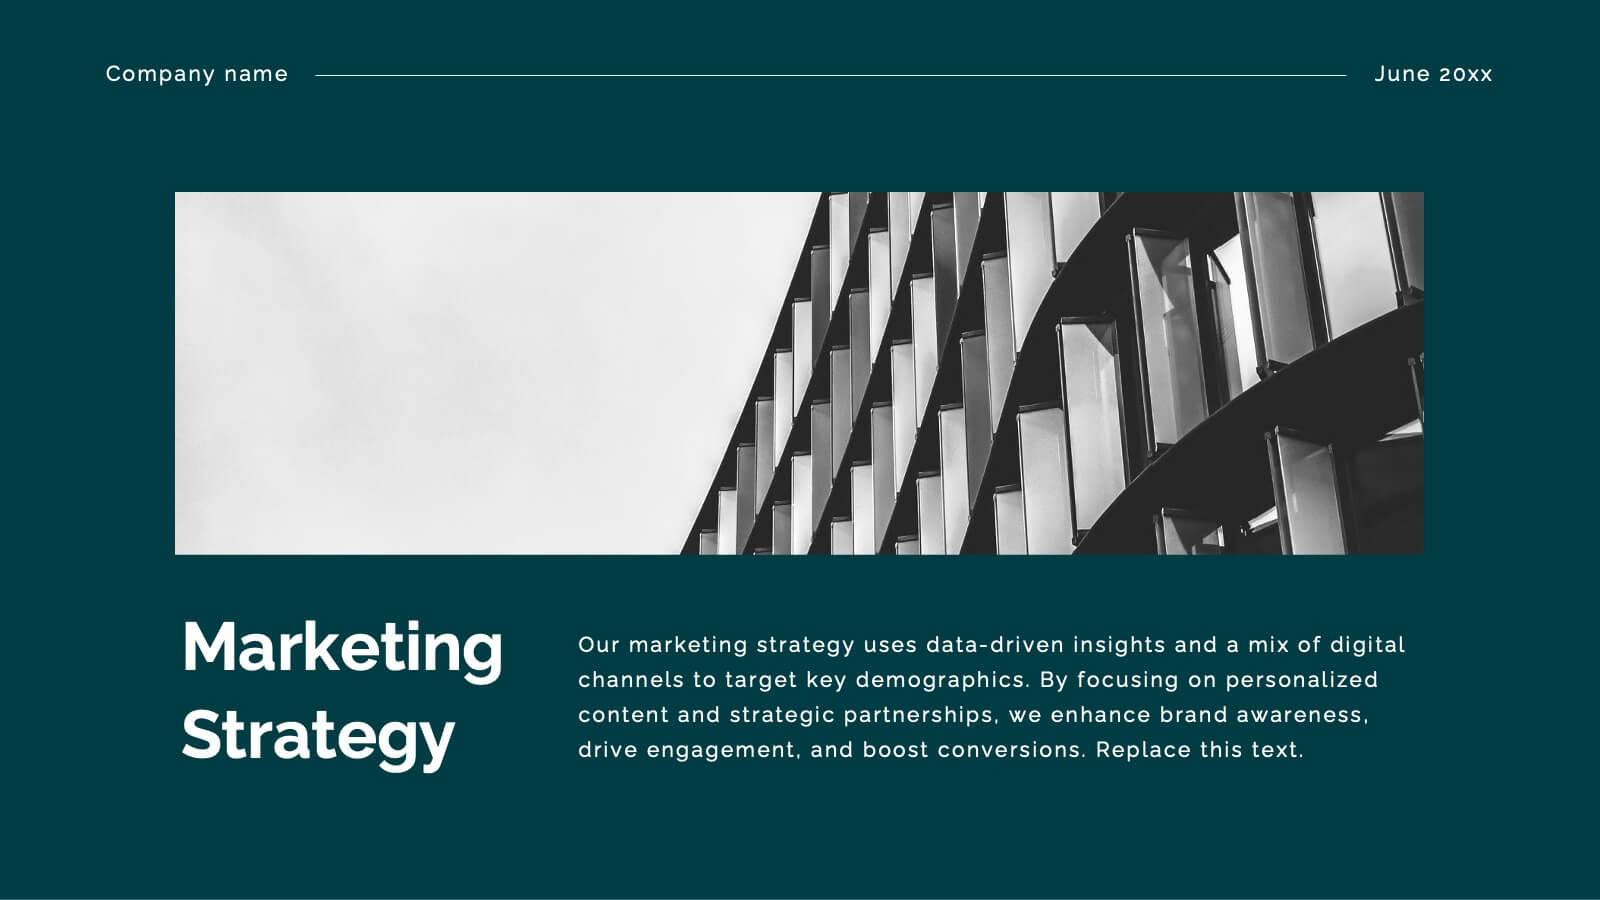
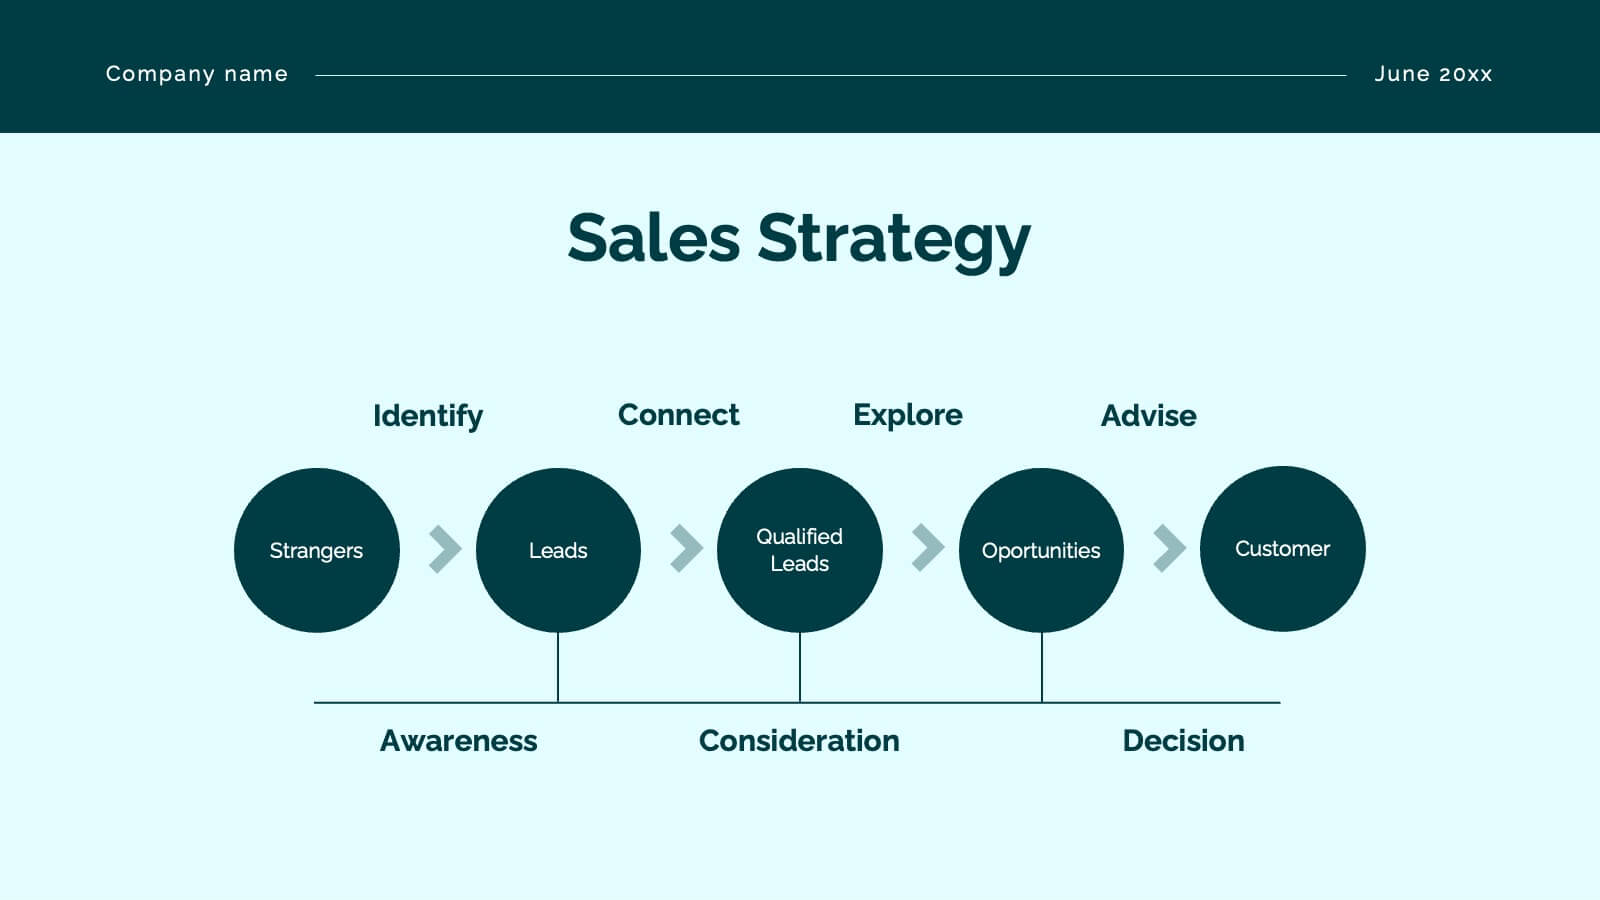
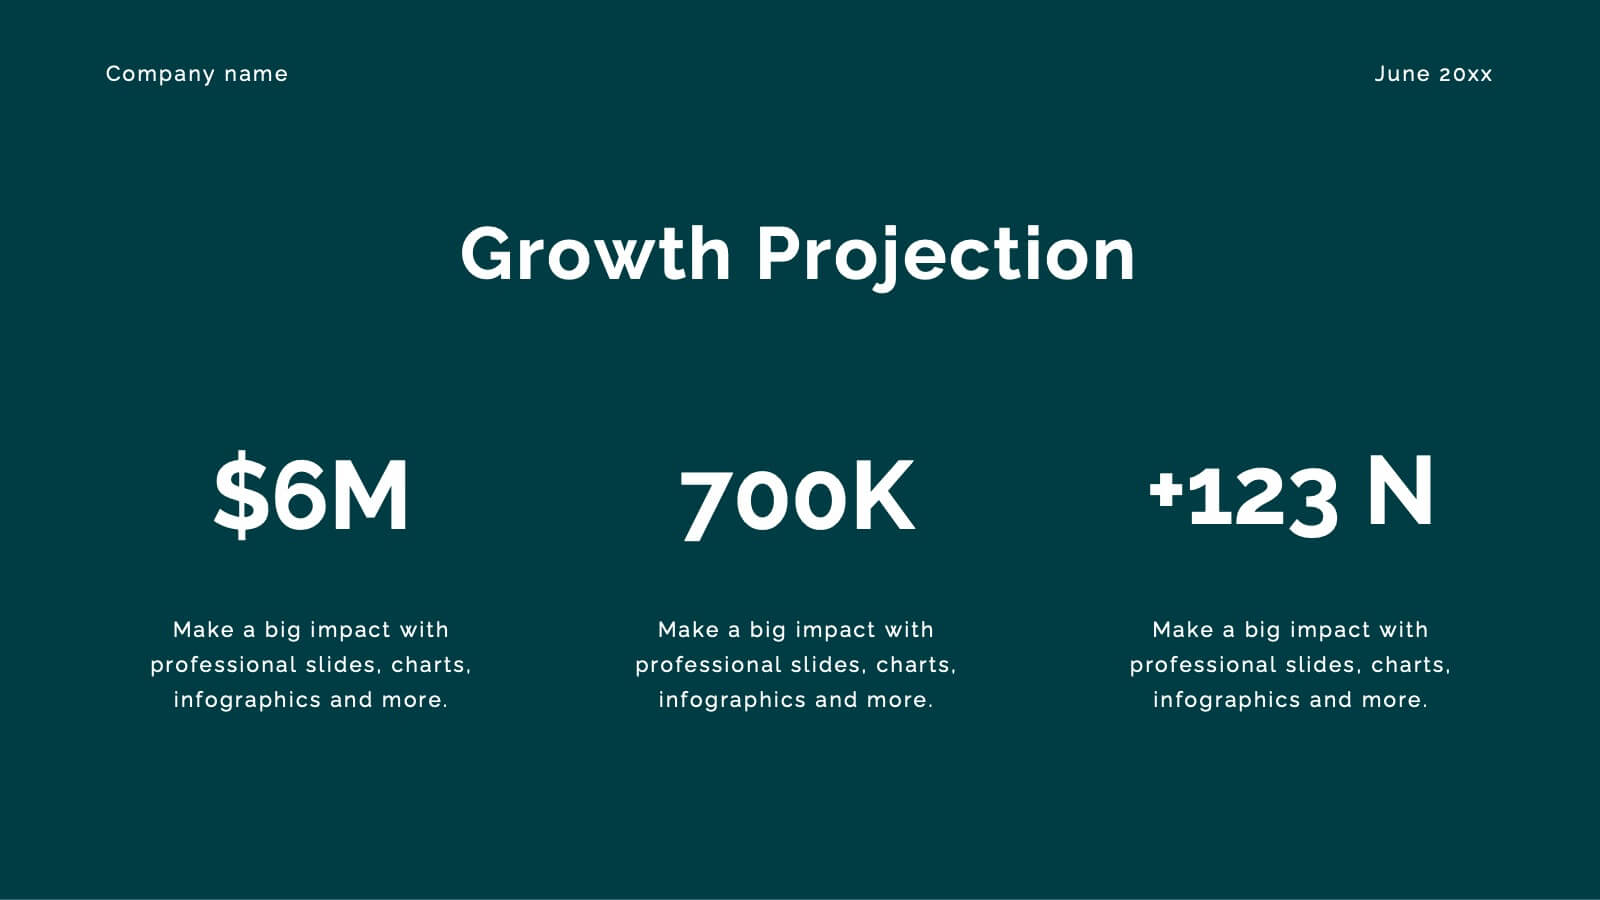
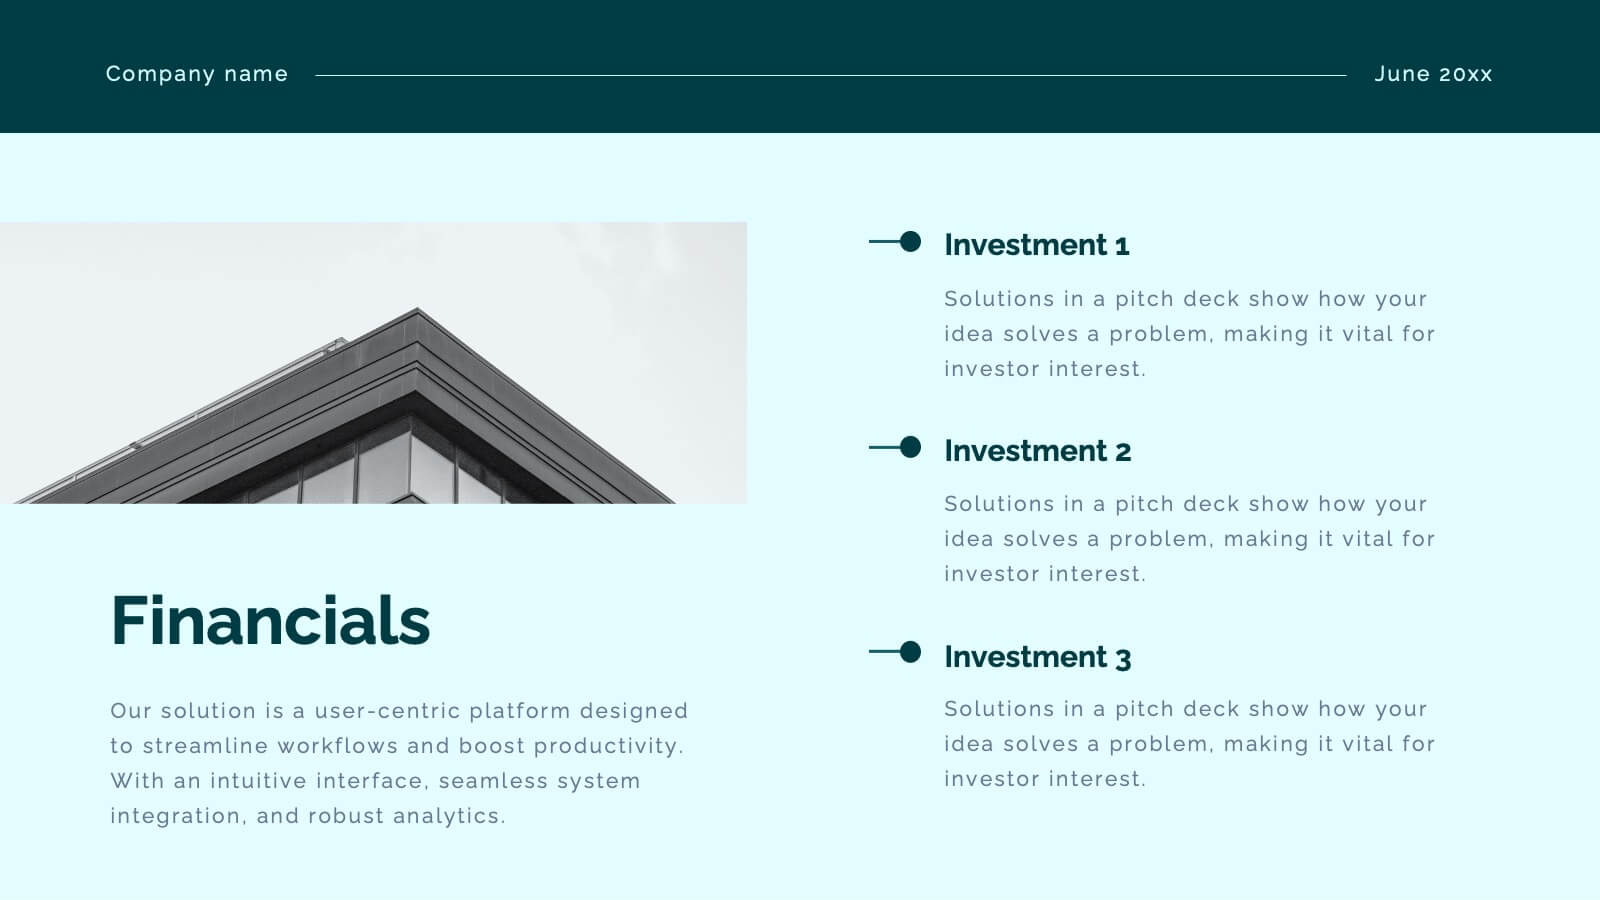
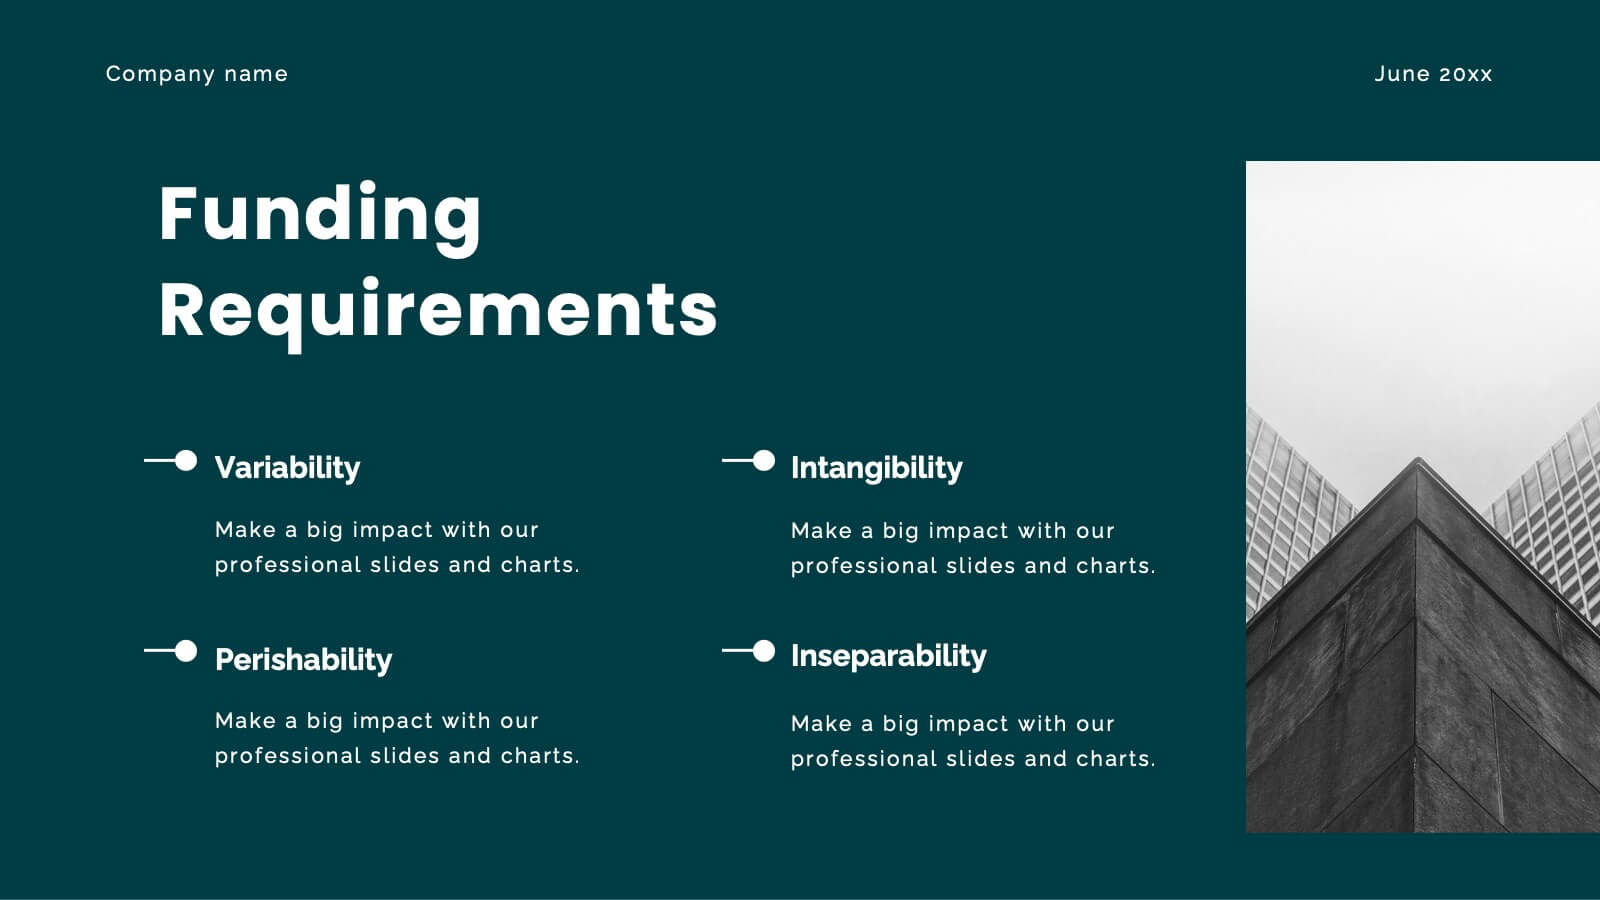
Crest Investor Pitch Presentation Presentation
Unleash your potential with this powerful pitch deck template! Tailored for presenting innovative business ideas, it features slides for company overview, market opportunity, competitive landscape, and financial projections. Clearly communicate your value proposition and impress investors with professional design and concise content. Compatible with PowerPoint, Keynote, and Google Slides for seamless presentations on any platform.


5 diapositivas
Work From Home Setup and Time Management Presentation
Master productivity from your living room with this Work From Home Setup and Time Management presentation. Featuring a modern, illustrated layout with five clear steps, this slide helps communicate best practices for workspace organization, focus habits, and time-blocking techniques. Ideal for remote onboarding, virtual team training, or self-discipline coaching sessions. Fully customizable in PowerPoint, Keynote, and Google Slides.


23 diapositivas
Rainshadow Digital Strategy Presentation
This Digital Strategy Presentation Template is designed to provide a structured approach to planning and implementing digital initiatives. Covering essential elements such as market trends, competitive analysis, value proposition, and risk management, it offers a professional framework to align goals with actionable steps. Fully customizable and compatible with PowerPoint, Keynote, and Google Slides.

22 diapositivas
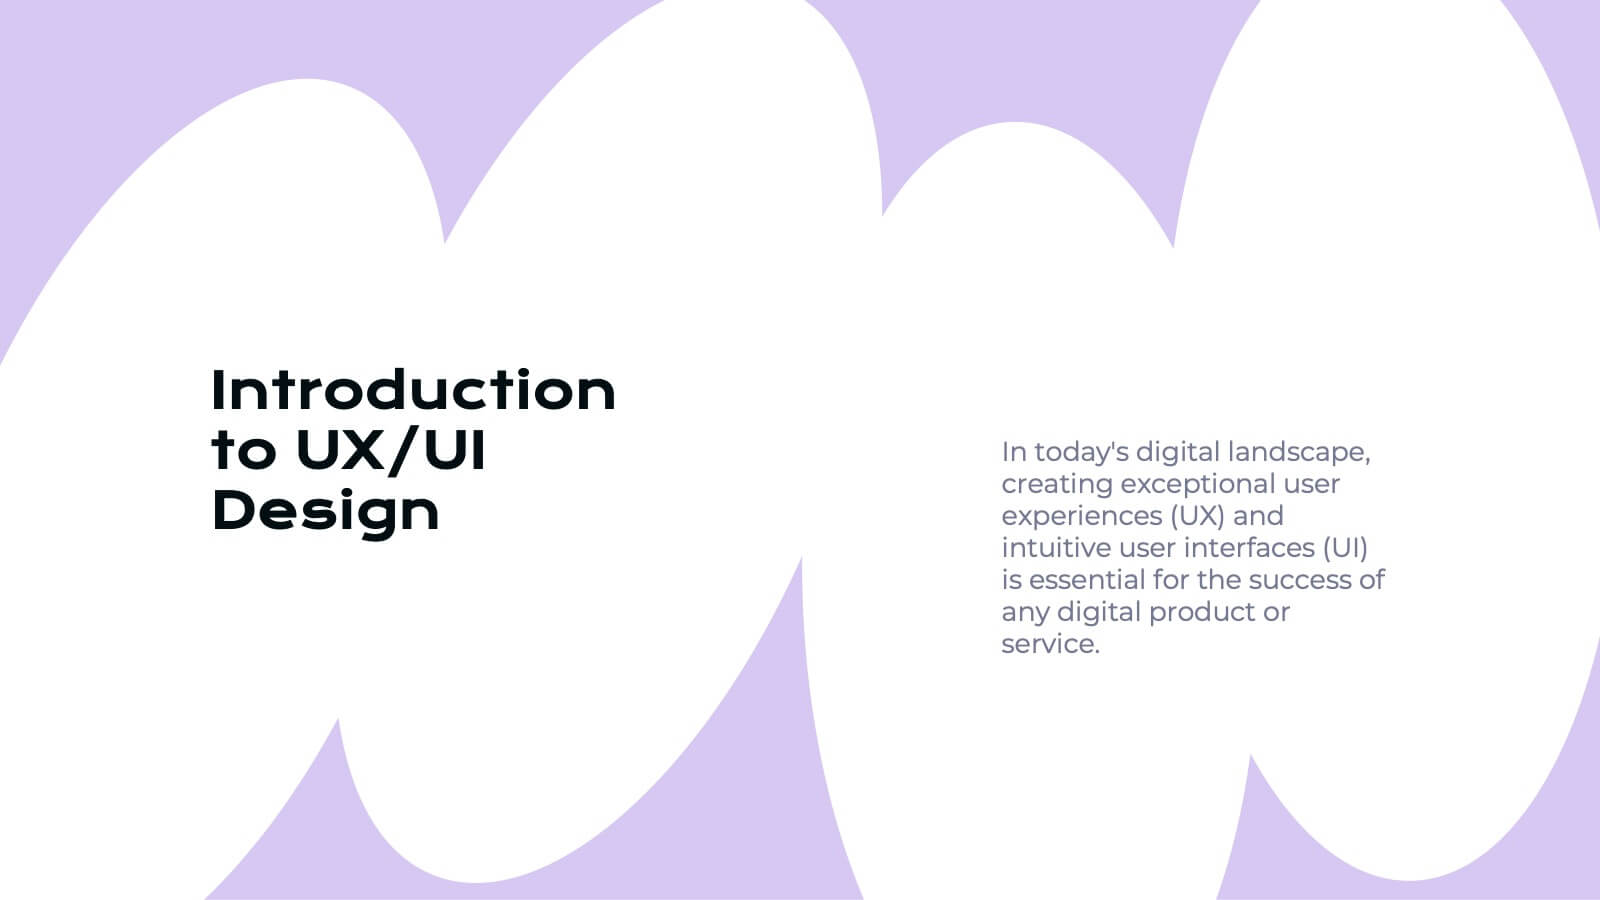
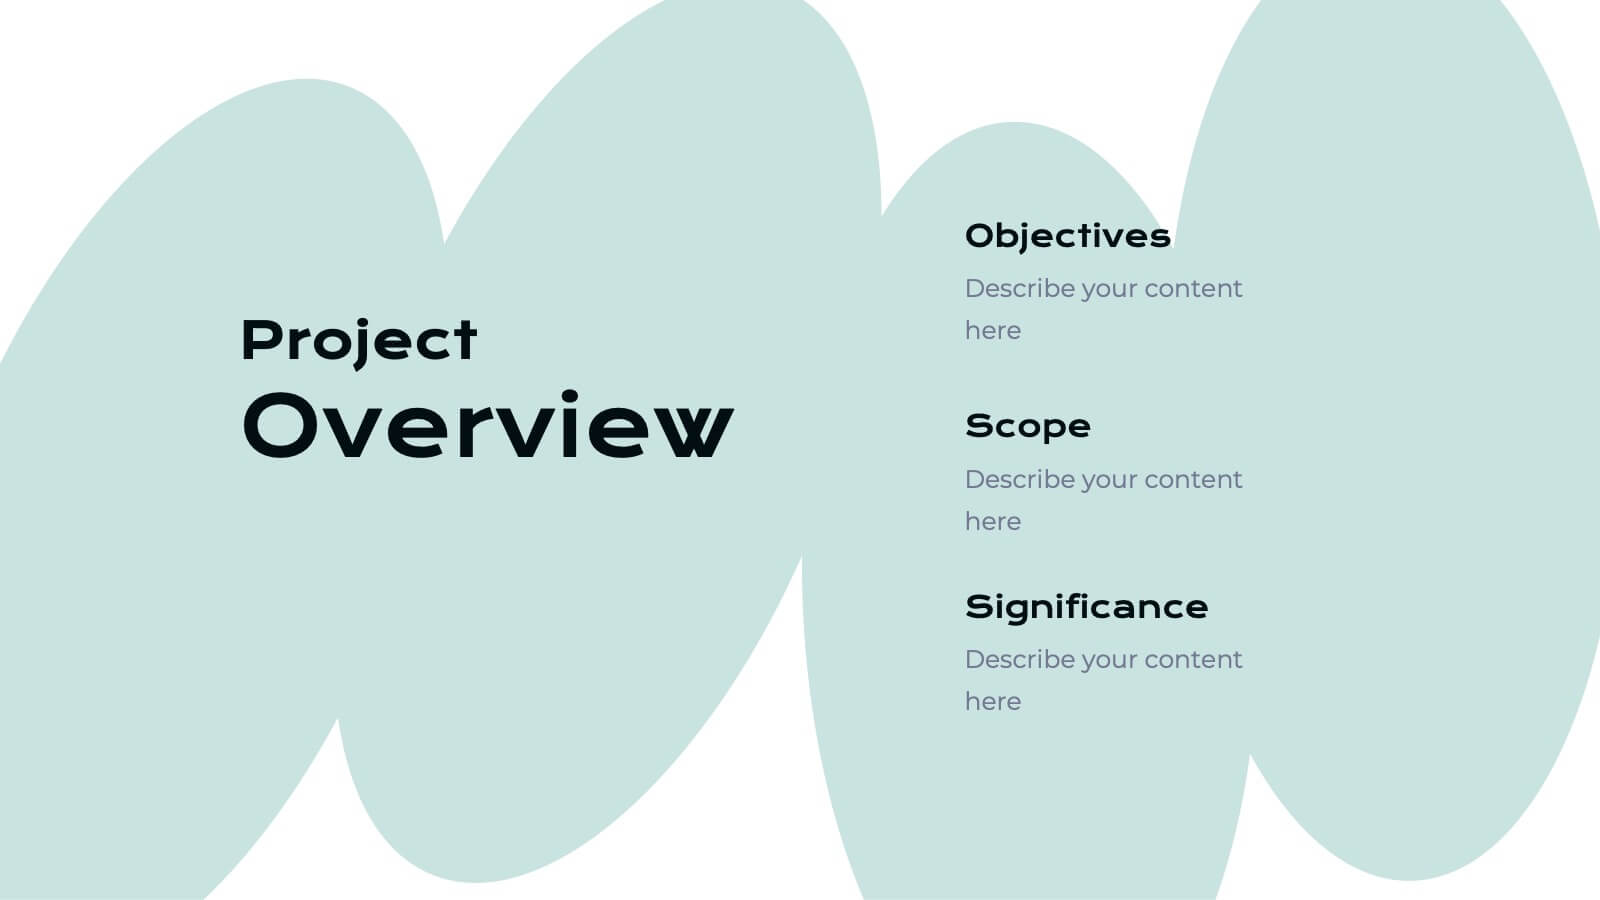
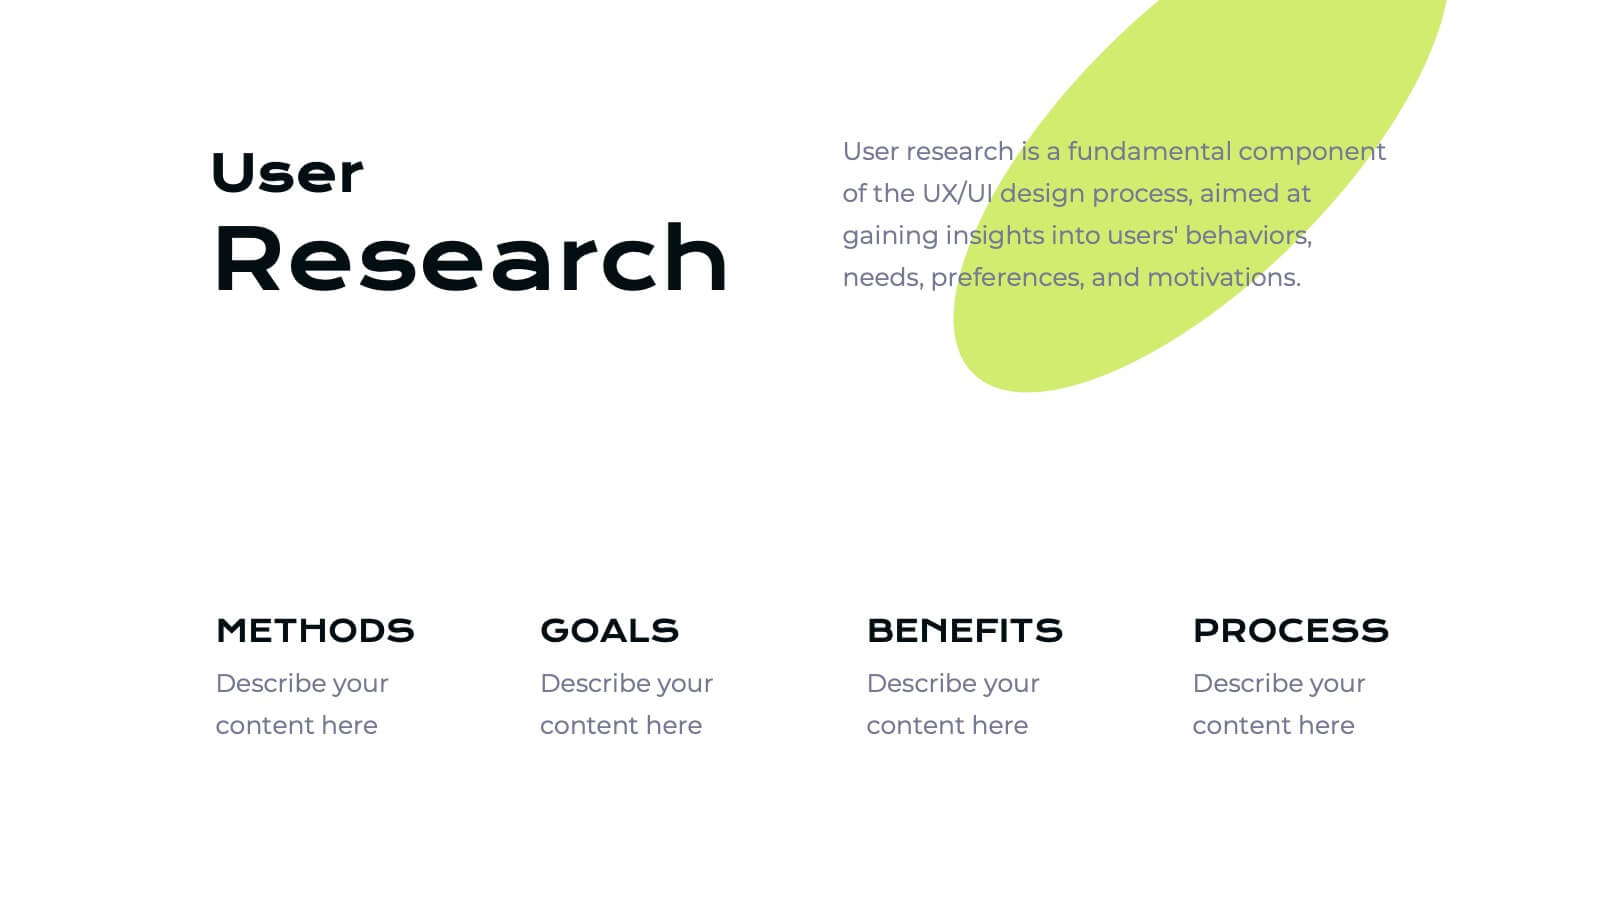
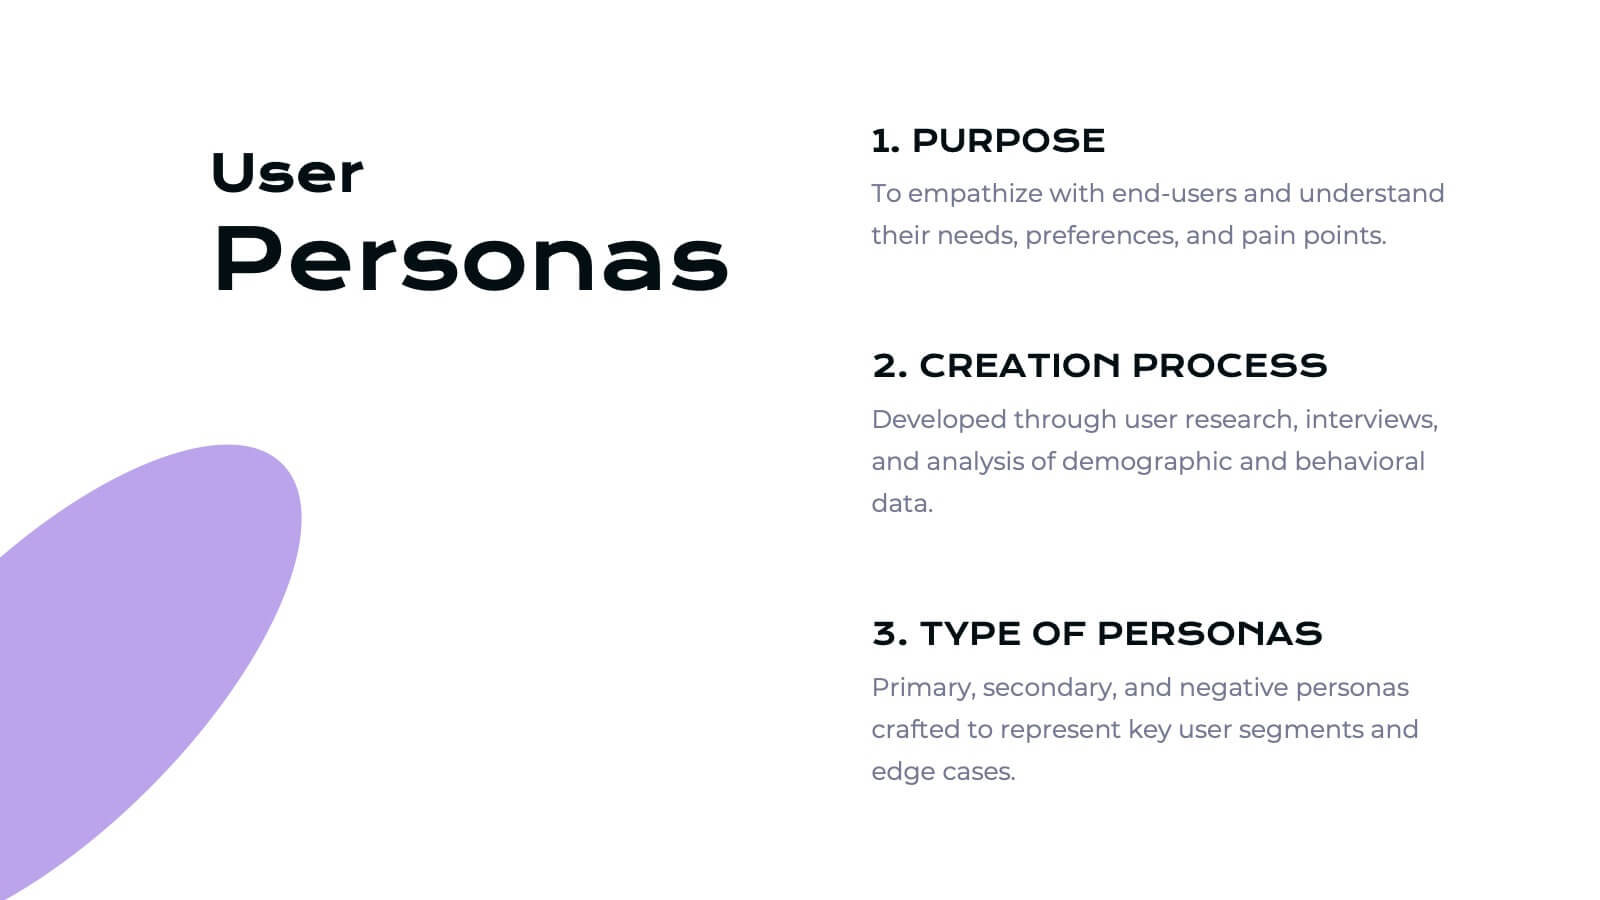
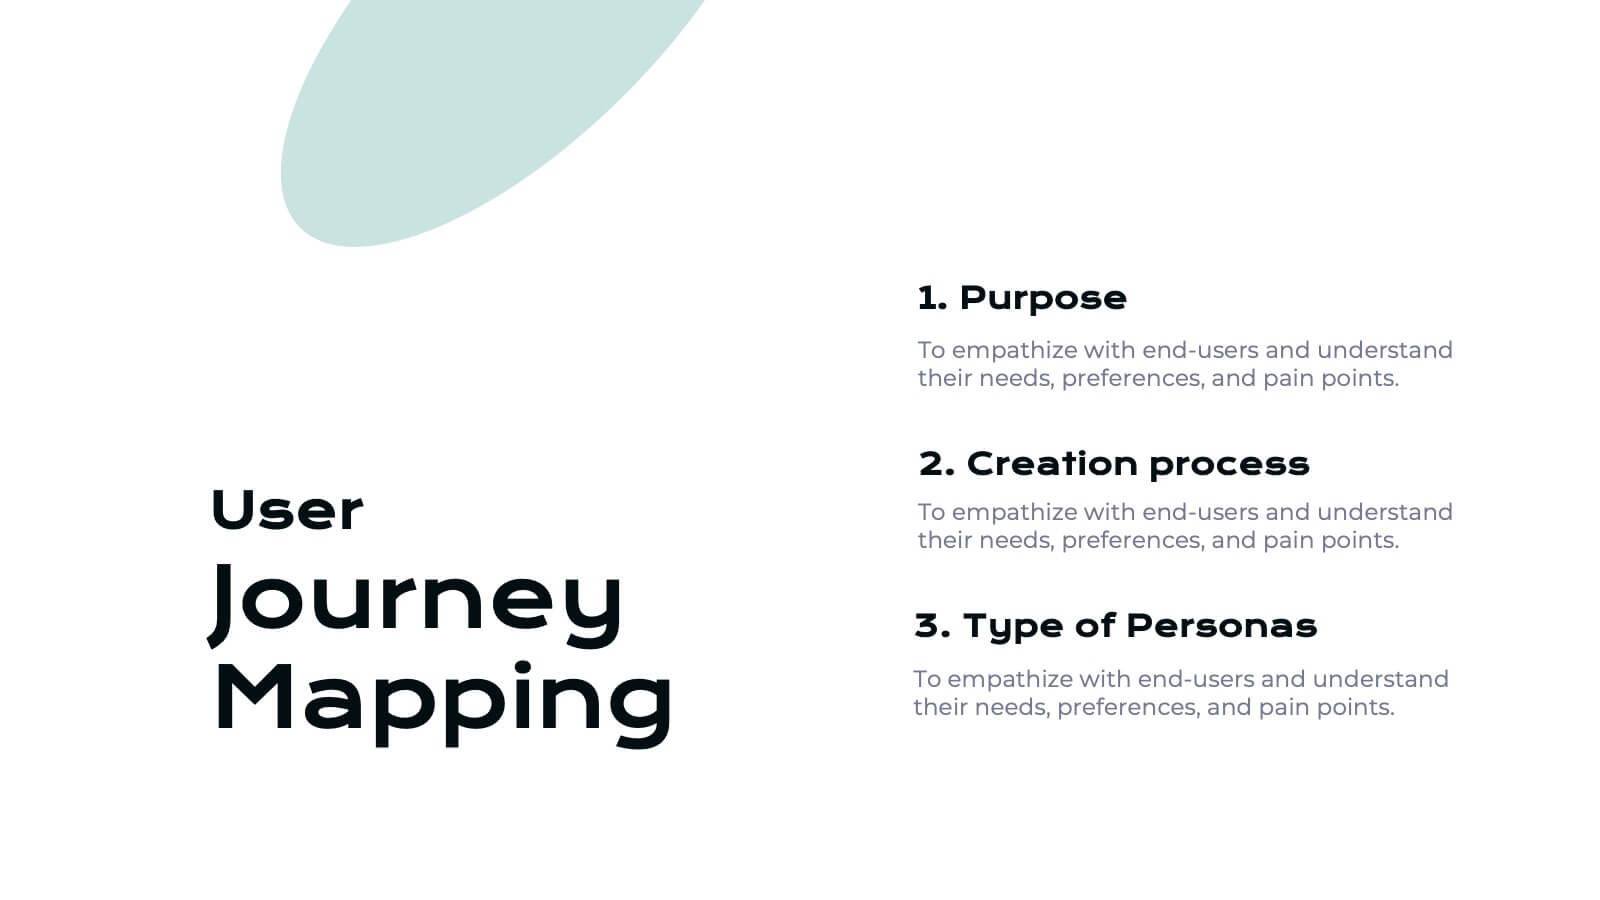
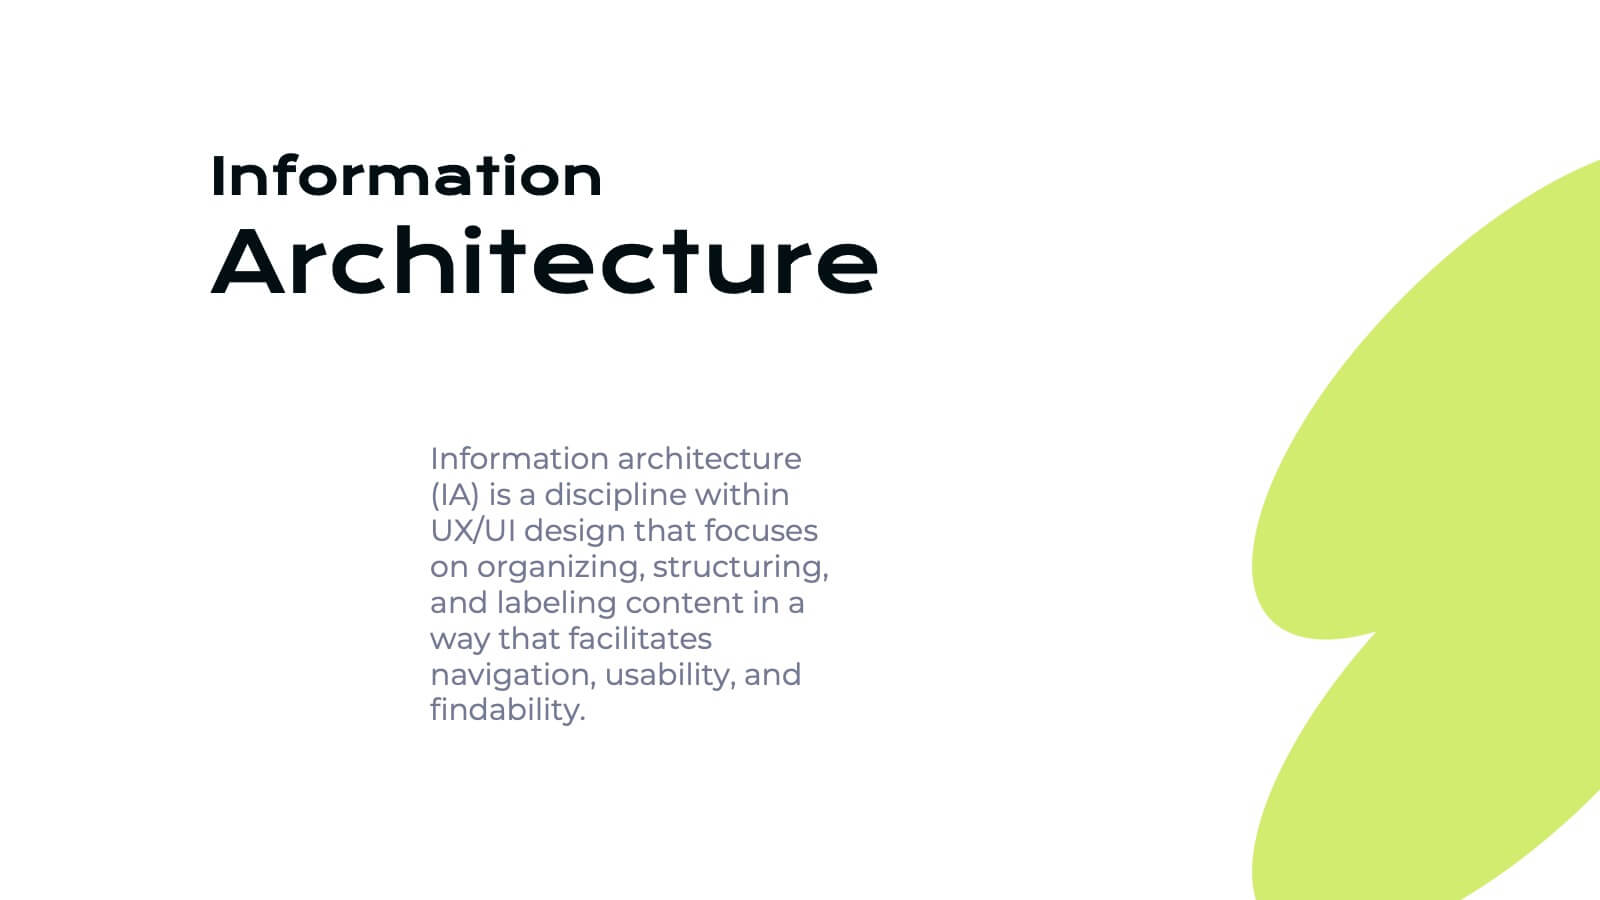
Ifrit User Experience Proposal Presentation
Unleash the power of great design with this fiery Ifrit-inspired presentation, perfect for delivering your user experience proposal! This template lets you showcase your UX strategies, research, and design process in a visually striking and well-organized format. Impress stakeholders with every slide. Compatible with PowerPoint, Keynote, and Google Slides.


7 diapositivas
Scrum Sprints Planning Presentation
Kick off your workflow with a dynamic visual that maps out every phase of your team’s process in a clean, structured layout. This presentation helps explain planning cycles, task sequencing, and collaborative decision-making in a clear, engaging format. Fully compatible with PowerPoint, Keynote, and Google Slides.


5 diapositivas
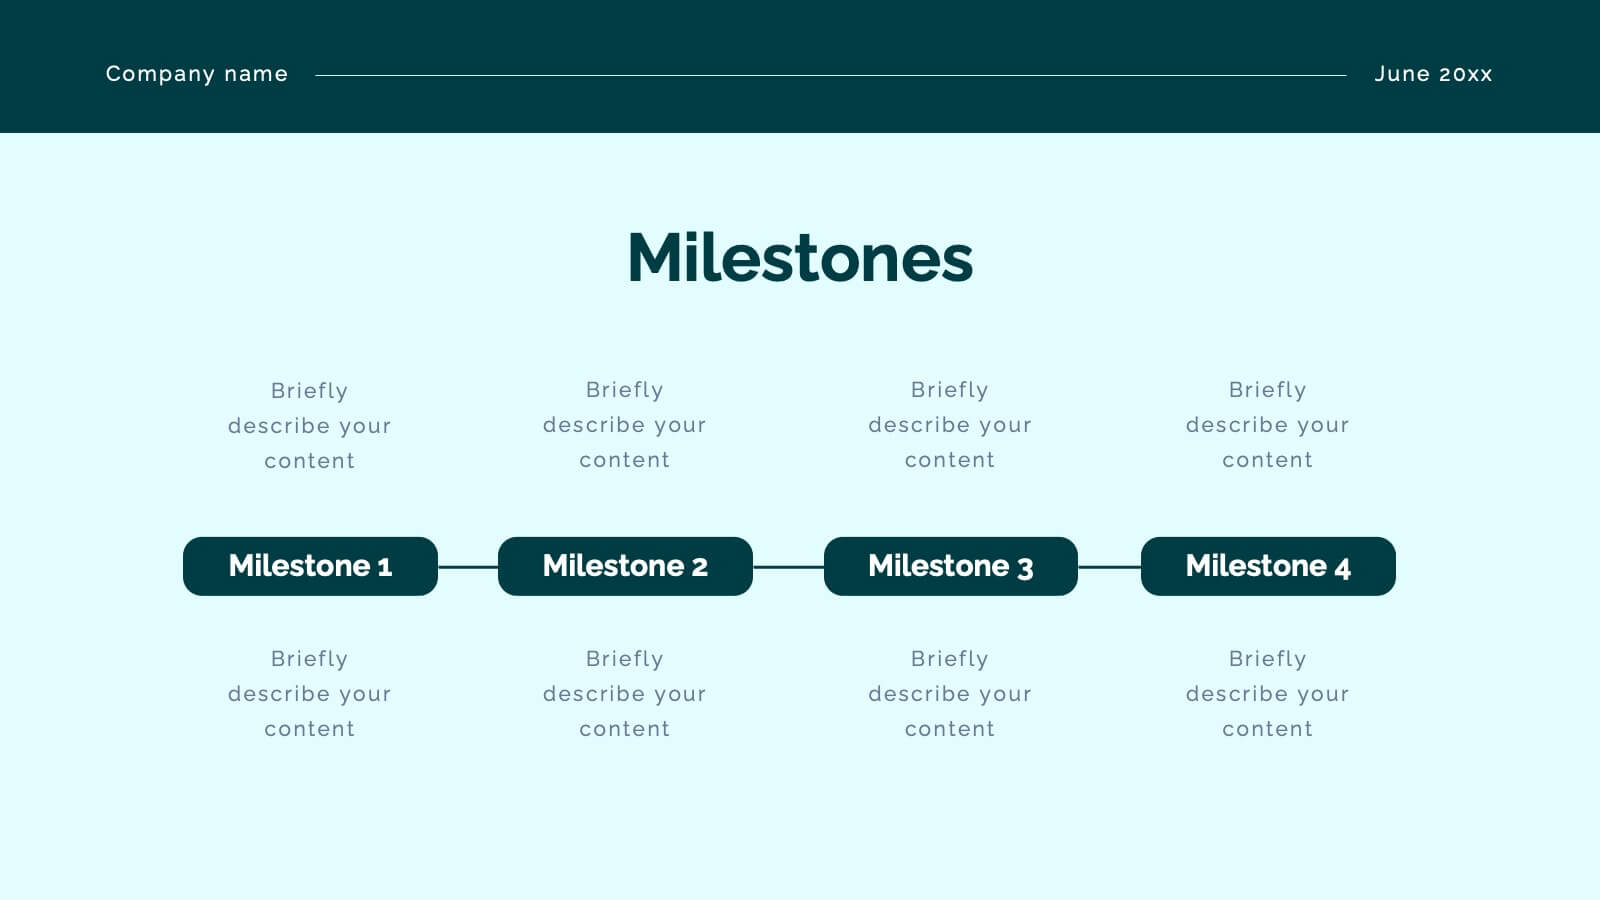
Project Summary and Executive Highlights Presentation
Summarize key milestones with this Project Summary and Executive Highlights slide. Featuring a clean horizontal layout with icons and numbered steps, it’s perfect for spotlighting major achievements, phases, or metrics. Use it to present updates with clarity and professionalism. Fully editable in PowerPoint, Google Slides, or Canva.


5 diapositivas
Cognitive Behavioral Therapy Overview Presentation
Help your audience connect the dots between thoughts, feelings, and behaviors with this clean, illustrated layout. Designed to simplify complex mental health concepts, this CBT infographic template is perfect for educators, coaches, or therapists. Fully editable and compatible with PowerPoint, Keynote, and Google Slides for effortless customization.


6 diapositivas
Section Breakdown Table of Content Presentation
Present your topics in a clear, structured way with the Section Breakdown Table of Content template. Featuring a two-column layout with colorful icons and labeled sections, it’s perfect for outlining multiple categories. Fully editable in Canva, PowerPoint, and Google Slides to match your brand style and improve presentation flow.


4 diapositivas
Lead Funnel and Engagement Model Presentation
Visualize your marketing journey from awareness to action with the Lead Funnel and Engagement Model Presentation. This clean and modern funnel layout uses bold, color-coded segments to represent each stage—perfect for illustrating how leads progress from discovery to conversion. Ideal for marketing strategists, sales teams, or campaign reporting, the template offers editable titles, icons, and text boxes to match your process. Compatible with PowerPoint, Keynote, and Google Slides, it’s designed for easy customization and polished delivery.


5 diapositivas
Root Cause Business Problem Slide
Uncover the foundation of complex challenges with this tree-inspired slide—perfect for visualizing root causes behind business problems. Showcase contributing factors at each root to guide effective solutions. Fully editable in PowerPoint, Keynote, and Google Slides.


10 diapositivas
Customer Survey Feedback Insights Presentation
Highlight key takeaways from your reviews with the Customer Survey Feedback Insights Presentation. This sleek layout uses a vertical timeline with icons and star ratings to present customer input clearly and professionally. Ideal for showcasing survey results, testimonials, or product improvement insights. Fully editable in Canva, PowerPoint, Google Slides, and Keynote.


20 diapositivas
Milky Way Design Portfolio Presentation
The Milky Way Design Portfolio template is your ultimate tool for showcasing your creative work with elegance and professionalism. This template combines soft pastel colors with modern design elements, making your projects stand out. Perfect for designers, artists, and creative professionals, it includes sections like portfolio overview, creative process, collaborations, client testimonials, and more. Each slide is carefully designed to highlight your work, achievements, and services in a visually appealing manner. The layout is clean and minimalistic, ensuring that the focus remains on your content. Whether you're presenting a single project or a diverse range of work, this template adapts effortlessly to your needs. It's fully compatible with PowerPoint, Keynote, and Google Slides, offering flexibility and ease of use across platforms. Impress your audience and potential clients with a portfolio presentation that's as polished and creative as your work itself.


4 diapositivas
Minimal Company Profile Deck Presentation
Make a bold first impression with this sleek, minimal layout designed to showcase your company’s vision, services, and team with clarity and style. Perfect for startups or established brands, it balances professionalism and creativity effortlessly. Fully editable and compatible with PowerPoint, Keynote, and Google Slides for seamless customization.


5 diapositivas
Growth and Scale Indicators Overview Presentation
Highlight your company's upward momentum with the Growth and Scale Indicators Overview Presentation. This slide features a pyramid-style design to represent five progressive milestones or performance metrics, perfect for visualizing success benchmarks or key achievements. Fully customizable in Canva, PowerPoint, Keynote, and Google Slides for seamless integration into your presentations.


21 diapositivas
Sonata Product Roadmap Presentation
Navigate the future of your product with a structured and compelling roadmap presentation template. Designed for product managers, entrepreneurs, and teams, this layout provides a clear framework to outline product goals, strategies, and timelines effectively. The template includes sections for product overviews, customer pain points, unique value propositions, competitive analysis, pricing strategies, and user experience mapping. It also features slides for stakeholder communication, marketing rollouts, and technical specifications to ensure every aspect of your product journey is covered. Fully compatible with PowerPoint, Google Slides, and Keynote, this template is easy to customize with your brand’s colors, fonts, and visuals. Present your product's roadmap confidently, engaging stakeholders and aligning your team towards success.