


Características


¿Tienes alguna pregunta?
Recomendar


8 diapositivas
Asia Geographics and Business Analysis Map Presentation
Visualize regional insights with this Asia map template. Highlight business data, performance indicators, or strategic regions using callouts and color-coded zones. Perfect for market analysis, logistics, or geographic reporting. Fully customizable in PowerPoint, Keynote, or Google Slides to match your branding and presentation goals with clear, location-based storytelling.


4 diapositivas
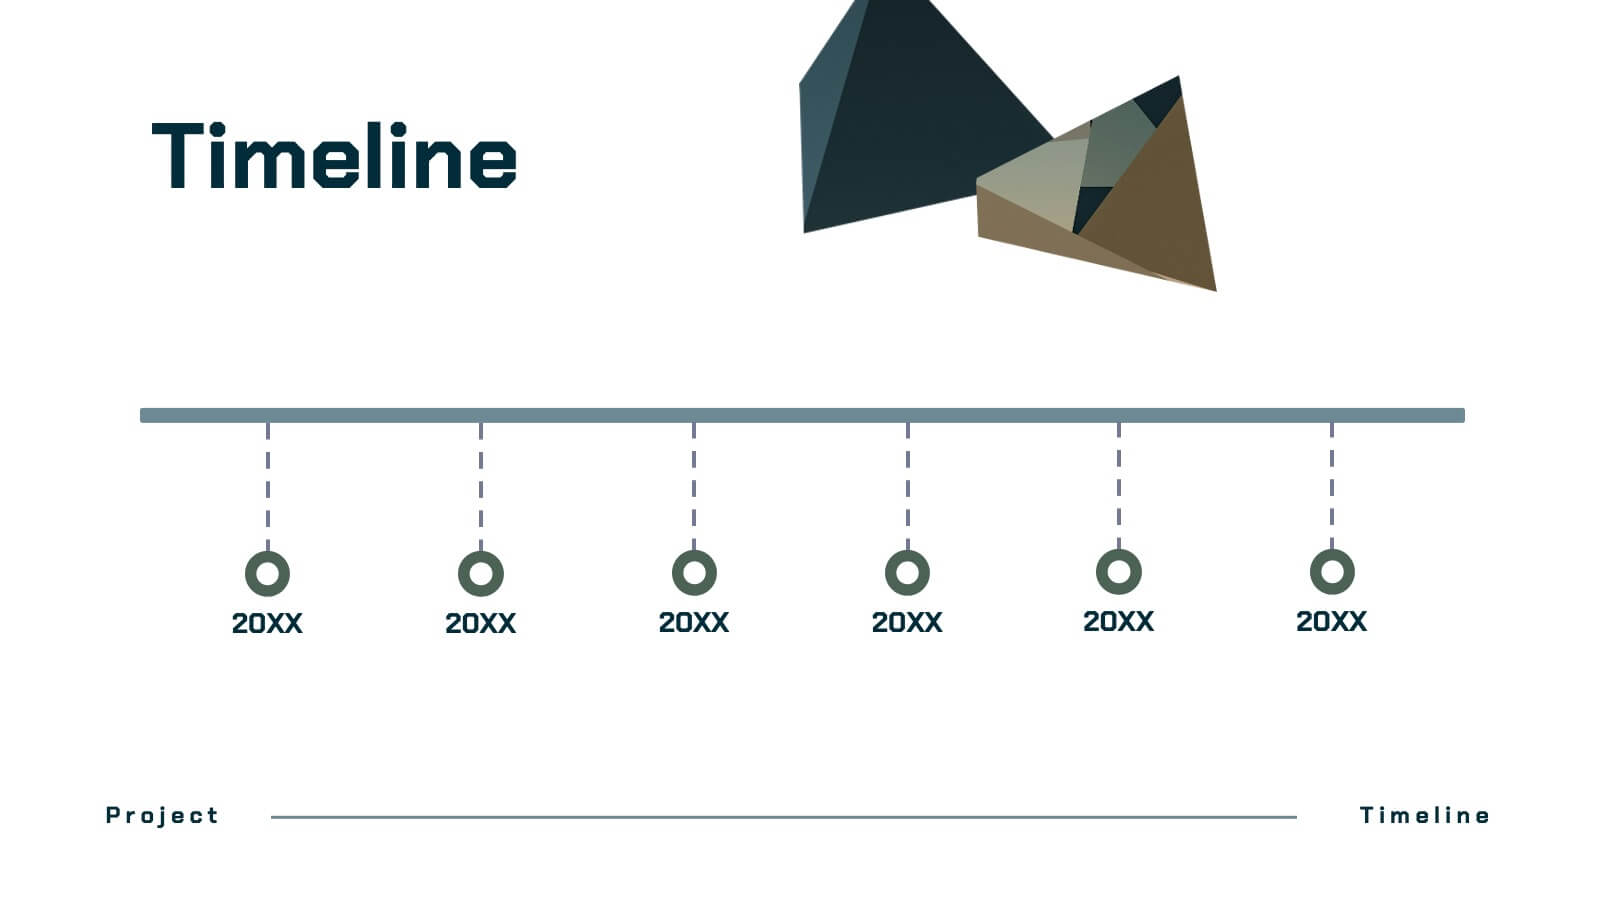
Sequential Roadmap Planning Timeline Presentation
Guide your audience through each milestone with the Sequential Roadmap Planning Timeline Presentation. This sleek layout is perfect for showing linear progress over time—ideal for strategic plans, product rollouts, or project phases. Each step is clearly marked with editable years and titles, ensuring clarity and easy customization. Fully compatible with PowerPoint, Google Slides, and Canva.


5 diapositivas
Hierarchical Pyramid Chart Presentation
Bring structure to your ideas with a clean, layered visual that makes complexity feel easy to navigate. This presentation helps you explain levels, priorities, and organizational breakdowns with clarity and flow. Ideal for planning, strategy, and reporting. Fully compatible with PowerPoint, Keynote, and Google Slides.


4 diapositivas
Team Collaboration Strategy
Illustrate cross-functional teamwork with this visually engaging slide. Featuring color-coded team clusters, it's perfect for showcasing group dynamics, collaborative workflows, or project responsibilities. Use this diagram to break down organizational units, collaboration models, or department contributions. Fully editable in PowerPoint, Keynote, and Google Slides.


6 diapositivas
Sales Strategy 30-60-90 Day Plan Presentation
Drive sales success with this structured 30-60-90 day strategy template! Designed to help sales teams and professionals set clear objectives, track progress, and optimize performance, this layout ensures a smooth transition from planning to execution. Fully customizable and compatible with PowerPoint, Keynote, and Google Slides for seamless presentations.


20 diapositivas
Lullabyne Design Portfolio Presentation
Showcase your creative work with this modern and professional design portfolio presentation. Covering essential elements like design briefs, mood boards, prototypes, and implementation plans, this template helps you present your work with clarity and style. Fully customizable and available for PowerPoint, Keynote, and Google Slides.


6 diapositivas
Business Ethics and Governance Presentation
Navigate the complexities of ethical decision-making with our Business Ethics and Governance Presentation template. This visually engaging tool highlights key aspects of corporate ethics and governance, ideal for workshops and training sessions. Compatible with PowerPoint, Keynote, and Google Slides, it's designed to facilitate clear and effective discussions.


7 diapositivas
Strategic Business Execution Playbook Presentation
Streamline your execution roadmap with this Strategic Business Execution Playbook. Featuring a sleek, step-by-step layout, it’s ideal for showcasing business stages, workflows, or strategic planning phases. Easy to customize in PowerPoint, Keynote, and Google Slides, this template helps teams visualize priorities and align goals with precision and clarity.


4 diapositivas
Corporate Governance Structure and Rules Presentation
Define leadership roles, responsibilities, and oversight with the Corporate Governance Structure and Rules Presentation. This minimalist bar-style layout is perfect for illustrating hierarchical influence, compliance levels, or board member functions. Each section can be fully edited to align with your company’s governance model, helping stakeholders visualize how power and accountability are distributed. Ideal for board meetings, corporate compliance reports, or executive briefings. Fully compatible with PowerPoint, Google Slides, and Keynote.


8 diapositivas
Success Strategy Triangle Presentation
Craft a winning strategy with the Success Strategy Triangle template. This structured design helps visualize key business components in a step-by-step format, making it ideal for growth planning, decision-making, and performance analysis. Fully customizable and easy to use, it’s compatible with PowerPoint, Keynote, and Google Slides for seamless integration.


5 diapositivas
Work Schedule Overview Presentation
Keep your week perfectly organized with this clean and modern layout designed to simplify planning and scheduling. Ideal for presenting weekly goals, tasks, or project timelines, it helps teams stay aligned and productive. Fully customizable and compatible with PowerPoint, Keynote, and Google Slides for effortless professional presentations.


20 diapositivas
Dynastream Project Timeline Presentation
Stay on track with this detailed and well-organized project plan presentation designed for success! Covering essential areas like scope, objectives, timeline, budget breakdown, and risk management, it ensures every aspect of your project is clear and actionable. Perfect for team meetings or stakeholder updates, this template is fully compatible with PowerPoint, Keynote, and Google Slides.


5 diapositivas
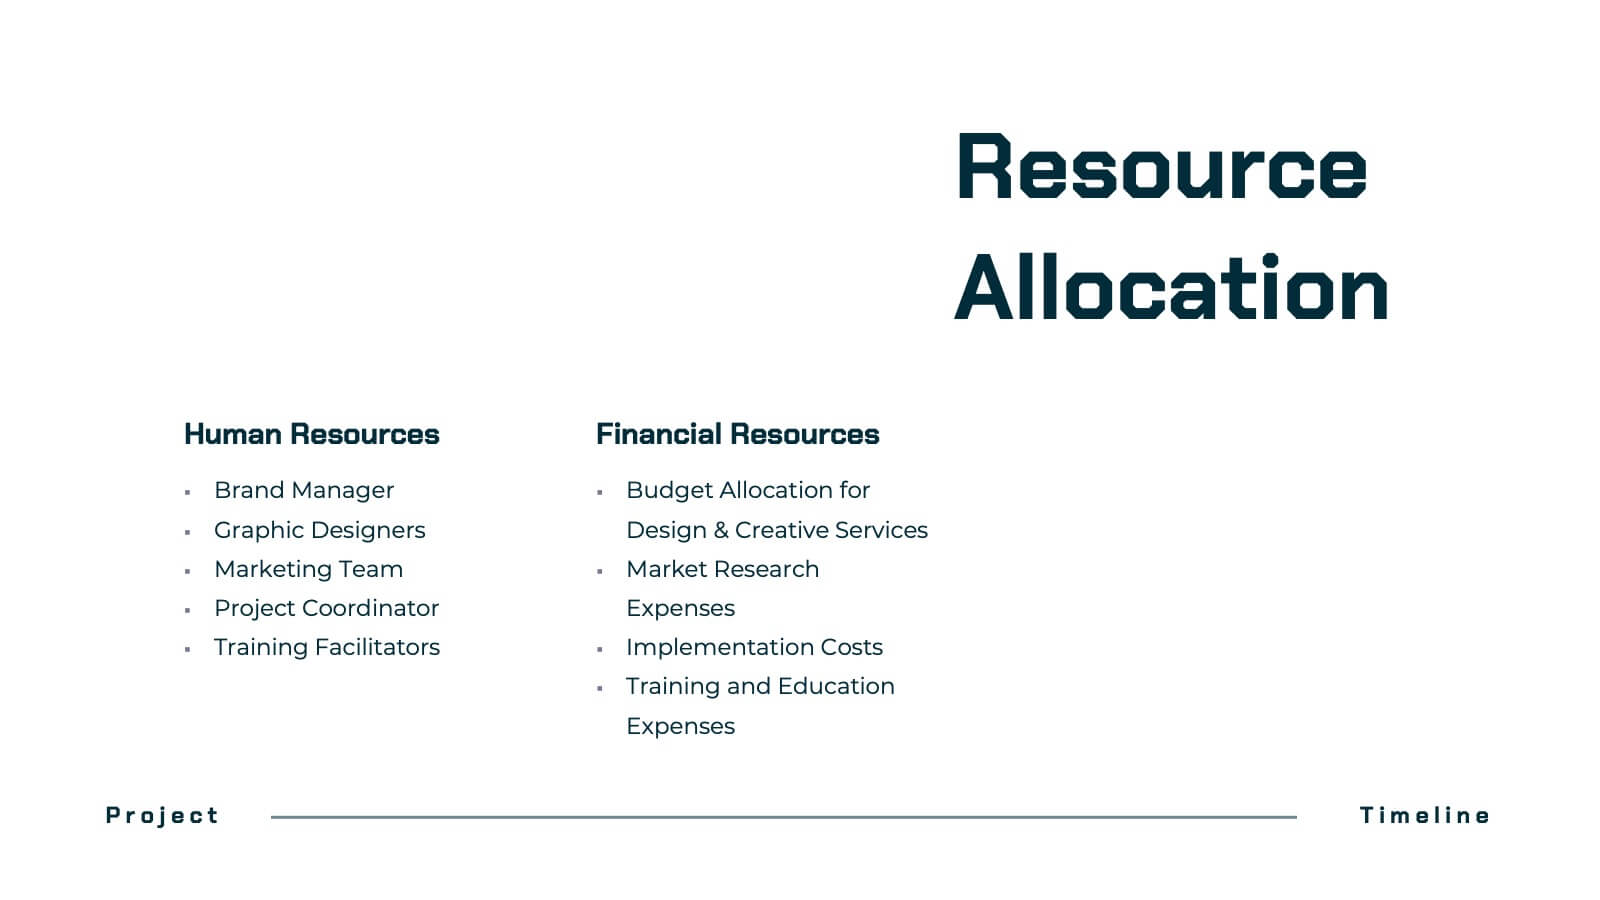
Project Task Allocation Chart Presentation
Track project progress with this clear Task Allocation Chart. Assign team members, visualize task completion, and streamline planning in one editable slide. Perfect for managing responsibilities across departments or sprints, this layout keeps teams aligned. Fully customizable in PowerPoint, Keynote, and Google Slides for professional and agile teams.


5 diapositivas
Fashion History Infographics
Fashion History is a rich and fascinating study that allows us to appreciate the artistry, craftsmanship, and cultural significance of clothing and style. These infographic templates explore the evolution of fashion over time. These templates are designed to present key milestones, trends, and influential figures in fashion history in a concise and engaging manner. The color scheme, icons, and illustrations included help these serve as visually captivating resources for anyone interested in the evolution of fashion. Perfect for fashion history presentations, museum exhibitions, or any occasion where you want to share the rich and diverse history of fashion.


6 diapositivas
Lean Business Canvas Framework
Simplify your business strategy with the Lean Business Canvas Framework Presentation. This slide offers a structured layout to map out key elements like partners, activities, value propositions, customer segments, and revenue streams—all in one view. Ideal for startups, business plans, or internal strategy sessions. Fully editable in PowerPoint, Keynote, and Google Slides.


4 diapositivas
Social Media Calendar Overview
Stay organized and consistent with your posting schedule using the Social Media Calendar Overview Presentation. This clean, visual weekly planner helps you map out daily content across multiple categories with color-coded bullets and structured columns from Monday to Sunday. Perfect for content teams, marketers, and freelancers managing multi-platform campaigns. Fully customizable in PowerPoint, Keynote, and Google Slides.


24 diapositivas
Petricor UX Strategy Plan Presentation
This UX Strategy Presentation offers a structured approach to user experience design, covering key aspects such as user research, wireframing, prototyping, and usability guidelines. With sections on branding, responsive design, and accessibility, this template is ideal for UX professionals. Fully editable and compatible with PowerPoint, Keynote, and Google Slides.