


Características


¿Tienes alguna pregunta?
Recomendar


6 diapositivas
Defining Project Scope
Visualize your project's key components with this sleek hexagonal layout, perfect for outlining milestones, deliverables, and priorities. This six-part diagram helps teams align goals and clarify scope early in the process. Ideal for PMs, strategists, and consultants. Fully editable in PowerPoint, Keynote, and Google Slides.


5 diapositivas
Digital Marketing Strategy Roadmap
Visualize your marketing initiatives step-by-step with this clean, arrow-driven roadmap design. Ideal for showcasing campaign planning, funnel stages, or content rollouts, this slide helps keep your strategy clear and easy to follow. Fully editable and compatible with PowerPoint, Keynote, and Google Slides.


5 diapositivas
Demographic Segmentation Analysis Presentation
Bring your insights to life with a clean, engaging layout that simplifies complex audience data into clear, visual segments. This presentation helps you explain key patterns, compare group behaviors, and communicate strategic decisions with confidence. Fully editable and compatible with PowerPoint, Keynote, and Google Slides.


4 diapositivas
Business SWOT Evaluation Presentation
Break down business strategies with this visually structured SWOT analysis layout. Present strengths, weaknesses, opportunities, and threats in a clean, quadrant-style format. Ideal for reports, pitches, or internal reviews. Fully editable in PowerPoint, Keynote, and Google Slides for clear, impactful analysis that drives smarter decision-making and strategic alignment.


6 diapositivas
Corporate Health Metrics Dashboard Presentation
Take the pulse of your workplace with this dynamic health dashboard presentation layout. Designed to visualize employee wellness data, activity levels, and corporate health KPIs, this template blends clarity and creativity for impactful reporting. Easily customizable and fully compatible with PowerPoint, Keynote, and Google Slides to fit your presentation needs.


6 diapositivas
Milestones Technologies Infographics
Highlight significant milestones in technology with our Milestones Technologies infographic template. This template is fully compatible with popular presentation software like PowerPoint, Keynote, and Google Slides, allowing you to easily customize it to showcase pivotal moments and achievements in the world of technology. The Milestones Technologies infographic template offers a visually engaging platform to chronicle and celebrate key technological advancements, innovations, and breakthroughs throughout history. Whether you're a tech enthusiast, educator, or simply interested in technological progress, this template provides a user-friendly canvas to create informative presentations and educational materials. Deepen your appreciation for the impact of technology with this SEO-optimized Milestones Technologies infographic template, thoughtfully designed for clarity and ease of use. Customize it to highlight milestones across various fields, from computing and telecommunications to space exploration and biotechnology, making it a valuable resource for sharing the history of technology with your audience. Start crafting your personalized infographic today to explore the remarkable journey of technological progress.


4 diapositivas
Educational Infographic Slide Presentation
Ignite curiosity from the very first slide with a clear, classroom-style visual that makes explanations feel simple and engaging. This presentation helps break down lessons, key concepts, or training points in a way audiences instantly understand. Clean layouts keep the focus on your message. Fully compatible with PowerPoint, Keynote, and Google Slides.


8 diapositivas
Tourism Strategy and Location Guide Presentation
Planning a strategy that inspires wanderlust? This sleek presentation template helps organize global tourism goals with location-based insights, iconic visuals, and easy-to-edit layout sections. Perfect for destination marketing, regional analysis, or travel business pitches. Fully compatible with PowerPoint, Keynote, and Google Slides for effortless editing and impactful delivery.


23 diapositivas
Pomona Business Plan Presentation
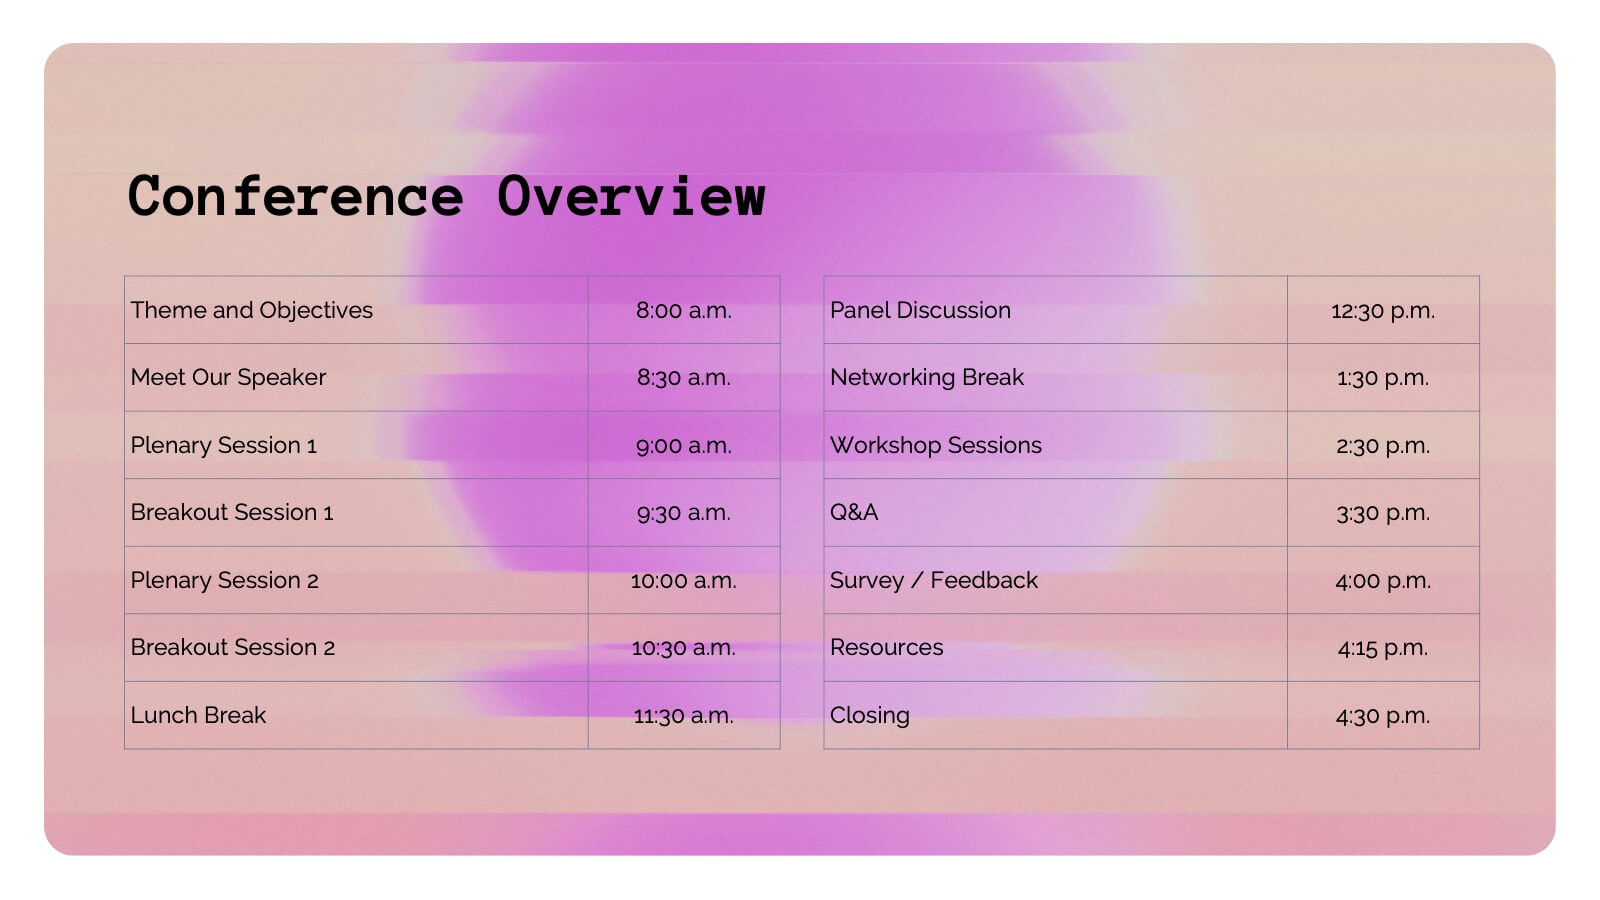
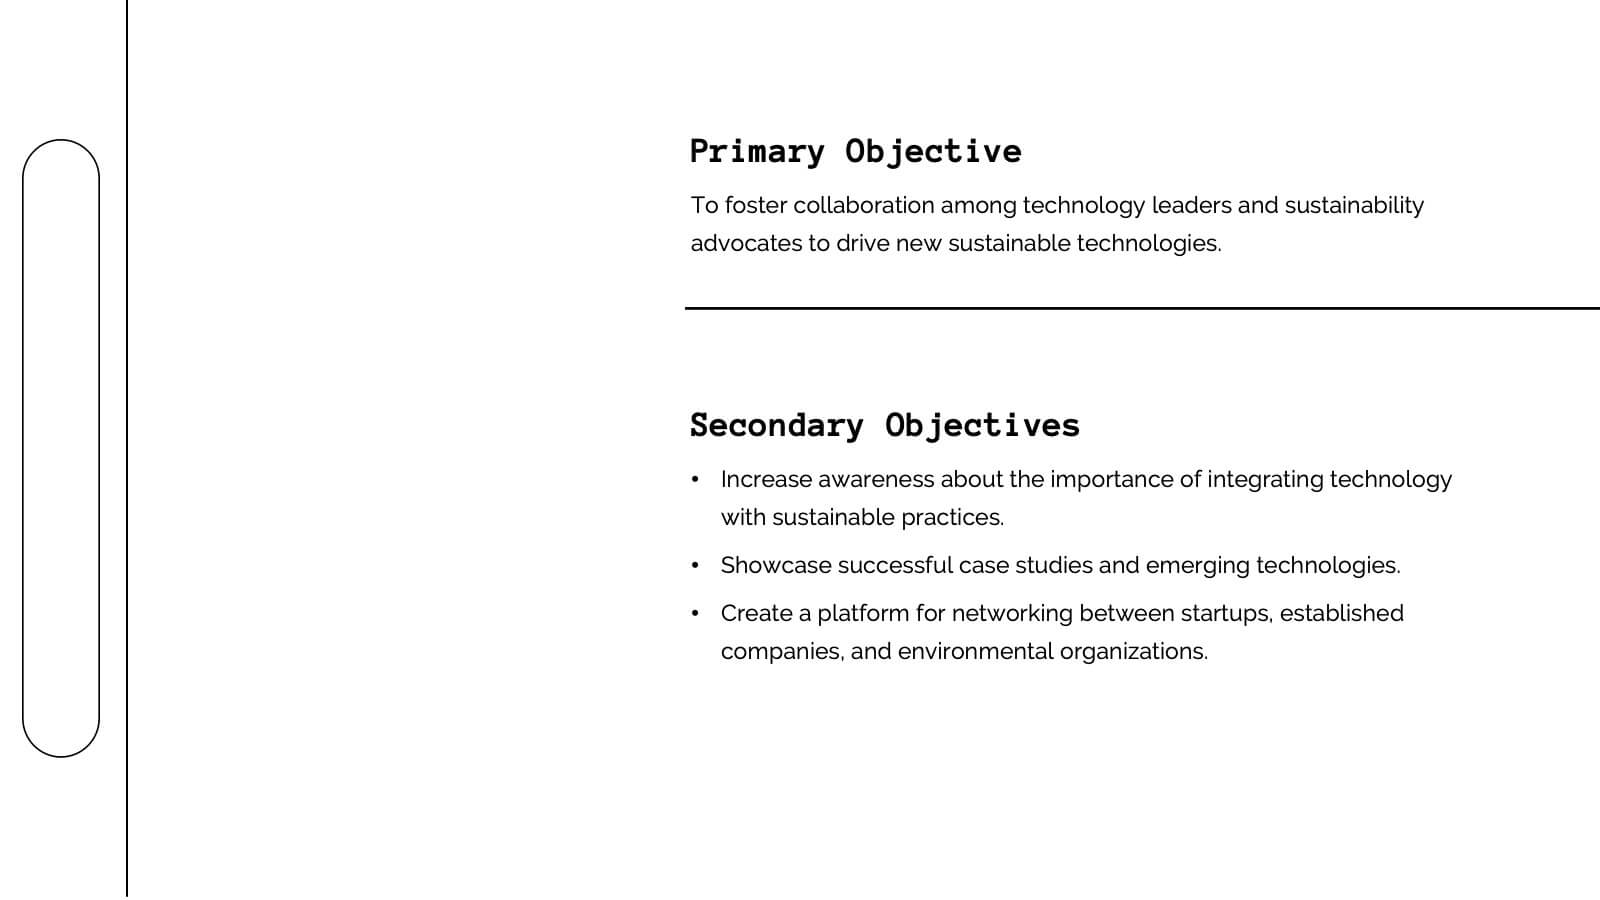
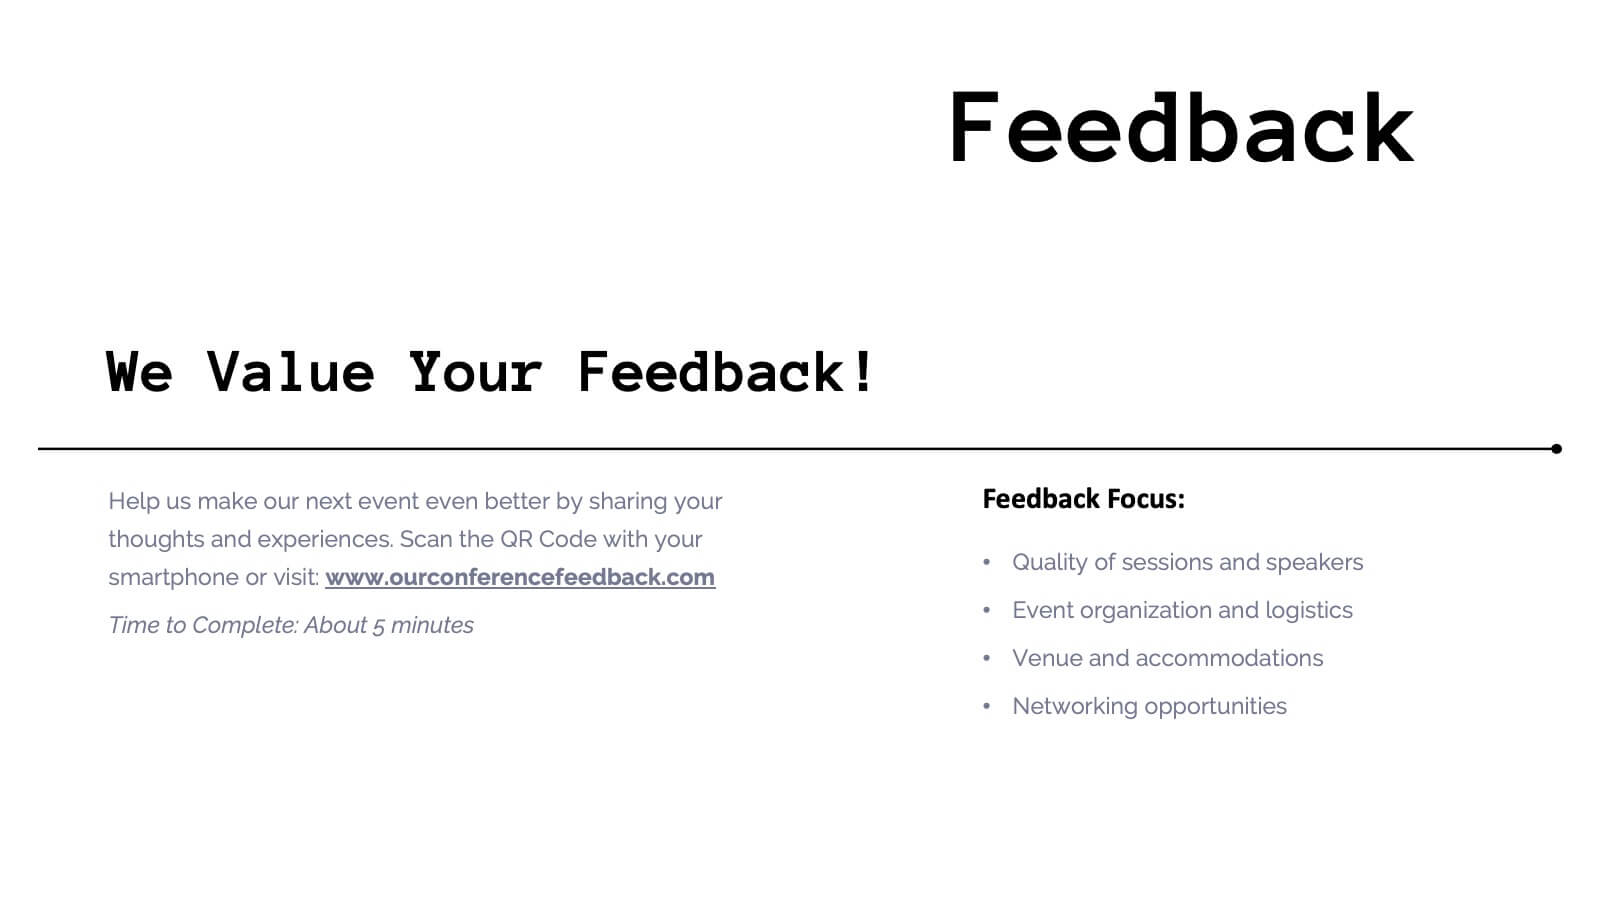
This vibrant and adaptable event agenda template is perfect for organizing your business conference or corporate event. It includes customizable sections for session details, speaker information, and key activities like networking breaks, workshops, and panel discussions. Compatible with PowerPoint, Keynote, and Google Slides, it ensures a smooth and engaging event presentation experience!


7 diapositivas
Tables of Content Samples Infographic Presentation
A Table of Content is an essential tool that improves the accessibility and organization of a document or book, and enhances its overall professionalism. This table of contents template is an excellent way to organize your information. This template is fully editable, which allows you to easily change colors and fonts, and add or delete components from the design. The slides are designed to be easily updated with new information, allowing you to keep the presentation fresh and up-to-date. Each template has a high quality design that is compatible with powerpoint, Keynote and Google Slides.


7 diapositivas
Creative Cloud Infographic
A cloud infographic is a graphical representation or visual aid that presents information, data, or concepts related to cloud computing in a clear, engaging, and easily understandable manner. The goal of our creative cloud infographic is to simplify complex concepts related to cloud computing, making it easier for the audience to grasp the fundamental ideas and advantages associated with utilizing cloud-based services and technologies. This template is a valuable tool for both educating individuals about cloud computing and aiding decision-making processes when considering cloud solutions for businesses or projects.


5 diapositivas
Product and Service Benefits Slide
Highlight your value offerings with this clean, 4-column benefits layout. Each box provides space for an icon, title, and concise description—ideal for comparing features, services, or product advantages. Fully editable in PowerPoint, Keynote, and Google Slides to match your brand style.


7 diapositivas
Data Analysis Process Infographic
Illuminate the intricacies of the data-driven world with our Data Analysis Process Infographic. Set against the crisp backdrop of white and accented with the brilliance of yellow, the growth-centric green, and the depth of blue, our template brings clarity to the complex realm of data analytics. Outfitted with sharp infographics, intuitive icons, and adaptable image placeholders, it translates raw data into actionable insights. Exquisitely crafted for Powerpoint, Keynote, or Google Slides. A crucial tool for data scientists, business analysts, strategists, or any organization looking to harness the power of data. Analyze with precision; let every slide unravel the stories data tells.


4 diapositivas
Funding & Investor Startup Presentation
Present your investment strategy with clarity and impact using this triangle diagram slide. Ideal for showcasing the relationship between key funding stages, investor types, or business milestones, this layout offers a clean structure with labeled nodes (A, B, C) and supporting icons. Fully editable in PowerPoint, Keynote, and Google Slides for seamless customization.


7 diapositivas
Gantt Chart Management Infographic
Elevate your project planning with our gantt chart management infographic. Laid out on a pristine white backdrop and highlighted with the professional shades of blue, regal purple, energetic red, and growth-centric green, this template is the epitome of structured time management. Equipped with illustrative infographics, symbolic icons, and dedicated image placeholders, it breaks down project timelines and tasks with immaculate precision. Immaculately tailored for Powerpoint, Keynote, or Google Slides. An invaluable asset for project managers, team leaders, corporate trainers, or anyone aiming for meticulous time tracking and project progression.


8 diapositivas
Business Challenge and Issue Definition Presentation
Break down complex problems with clarity using this Business Challenge and Issue Definition presentation. Designed to highlight key issues step by step, this layout helps your audience follow your reasoning with ease. Ideal for internal reviews or strategy alignment, it’s fully editable in Canva, PowerPoint, and Google Slides.


6 diapositivas
Bitcoin and Blockchain Technology Overview Presentation
Break down complex blockchain systems into digestible visuals with this sleek overview slide. Featuring six color-coded icons around a secure lock illustration, it’s ideal for explaining blockchain architecture, bitcoin components, or crypto processes. Fully editable in PowerPoint, Keynote, and Google Slides for seamless customization.