


Características


¿Tienes alguna pregunta?
Recomendar


6 diapositivas
First-Time Buyer Tips Infographic
Navigate the thrilling world of first-time purchases with our "First Time Buyer Tips" Infographic Template. This vibrant tool is crafted to guide newcomers through the buying process with clarity and confidence. Each slide is a step-by-step beacon, illuminating the path with expert advice, from understanding budgeting basics to mastering negotiation tactics. Designed with the novice buyer in mind, this template features a series of easy-to-follow visuals and succinct tips that demystify the complexities of making major purchases. The clean, engaging design ensures that each piece of advice is both accessible and memorable, ideal for personal finance websites, real estate blogs, or consumer education workshops. Customize the color schemes, fonts, and layouts to align with your branding, making it a seamless addition to your educational materials. Equip your audience with the knowledge they need to make informed, confident decisions with this indispensable guide.


5 diapositivas
Human Body Anatomy Diagram Presentation
Bring your content to life with a clean, modern visual that makes learning feel surprisingly engaging. This presentation breaks down key body systems in a simple, approachable way, helping you explain functions, processes, or health concepts with clarity. Perfect for medical training, wellness education, or anatomy lessons. Fully compatible with PowerPoint, Keynote, and Google Slides.


4 diapositivas
IT Security Infrastructure Overview Presentation
Lock in your audience's attention with a clean, modern visual that breaks down tech barriers. This presentation template offers a snapshot of critical IT security components—think firewalls, cloud infrastructure, and data safeguards—making it easier to explain complex systems. Fully editable and compatible with PowerPoint, Keynote, and Google Slides for effortless customization.


27 diapositivas
Drift Rebranding Project Plan Presentation
Transform your brand with this comprehensive rebranding project template! Perfect for presenting brand identity, market analysis, and strategic positioning, it includes slides for logos, color palettes, and brand guidelines. Engage your audience with visually striking designs and detailed content. Compatible with PowerPoint, Keynote, and Google Slides for easy, professional presentations on any platform.


21 diapositivas
Parthenon Marketing Proposal Template Presentation
Create an impactful marketing proposal with this vibrant and modern presentation template! Covering key sections such as industry overview, consumer behavior, social media strategies, and emerging technologies, it helps you present your marketing insights with style. Fully customizable and perfect for data-driven marketing plans, this template is compatible with PowerPoint, Keynote, and Google Slides for seamless presentation delivery.


10 diapositivas
5-Level Circular Diagram Presentation
Visualize complex concepts with this professional 5-Level Circular Diagram template. Perfect for business strategies, project planning, and hierarchical structures, it provides a clear, layered approach. Fully editable and compatible with PowerPoint, Keynote, and Google Slides, this design ensures a polished, impactful presentation with structured, easy-to-understand visuals.


5 diapositivas
Benefits of Good Nutrition Infographics
Good Nutrition is crucial for overall health, disease prevention, weight management, mental well-being, energy levels, and various other aspects of our physical and mental health. These vertical infographic templates can be used to present the importance and advantages of maintaining a healthy and balanced diet. These are designed to educate and inspire individuals to make informed choices about their nutrition and overall well-being. Perfect for educational presentations, nutrition workshops, wellness programs, or health-related websites, these templates provide valuable information and visual aids to promote better nutrition choices.


6 diapositivas
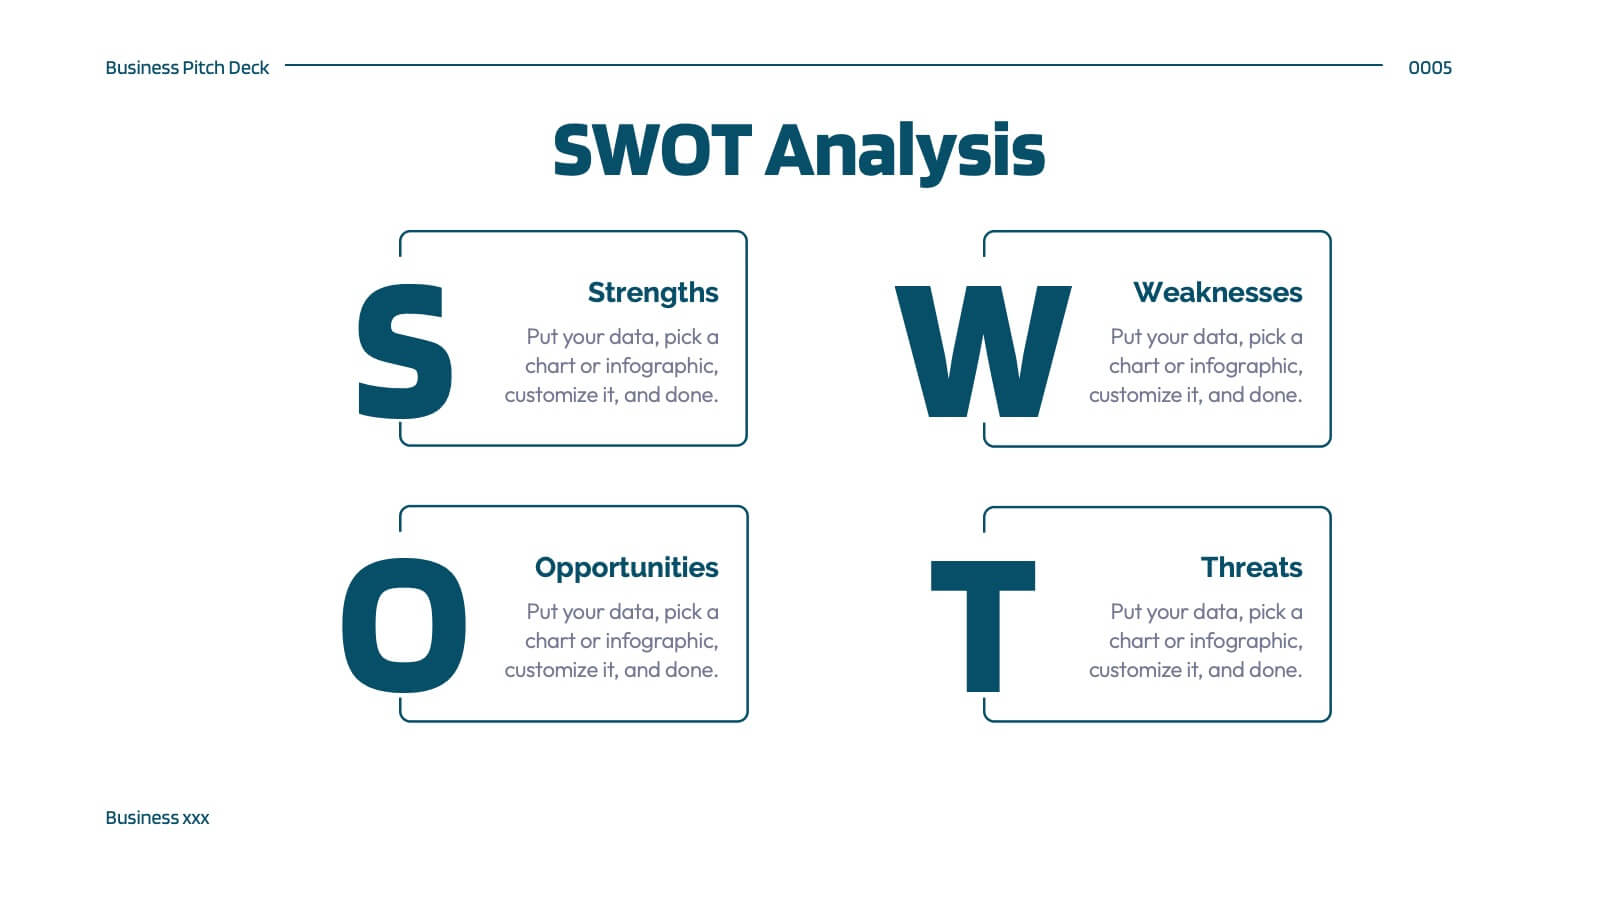
Sales SWOT Infographic
SWOT analysis is a strategic planning framework used to evaluate the strengths, weaknesses, opportunities, and threats of a business, project, or situation. This infographic template will help you analyze the strengths, weaknesses, opportunities, and threats of a business, project, or idea. The template is designed to assist individuals or teams in conducting a SWOT analysis, a strategic planning tool used to assess the internal and external factors that can impact an organization's success. This template effectively communicates the outcomes of a SWOT analysis in a clear and concise manner, enabling informed decision-making and strategy development.


22 diapositivas
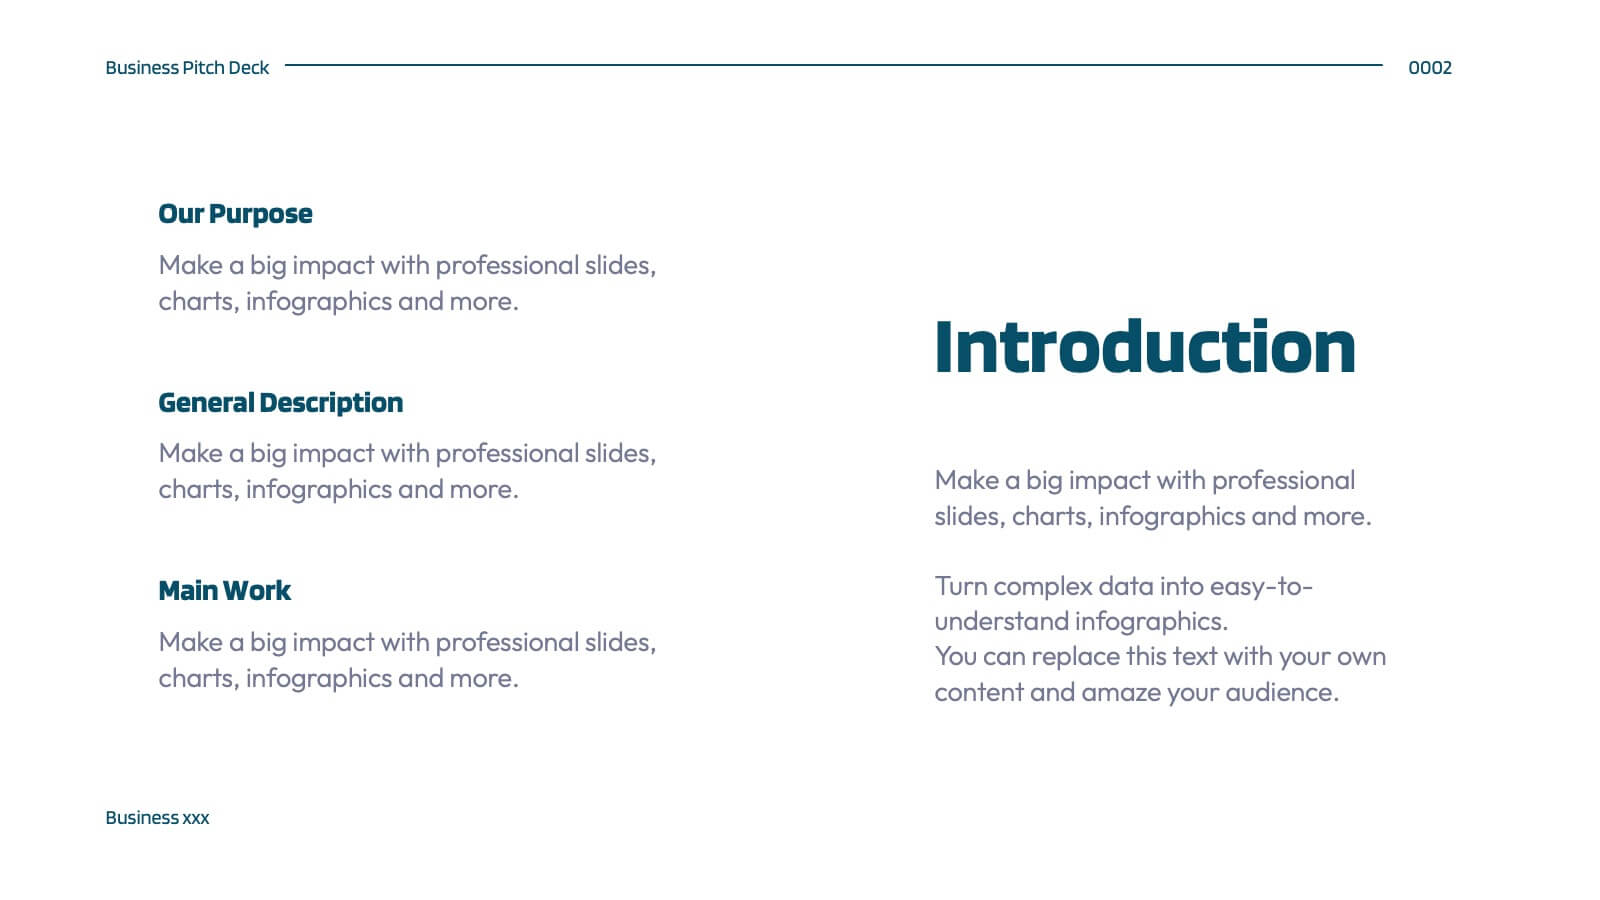
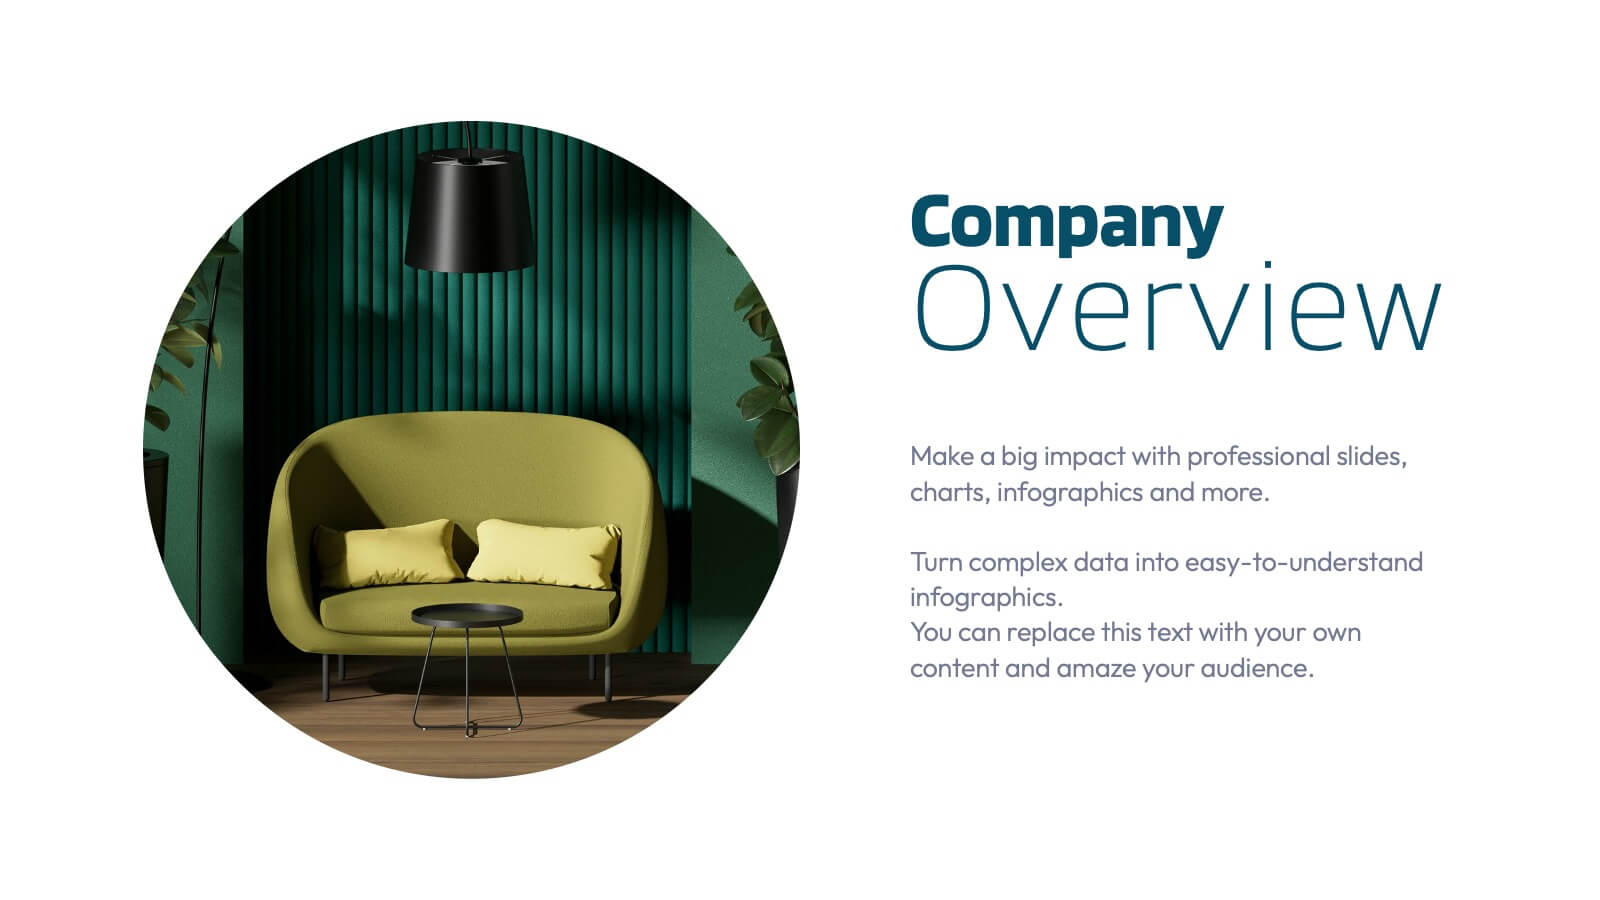
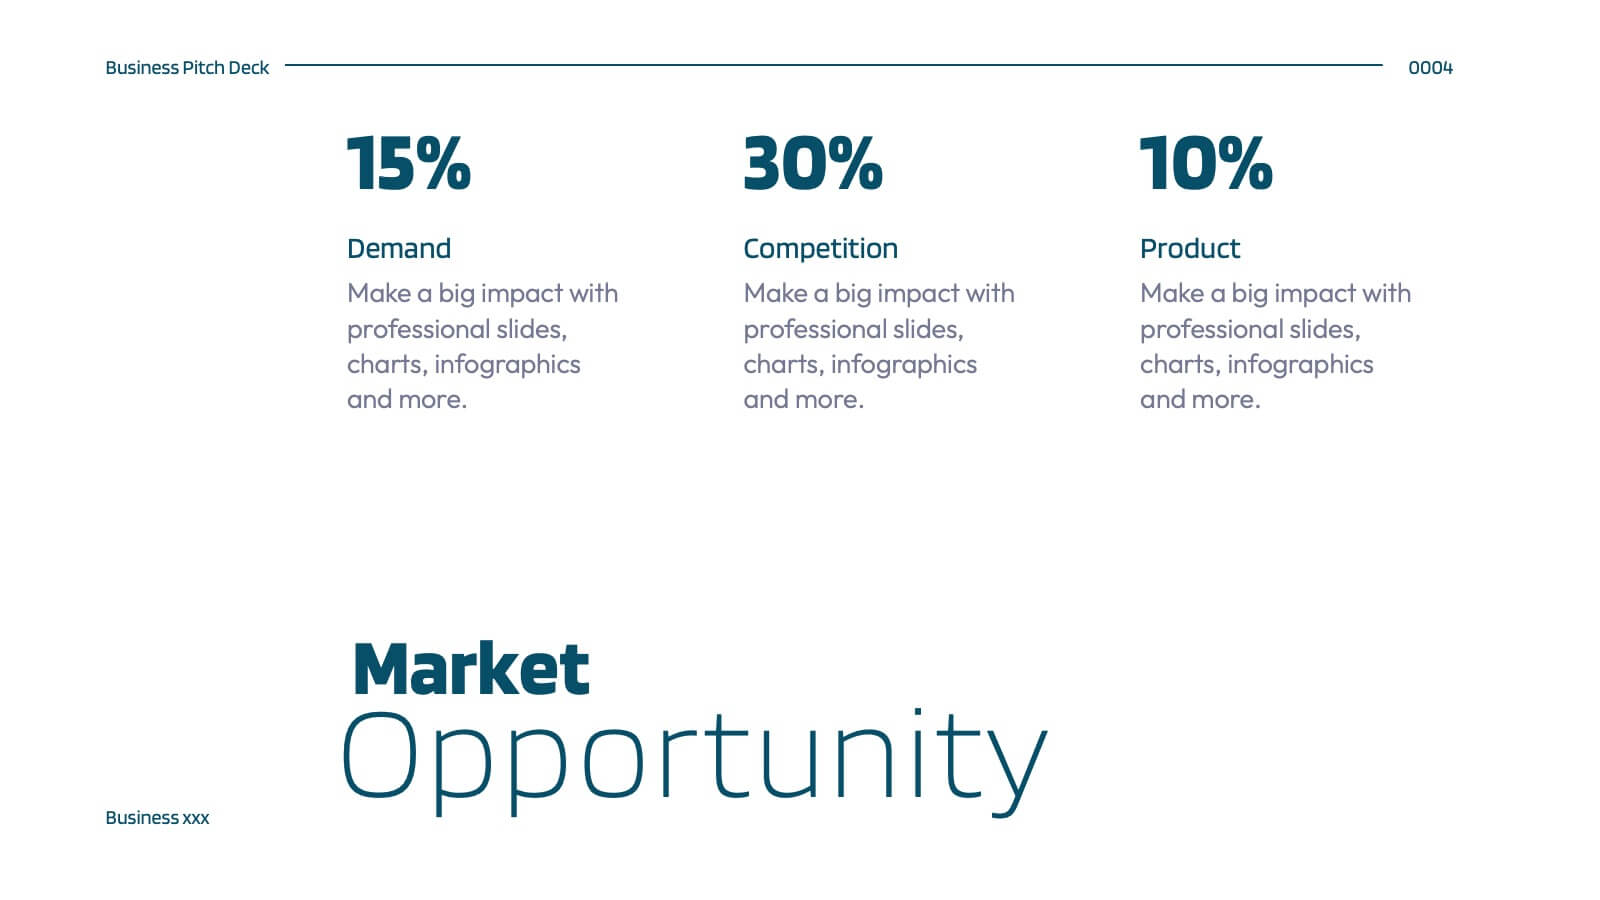
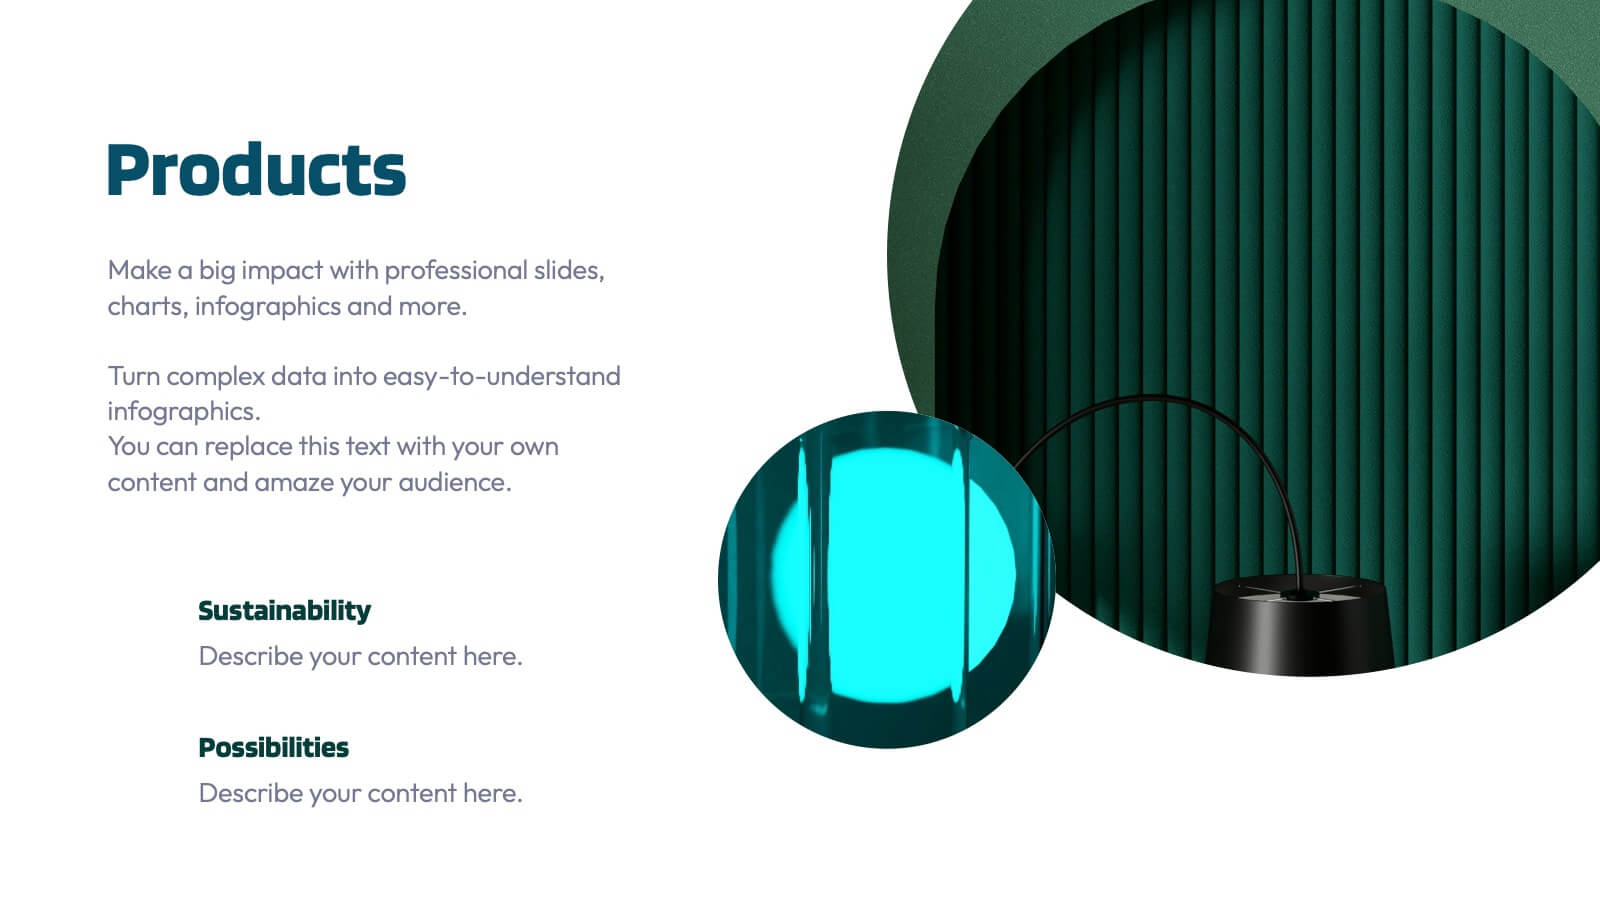
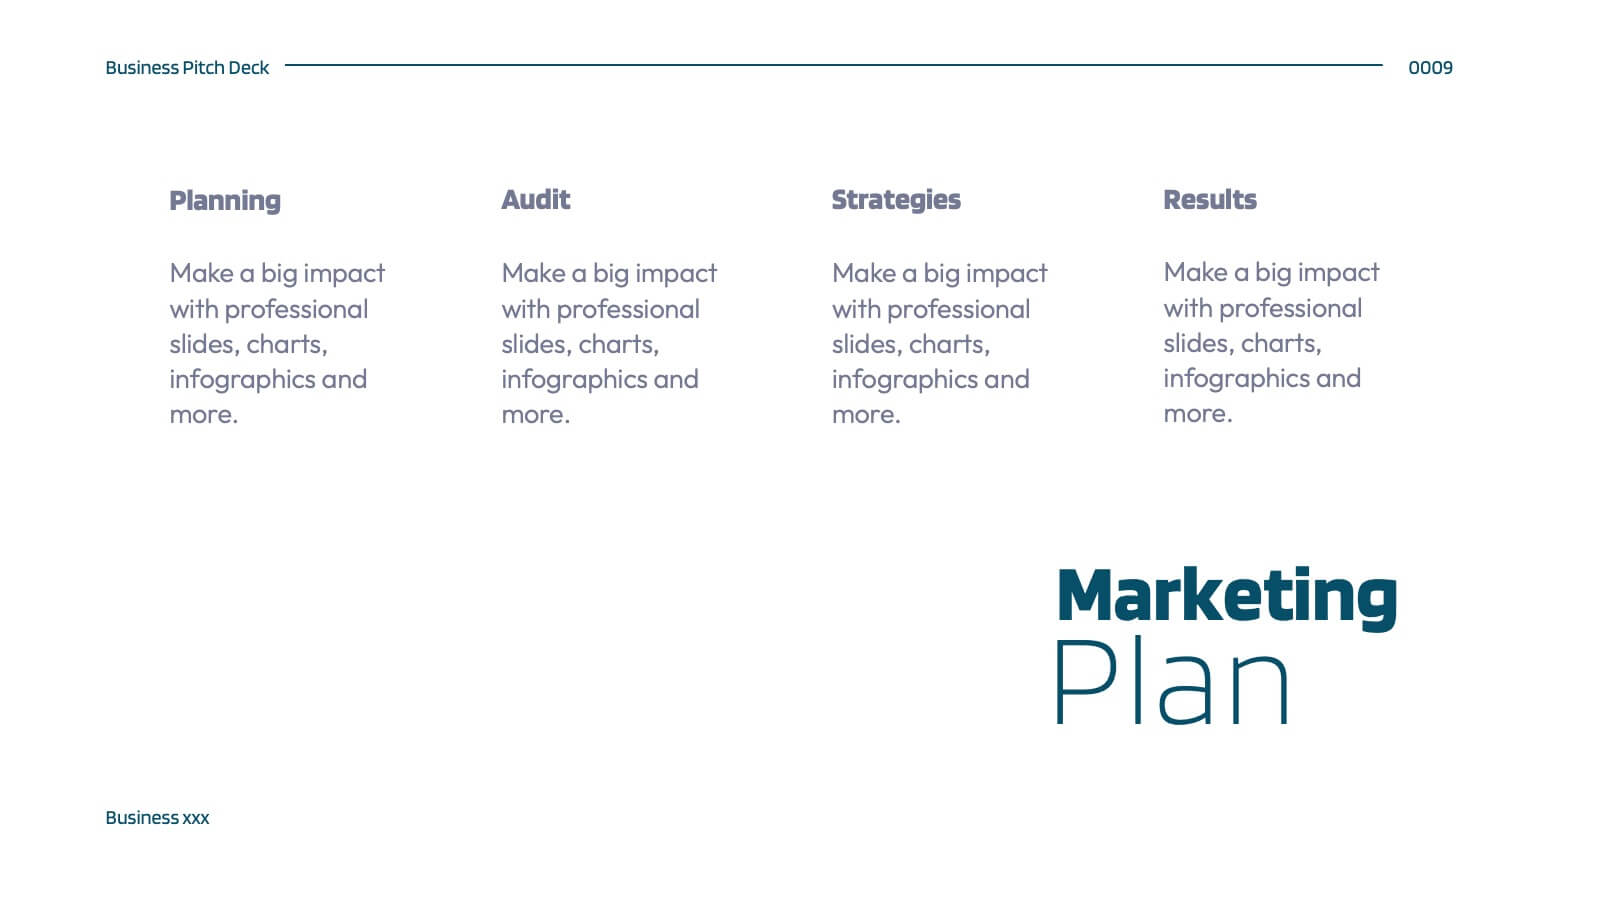
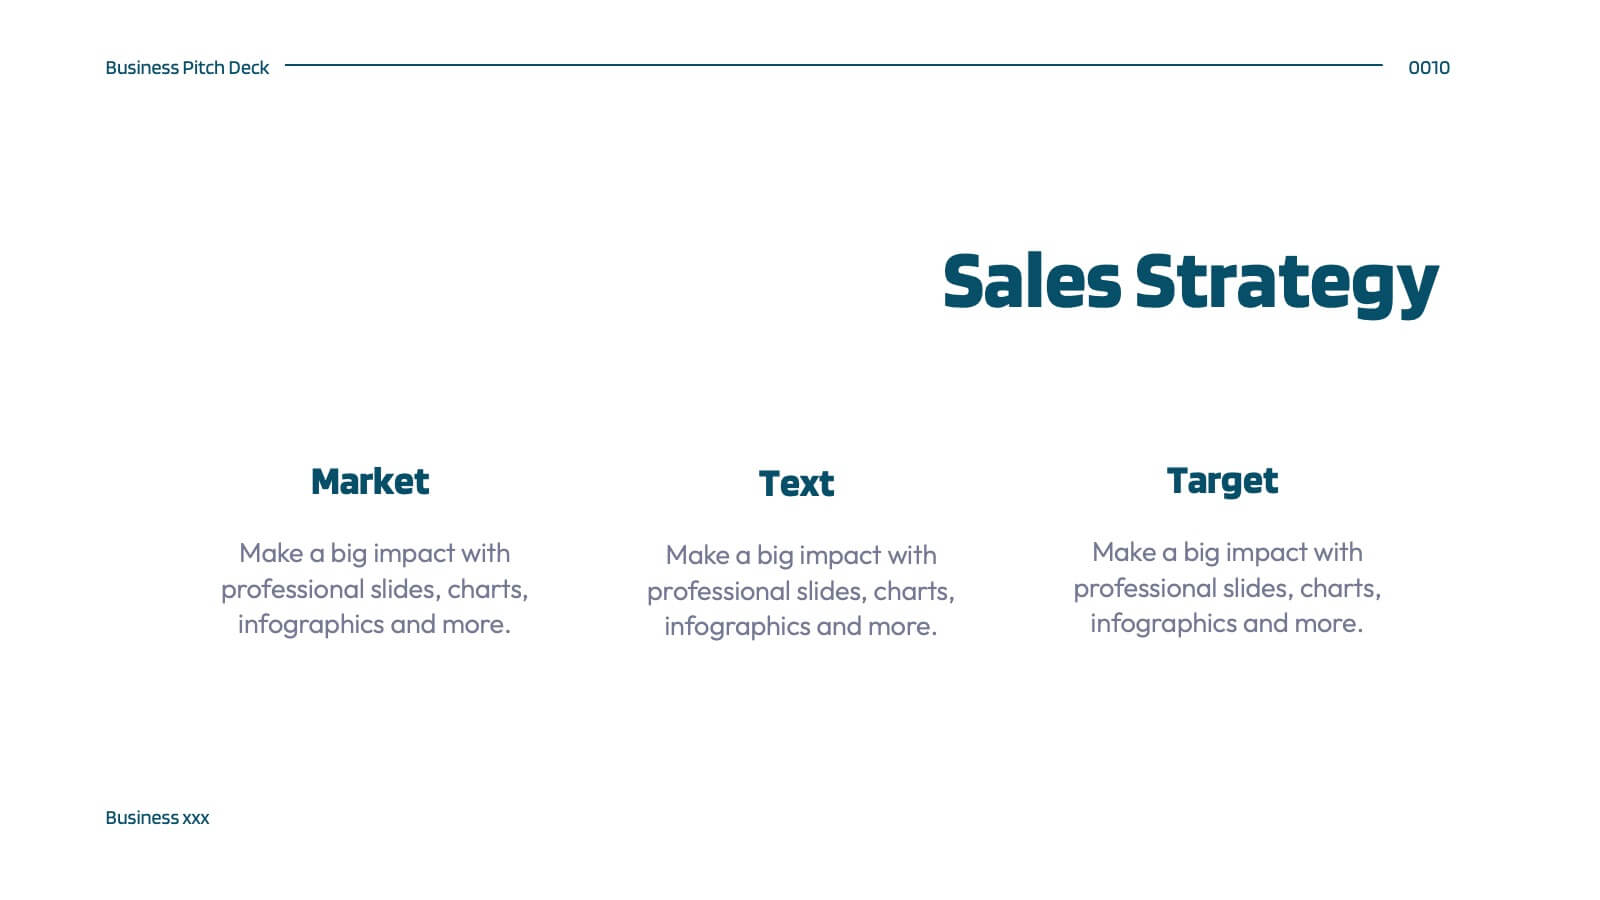
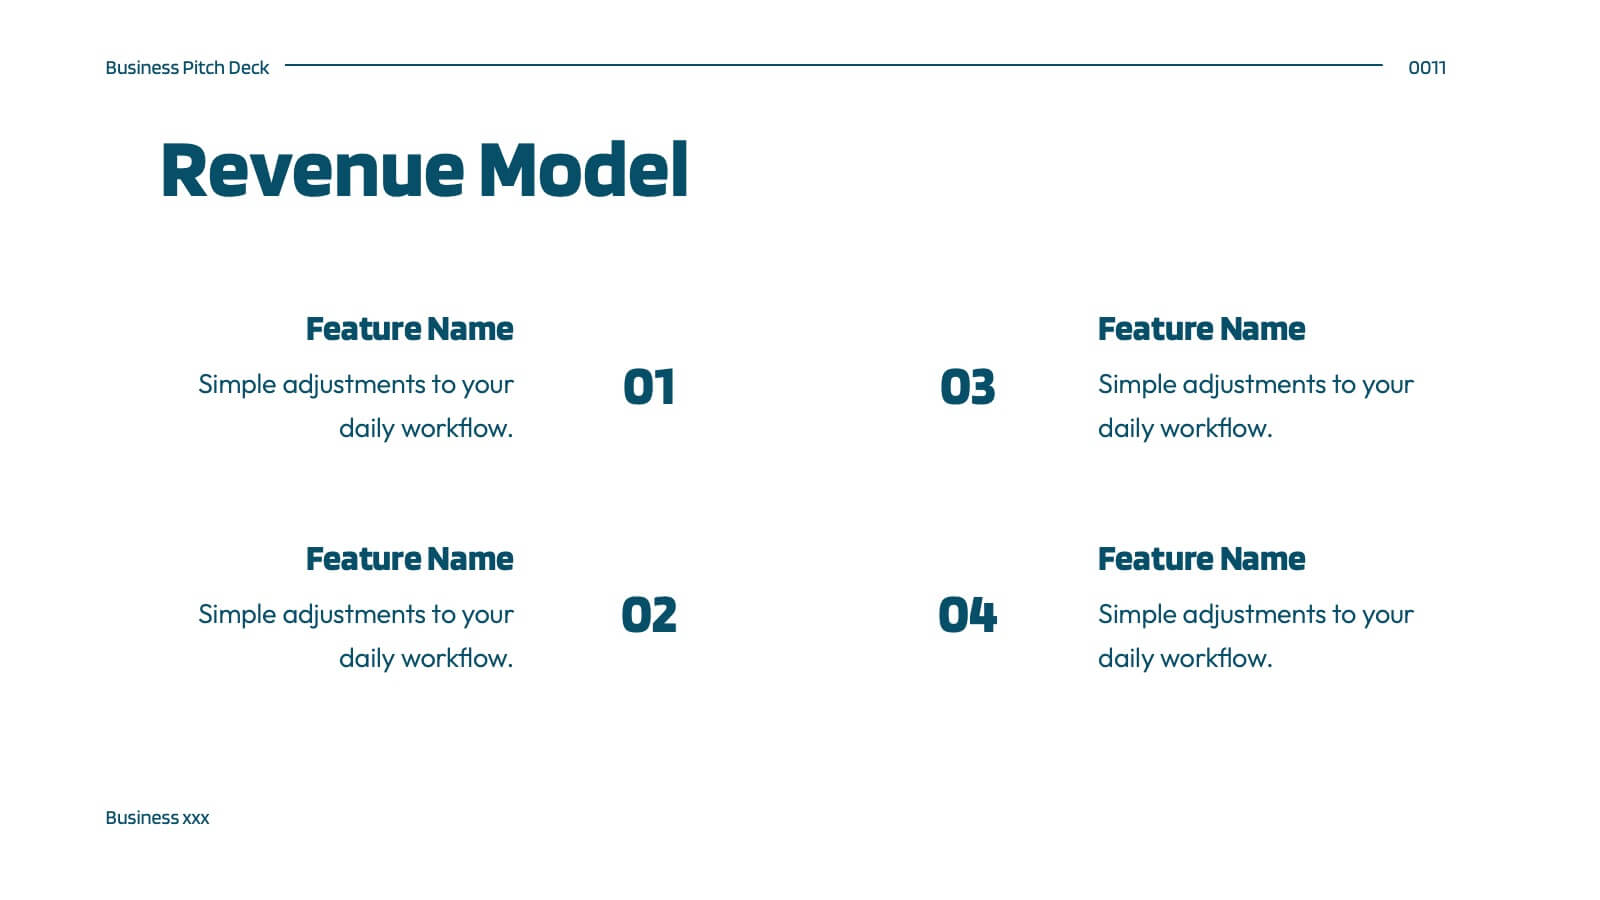
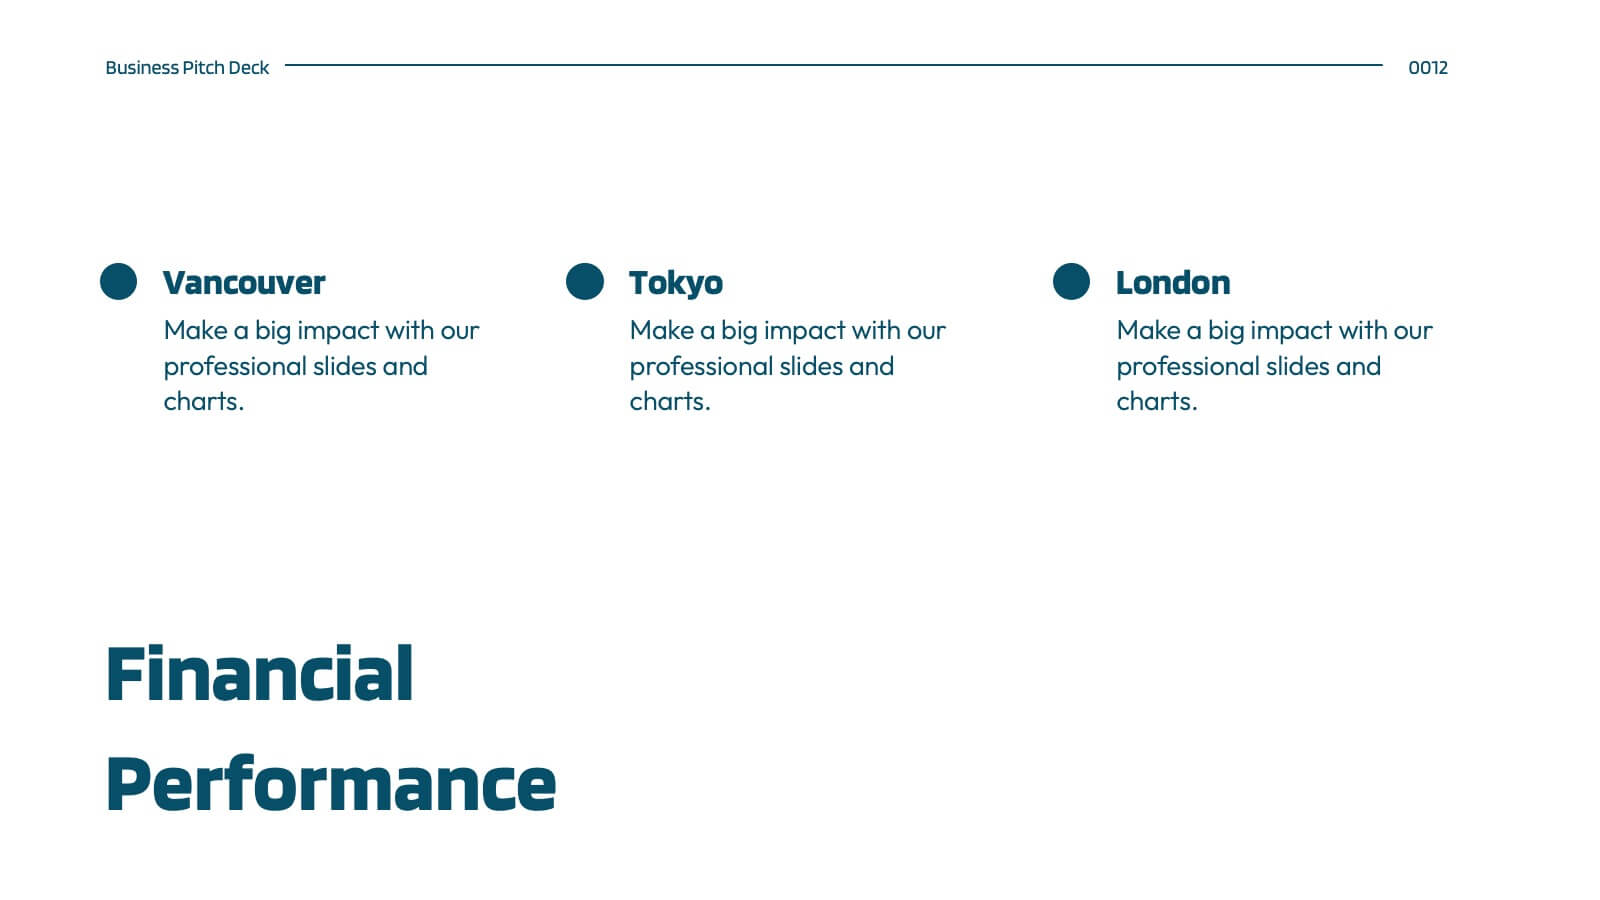
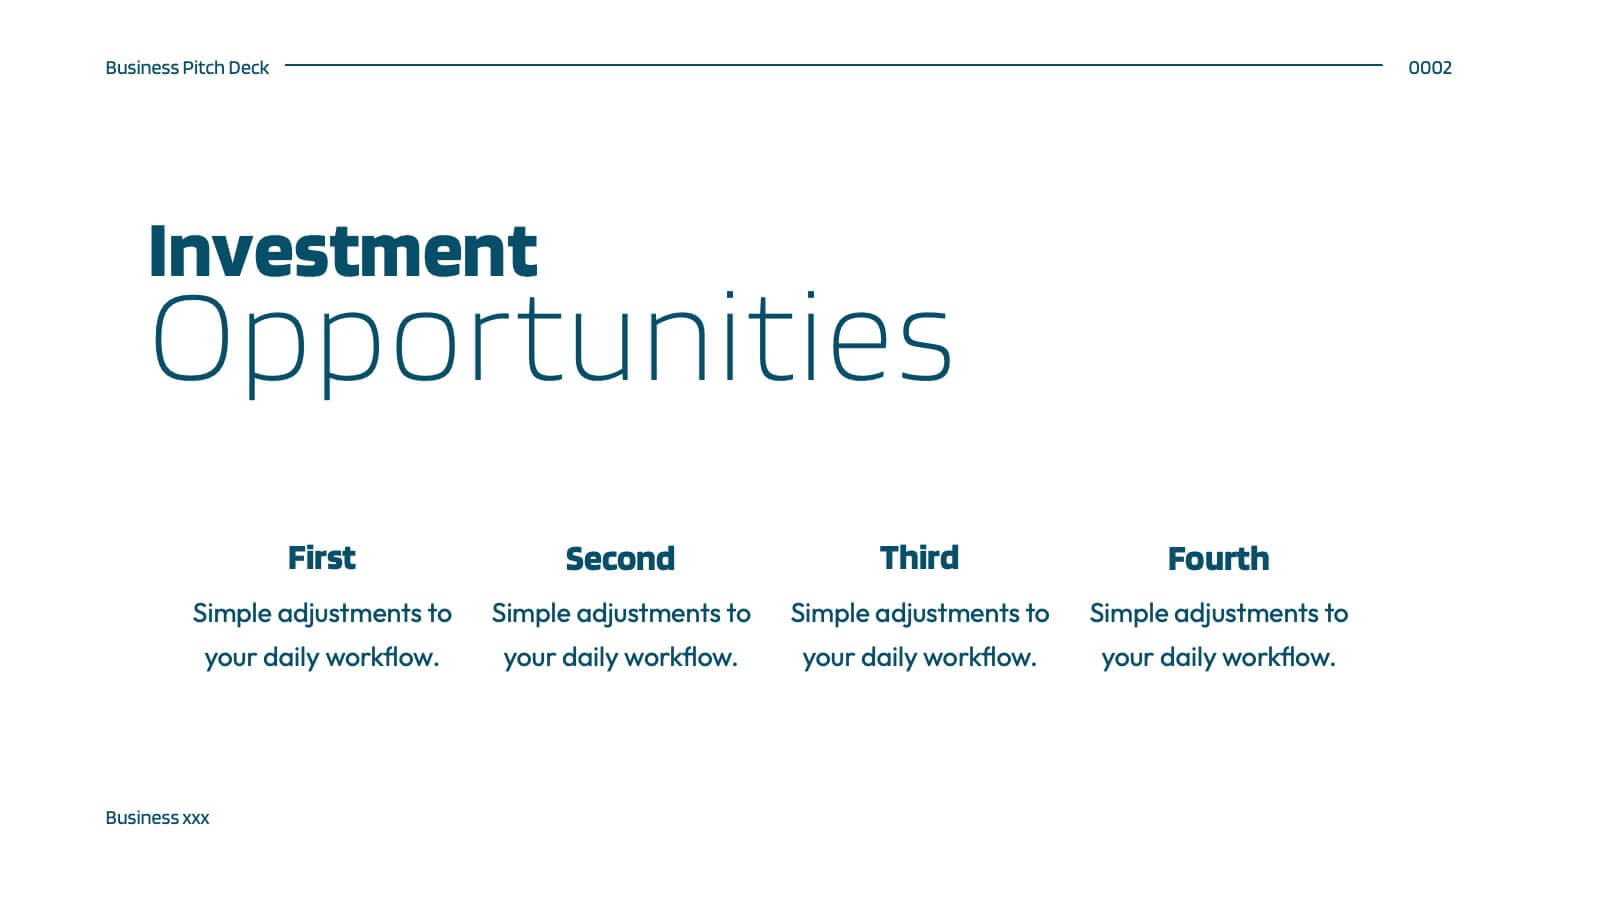
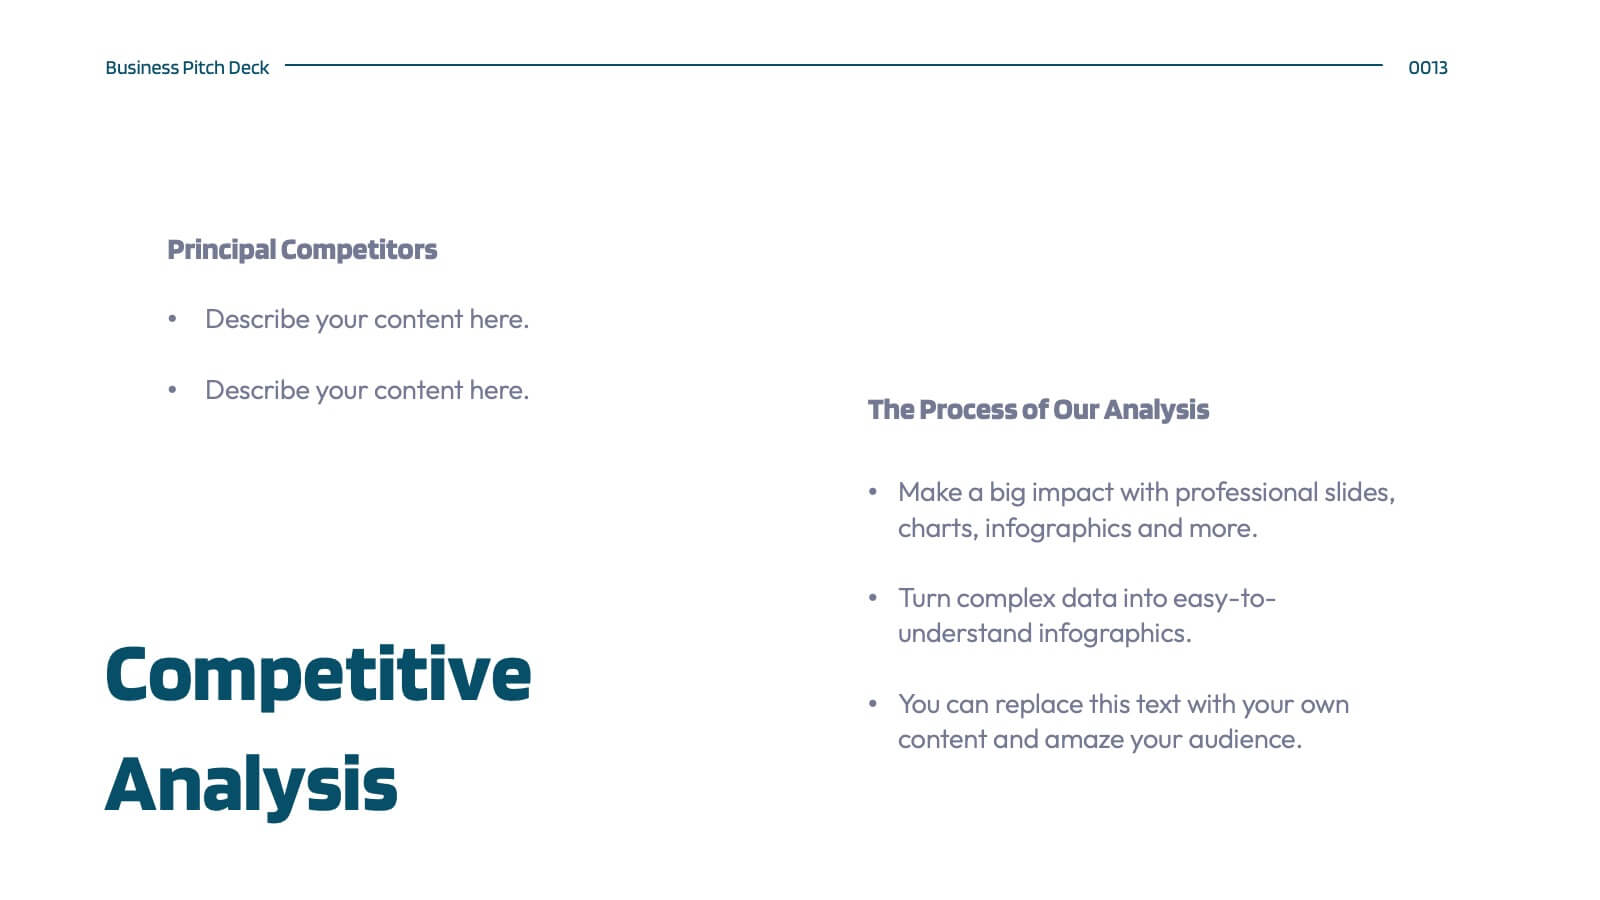
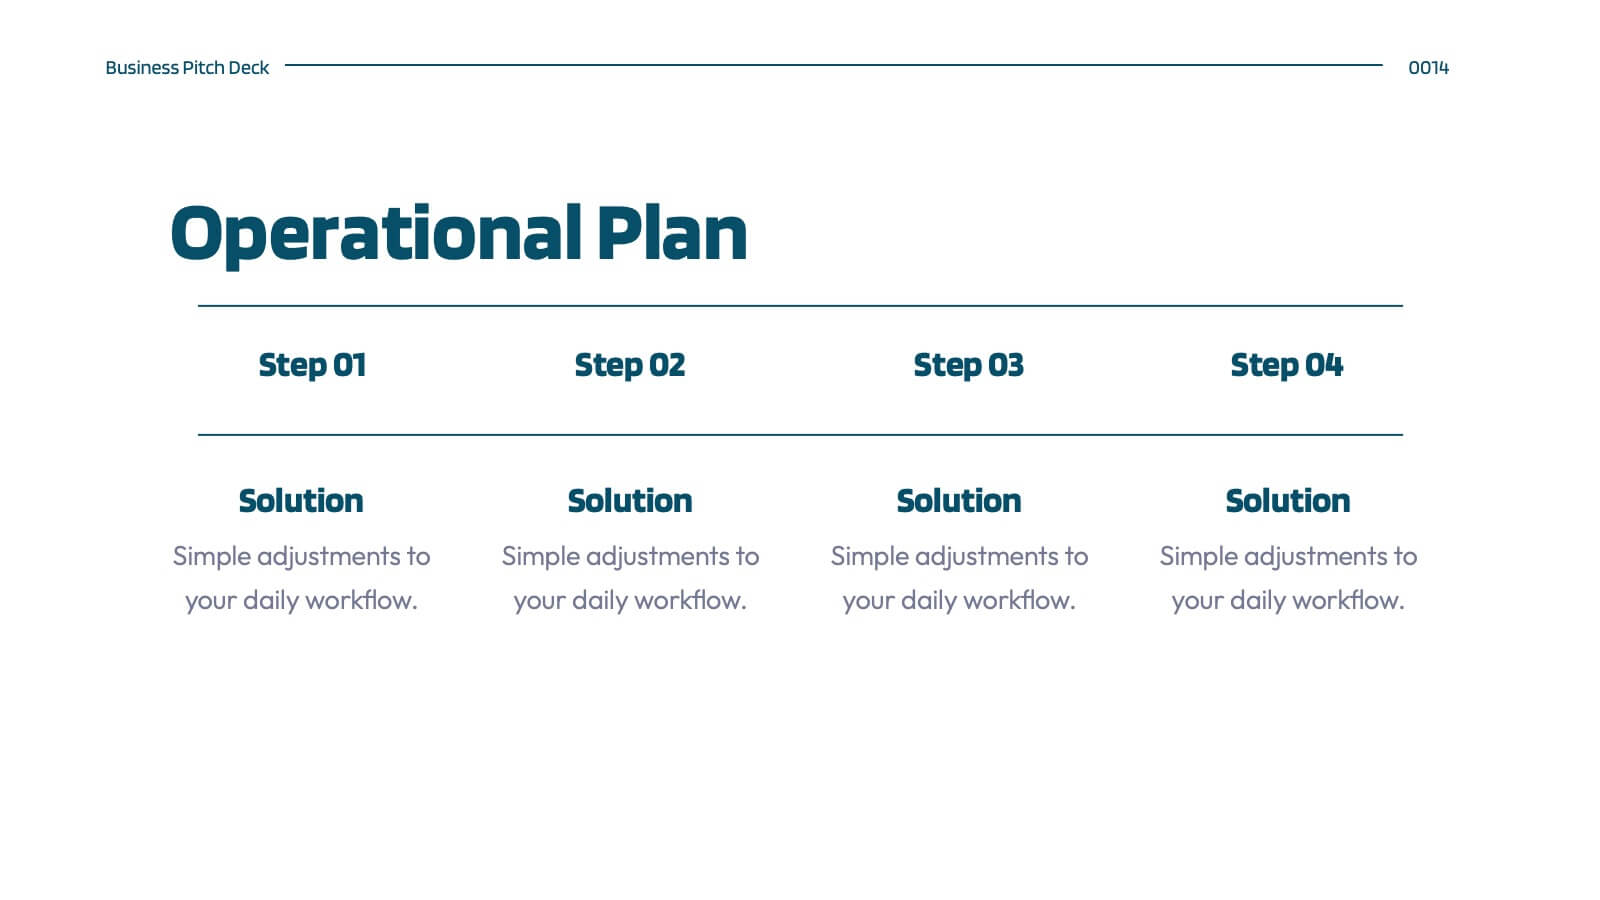
Hellenic Small Business Pitch Deck Presentation
Unleash the spirit of entrepreneurship with this captivating Hellenic-themed presentation! Designed specifically for small business pitches, this template allows you to showcase your business concept, market analysis, and financial plans with elegance and clarity. Its vibrant visuals will engage your audience and leave a lasting impression. Compatible with PowerPoint, Keynote, and Google Slides.


3 diapositivas
Financial Planning and Budget Forecast Presentation
Present your financial goals with clarity using the Financial Planning and Budget Forecast Presentation. This modern, minimalist layout helps you break down percentage allocations, forecast future spending, and visualize budget insights with eye-catching graphics. Perfect for finance teams, startups, and consultants. Fully customizable in PowerPoint, Google Slides, Keynote, and Canva.


7 diapositivas
Circle Process Infographic
A Circle Process is a method used to involve a group of people in problem-solving and decision-making. The process is based on a circle shape, where everything is in a circle facing each other. The template includes vibrant colors and circle process charts that you can customize to make just right for your project. This template is perfect for any project or presentation school or business related. This circle process template works with Powerpoint, Keynote, and Google Slides, so you can use it on any device. This template is great for teamwork, community building, and conflict resolution.


5 diapositivas
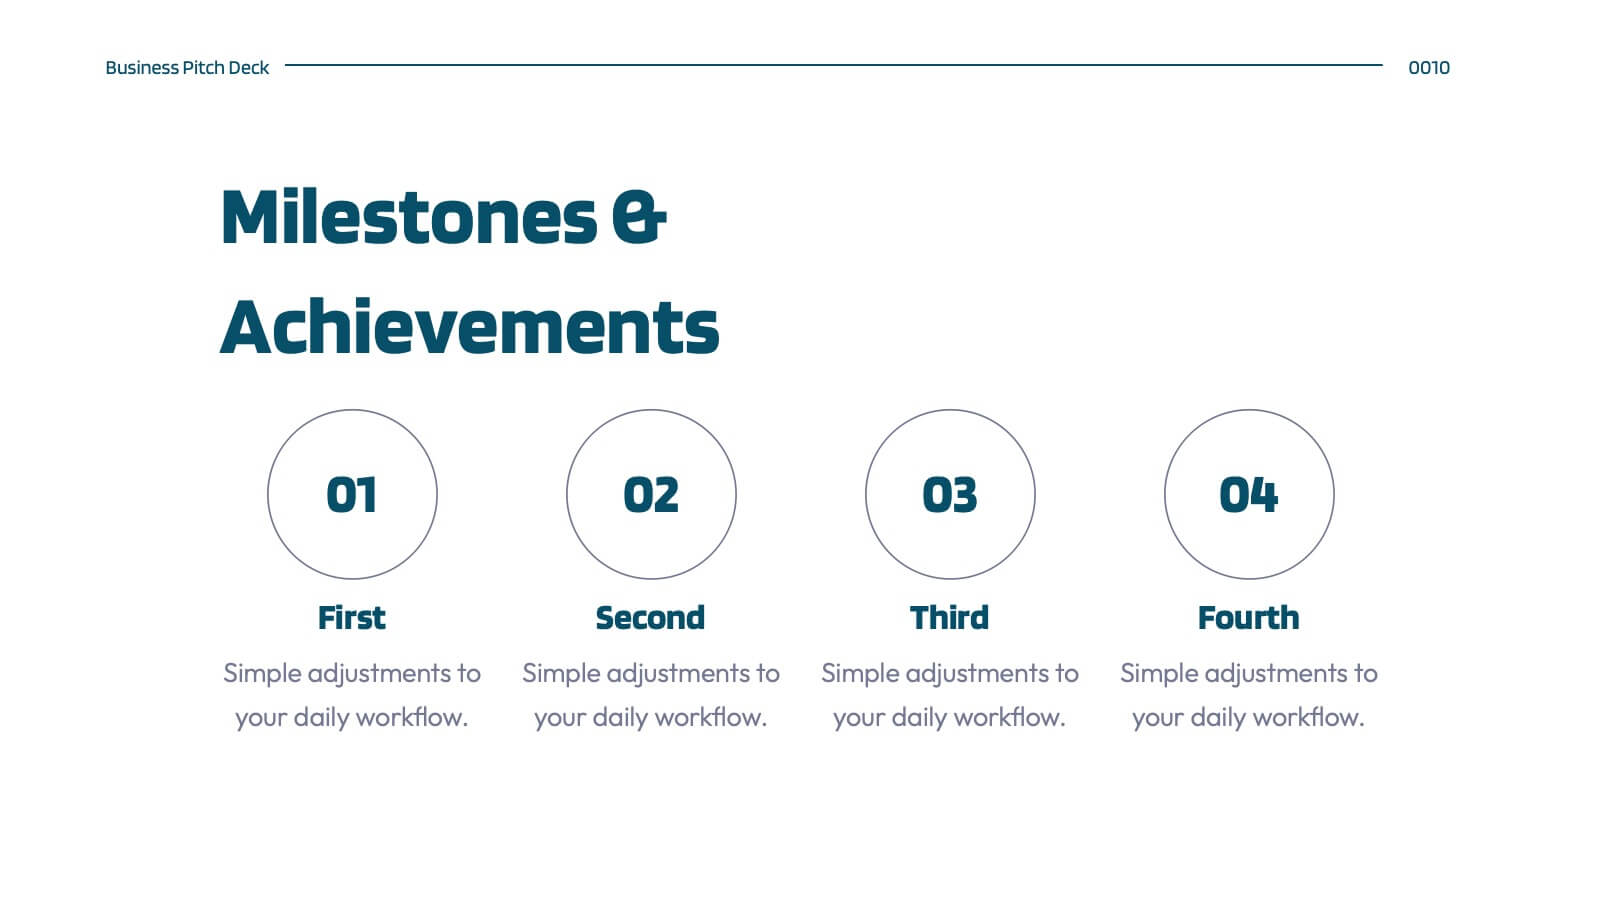
Product Roadmap Presentation
The "Product Roadmap Infographic" template is ideal for presenting the strategic vision and progressive steps for product development. This template outlines the roadmap through a creative and visually engaging route-style layout, designed to highlight key milestones and stages in the product lifecycle, from conception to launch. Each point on the roadmap is clearly marked for specific goals or achievements, encouraging clarity and understanding among stakeholders about the direction and progress of the product. This layout is perfect for product managers and teams to communicate timelines, prioritize tasks, and align goals during presentations in corporate settings.


4 diapositivas
Layered Pyramid Structure Diagram Presentation
Break down your data into visual layers with this Layered Pyramid Structure Diagram presentation. Ideal for showing proportions, hierarchies, or step-based processes, each pyramid tier is color-coded and labeled with editable titles and percentage values. Fully customizable in Canva, PowerPoint, and Google Slides to match your business or educational needs.


5 diapositivas
Corporate Annual Report Insights Presentation
Showcase Your Corporate Success! The Corporate Annual Report Insights Presentation delivers financial highlights, key performance indicators, and strategic insights in a structured, visually appealing format. Ideal for executives and stakeholders, this template ensures clarity and professionalism. Fully customizable and compatible with PowerPoint, Keynote, and Google Slides, it enhances impactful business storytelling.


5 diapositivas
Behavioral Psychology Insights Presentation
Dive deep into the human mind with our 'Behavioral Psychology Insights' presentation template. Perfect for educators and professionals, this template offers a structured way to present complex psychological concepts visually. Ideal for delivering engaging presentations on human behavior, it is compatible with PowerPoint, Keynote, and Google Slides.


4 diapositivas
Problem Tracing with Fishbone Diagram Presentation
Identify root causes clearly with the Problem Tracing with Fishbone Diagram Presentation. This template features a horizontal, fish-shaped layout with six categories represented in vertical columns, helping you trace issues back to their source. Ideal for quality control, brainstorming, and strategic reviews. Fully editable in PowerPoint, Keynote, and Google Slides.


6 diapositivas
1-Page Executive Summary Slide Presentation
Bring clarity to complex updates in a single, colorful layout designed to keep your audience engaged from start to finish. This clean and modern slide breaks down key messages into six distinct points, making it easy to showcase progress, milestones, or strategies. Fully compatible with PowerPoint, Keynote, and Google Slides.