


Características


¿Tienes alguna pregunta?
Recomendar


3 diapositivas
Business Project Proposal Pitch Presentation
Win Your Next Big Deal! The Business Project Proposal Pitch Presentation is designed to impress, featuring sleek data visuals, key insights, and a structured layout for persuasive storytelling. Ideal for startups, corporate pitches, and investment proposals, this template is fully customizable and works with PowerPoint, Keynote, and Google Slides for seamless editing.


6 diapositivas
Responsive Design Display with Devices Presentation
Highlight your multi-device experience with the Responsive Design Display with Devices Presentation. This clean and modern layout features a central monitor and mobile phone illustration, surrounded by five customizable text points—ideal for showing key features or compatibility. Fully editable in Canva, PowerPoint, Keynote, and Google Slides.


20 diapositivas
Nightshade Design Portfolio Presentation
The Design Portfolio Presentation Template offers 20 slides to showcase your creative work, including design briefs, elements, processes, and feedback. Perfect for professionals to highlight projects with a modern, vibrant layout. Fully editable and compatible with PowerPoint, Keynote, and Google Slides.


5 diapositivas
Foundation of Success Pillars Presentation
Dive into the structural essence of your enterprise with our engaging 'Foundation of Success Pillars' presentation template. Vividly illustrate the key components vital for organizational prosperity. Ideal for presenting corporate strategies and values. Compatible with PowerPoint, Keynote, and Google Slides, it's perfect for enhancing your presentation visuals.


7 diapositivas
Target Market Infographic Presentation Template
A target market Infographic is a visual representation of a specific group of consumers that a business has determined to be the focus of its marketing efforts. This infographic is designed to understand the demographics, behaviors, and motivations of the potential consumers. This infographic can be used to show the size and growth potential of the target market, and how it compares to other market segments. This template is designed to display your information in the form of charts, graphs, or other data visualizations, and is accompanied by written descriptions of your data and insights.


7 diapositivas
Breast Cancer Day Infographic Presentation Template
National breast cancer day is on October 13th. Every October, people all over the world show their support for everyone affected by breast cancer. This template was designed to help inspire, support and bring awareness to breast cancer. This presentation template was made to help promote the cause and bring awareness to breast cancer. With a focus on pink, this template has lots of space for messaging, as well as opportunities for brand exposure. Easy to modify, and perfect for your next project this template is inspiring to use on your personal website, blog and more to show others.


21 diapositivas
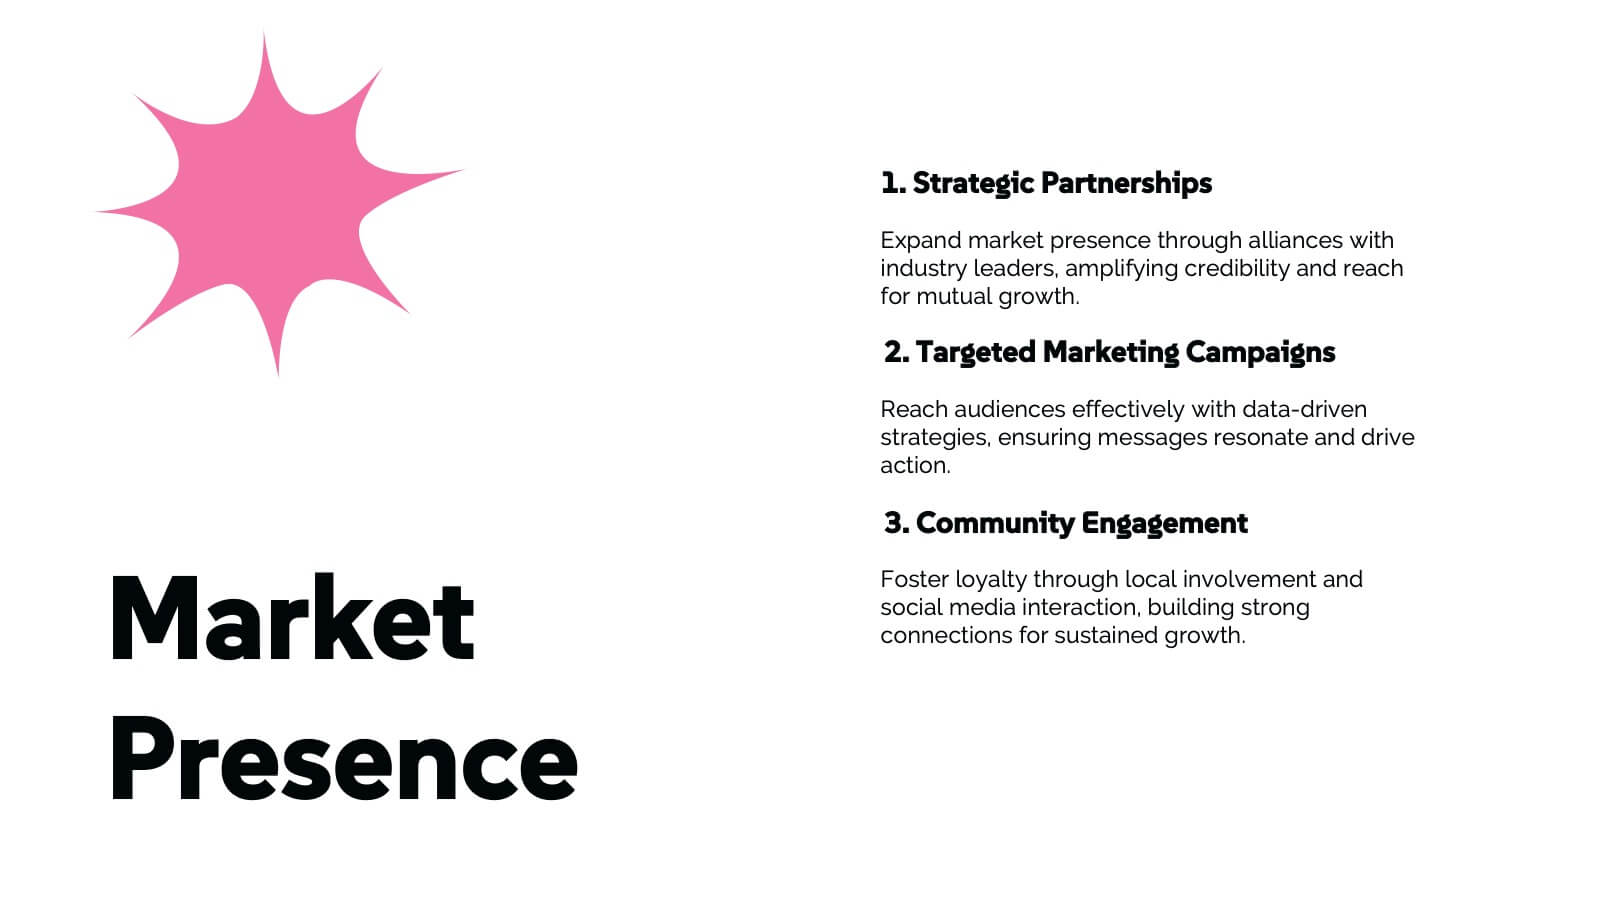
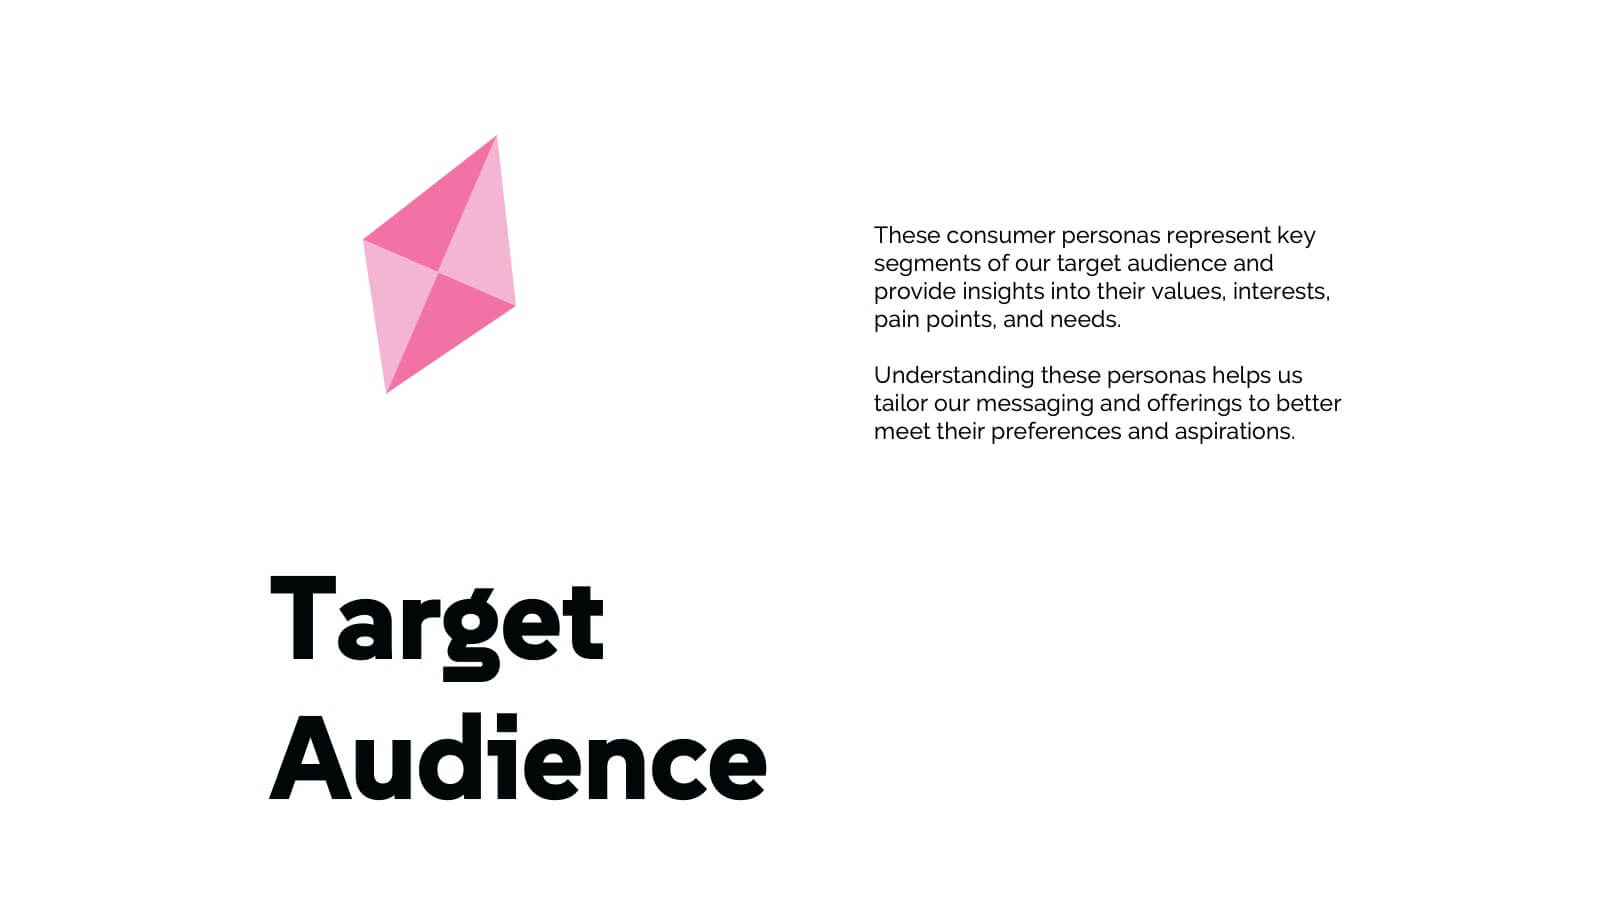
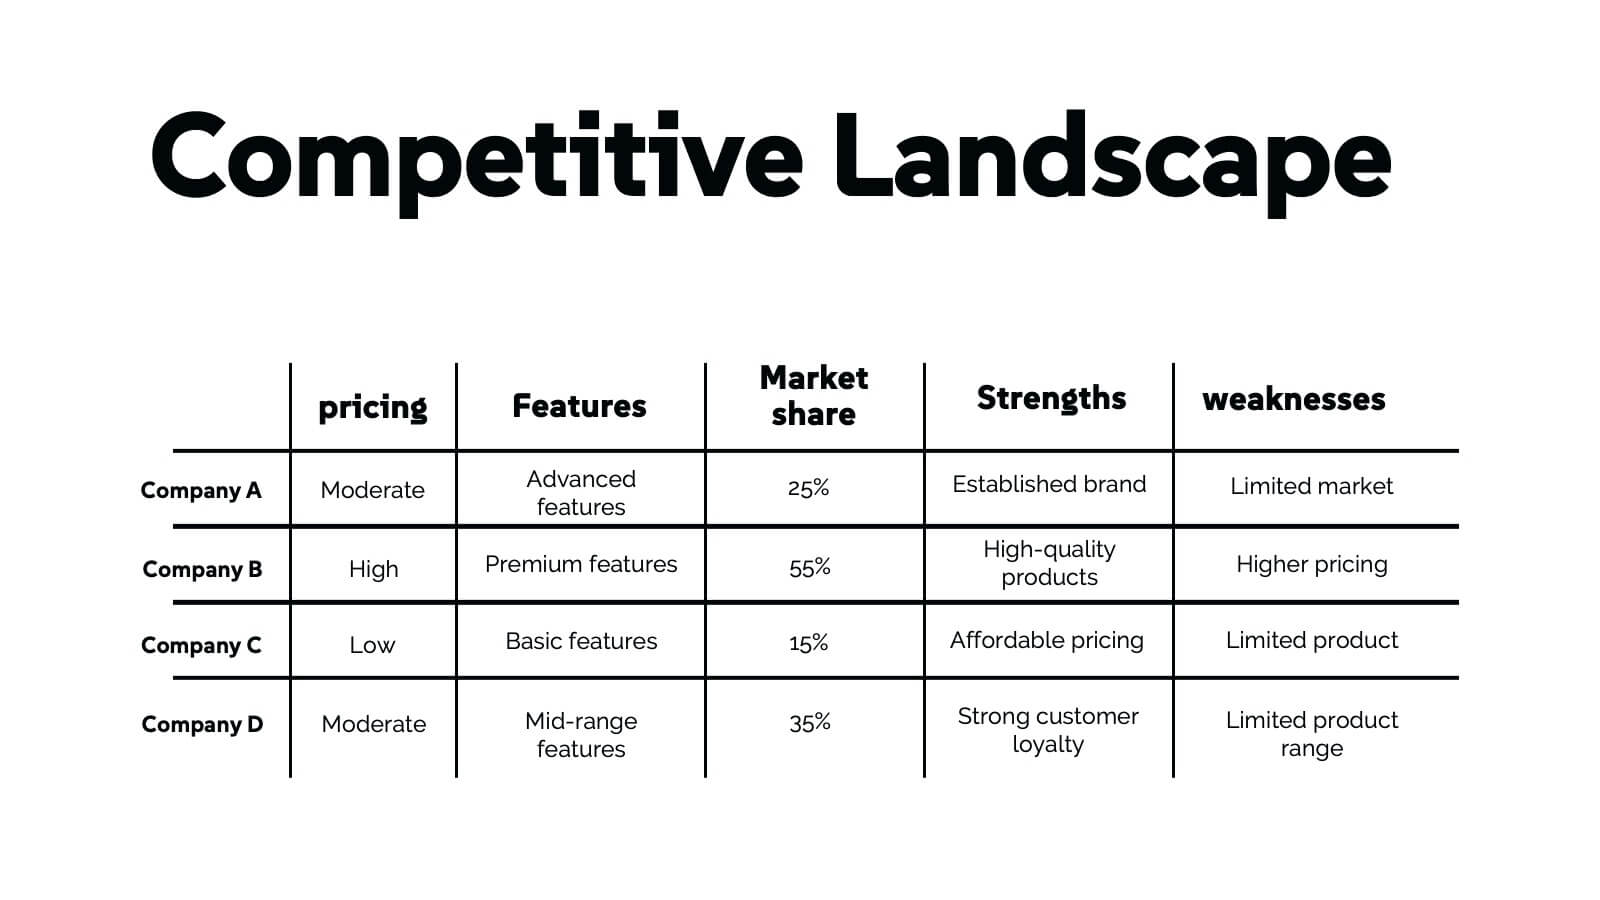
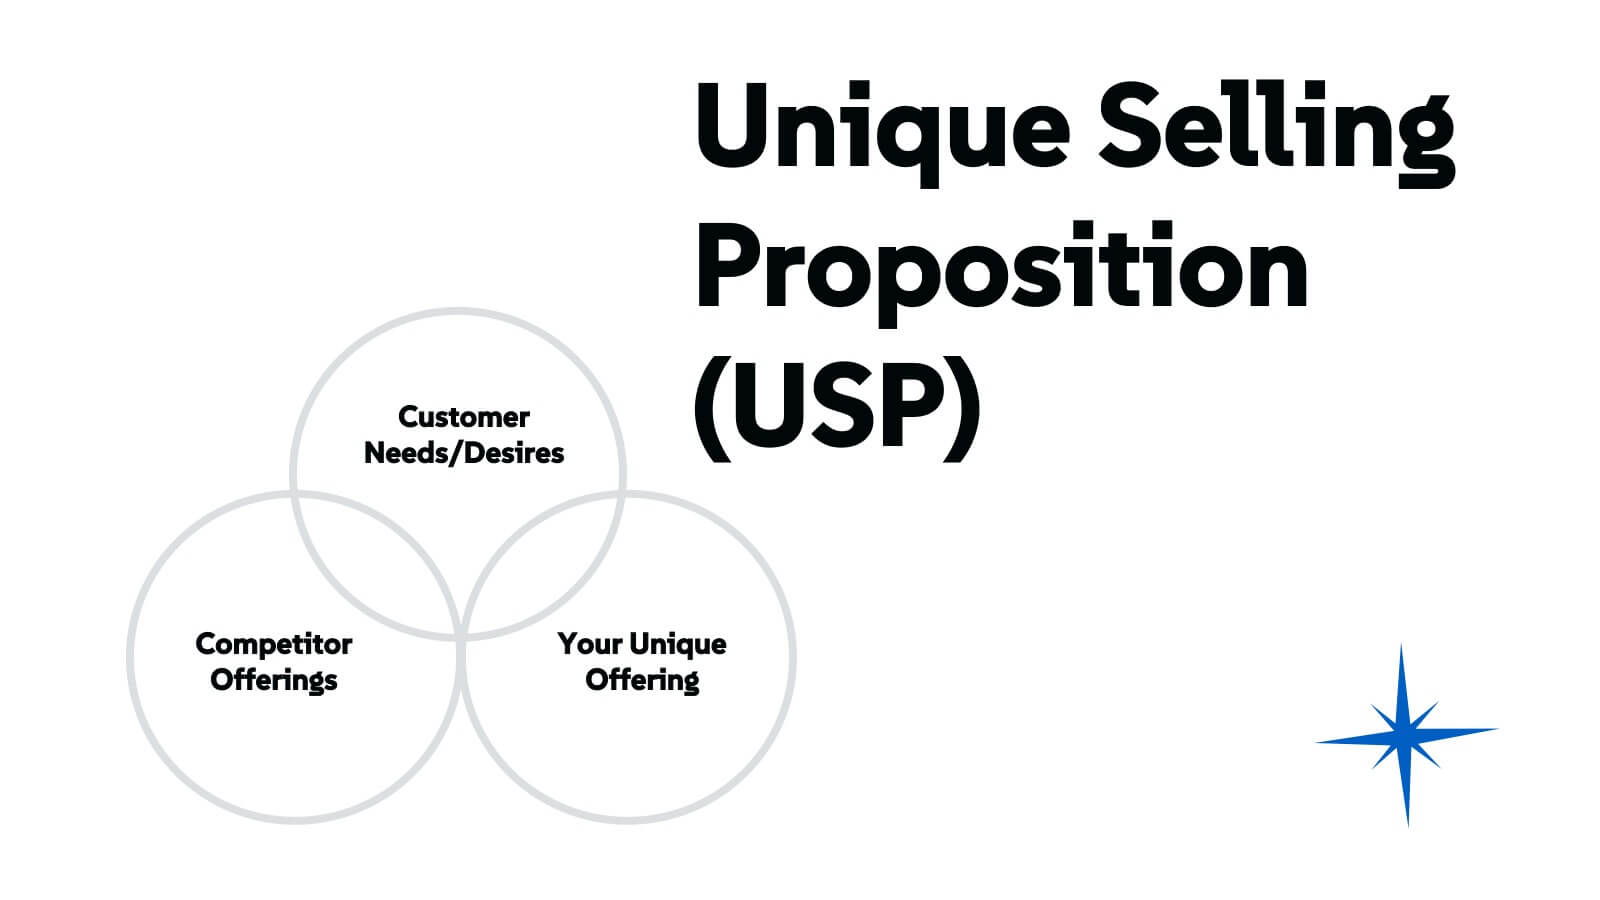
Chimera Marketing Campaign Presentation
Create a visually engaging digital marketing presentation with this modern template! Covering essential topics like company history, market presence, target audience, and competitive landscape, this template helps you showcase your marketing strategies effectively. Fully customizable, it works seamlessly with PowerPoint, Keynote, and Google Slides for professional presentations every time.


10 diapositivas
Creative Business Pitch Deck Presentation
Make your ideas stand out with a presentation that blends creativity and professionalism. Perfect for entrepreneurs and teams showcasing innovative business concepts, it helps structure your pitch with clarity and impact. Fully customizable and compatible with PowerPoint, Keynote, and Google Slides for seamless editing and polished results.


21 diapositivas
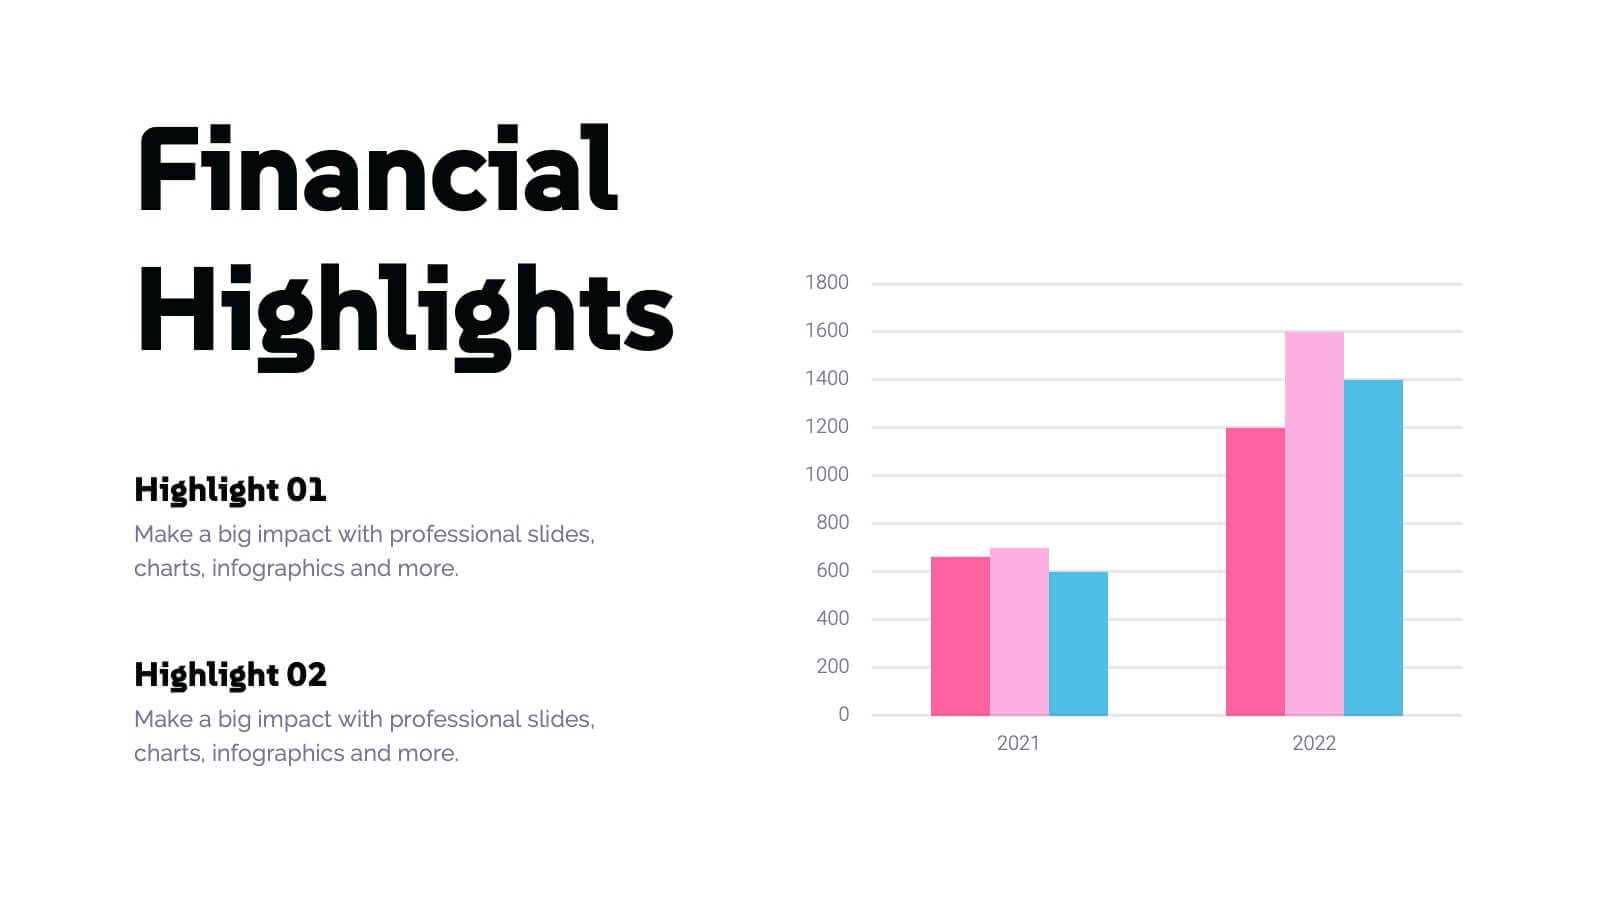
Runewood Marketing Proposal Template Presentation
The Marketing Proposal Presentation Template provides 21 slides covering core aspects like market presence, growth strategies, and financial highlights. Perfect for agencies and businesses to showcase their marketing strategies effectively. Fully customizable and compatible with PowerPoint, Keynote, and Google Slides.


21 diapositivas
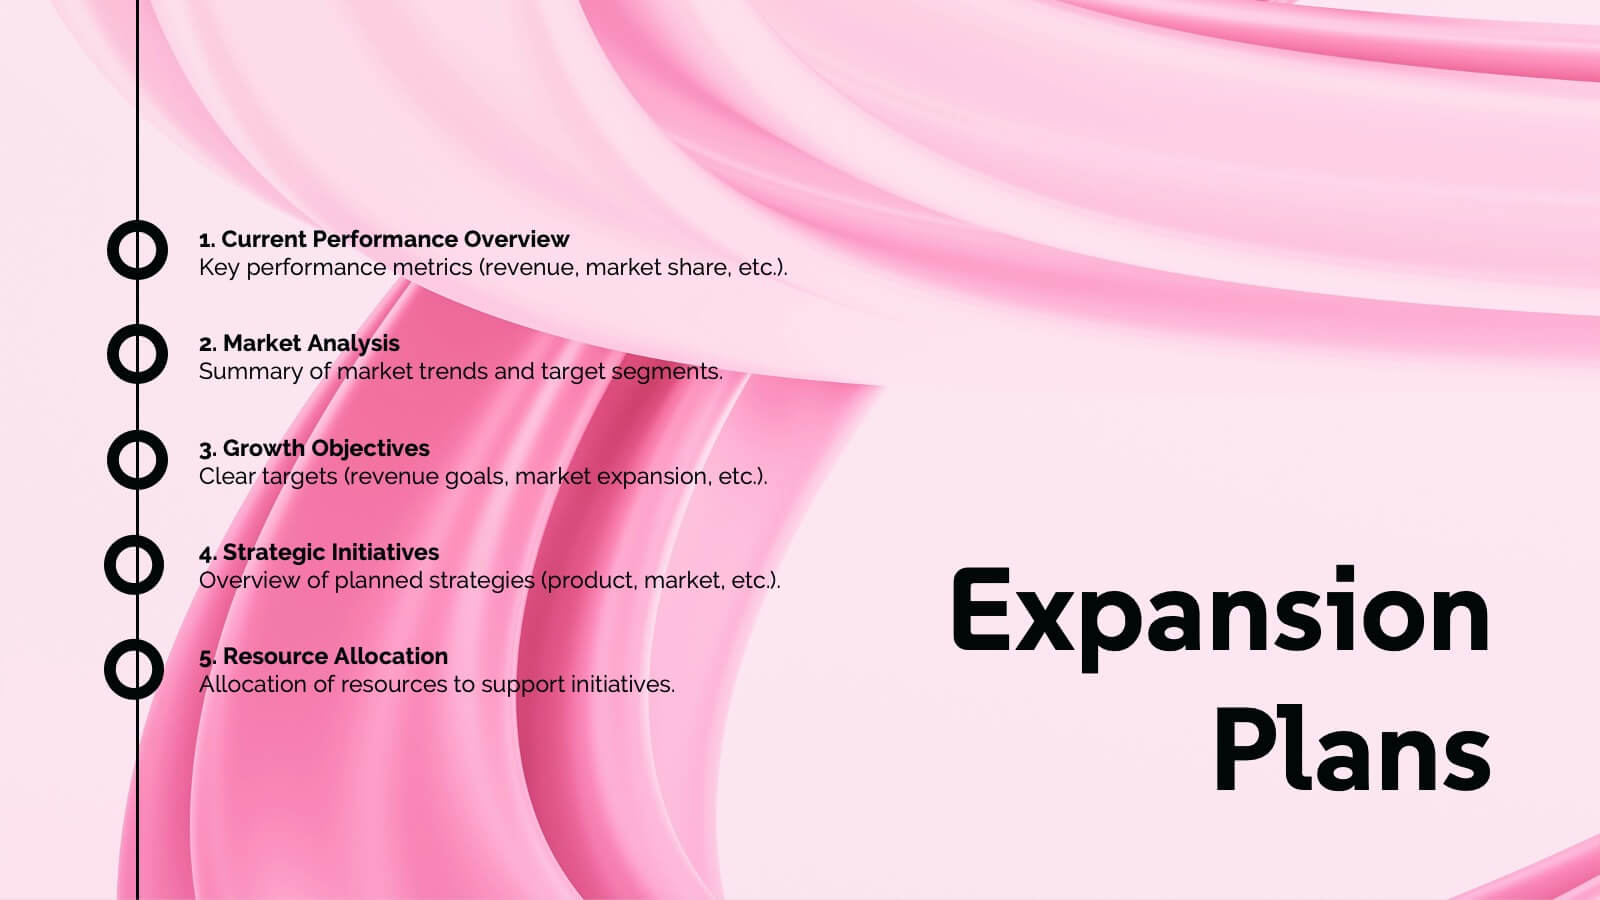
Fluorion Startup Strategy Presentation
Kickstart your business with this modern and professional Startup Strategy Presentation Template. Designed to help entrepreneurs, startups, and business owners present their vision, goals, and strategies effectively. This template includes 21 fully customizable slides covering essential sections such as mission and vision, market analysis, business model, financial overview, and growth plan. Compatible with PowerPoint, Keynote, and Google Slides for seamless editing and presentation.


7 diapositivas
Kickoff Meeting Infographic
A meeting is a planned gathering of individuals, often from an organization or a group, who come together to discuss specific topics, share information, make decisions, or collaborate on projects. This infographic template is a visually engaging guide to launching your projects with a burst of energy and purpose. This template is your go-to tool for orchestrating that vital moment—the project kickoff—that sets the stage for success. Compatible with Powerpoint, Keynote, and Google Slides. This template is a structured way to communicate, coordinate actions, and ensure that everyone involved is aligned towards common goals.


7 diapositivas
Project Summary Infographic
This collection of project summary slides is designed to streamline the presentation of project outcomes and statuses effectively. The slides feature a variety of layouts tailored to emphasize critical data and conclusions, making them an ideal choice for project managers and teams who need to report on progress and results. Each slide is crafted with a clear focus on visual hierarchy, which helps in directing the viewer's attention to the most important information. Use of bullet points, charts, and infographics enhances the viewer's understanding by breaking down complex data into easy-to-digest visuals. Color coding is effectively utilized to differentiate between themes or topics, which aids in quick comprehension. These slides are versatile enough to be used in various scenarios, such as end-of-project presentations, stakeholder updates, or team meetings. They provide a professional and polished way to showcase project achievements, timelines, and future steps. Overall, these summary slides are a valuable tool for anyone looking to present project information clearly and concisely, ensuring that key points are communicated effectively and are memorable.


7 diapositivas
Exponential Growth Infographic
Exponential growth refers to a process where a quantity grows at a consistent percentage rate per unit of time. This infographic template takes your audience on a visual expedition through the marvels of exponential expansion, turning complex data into a clear and engaging narrative. Compatible with Powerpoint, Keynote, and Google Slides. This features dynamic visuals like ascending graphs and vibrant charts, this infographic embodies the essence of exponential growth, making this come alive. Showcase the growth trajectory using ascending line graphs or bar charts, visually representing the skyrocketing growth in a way that's easy to comprehend.


7 diapositivas
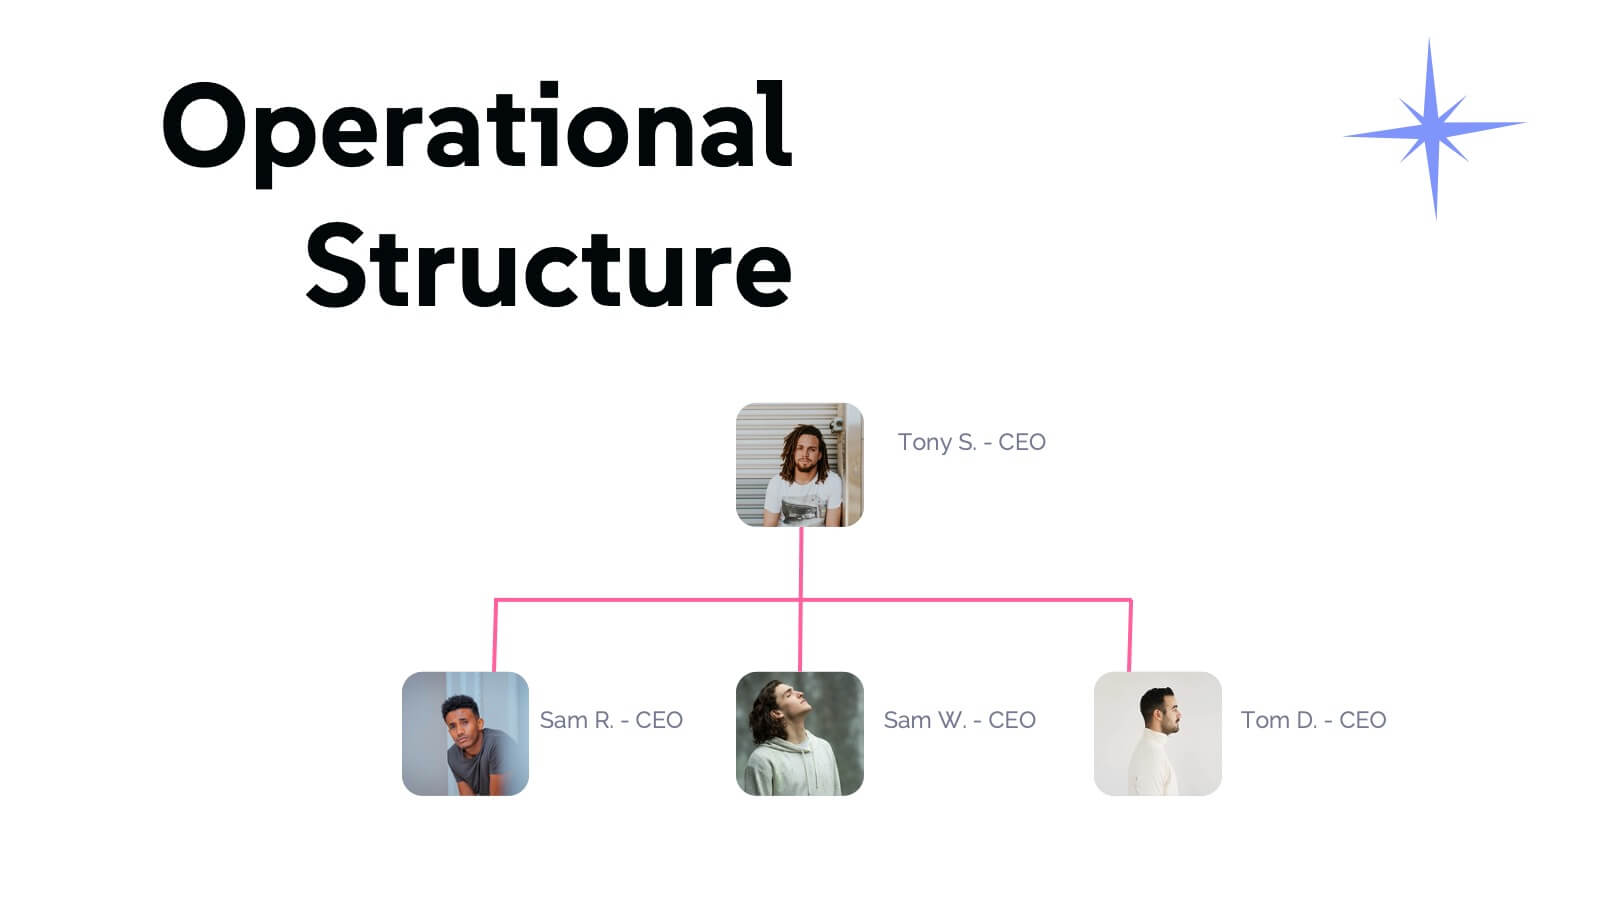
Company Profile Infographic
This collection of company profile templates is designed to meet the diverse needs of various businesses, providing an efficient and polished method for presenting a company's identity, accomplishments, and offerings. Each template is meticulously crafted to cater to different professional contexts, making them suitable for annual reports, investment summaries, or internal briefings. Structured for clarity, these templates enable businesses to effectively communicate essential details such as company history, objectives, and the breadth of services or products offered. They are also equipped to showcase crucial statistics like employee numbers, significant achievements, and organizational hierarchy, enhancing the overall presentation. The design blends modern aesthetics with functionality, incorporating a professional color palette and clean layout that holds viewer interest and enhances readability. Customization is straightforward, allowing for easy adjustments in colors, fonts, and design elements to align with specific brand identities. Ideal for corporations looking to convey their market stance and engage potential clients, investors, or prospective employees, these templates serve as a vital tool in creating impactful and informative company profiles.


7 diapositivas
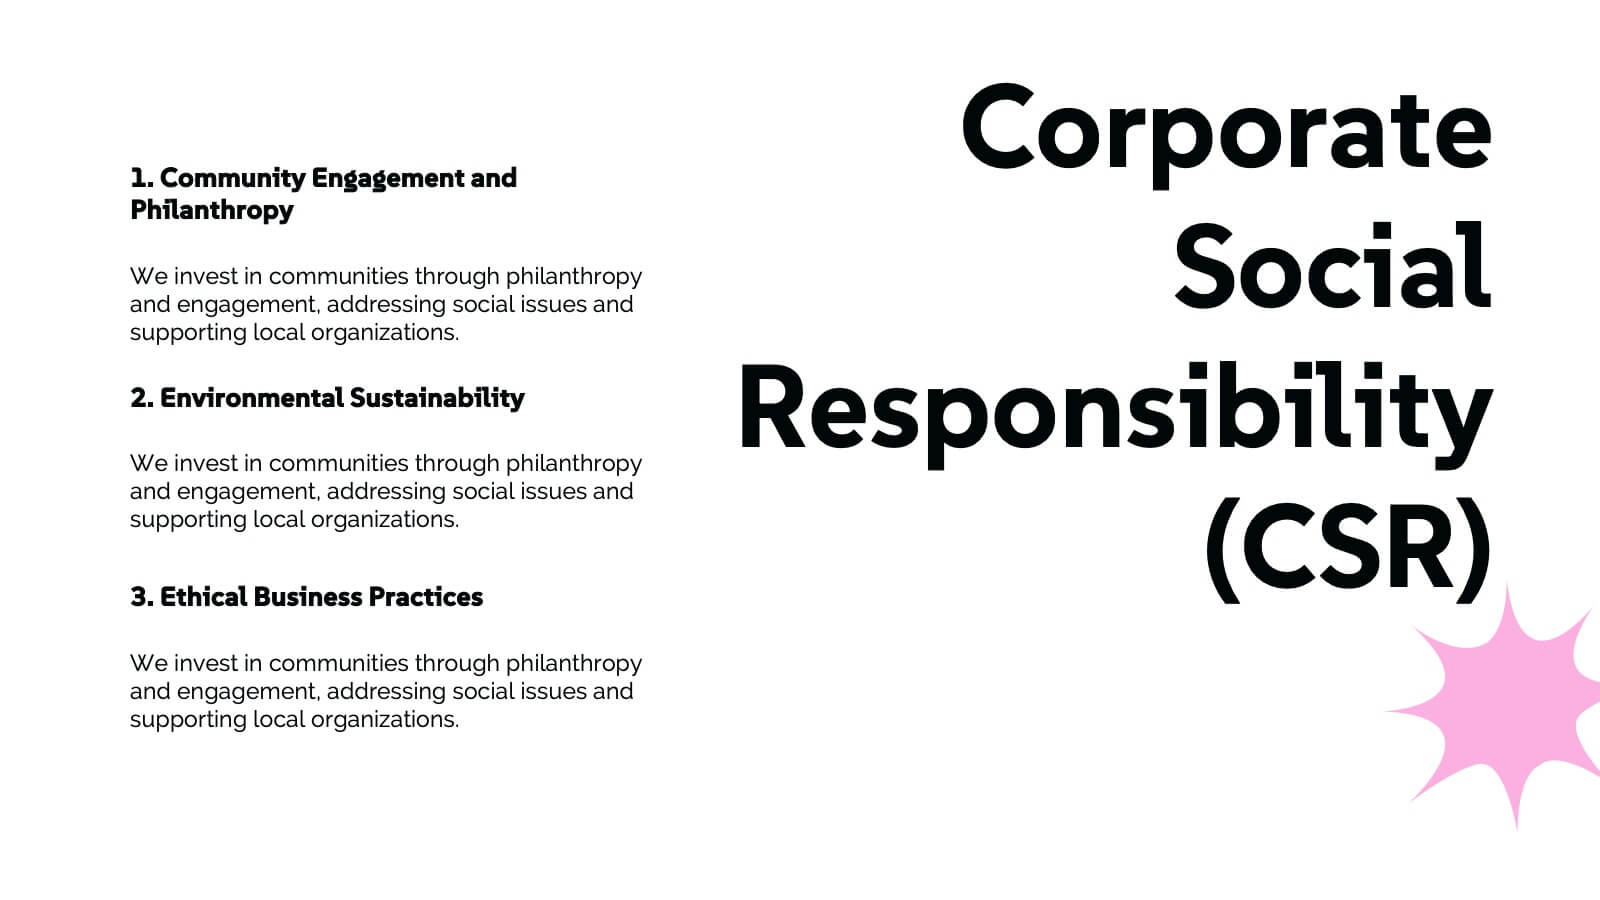
Mission Statement Infographic
Present your organization's core values and goals with clarity using this collection of professionally designed slide templates. Each one is crafted to communicate key elements of your strategic vision effectively, combining aesthetic appeal with functional design to ensure your message resonates. Featuring a clean and professional layout, these slides emphasize the importance of your foundational principles. The balanced use of images and text is ideal for enhancing corporate presentations, stakeholder meetings, or team workshops. With various designs available, you can select the layout that best aligns with your branding and organizational ethos. These templates are fully customizable, allowing for adjustments in color, font, and imagery to perfectly articulate your core messages. They are an excellent tool for motivating your team, impressing stakeholders, and conveying the driving purpose behind your initiatives.


7 diapositivas
Common Problem Infographic
These slides offer a professional and clean design approach for presenting common challenges or issues within a project or organizational setting. Each slide is carefully structured to allow clear delineation and analysis of problems, providing a straightforward layout for presenting solutions and discussions. The design palette ranges from minimalistic to dynamic, catering to various presentation needs. Whether you are addressing an internal team, stakeholders, or a broader audience, these templates are adaptable to convey critical problems effectively. You can easily customize these slides to integrate specific details relevant to the issues at hand, making your presentation not only informative but also visually engaging.


6 diapositivas
5-Step Implementation for Business Growth Presentation
Present your strategic plan with clarity using the 5-Step Implementation for Business Growth Presentation. This horizontal arrow layout guides your audience through five key phases of execution—from planning to final results. Each step is clearly numbered and color-highlighted for visual flow. Fully editable in PowerPoint, Keynote, Google Slides, and Canva.