


Características


¿Tienes alguna pregunta?
Recomendar


10 diapositivas
Concentric Circles Business Model Presentation
Visualize Your Business Strategy with Clarity using this Concentric Circles Business Model Presentation template. This design helps you illustrate core business concepts, hierarchical structures, and strategic layers in a simple yet engaging format. Ideal for business planning, process optimization, and strategic growth presentations, this template makes complex relationships clear and easy to understand. Fully editable and available for PowerPoint, Keynote, and Google Slides.


6 diapositivas
Porter's Five Forces Strategy Presentation
Give your competitive analysis a bold, intuitive flow with a clean layout that visually breaks down each force in a simple, strategic way. This presentation helps you highlight market pressures, evaluate risks, and support smarter decision-making with clarity and confidence. Fully editable and compatible with PowerPoint, Keynote, and Google Slides.


6 diapositivas
Technology Education Infographic
Technology education refers to the teaching and learning of skills, knowledge, and concepts related to technology. This infographic template is designed to present key information about technology education in a concise manner. It aims to educate and inform the audience about the importance of technology education and its impact on students' learning and future careers. The template utilizes visually appealing icons, illustrations, and graphics to enhance understanding and engagement. It includes images of computers, coding symbols, robots, and other technology-related visuals that help to reinforce the information presented.


26 diapositivas
Company Profile Geometric Presentation
A company profile is a document or presentation that provides an overview of a business or organization. This presentation template serves as a marketing tool to showcase the company's strengths, capabilities, products, history, and achievements. Use this template to effectively showcases your company's identity, values, and services. The presentation is designed to leave a lasting impression on potential clients, partners, investors, and stakeholders. With its clean lines and geometric elements, the template exudes a sense of sophistication and contemporary style. Compatible with Powerpoint, Keynote, and Google Slides.


7 diapositivas
Skills Gap Report Infographic
A skills gap analysis is a systematic assessment of the difference between the skills or competencies that an individual, a team, or an organization currently possess and the skills they need to meet specific objectives or requirements. This infographic template is meticulously designed to present a deep analysis of the skills gap within an organization or industry, offering solutions and pathways to cultivate a skilled workforce. Compatible with Powerpoint, Keynote, and Google Slides. Highlight the skills that are in high demand, providing a clear understanding of where the gap exists.


10 diapositivas
5G Technology and Network Advancements Presentation
Showcase key milestones and trends in modern telecom evolution with this dynamic 5G network infographic. The slide features a clean, wave-like flow connecting five signal tower icons, perfect for outlining technological phases, speed upgrades, or infrastructure rollouts. Suitable for IT professionals, telecom analysts, and future-tech strategists. Fully customizable in PowerPoint, Keynote, and Google Slides.


24 diapositivas
Copper Small Business Pitch Deck Presentation
Elevate your business presentations with this clean and professional pitch deck template! Ideal for team meetings, business updates, or investor pitches, it includes sections for collaboration opportunities, performance metrics, and process improvements. The layout ensures clarity and focus, making it perfect for effective communication. It’s fully customizable and works seamlessly with PowerPoint, Keynote, and Google Slides for hassle-free integration.


20 diapositivas
Aether Marketing Research Report Presentation
The Marketing Research Report Presentation Template offers a sleek design with 20 fully customizable slides, ideal for presenting in-depth marketing insights. This template features sections for industry analysis, consumer behavior, emerging technologies, and marketing trends like SEO, social media, and influencer strategies. It also highlights e-commerce trends, personalization, sustainability, and storytelling techniques. The modern black-and-gold gradient aesthetic adds sophistication, making it perfect for professional reports. Compatible with PowerPoint, Keynote, and Google Slides, this template ensures a polished and engaging presentation experience.


7 diapositivas
Technology Skills Gap Infographic Presentation
A Skills Gap Infographic is a visual representation of the difference between the skills that employers need and the skills that are possessed by job seekers or employees. This template illustrates the gap between the skills that are required for a particular job and the skills that are currently available in the workforce. This template include charts, diagrams, and other visual elements that help to explain the extent of the skills gap, as well as its impact on the economy, businesses, and individuals. Use this to raise awareness about the skills gap and its implications to encourage action.


21 diapositivas
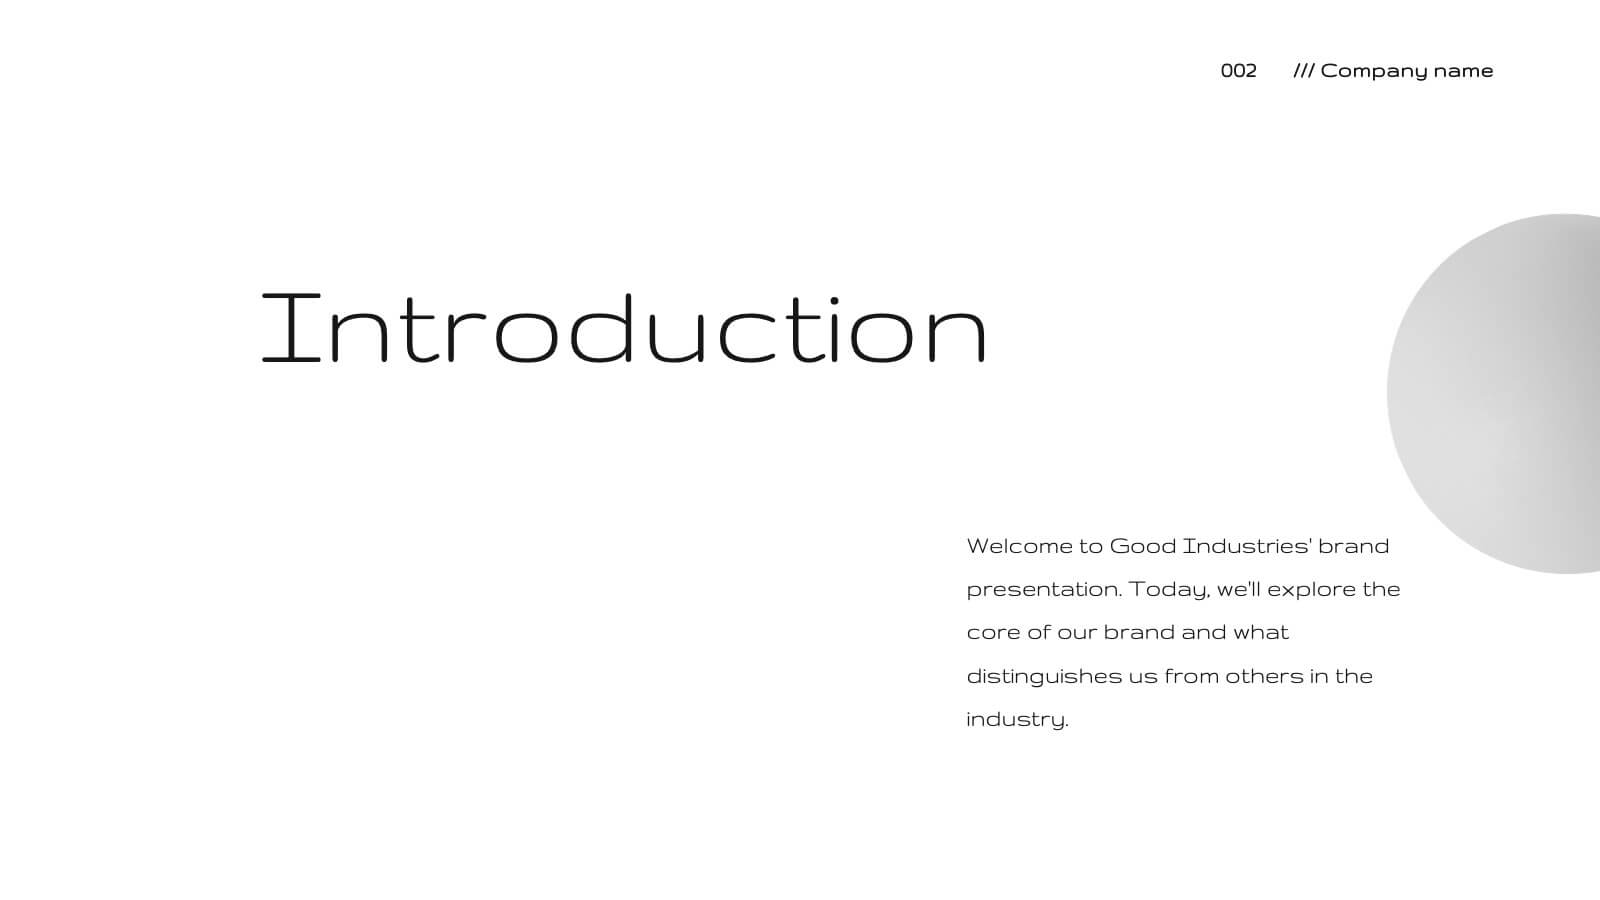
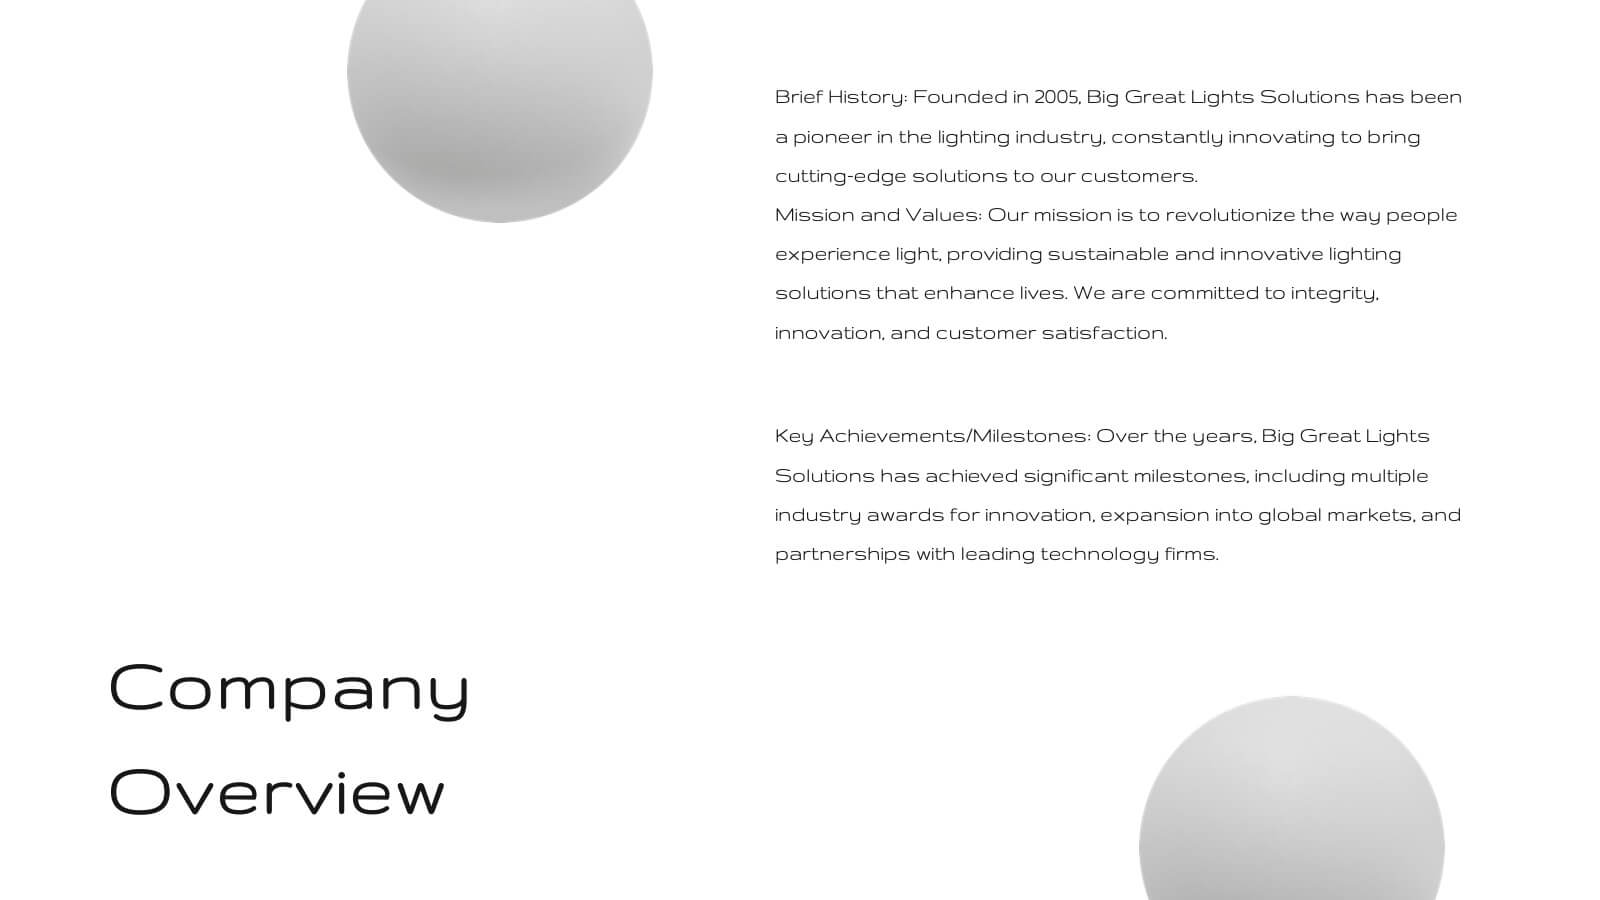
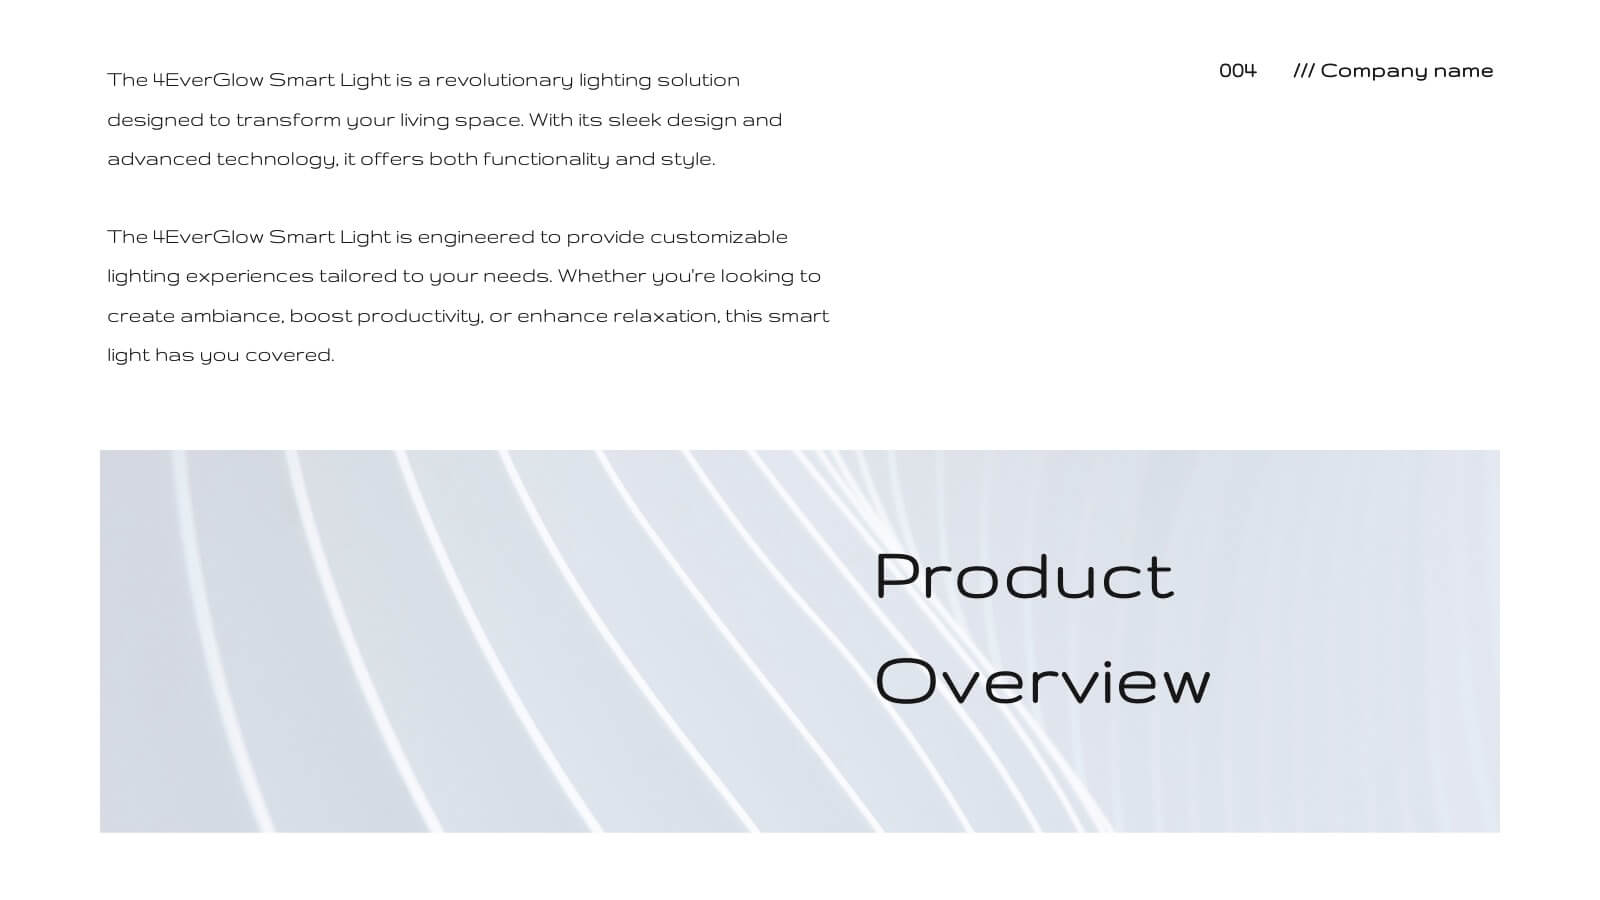
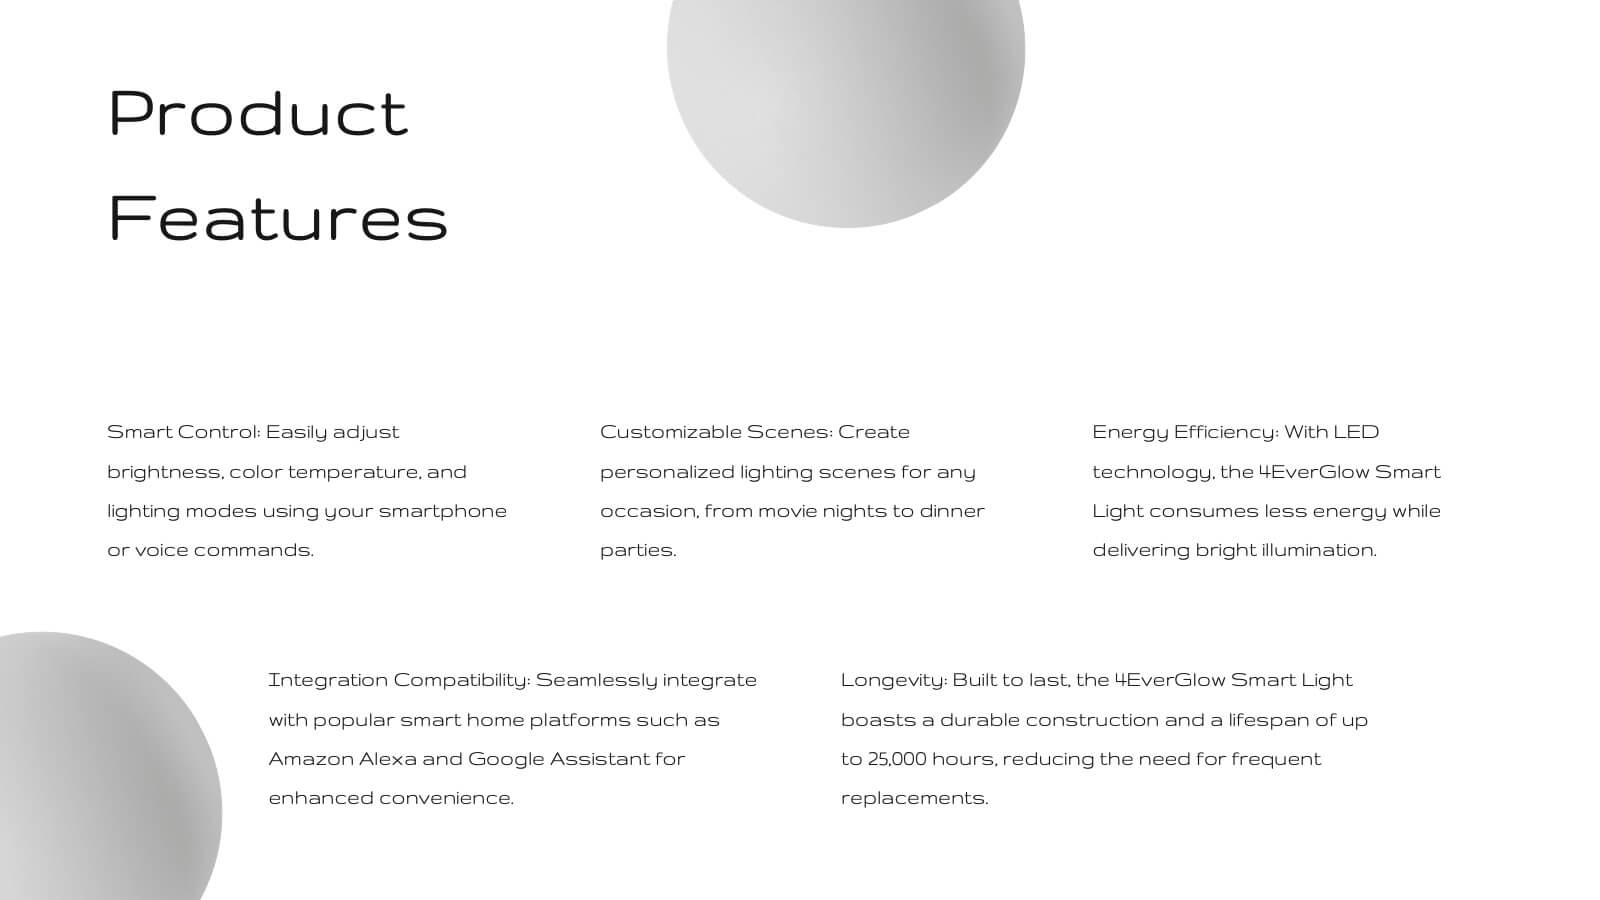
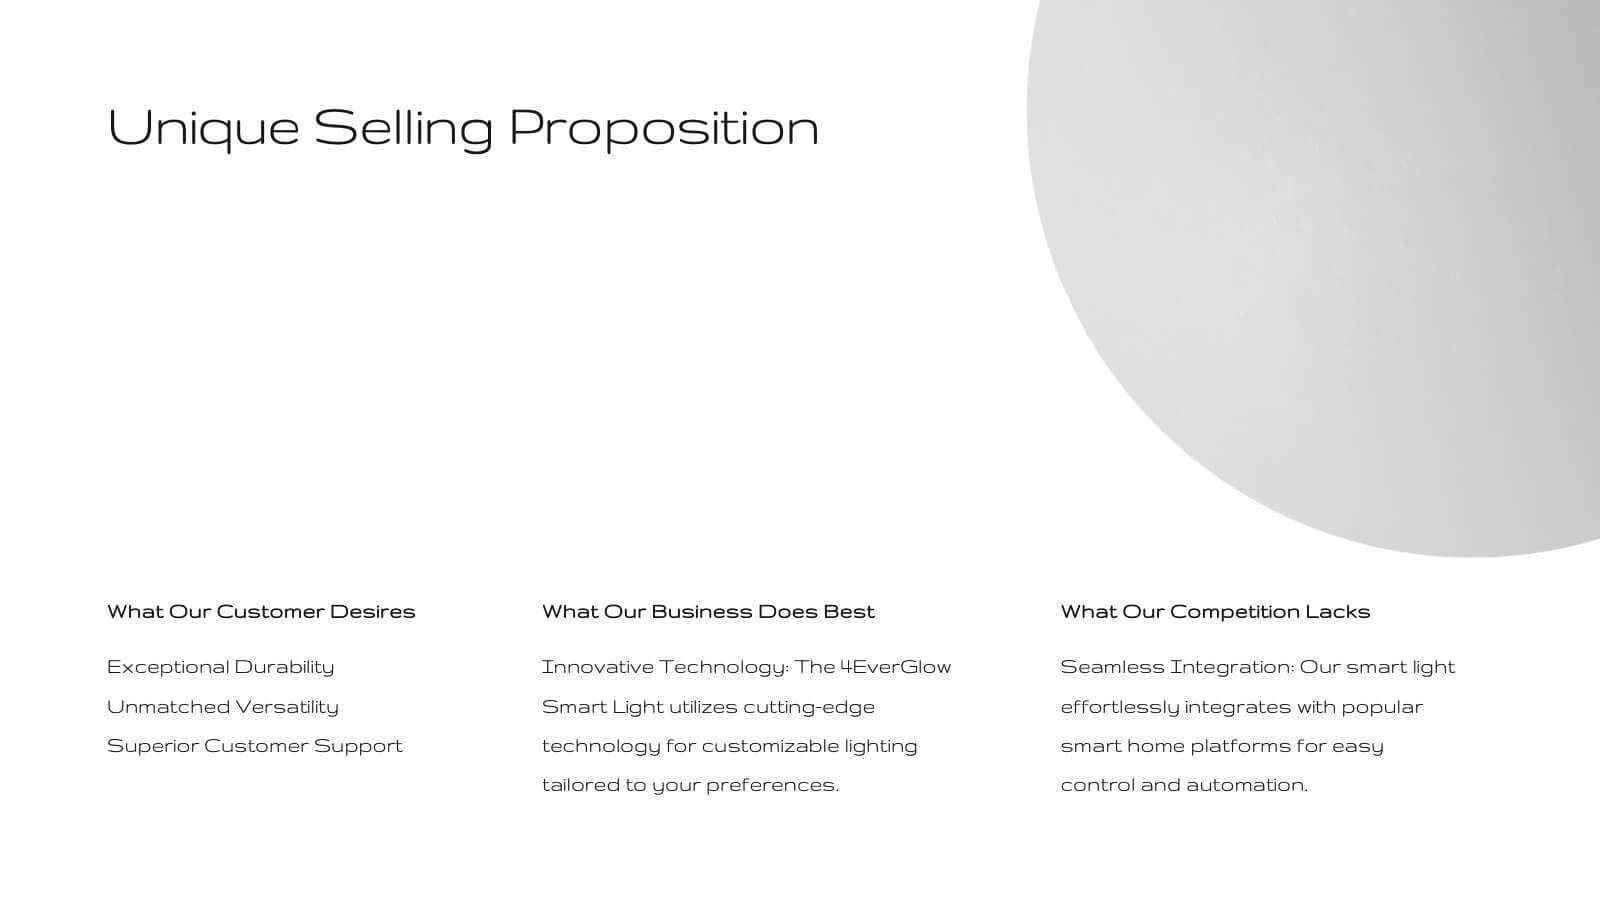
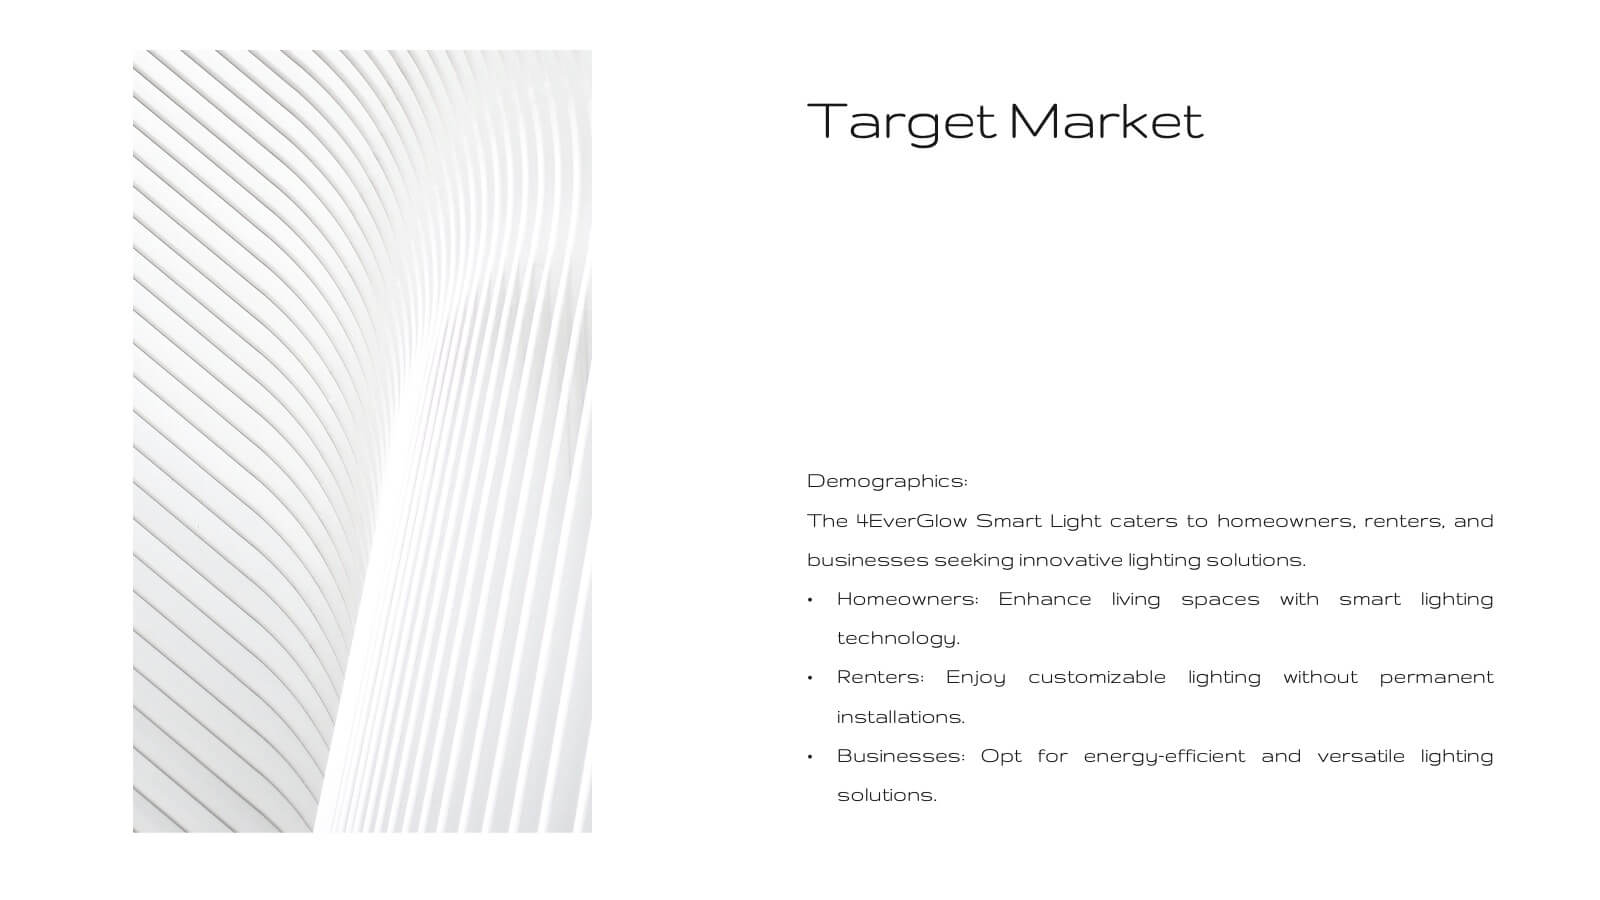
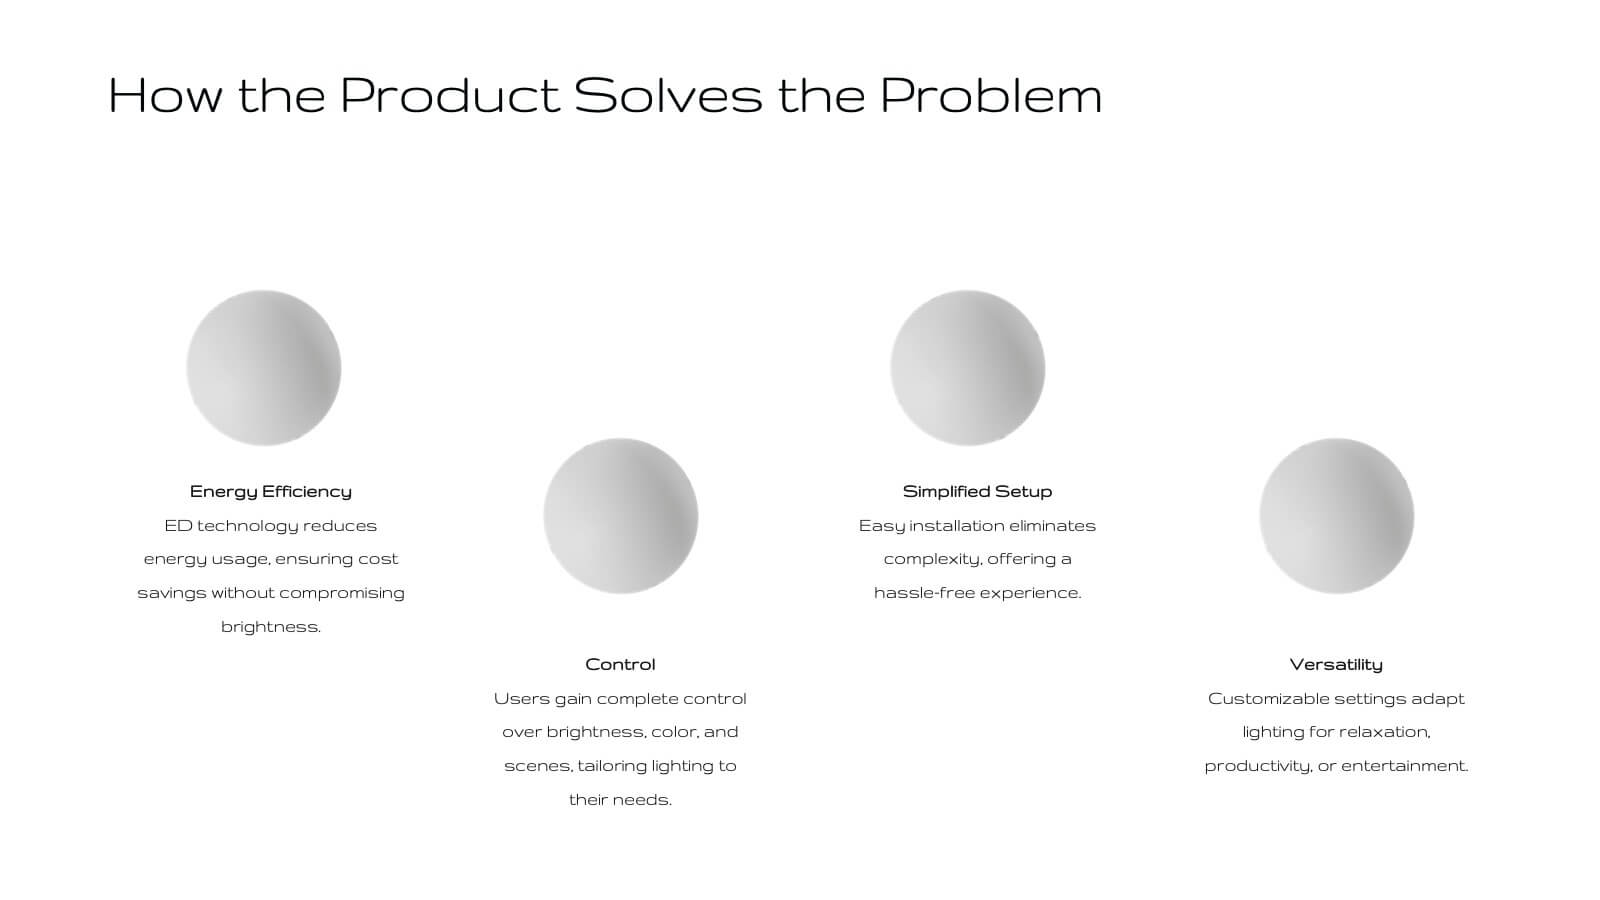
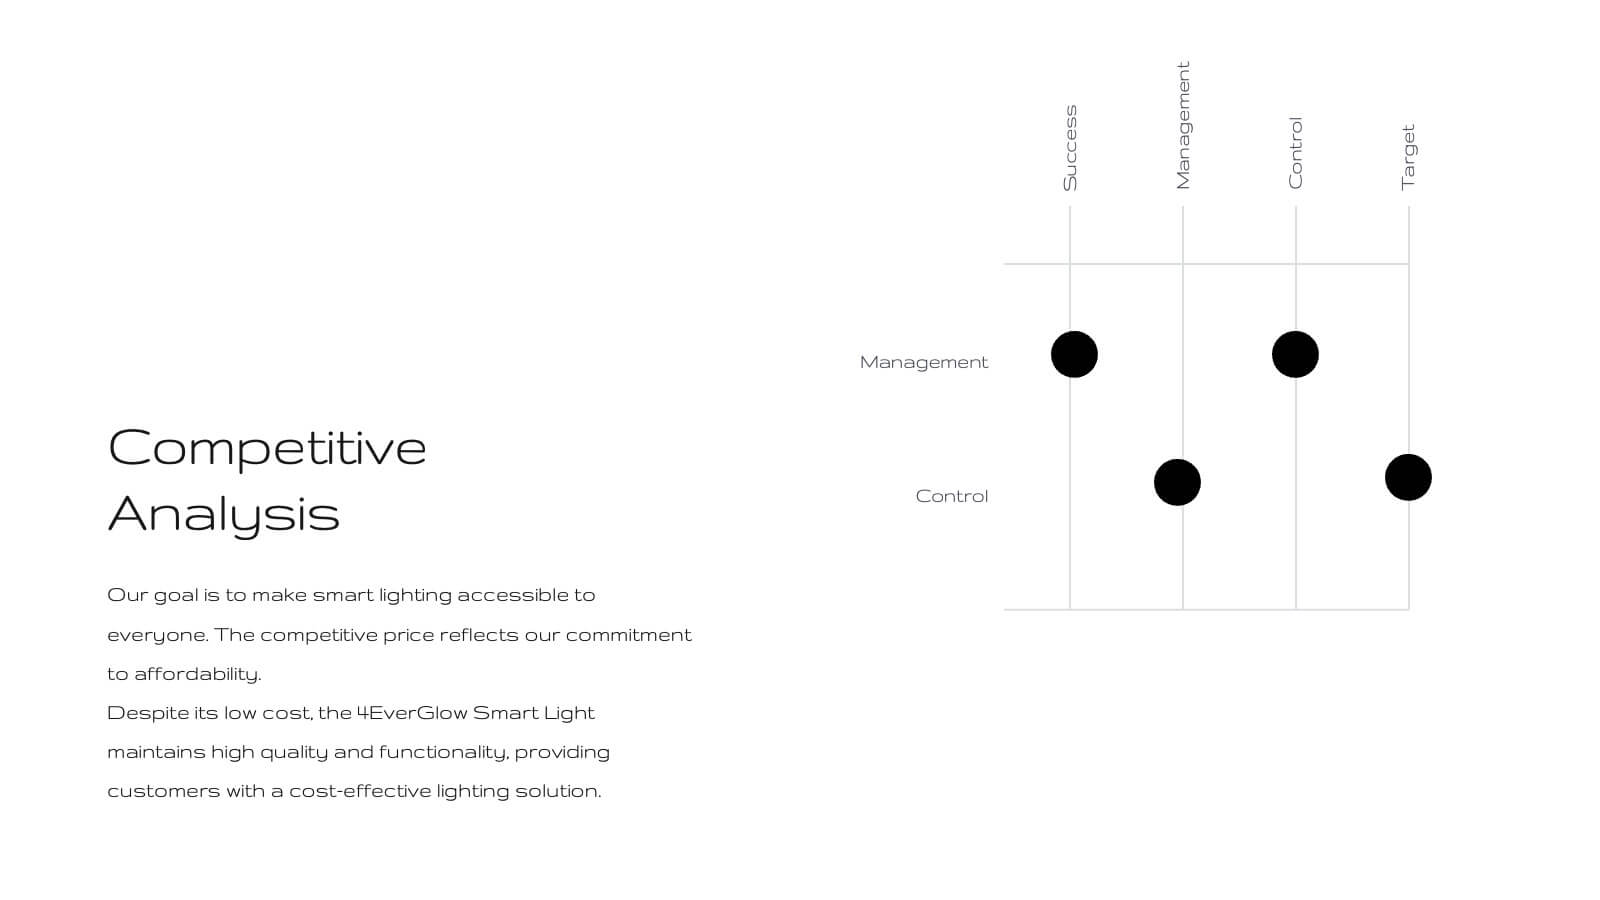
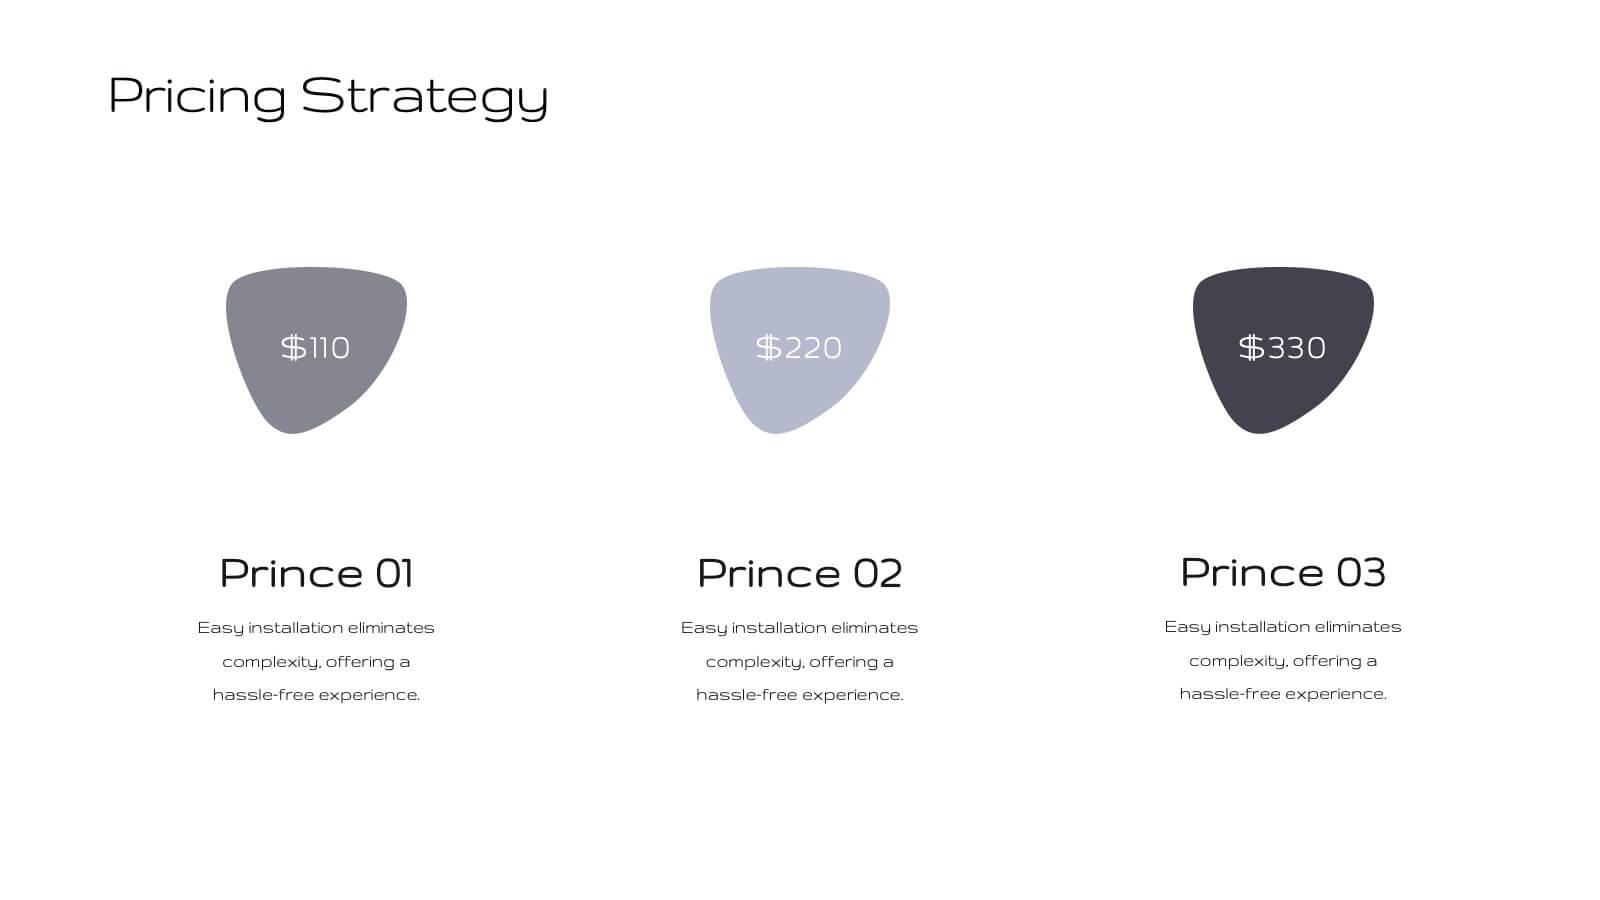
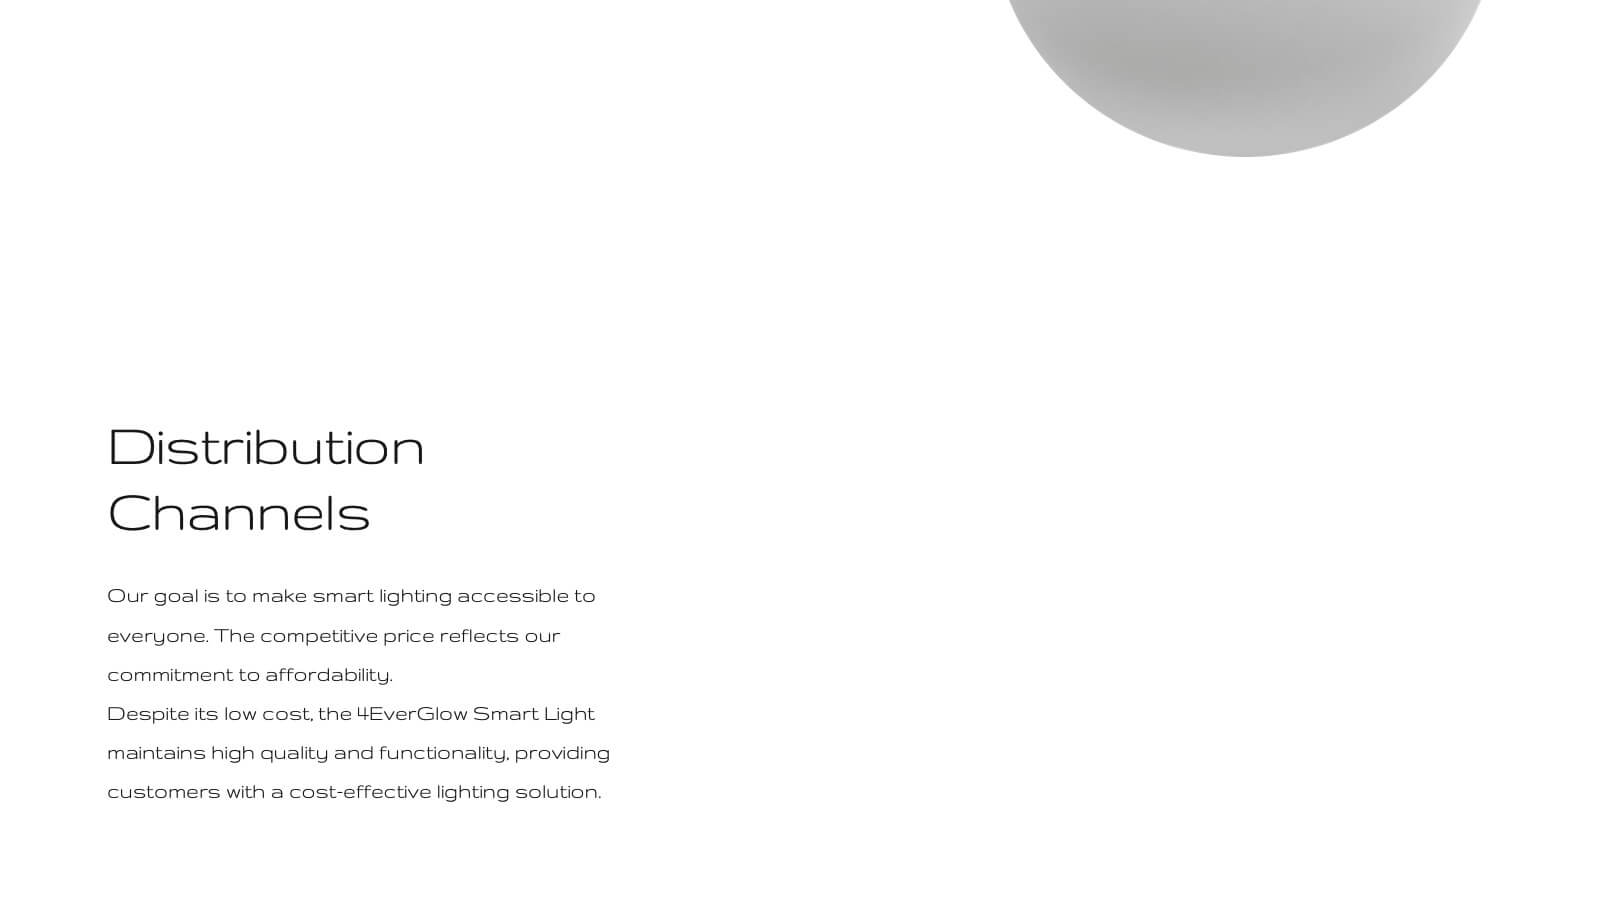
Fortuna Product Development Plan Presentation
Unveil your product's potential with this elegant, minimalist presentation template. Perfect for detailing product development, features, and market strategies, it features a clean design that emphasizes clarity and professionalism. Highlight key aspects like customer pain points, competitive analysis, and pricing strategies to captivate your audience. Compatible with PowerPoint, Keynote, and Google Slides, it ensures seamless presentations on any platform.


7 diapositivas
Operational Workflow Chart Presentation
Turn complex operations into clear, engaging visuals with this clean, structured presentation design. Ideal for outlining procedures, systems, or process improvements, it helps your audience easily follow each stage from start to finish. Fully customizable and compatible with PowerPoint, Keynote, and Google Slides for effortless editing and professional results.


26 diapositivas
Doriyan Presentation Template
Doriyan is a beautiful, colorful, professional and descriptive presentation. This template has wonderful colors and graphics that are engaging and conveys the information to the audience. This template is suitable for all types of businesses especially those that are investors, realtors or other companies involved in investment advice. Charts, timelines and easy to edit text makes this template perfect for businesses seeking to introduce there business and services to make a great impression. Doriyan offers a way to boost your business. Present your information with this efficient template!


6 diapositivas
External Business Factors PESTEL Model Presentation
Present your strategic analysis with clarity using this External Business Factors PESTEL Model Presentation. Designed to break down Political, Economic, Social, Technological, Environmental, and Legal influences, this layout helps convey complex macro-environmental insights in a simple, color-coded visual format. Ideal for consultants, business analysts, and corporate strategists. Fully editable in PowerPoint, Keynote, and Google Slides.


6 diapositivas
Audience Targeting and Segmentation
Get to know your audience like never before with this human-centered visual layout—ideal for mapping out key segments, demographics, and targeting strategies. Great for marketing plans, user personas, or customer insights presentations, this slide keeps your data visually focused and easy to digest. Fully compatible with PowerPoint, Keynote, and Google Slides.


5 diapositivas
Company Hierarchical Structure Presentation
Effectively illustrate your company's hierarchy with this Company Hierarchical Structure infographic template. Designed to clarify leadership and team roles, this slide is ideal for corporate presentations, HR onboarding, and management reports. Fully customizable in PowerPoint, Keynote, and Google Slides, ensuring seamless integration with your branding and content needs.


6 diapositivas
Business Task and To-Do List Slide
Organize tasks with clarity using this colorful checklist-style layout, perfect for showcasing priorities, timelines, or team responsibilities. With six editable sections and engaging icons, this layout brings structure and visual appeal to business updates or project meetings. Fully customizable in PowerPoint, Keynote, and Google Slides.


5 diapositivas
Essential Education Infographics
Education is a key driver of individual and societal progress, and investing in education is essential for building a better future for all. This vertical infographic template is designed for educators, trainers, and other professionals who want to create informative and visually appealing educational materials. The theme of the template is centered around education, with bright and colorful illustrations of books, pencils, and other educational tools. Compatible with PowerPoint, Keynote, and Google Slides. Each slide is fully editable, allowing you to easily change the colors, fonts, and content to suit your needs.