
Características


¿Tienes alguna pregunta?
Recomendar


7 diapositivas
Modern Education Infographic
Immerse yourself in the evolving world of learning with our Modern Education Infographic. With a crisp white canvas, the design incorporates an energizing mix of orange, the trust-building hue of blue, and a dash of passionate red. This template boasts modern infographics, bespoke icons, and versatile image placeholders, offering a visual guide to contemporary educational methods, tools, and trends. Precision-made for Powerpoint, Keynote, or Google Slides. Ideal for educators, curriculum developers, edtech startups, or any professional keen on showcasing the transformation in learning techniques.


2 diapositivas
Online Course Structure and Syllabus Deck Presentation
Welcome students with a vibrant and modern course intro slide. This template is perfect for online educators outlining course objectives and syllabus details. Features an image placeholder and text sections for clear communication. Fully editable in PowerPoint, Keynote, and Google Slides—ideal for virtual learning environments and eLearning programs.


6 diapositivas
Fishbone Diagram
A fishbone diagram, also known as a cause-and-effect diagram or an Ishikawa diagram, is a visual tool used to identify and analyze the potential causes of a problem or an effect. This infographic template is designed to help you explore and understand the root causes of an issue by visually mapping out various contributing factors. This cause-and-effect diagram, provides a structured approach to identify and categorize the various factors contributing to a specific outcome. This template is fully customizable and compatible with Powerpoint, Keynote, and Google Slides making it easy to input your information.


21 diapositivas
Dreameon Agency Portfolio Presentation
Showcase your agency's expertise with this sleek and modern portfolio presentation template. Designed to highlight your achievements, creative processes, and client success stories, this template offers a comprehensive layout that communicates professionalism and innovation. From introducing your team and services to detailing case studies and market analysis, each slide is meticulously crafted to leave a lasting impression. Display your strategy development, social media impact, and measurement analytics effectively, ensuring a cohesive narrative that resonates with your audience. Easily customizable and compatible with PowerPoint, Google Slides, and Keynote, this template is perfect for agencies looking to pitch their capabilities, attract new clients, or present project achievements with confidence.


4 diapositivas
Data Science and AI Big Data
Visualize the core relationship between AI, data science, and analytics using this interconnected circular diagram. Ideal for tech professionals, researchers, and AI educators to explain data-driven processes clearly. Fully editable in PowerPoint, Keynote, and Google Slides for seamless customization.


5 diapositivas
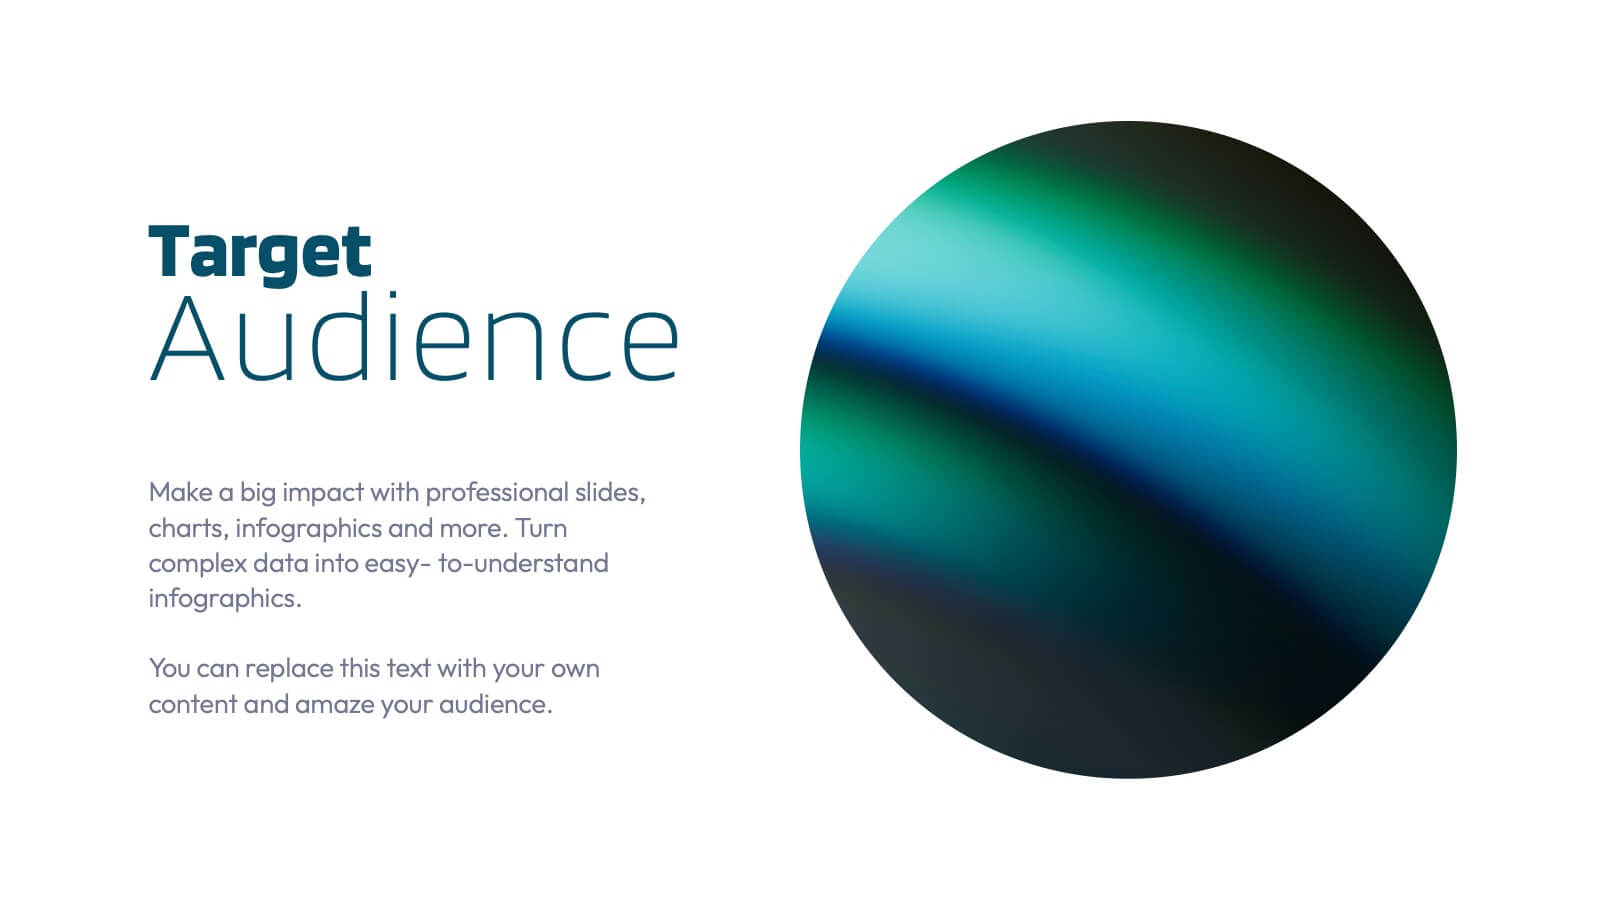
Defining Target Market and Audience Presentation
Identify and segment your ideal customer base with this visually structured pyramid slide. Designed to represent layered audience demographics or buyer personas, each level allows space for detailed insights and strategy alignment. The accompanying icons and side labels enhance clarity and storytelling for marketing, branding, or campaign planning presentations. Fully editable in PowerPoint, Keynote, and Google Slides to fit your branding and messaging needs.


7 diapositivas
Asia Population Infographic Presentation
An Asia Map infographic is a visual representation of the Asian continent, highlighting its geographic features, population, culture, history, and other relevant information. Use this template as a graphic representation of Asia that combines text, data, and images in a visually appealing and informative way. This template can be used as a political or physical maps, regional map, thematic maps, or a combination of these. They may also include charts, graphs, illustrations, photographs, or other visual elements to convey information effectively. This template is completely customizable.


7 diapositivas
Pyramid Model Infographic
A pyramid model is a visual representation that uses the structure of a pyramid to convey information, concepts, or hierarchies in a clear and visually engaging manner. Our Pyramid Model Infographic template is the perfect tool to depict your concepts in a structured way. This template embodies an essence, enabling you to present your ideas in a way that's both powerful and timeless. This infographic is a powerful representation of your ideas, allowing you to showcase their strength, structure, and enduring potential. Use this template to construct a visual masterpiece that stands tall, just like the pyramids of ancient times!


7 diapositivas
Data-Driven Market Segmentation Presentation
Visualize customer segments with clarity using the Data-Driven Market Segmentation Presentation. This template features a structured, interconnected diagram with six customizable data points, ideal for audience targeting, persona mapping, or campaign planning. Clean, modern, and easy to edit in PowerPoint, Keynote, or Google Slides.


22 diapositivas
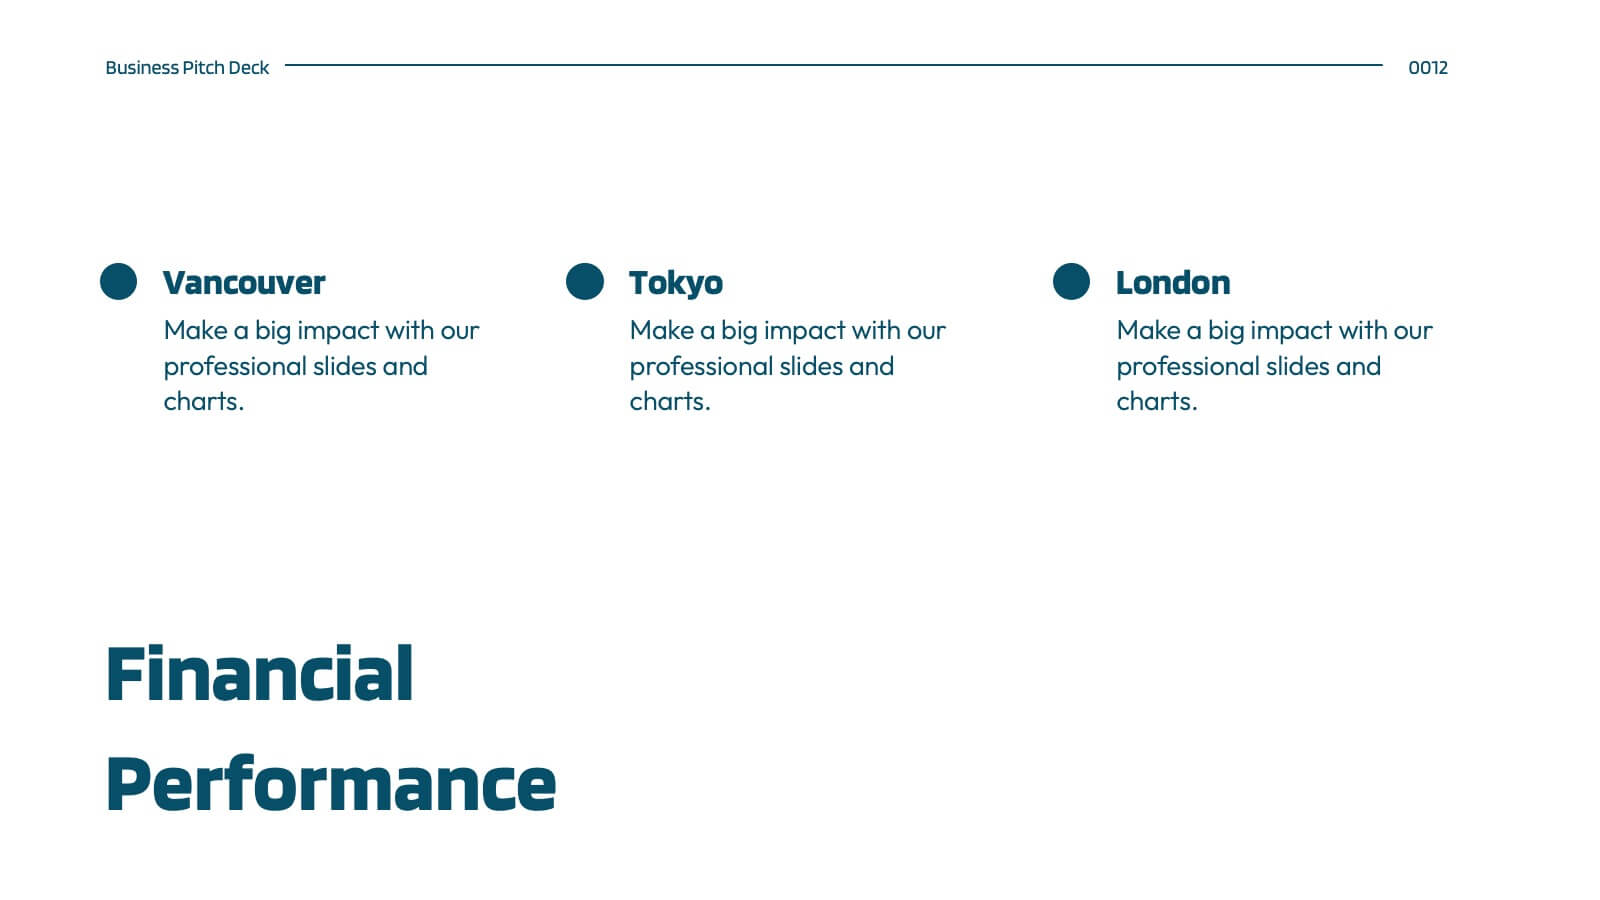
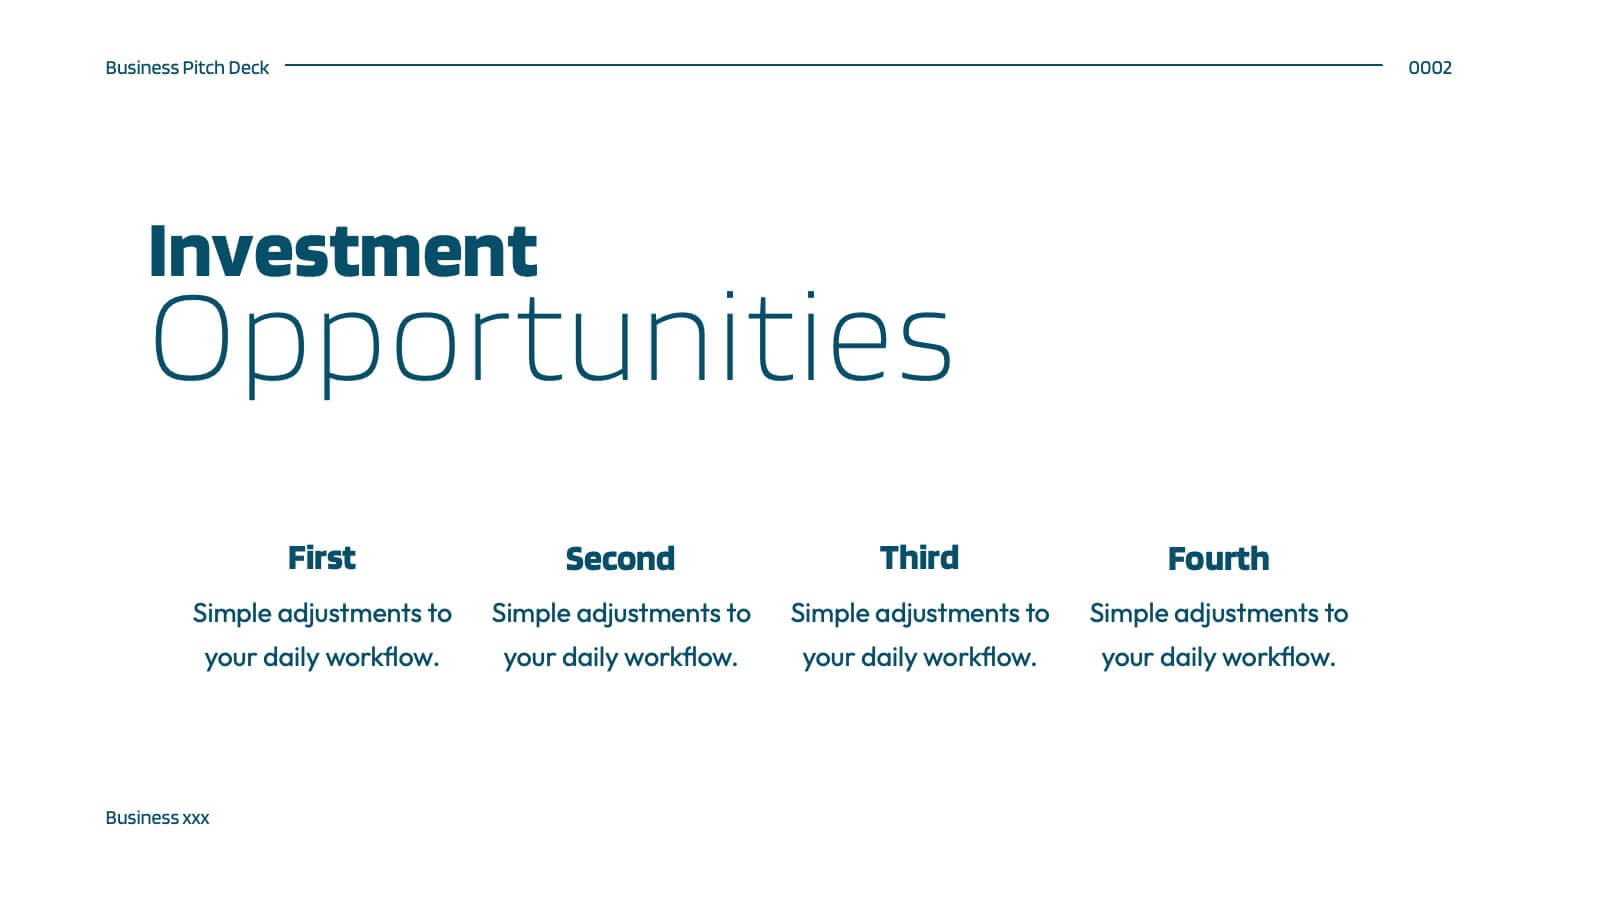
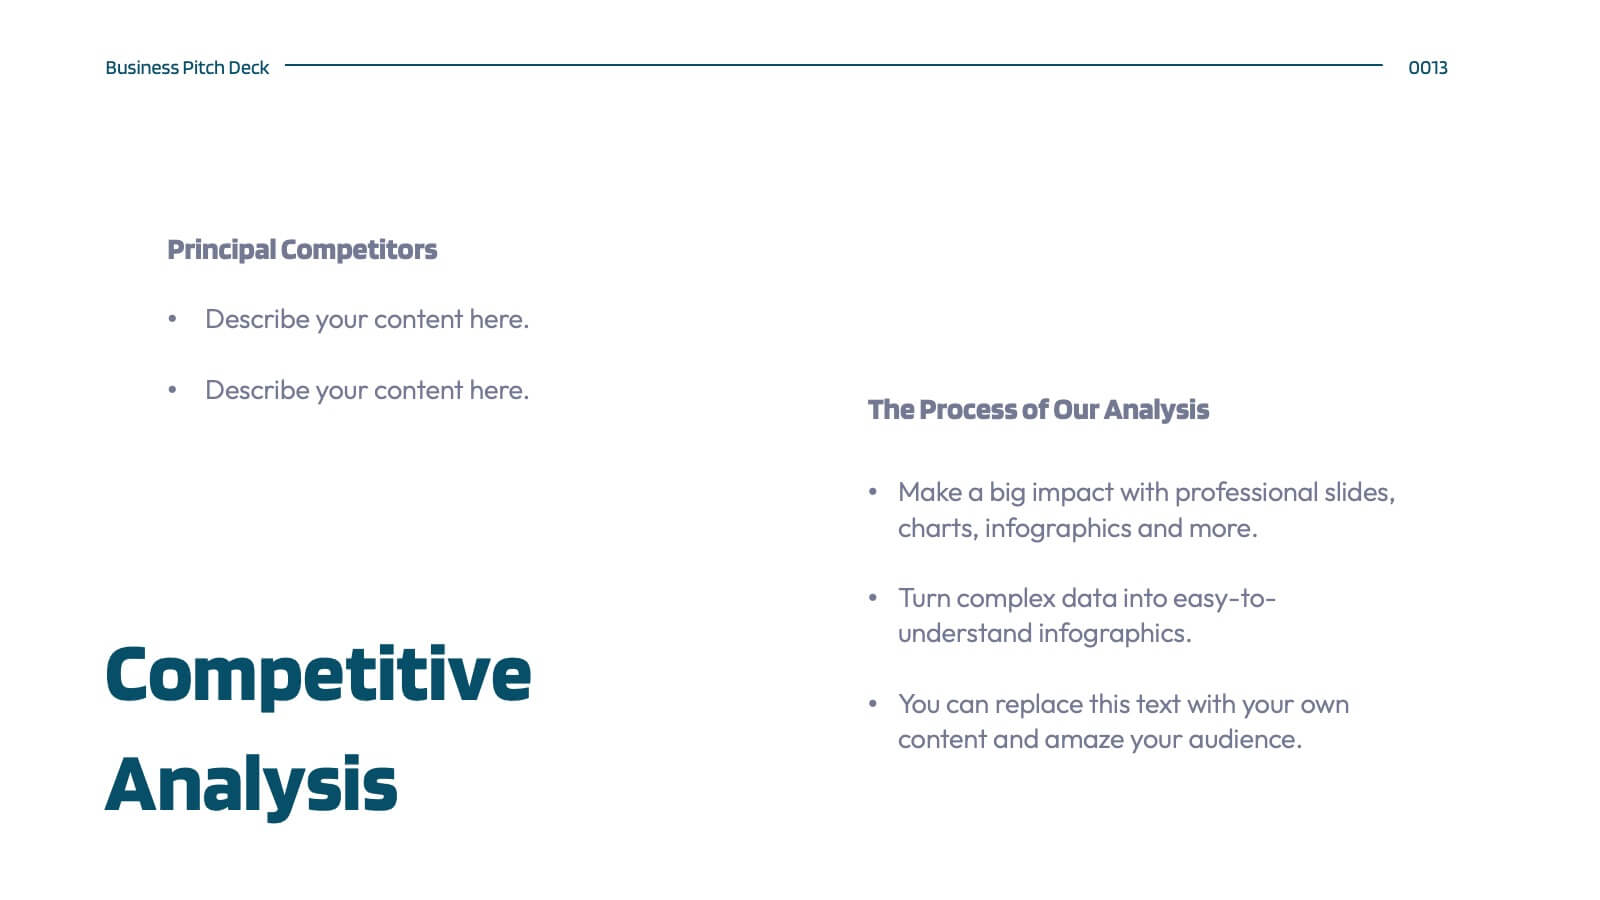
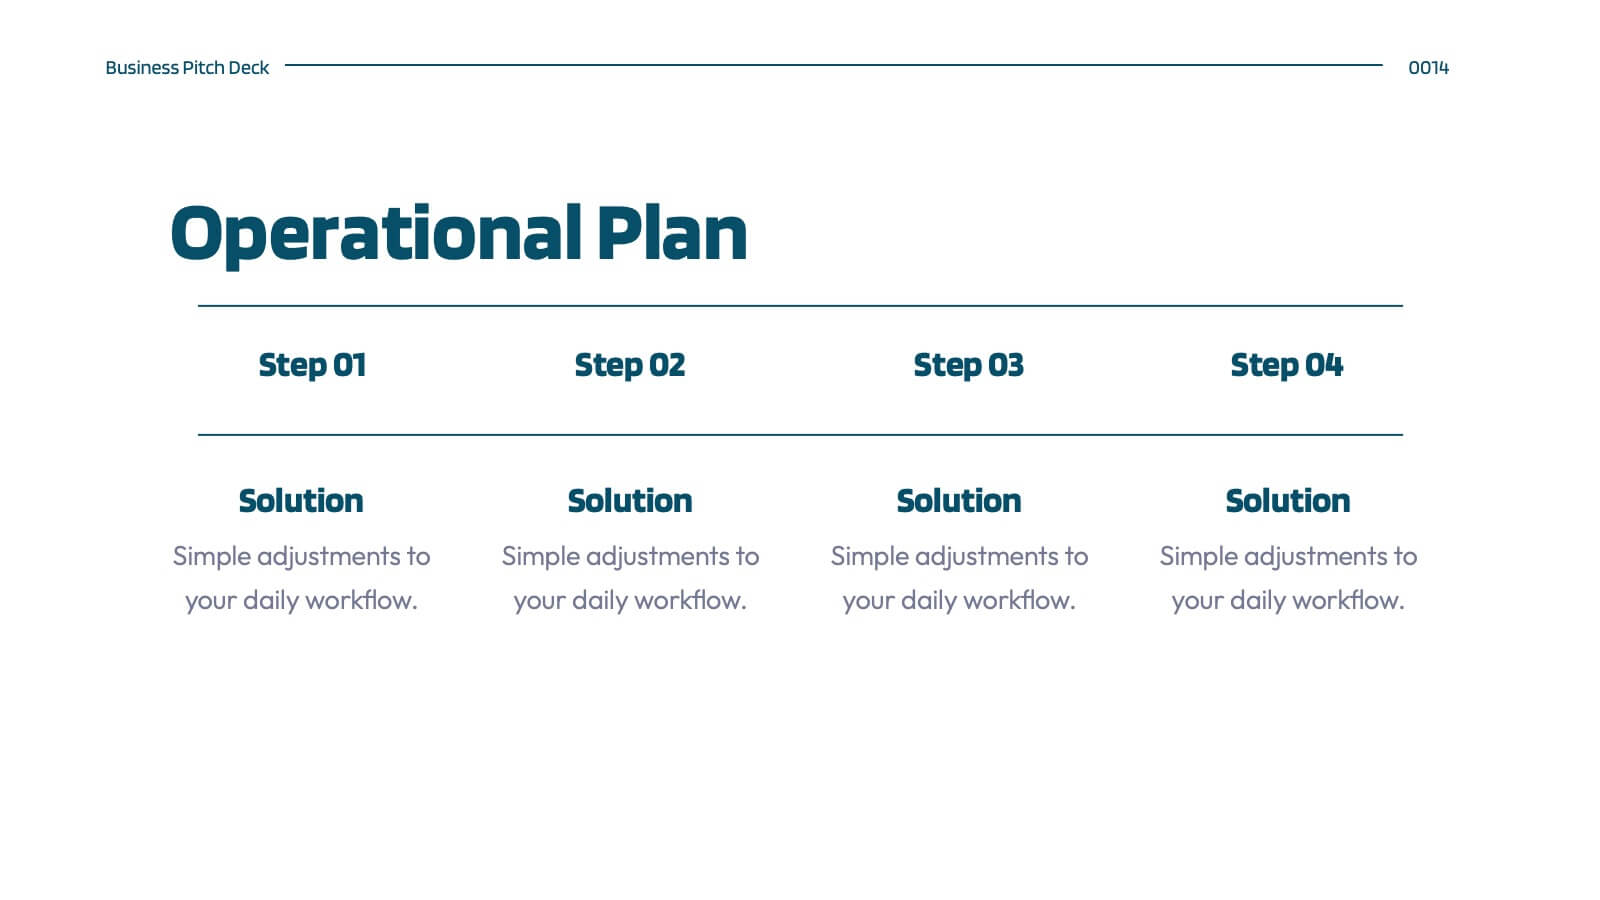
Hellenic Small Business Pitch Deck Presentation
Unleash the spirit of entrepreneurship with this captivating Hellenic-themed presentation! Designed specifically for small business pitches, this template allows you to showcase your business concept, market analysis, and financial plans with elegance and clarity. Its vibrant visuals will engage your audience and leave a lasting impression. Compatible with PowerPoint, Keynote, and Google Slides.


6 diapositivas
Tech Infrastructure Strategy Presentation
Build a smarter foundation for your tech-driven goals with a clear, layered design that showcases every stage of your technology roadmap. Perfect for presenting IT systems, cloud migration, or infrastructure planning, this presentation ensures clarity and impact. Fully compatible with PowerPoint, Keynote, and Google Slides for smooth customization.


6 diapositivas
Employee Change Management Strategy Presentation
Communicate change with clarity using this structured, gear-themed presentation slide. Designed to visualize six strategic stages of employee transition, it's ideal for HR professionals, team leaders, and consultants managing organizational change. Each step is represented with a numbered circle and aligned text for easy guidance. Fully customizable in PowerPoint, Keynote, and Google Slides.


4 diapositivas
Veterinary Medicine and Animal Health Presentation
Bring animal healthcare insights to life with this playful and professional slide, featuring an illustrated dog and four food bowls to represent key veterinary topics. Ideal for clinics, pet wellness brands, or animal science presentations. Fully editable in PowerPoint, Keynote, or Google Slides.


8 diapositivas
Professional Title Slide Presentation
Start your presentation with impact using a bold, modern cover design that captures attention instantly. Perfect for introducing reports, creative projects, or business pitches, this layout combines professional typography with clean visuals for a polished first impression. Fully editable in PowerPoint, Keynote, and Google Slides for seamless customization.


6 diapositivas
Framework Diagram Layout Presentation
Bring structure to your ideas with this sleek and modern presentation layout designed for clarity and flow. Perfect for visualizing systems, workflows, and strategic processes, it helps audiences grasp relationships between concepts effortlessly. Fully editable and compatible with PowerPoint, Keynote, and Google Slides for smooth customization and professional results.


10 diapositivas
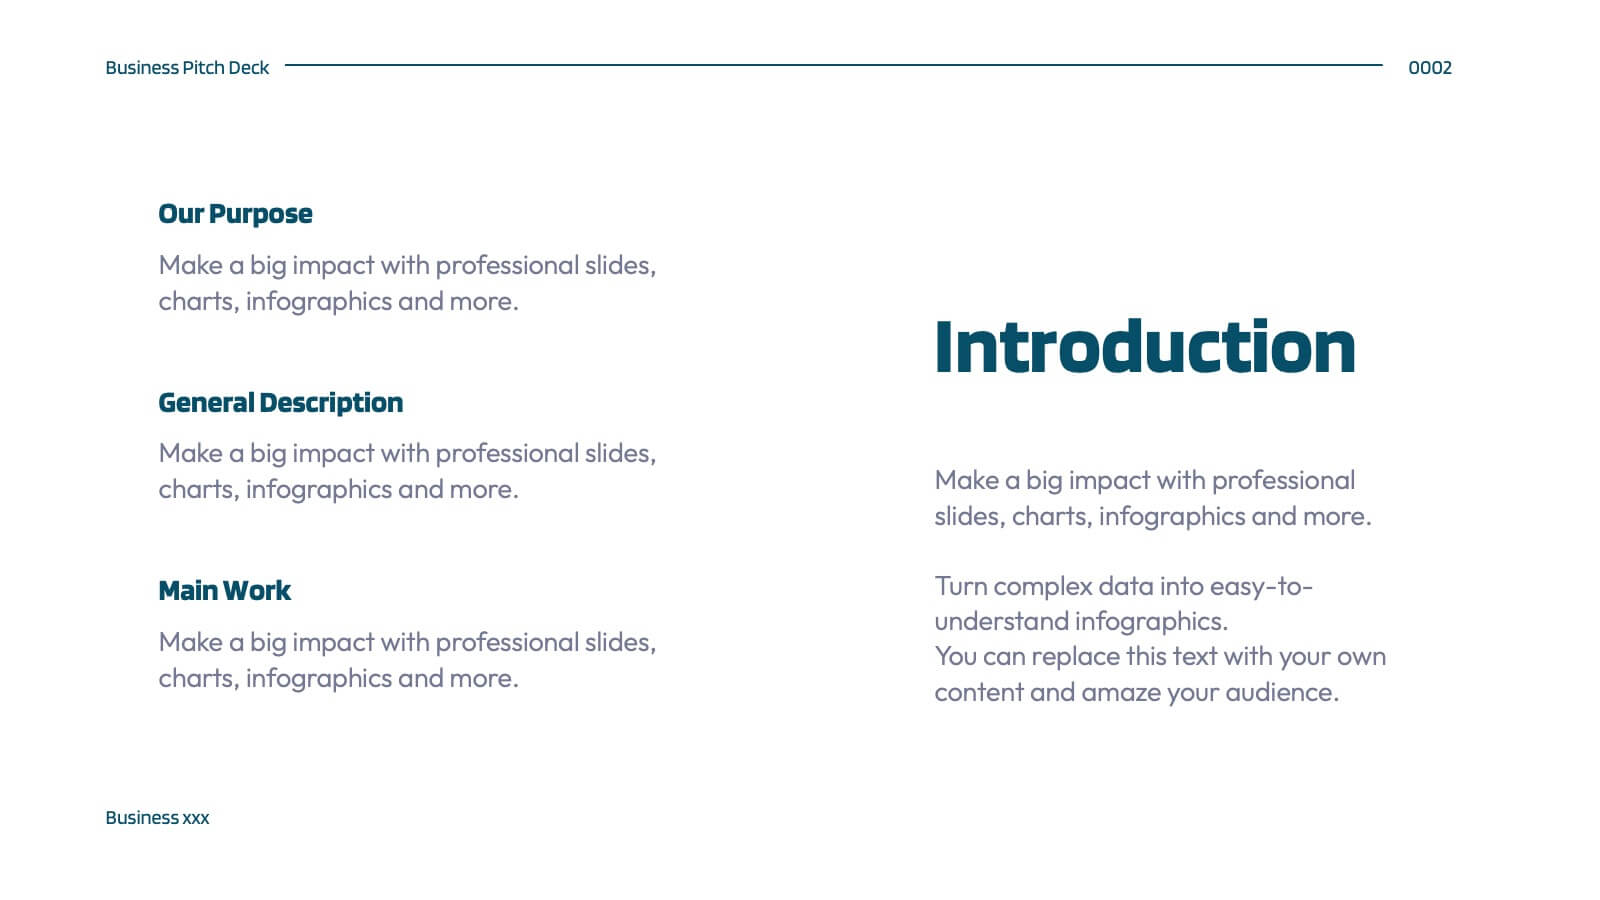
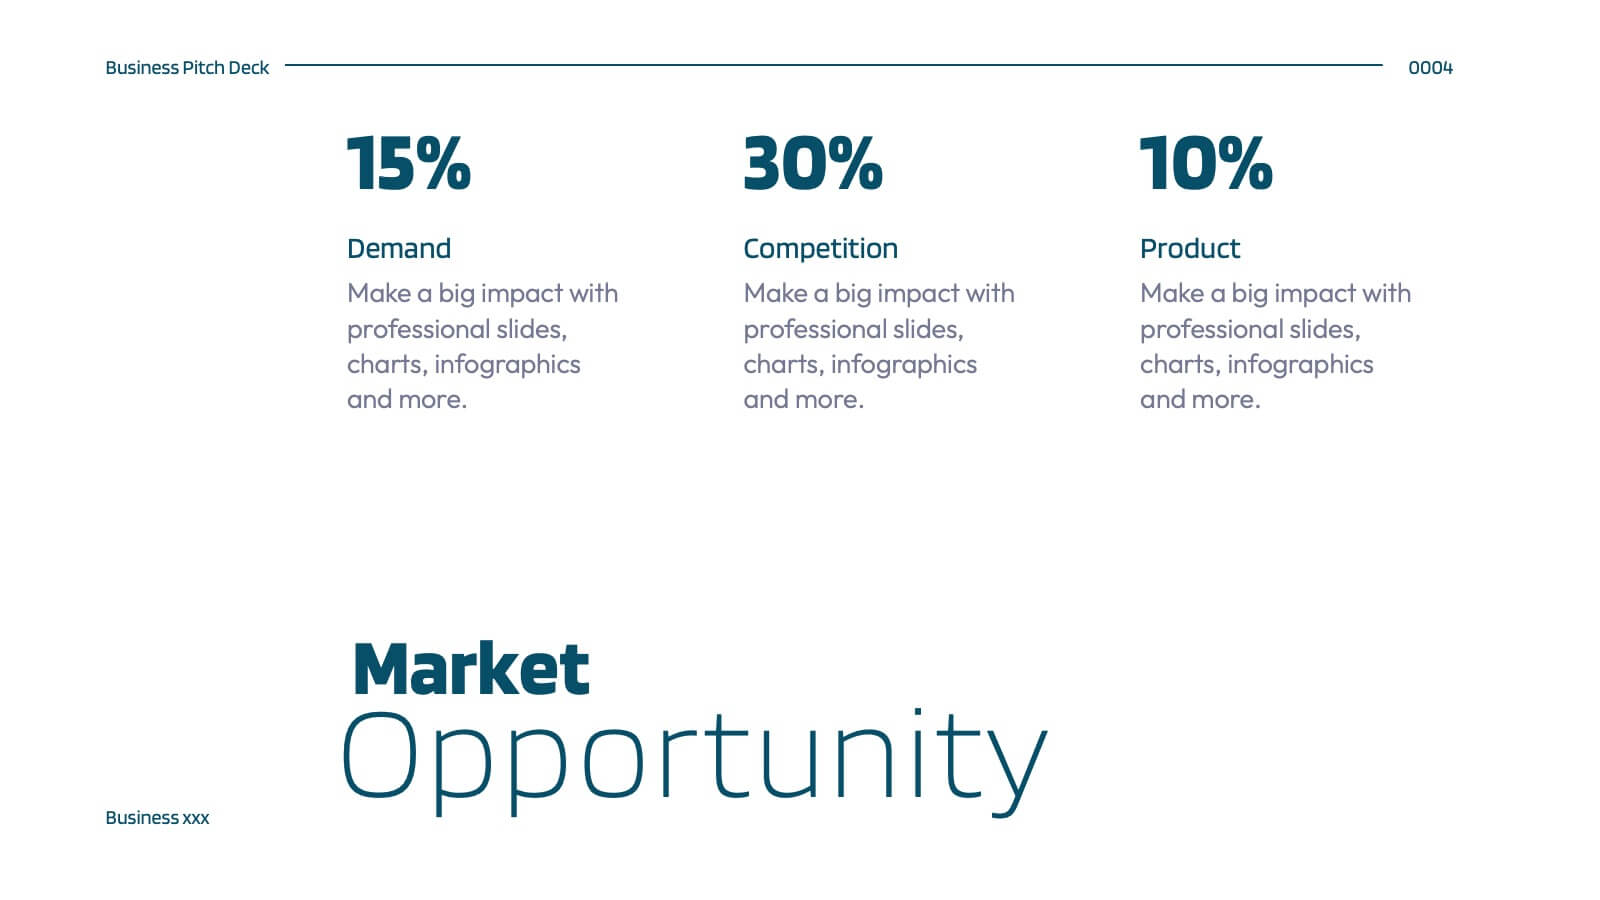
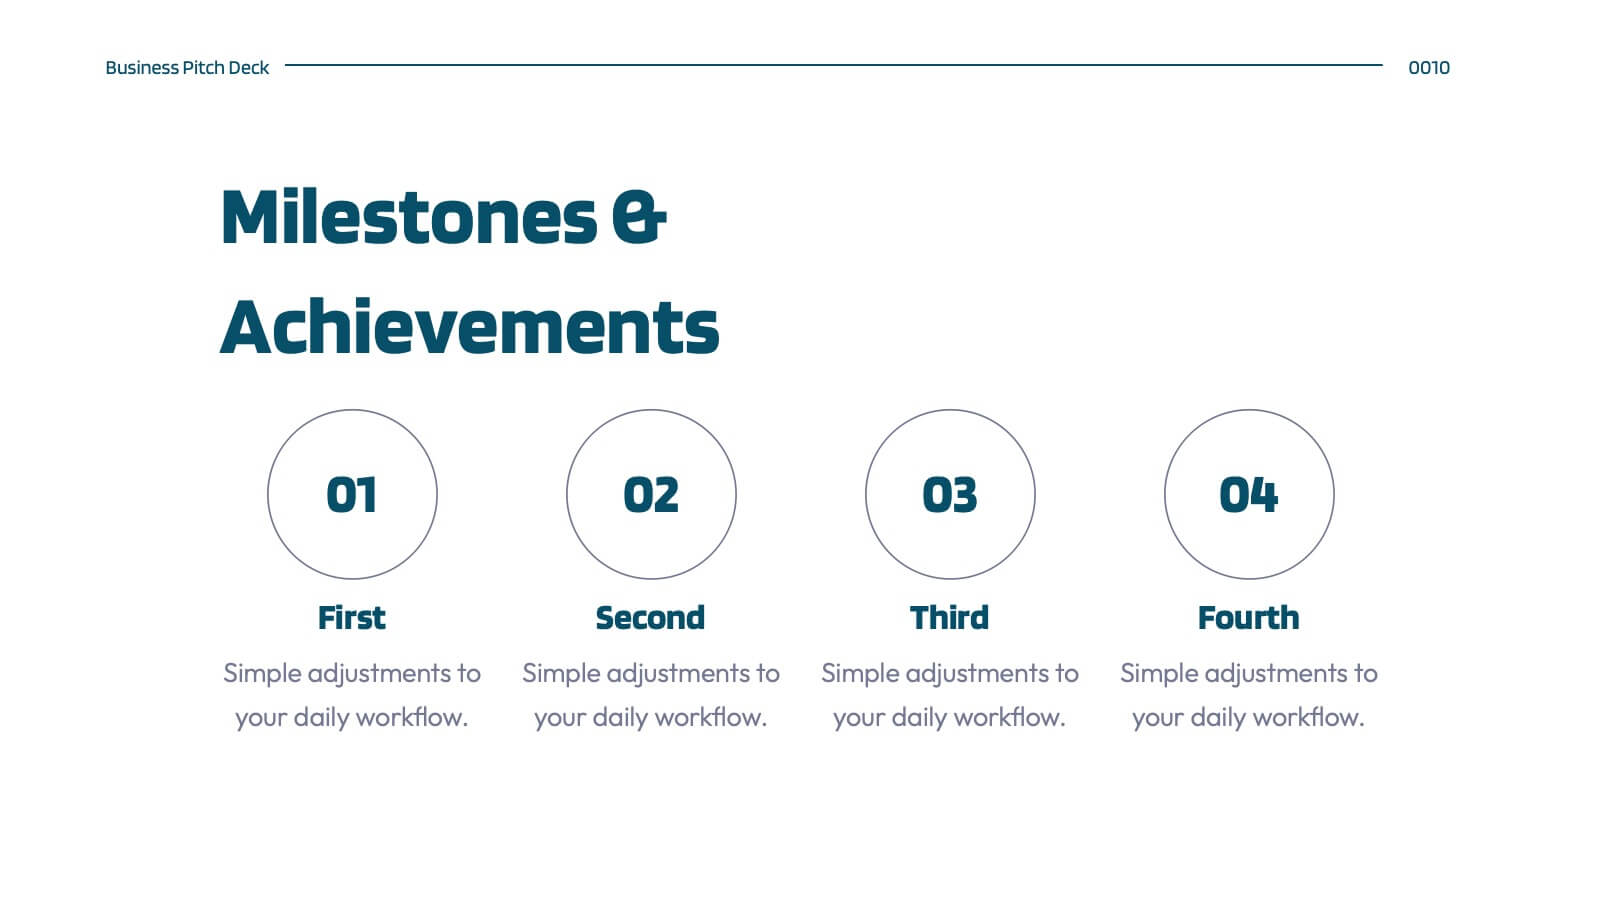
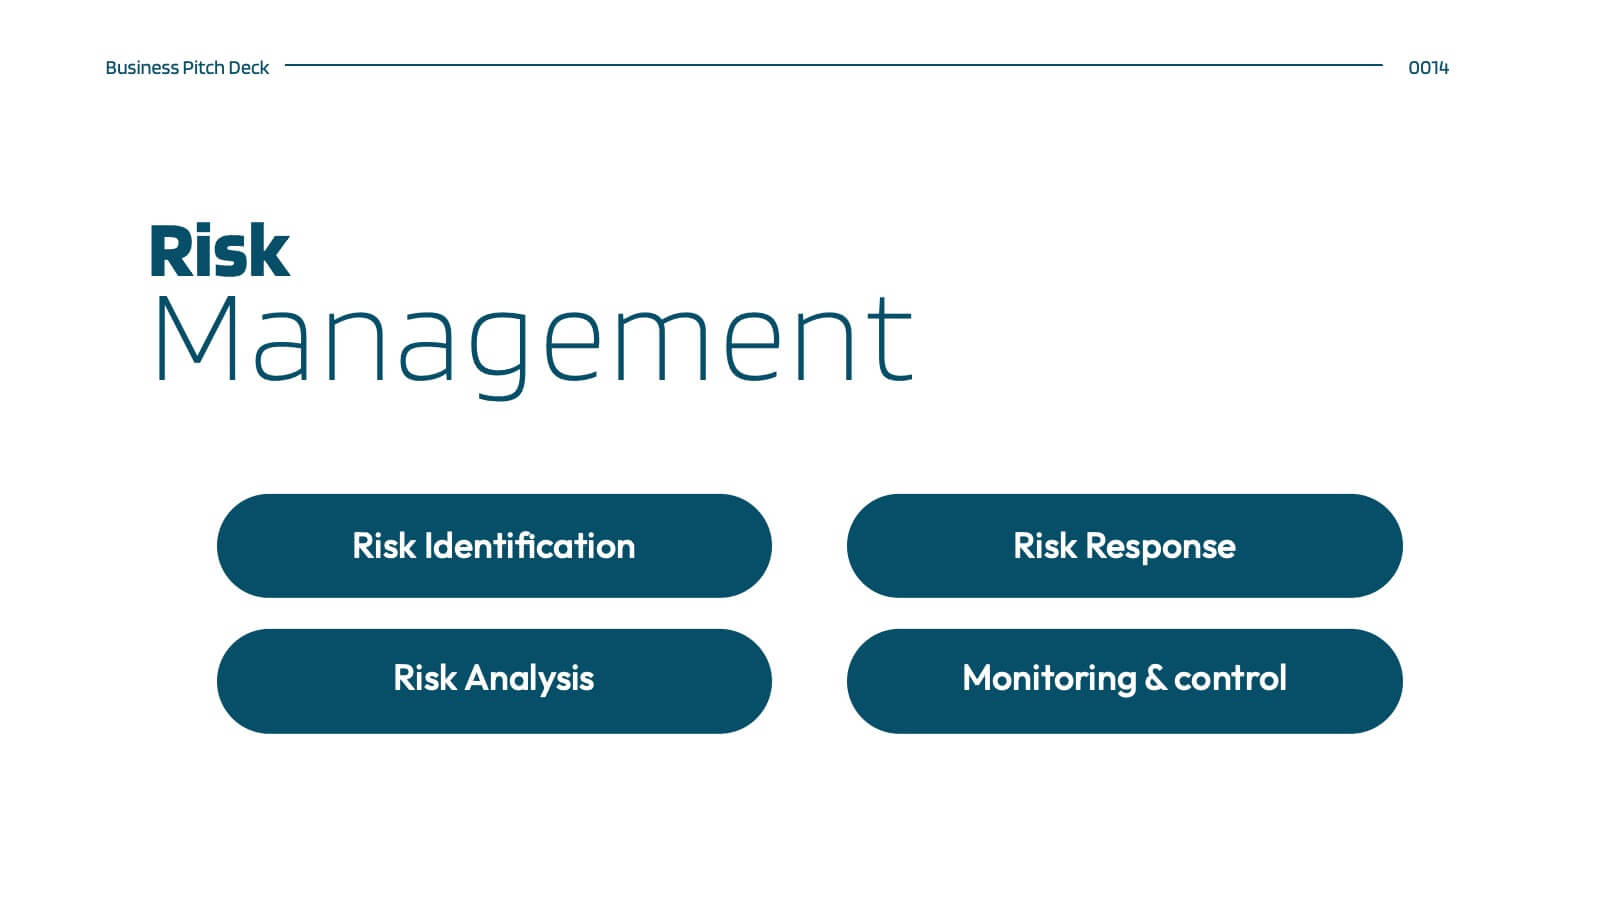
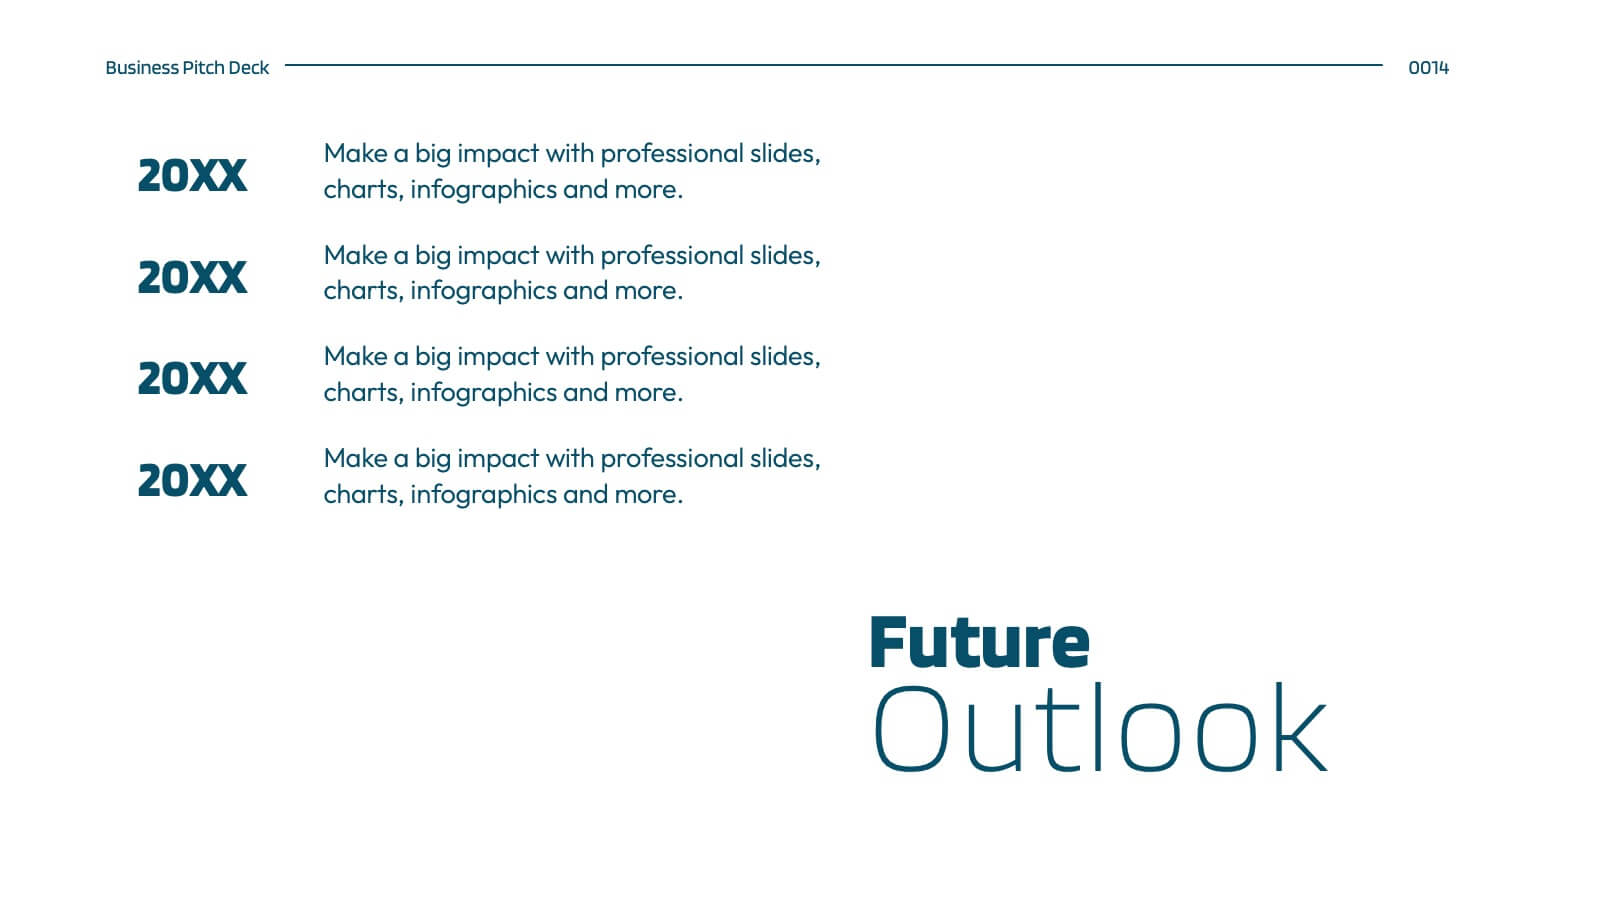
Startup Executive Overview Template Presentation
Bring your startup’s big picture to life in one smart, visual swoop! This infographic presentation template helps you map out key insights and milestones in a clean, modern layout. Ideal for pitching ideas, aligning teams, or showcasing growth strategies. Fully compatible with PowerPoint, Keynote, and Google Slides for easy editing.


10 diapositivas
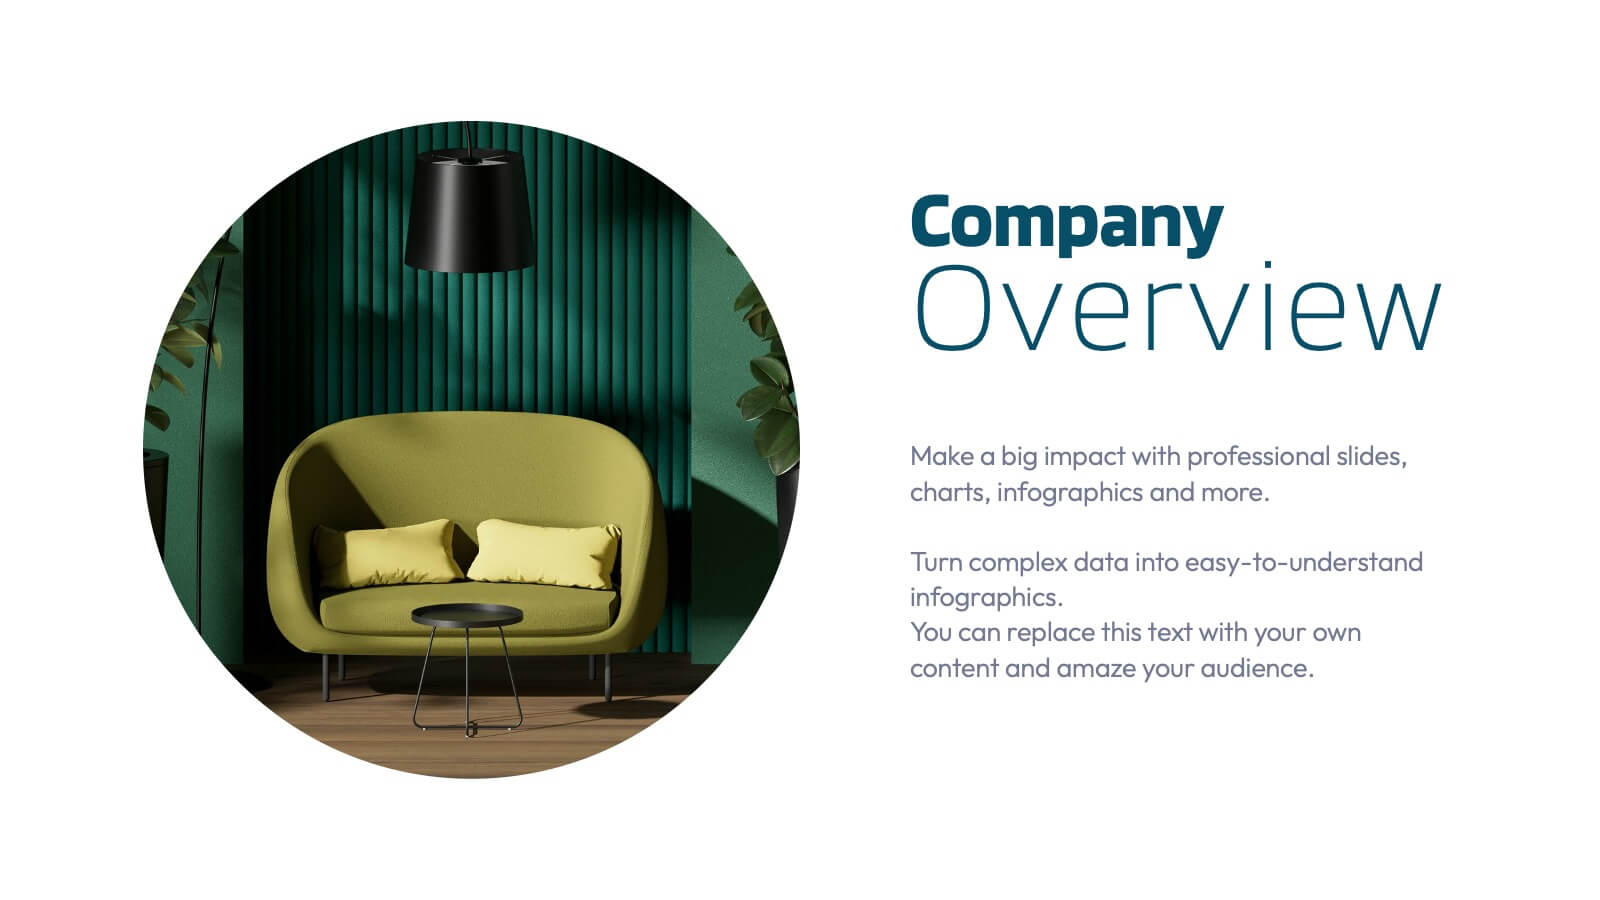
Healthcare Services Overview Presentation
Make your healthcare data shine with a presentation that communicates trust, precision, and clarity. Perfect for showcasing services, medical results, or research insights, this clean layout highlights each section with visual balance and professionalism. Fully customizable and compatible with PowerPoint, Keynote, and Google Slides for seamless editing.