


Características


¿Tienes alguna pregunta?
Recomendar


7 diapositivas
Business Puzzle Infographic Presentation
A Puzzle Piece Infographic is great for visualizing and communicating complex topics, such as the order of steps to solve a problem or a methodical process. This template is great if you want to show your audience how different topics relate to each other, or if you want to illustrate how information fits together. This infographic will allow you to showcase your data and information in a fun, visual way. The puzzle design will help you organize information for your audience to easily understand. This template is compatible with Powerpoint, keynote and google slides, making it easy to edit!


7 diapositivas
Skills Gap Analysis Tool Infographic
Optimize workforce potential with our Skills Gap Analysis Tool Infographic, designed for HR professionals, team leaders, and organizational development experts. This infographic provides a visual representation of the skills present within a team and identifies areas requiring development. Our infographic lays out a systematic approach to assessing competency levels across various skill sets, highlighting strengths and gaps in your team's abilities. It includes segments for rating proficiency, mapping skill distribution, and planning for training or recruitment to bridge any gaps. With this tool, you can create a clear and actionable skills inventory that supports strategic workforce planning and personal development. This SEO-optimized infographic is crafted to guide you in aligning your team's skills with organizational goals. Leverage this infographic to conduct comprehensive skills gap analyses, ensuring your team has the capabilities to meet current and future challenges effectively.


20 diapositivas
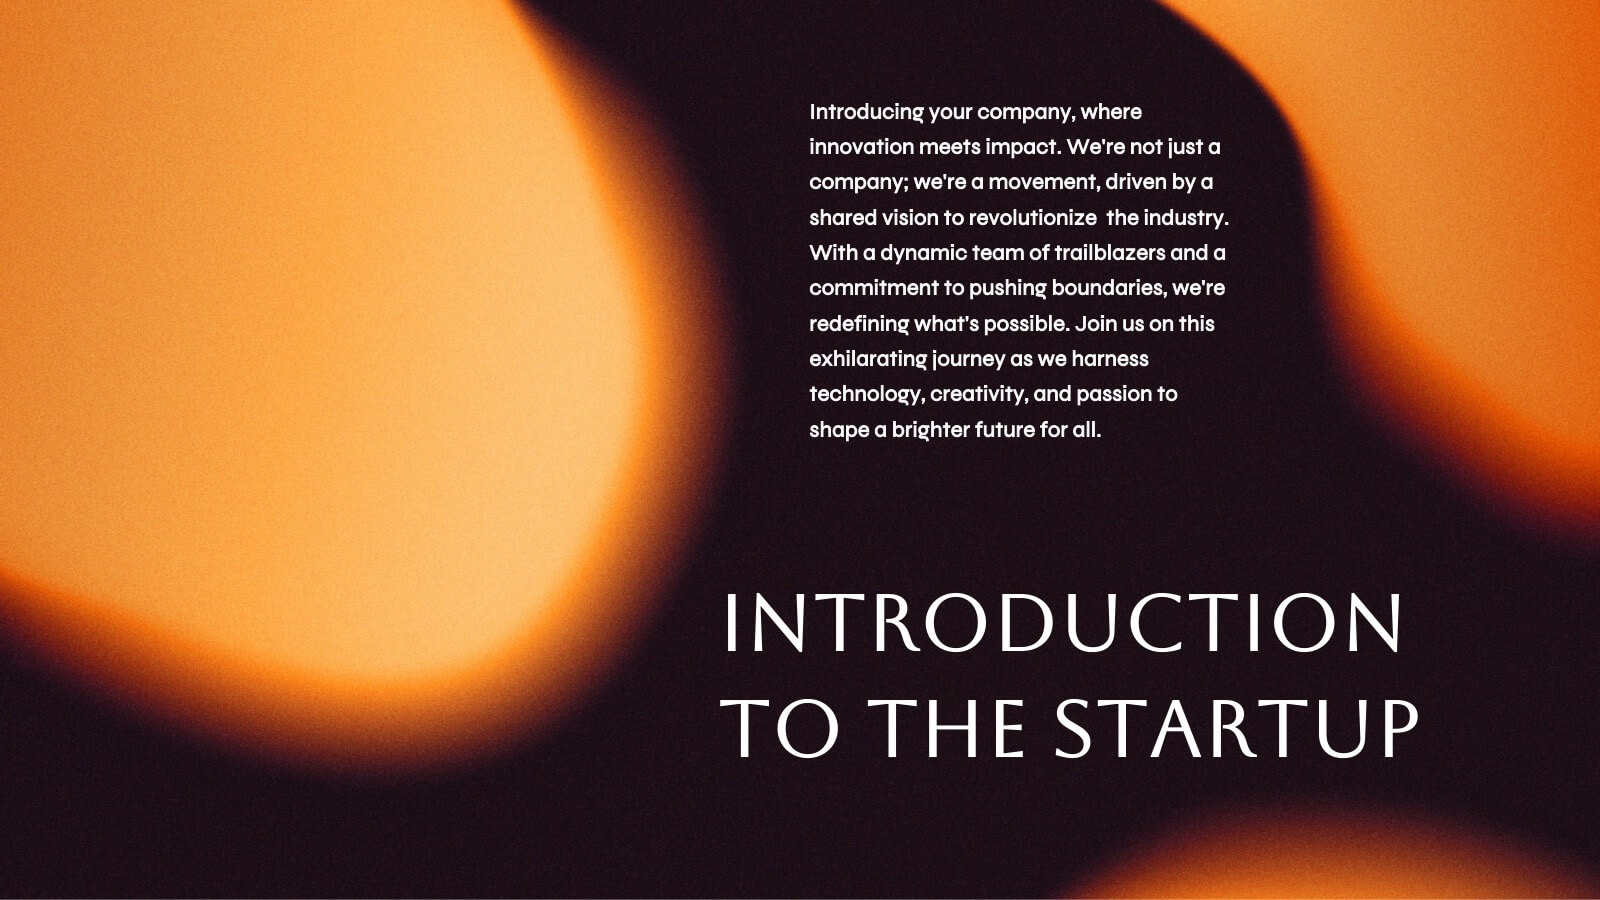
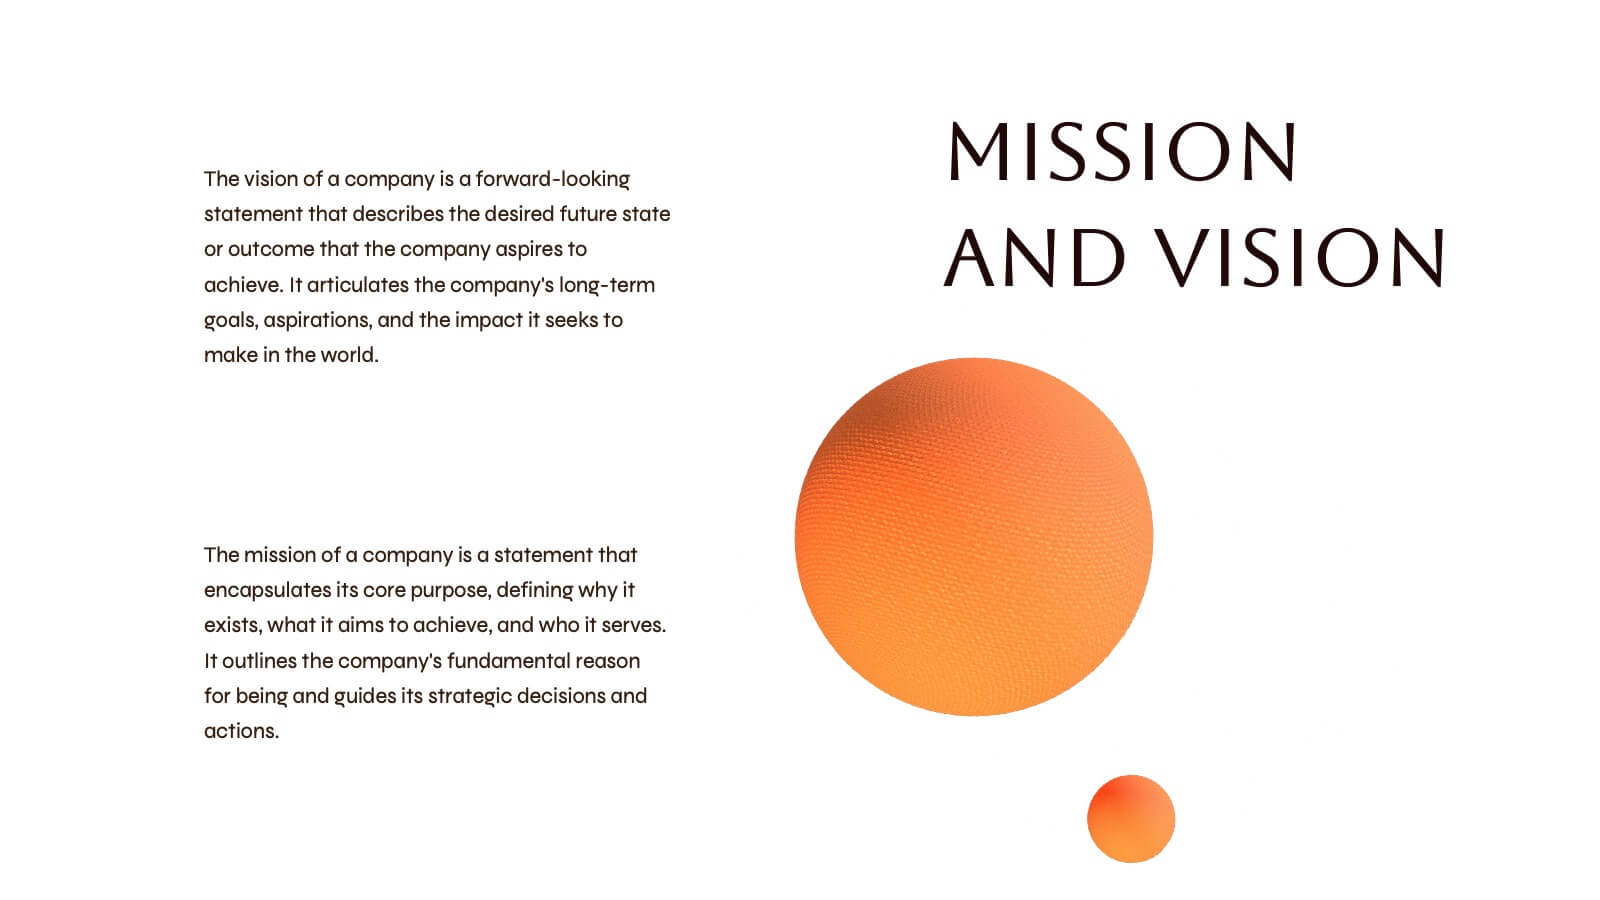
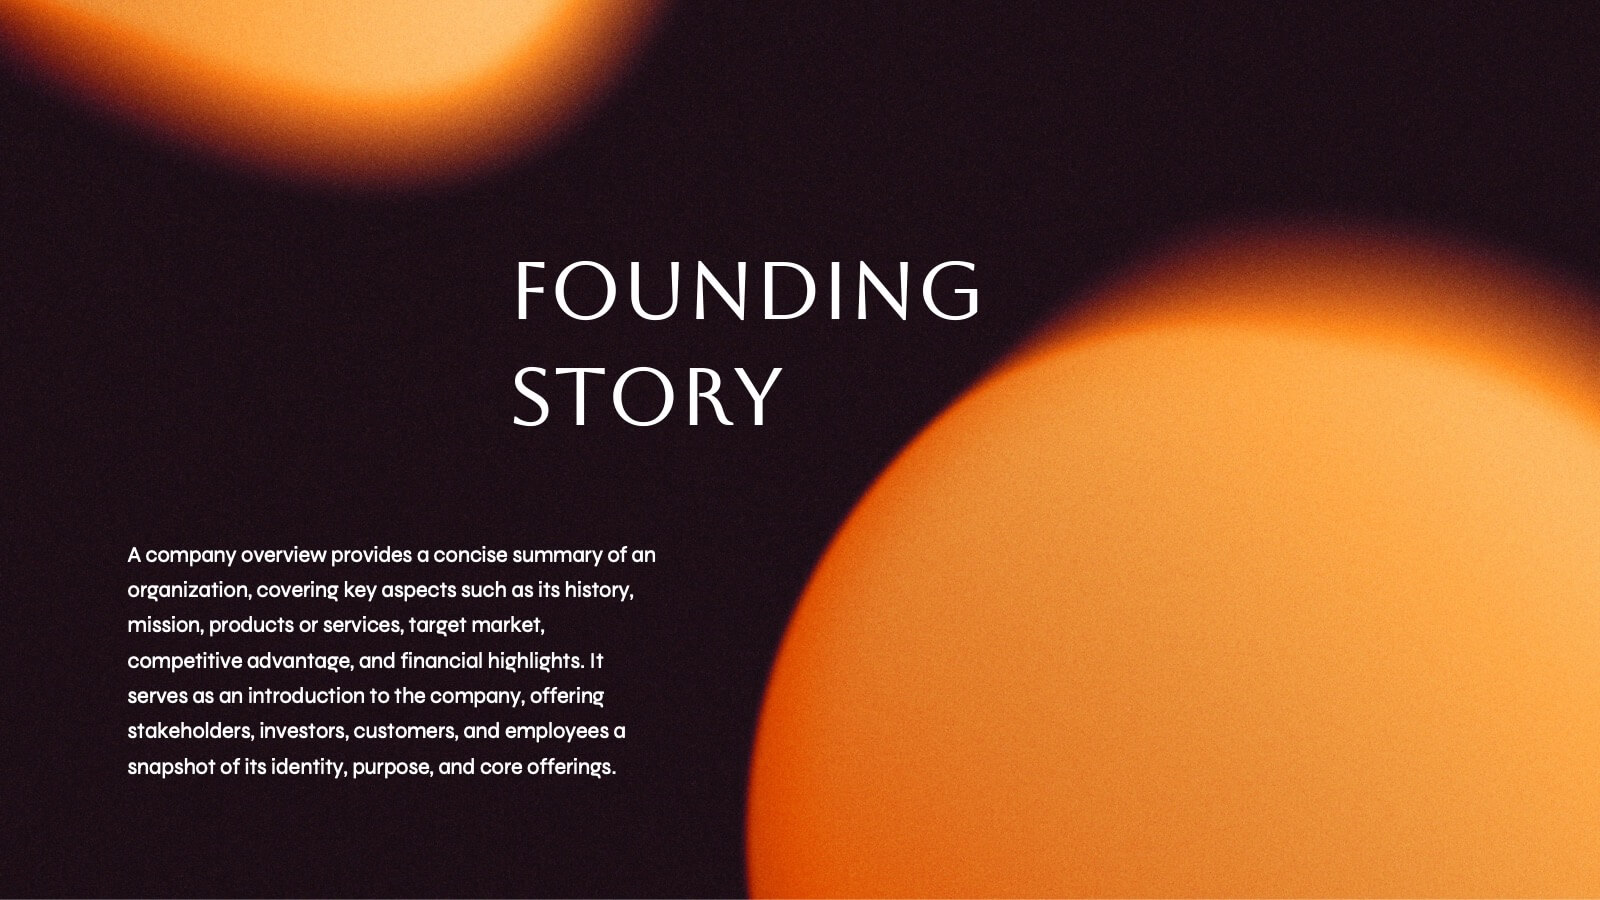
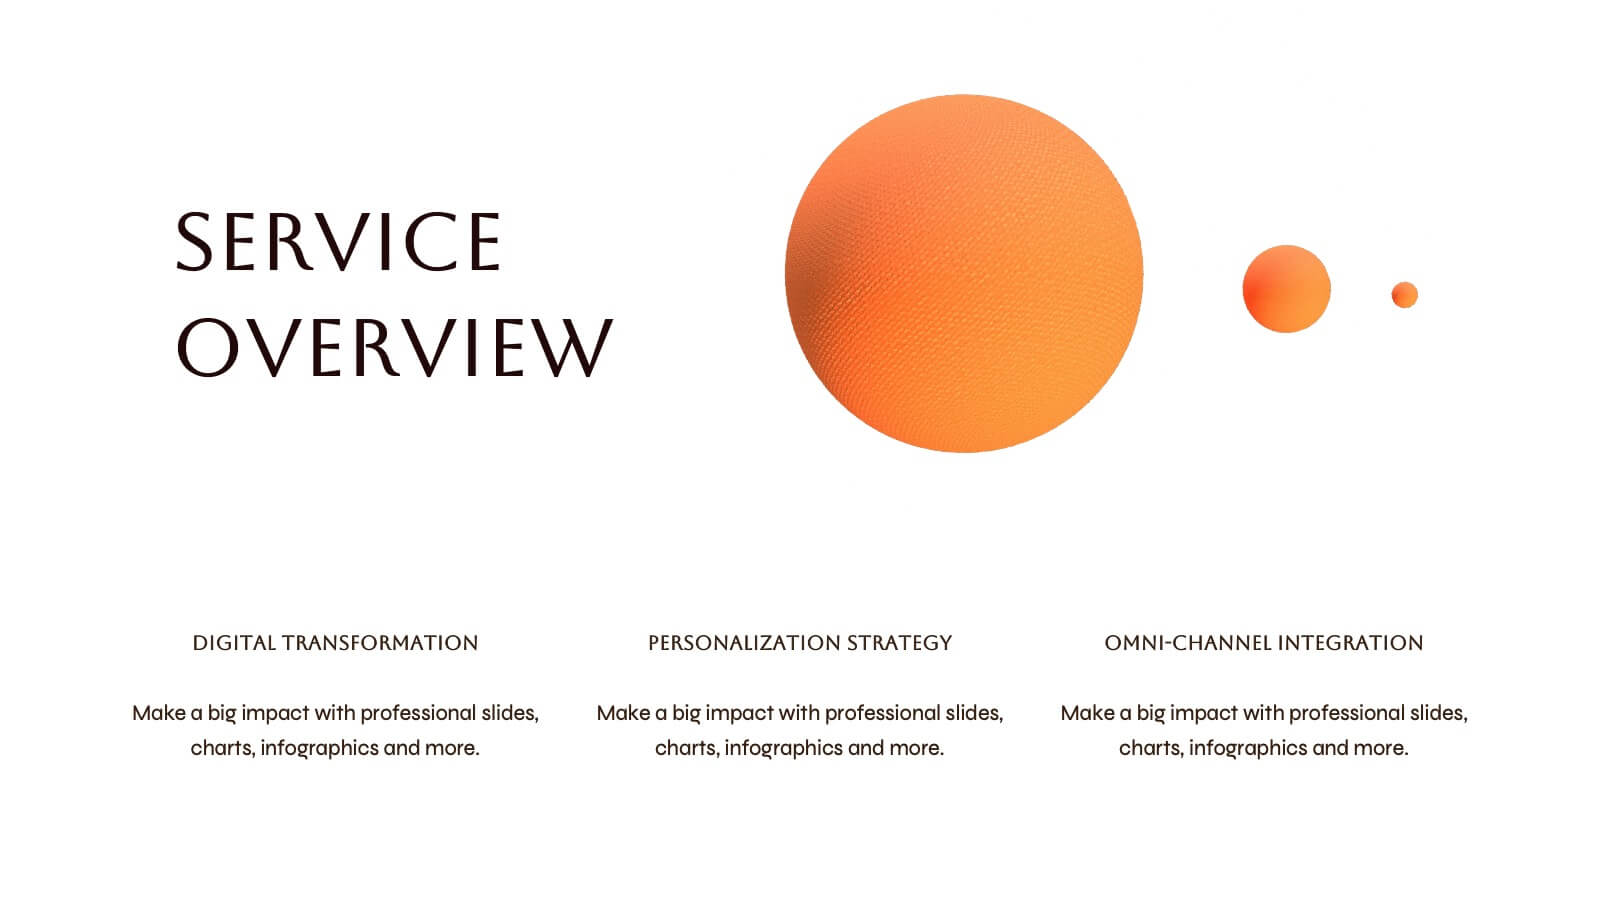
Fire Spin Startup Pitch Deck Presentation
Ignite your pitch with this bold, fire-inspired presentation template, perfect for showcasing your startup’s potential! This deck helps you present key business elements like market research, revenue models, and growth strategies in a dynamic, visually engaging format. Stand out from the competition. Compatible with PowerPoint, Keynote, and Google Slides.


5 diapositivas
Workforce Alignment Strategy Presentation
Energize your strategy conversations with a clean, modern layout that makes team alignment feel clear, structured, and actionable. This presentation helps you break down goals, track priorities, and visualize key initiatives in a simple, intuitive flow. Ideal for planning sessions and leadership updates. Fully compatible with PowerPoint, Keynote, and Google Slides.


10 diapositivas
National Distribution Network in the US Presentation
Present your logistics strategy with clarity using the National Distribution Network in the US Presentation. This slide visually maps out your key distribution hubs across the country, pairing each location with a numbered label and space for insights or logistics data. Ideal for supply chain overviews, retail operations, or partner briefings. Fully editable in Canva, PowerPoint, and Google Slides.


20 diapositivas
Amethyst Marketing Proposal Template Presentation
Bring your marketing ideas to life with this eye-catching amethyst-themed presentation! Tailored for presenting your marketing proposals, this template helps you outline key strategies, campaigns, and target audiences in a sleek, professional design. Its bold layout ensures your message shines through. Compatible with PowerPoint, Keynote, and Google Slides.


5 diapositivas
Root Cause Business Problem Slide
Uncover the foundation of complex challenges with this tree-inspired slide—perfect for visualizing root causes behind business problems. Showcase contributing factors at each root to guide effective solutions. Fully editable in PowerPoint, Keynote, and Google Slides.


7 diapositivas
Frequently Asked Questions (FAQ)
Answer key concerns clearly with this Frequently Asked Questions (FAQ) infographic template. Featuring a clean question mark-centered design with six content blocks, this layout is perfect for addressing customer queries, onboarding information, or stakeholder briefs. Fully customizable in PowerPoint, Keynote, and Google Slides.


6 diapositivas
Market Pressure Analysis with Five Forces Presentation
The Market Pressure Analysis with Five Forces Presentation offers a creative and easy-to-understand layout for applying Porter's Five Forces model. Designed with a distinctive star-like visual, each force—New Entry, Supplier, Competitive Rivalry, Buyer, and Substitutes—is clearly labeled with alphabetical markers (A–E) and corresponding icons. This format is perfect for showcasing industry dynamics in strategy meetings, marketing analysis, or competitive research. Each force can be highlighted individually for focused discussion. Fully customizable and compatible with PowerPoint, Keynote, and Google Slides.


5 diapositivas
Yearly Employee Performance Review Presentation
Celebrate your team’s progress with a modern, data-rich design that’s clear, visual, and professional. This template makes it easy to present yearly performance metrics, individual achievements, and growth comparisons through engaging charts and infographics. Perfect for annual reports and reviews. Compatible with PowerPoint, Keynote, and Google Slides for effortless editing.


5 diapositivas
Growth and Scale Indicators Overview Presentation
Highlight your company's upward momentum with the Growth and Scale Indicators Overview Presentation. This slide features a pyramid-style design to represent five progressive milestones or performance metrics, perfect for visualizing success benchmarks or key achievements. Fully customizable in Canva, PowerPoint, Keynote, and Google Slides for seamless integration into your presentations.


22 diapositivas
Event Agenda Presentation
Organize your event with precision using this Event Agenda presentation template. Designed for clarity and impact, it includes slides for conference overviews, speaker introductions, session descriptions, and networking opportunities. Perfect for business conferences or workshops, this template is compatible with PowerPoint, Keynote, and Google Slides, ensuring your event runs smoothly and professionally.


4 diapositivas
Personalized Learning Experience Presentation
Present tailored learning paths with this vibrant personalized education slide. Designed with sticky-note and pin graphics, it's ideal for breaking down individual goals, curriculum customization, or adaptive learning models. Fully editable in PowerPoint, Keynote, and Google Slides—perfect for educators, trainers, and instructional designers seeking clarity and engagement in learning presentations.


8 diapositivas
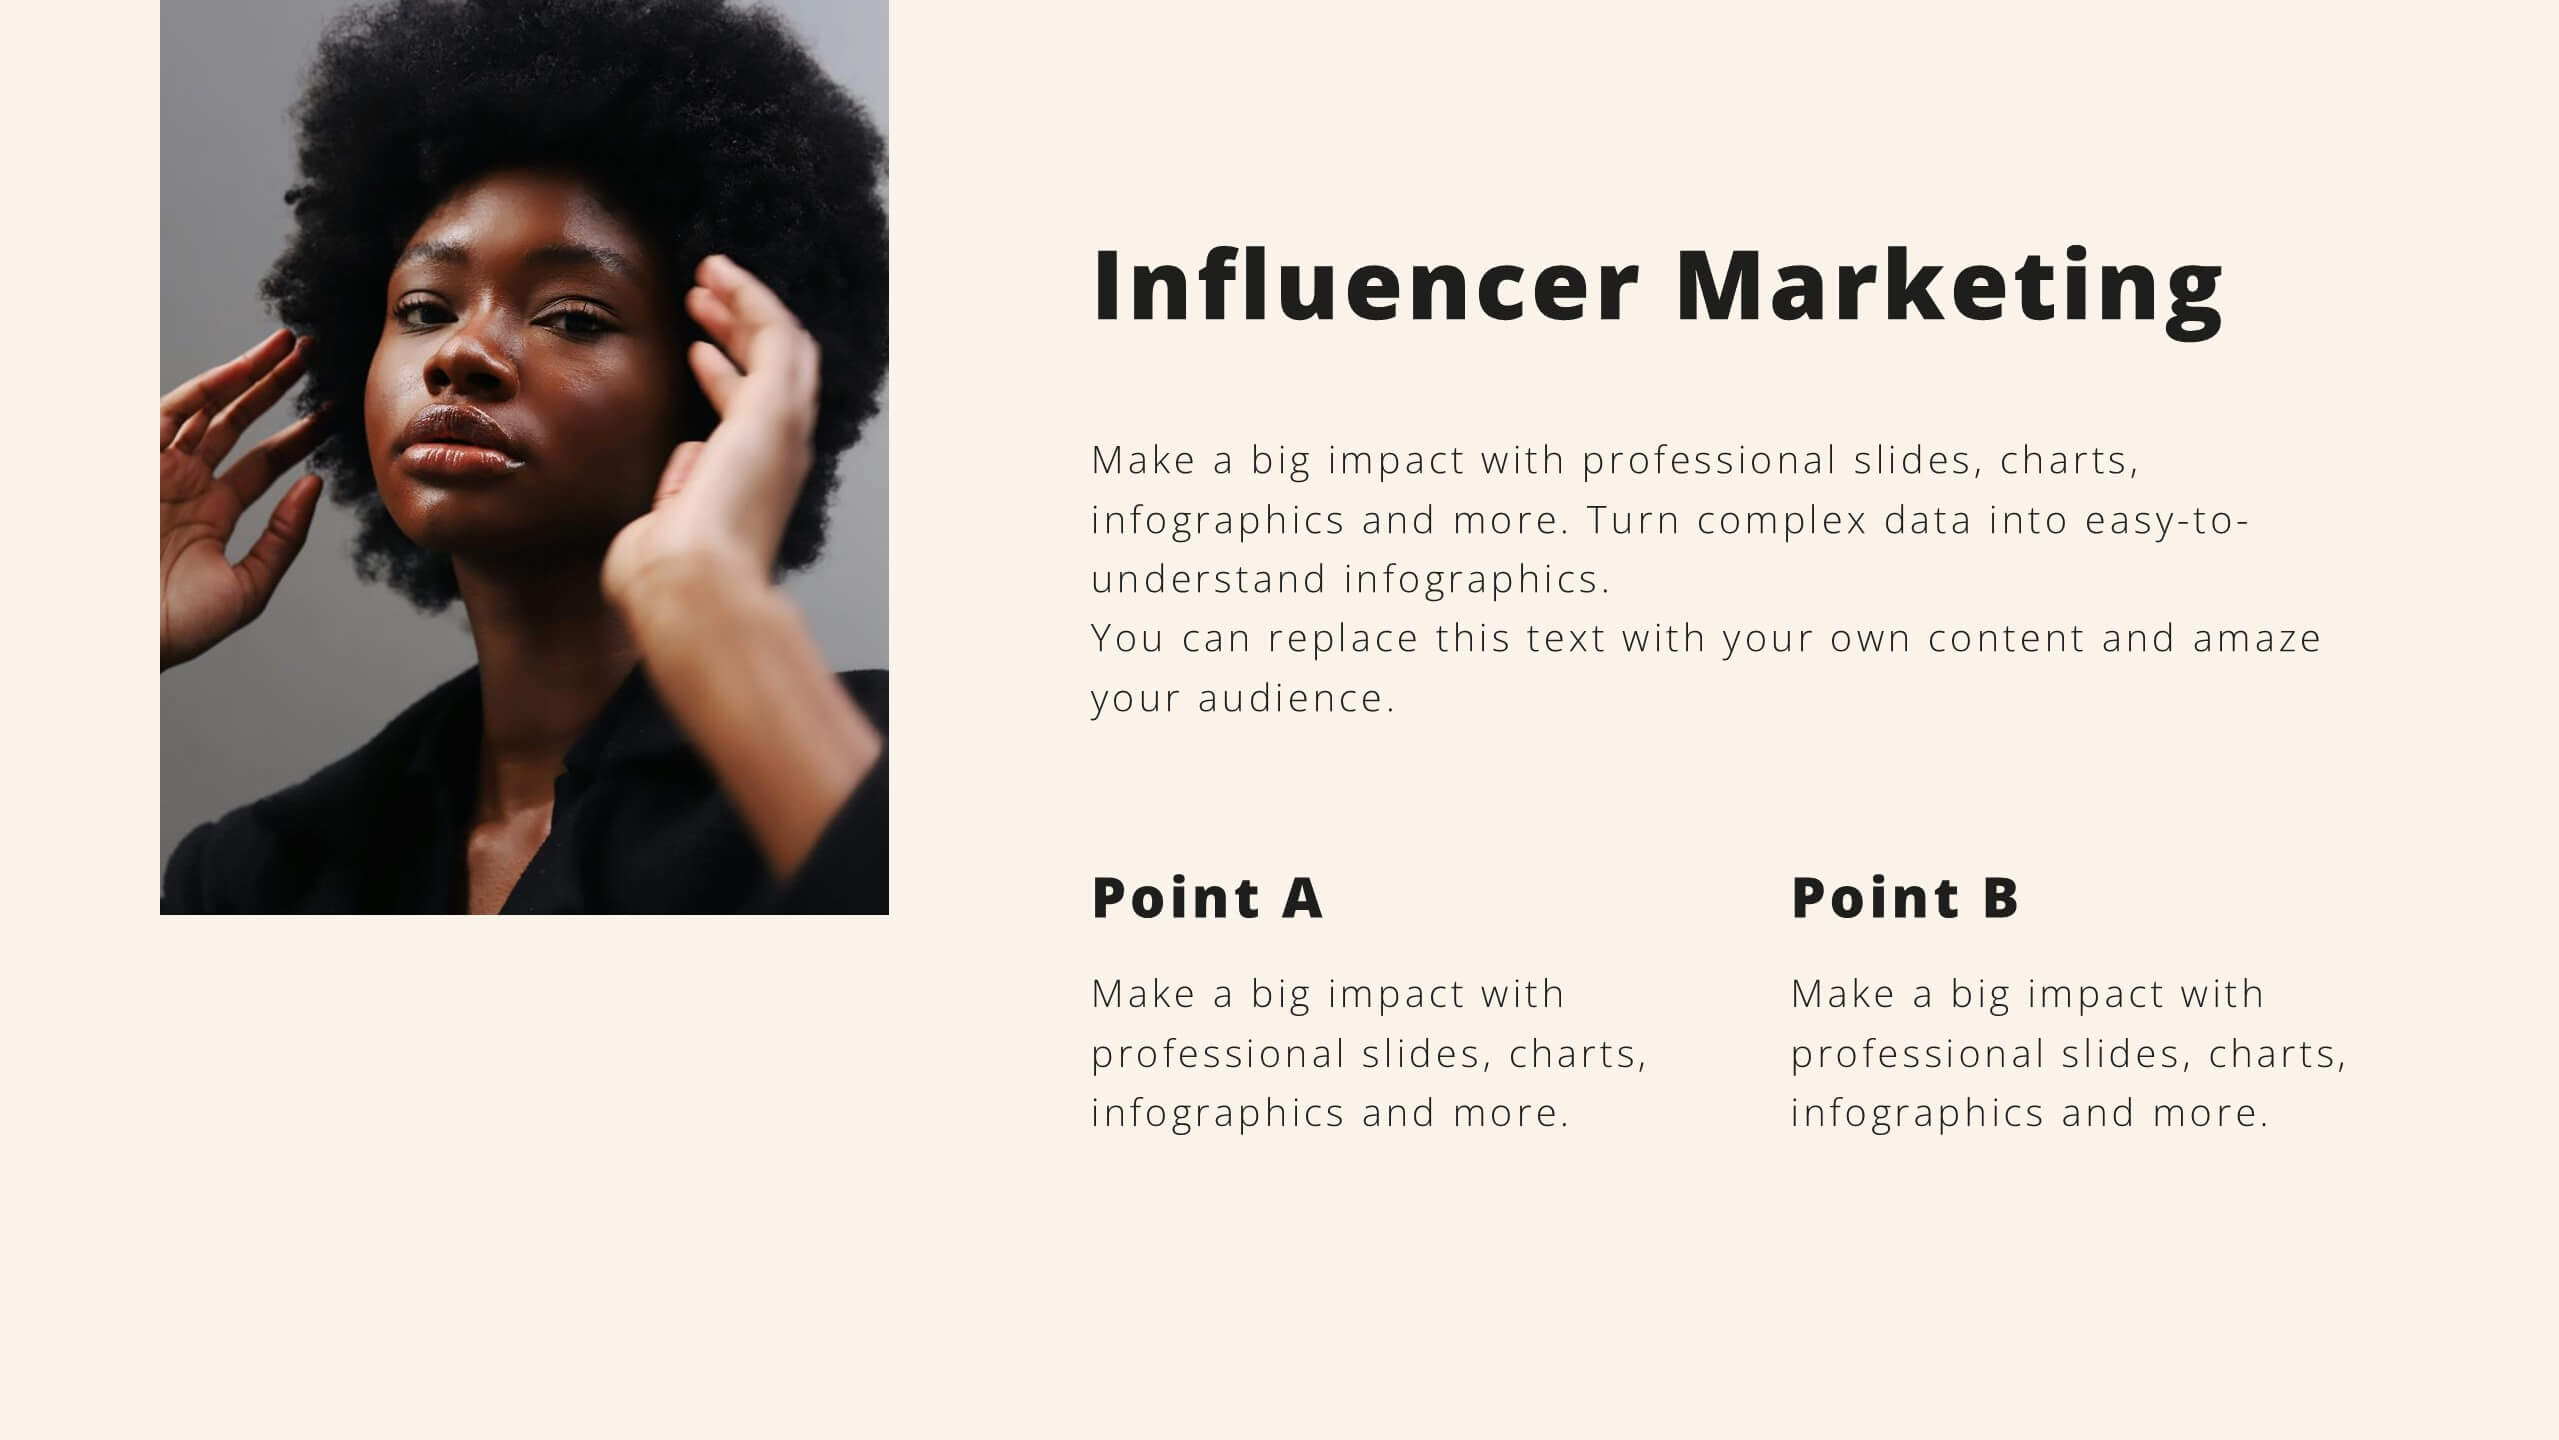
Customer Demographics Target Market Presentation
Dive into the depths of your audience with the "Customer Demographics Target Market" presentation template. Ideal for marketers and businesses aiming to understand and segment their customer base effectively, this template offers a vibrant, clear visual breakdown of demographic data. Ensure your strategic communications resonate with the right crowd, with compatibility for PowerPoint, Keynote, and Google Slides.


6 diapositivas
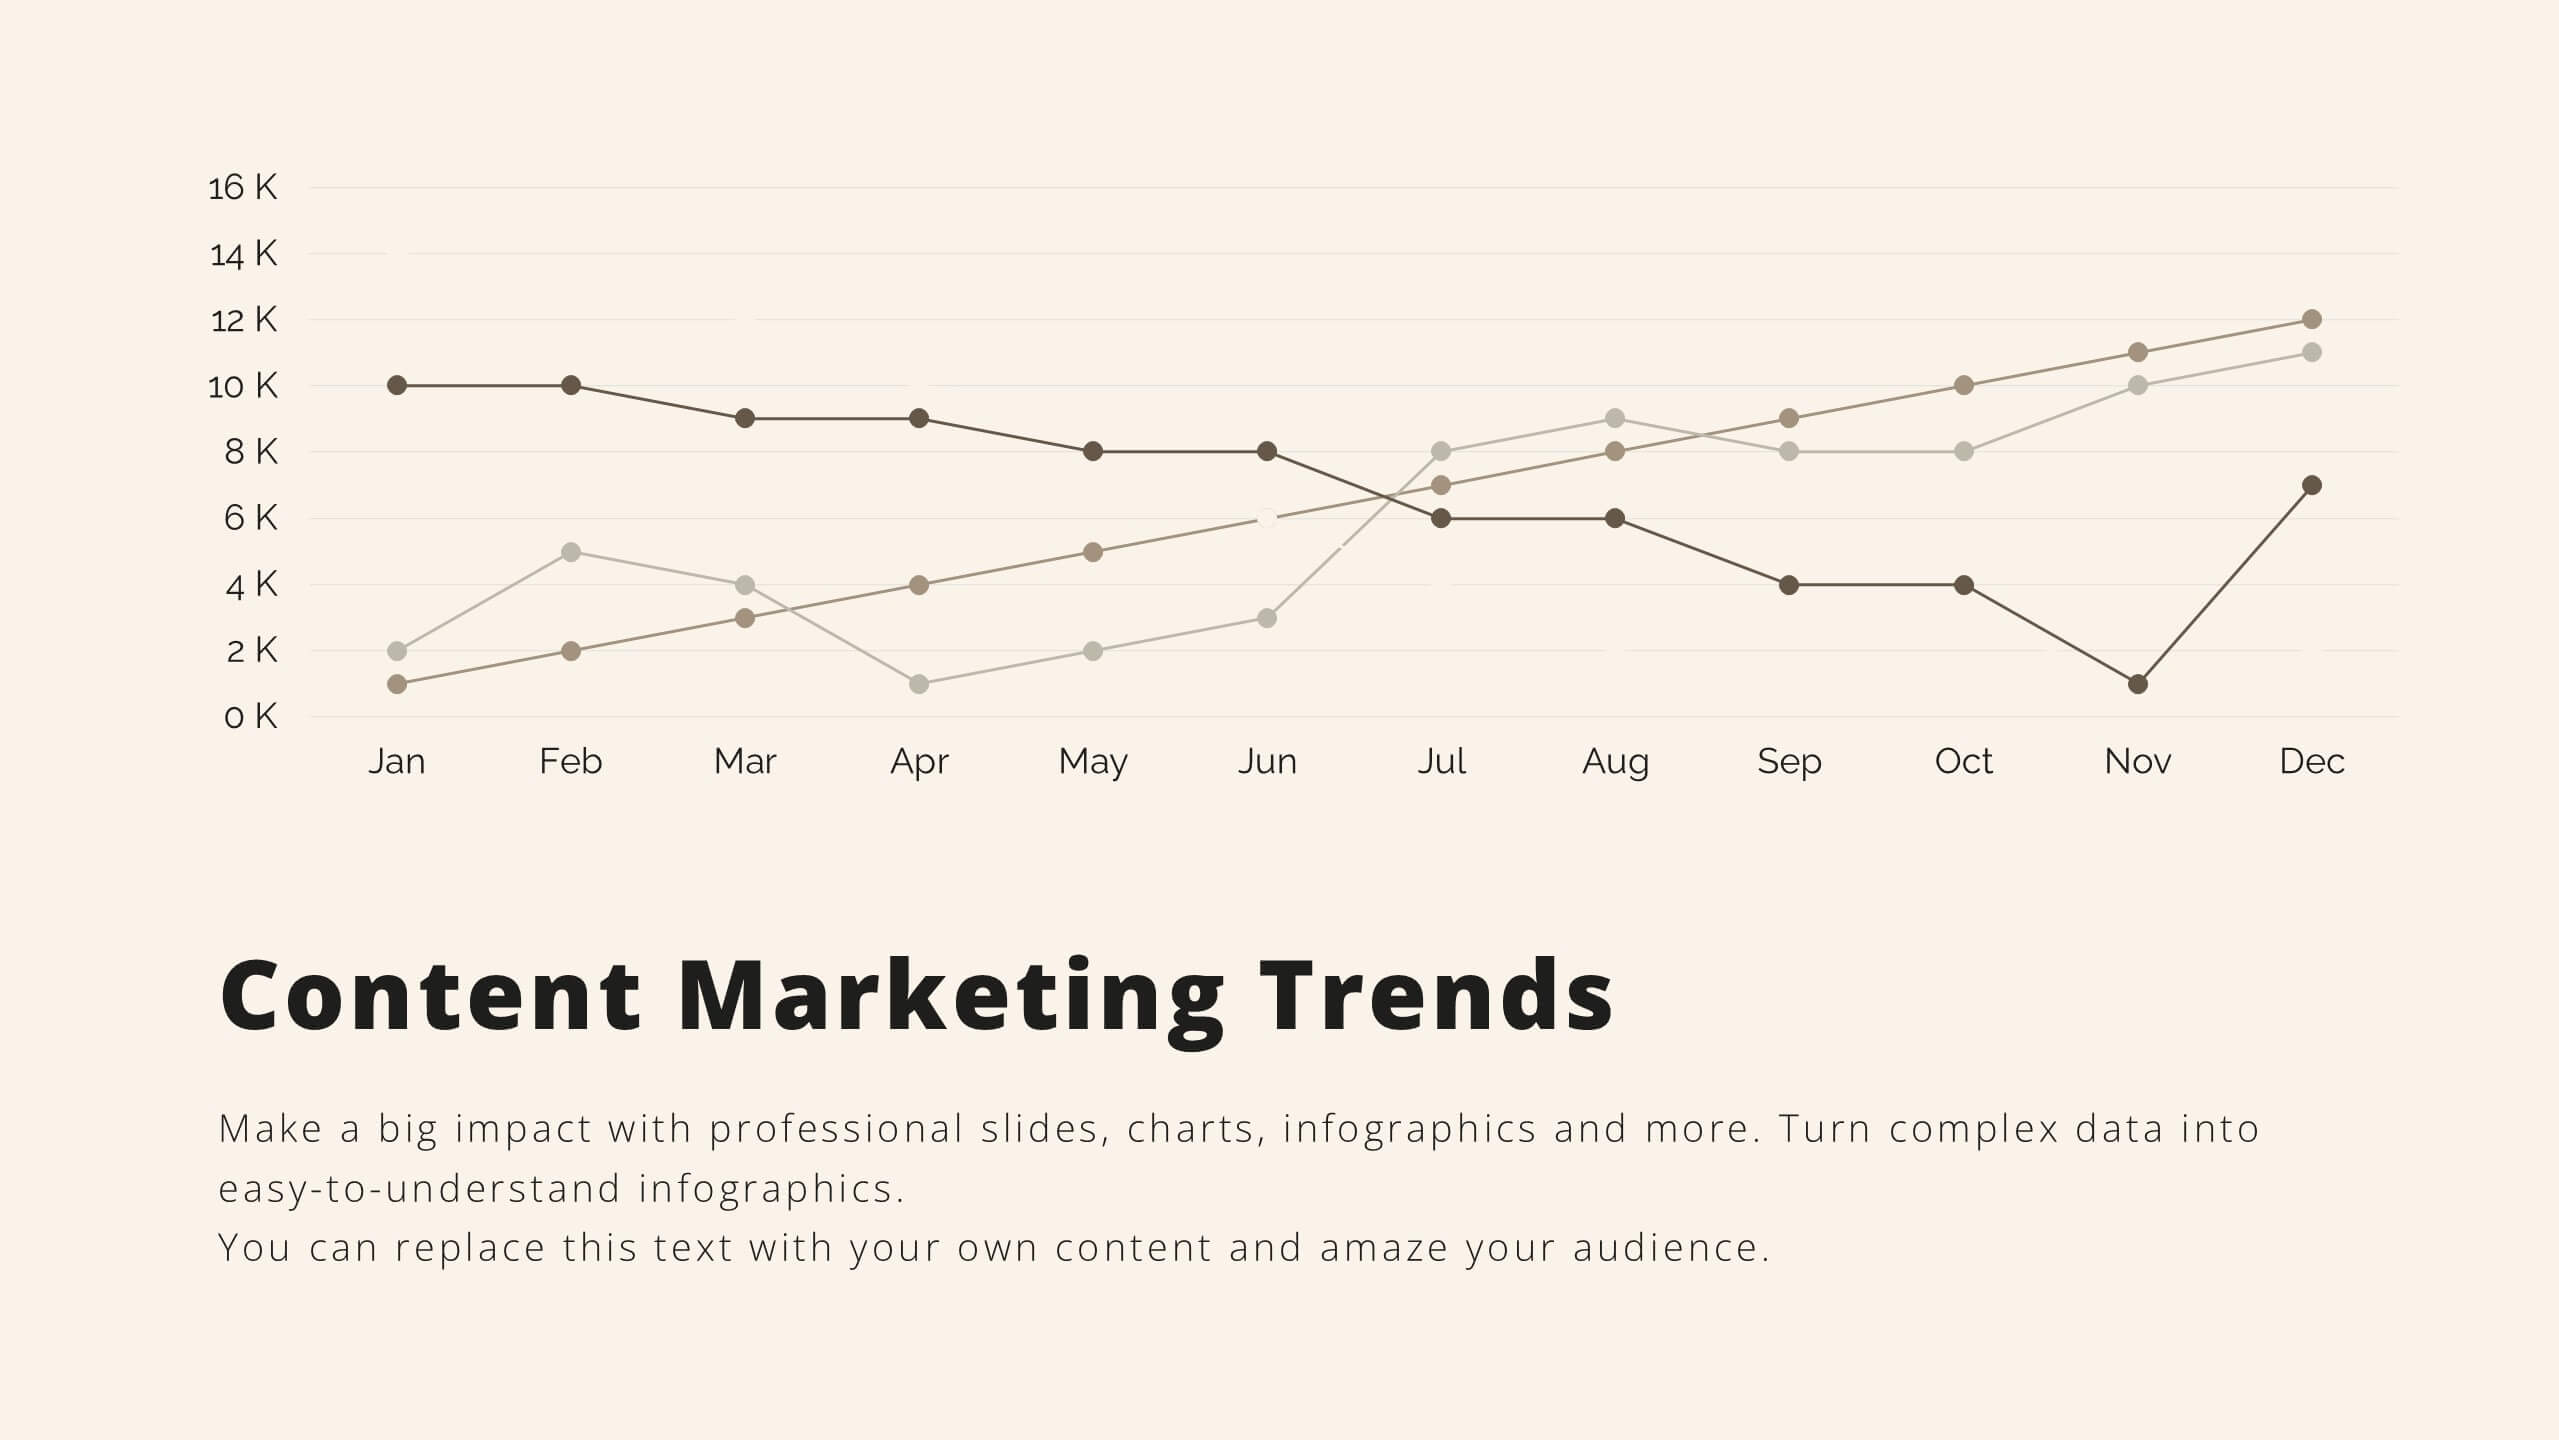
Data Trends and Statistical Overview Presentation
Present your insights clearly with the Data Trends and Statistical Overview presentation. This template features a clean combination of bar charts and half-pie graphs to showcase metrics, comparisons, and progress at a glance. Ideal for monthly analytics, business reviews, or performance tracking. Fully editable in PowerPoint, Keynote, and Google Slides.


26 diapositivas
Creative Programming Presentation
The process of Developing Software involves the development of everything from a simple application or web page to complex enterprise systems. Software development is a collaborative effort between developers, designers, and other stakeholders. This Creative Template is perfect for delivering presentations about the latest projects, apps and ideas. The simple layout allows you to focus on what matters most, your idea. Make your most important presentation spectacular with this template. With high-powered visual content and a smooth flow, you’ll keep your audience engaged from beginning to end!


20 diapositivas
Vesta Photography Portfolio Presentation
Showcase your photography skills with this elegant portfolio template, designed to highlight featured projects, creative process, client testimonials, and services offered. With sections for awards, pricing, and social media links, this template captures your unique style and professionalism. Compatible with PowerPoint, Keynote, and Google Slides for easy customization.