


Características


¿Tienes alguna pregunta?
Recomendar


5 diapositivas
Multiphase Planning with Strategy Wheel Presentation
Visualize your project’s lifecycle with this five-part strategy wheel layout. Each labeled segment highlights a phase in your planning process, ideal for showcasing sequential steps or stages. Fully editable in PowerPoint, Keynote, and Google Slides, this template simplifies complex workflows while maintaining a clean, professional design for strategic presentations.


5 diapositivas
Strategic Budget Planning Forecasting Presentation
For strategic financial management, our Strategic Budget Planning Forecasting template provides a clear visual guide for balancing income and expenses. Ideal for financial planners, it simplifies quarter-by-quarter planning with dynamic charts, ensuring clarity and precision in forecasting financial outcomes. Fully compatible with PowerPoint, Keynote, and Google Slides, it's a versatile tool for any financial presentation or workshop.


6 diapositivas
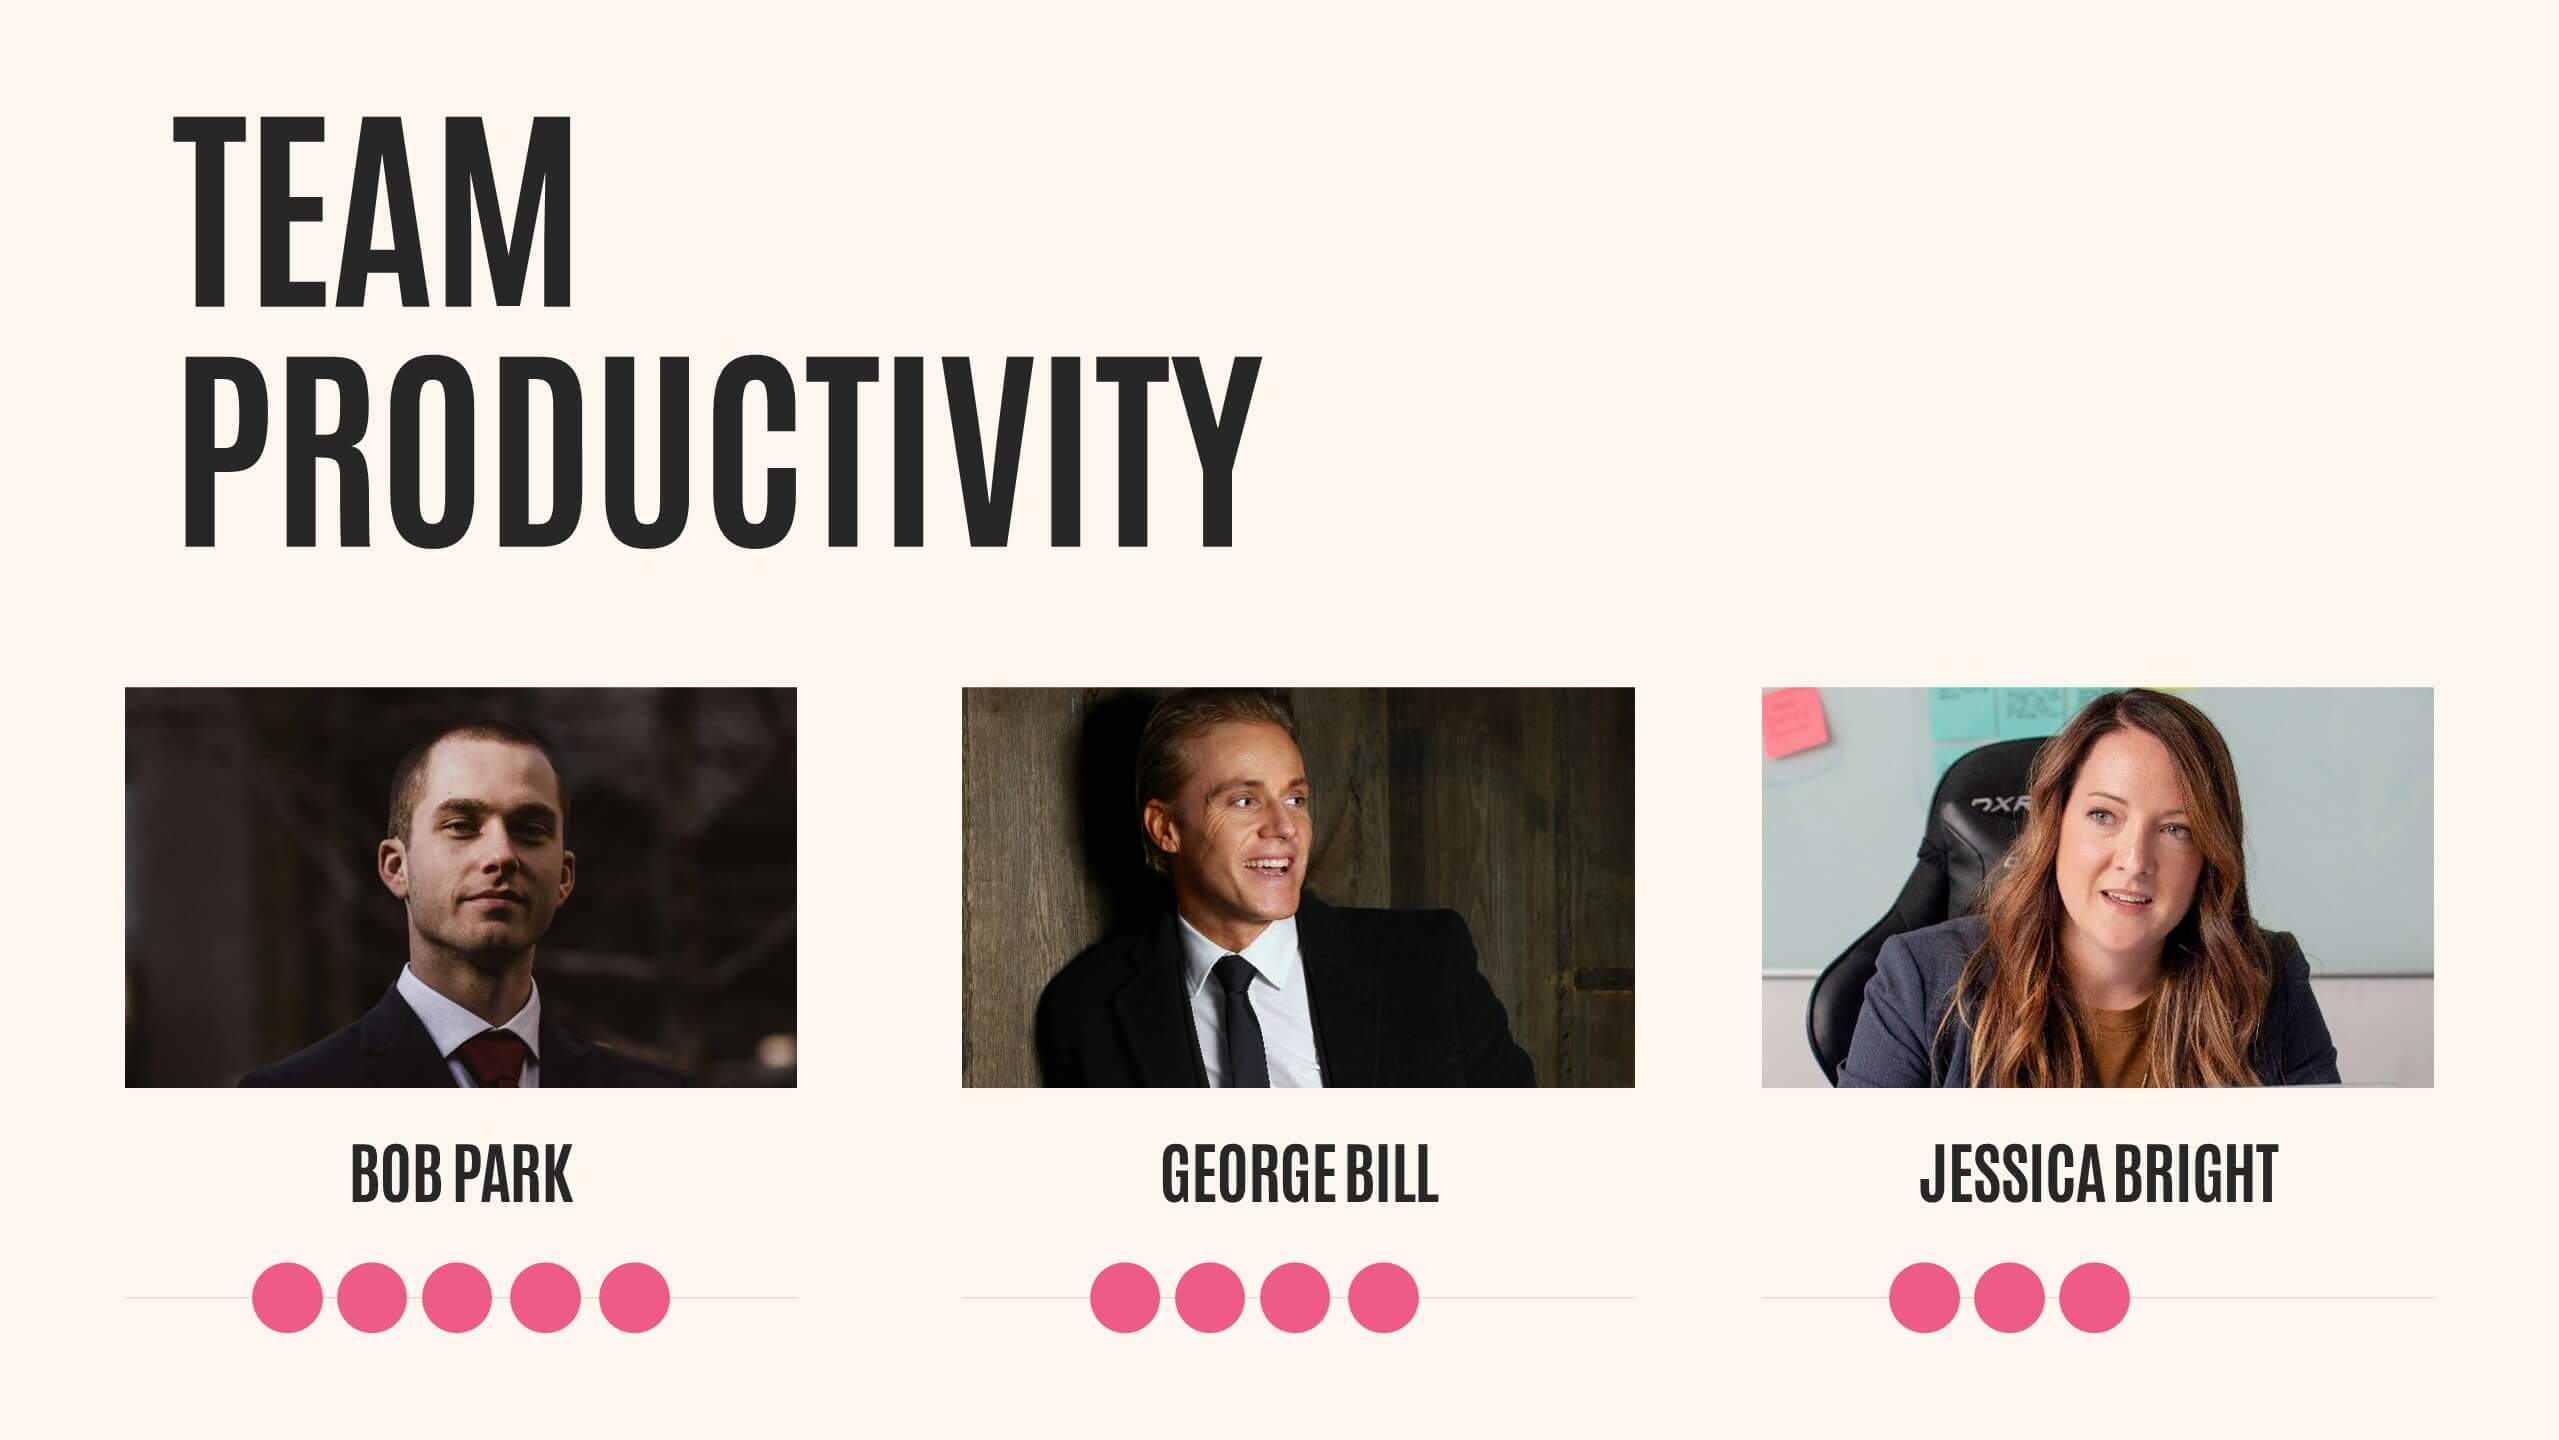
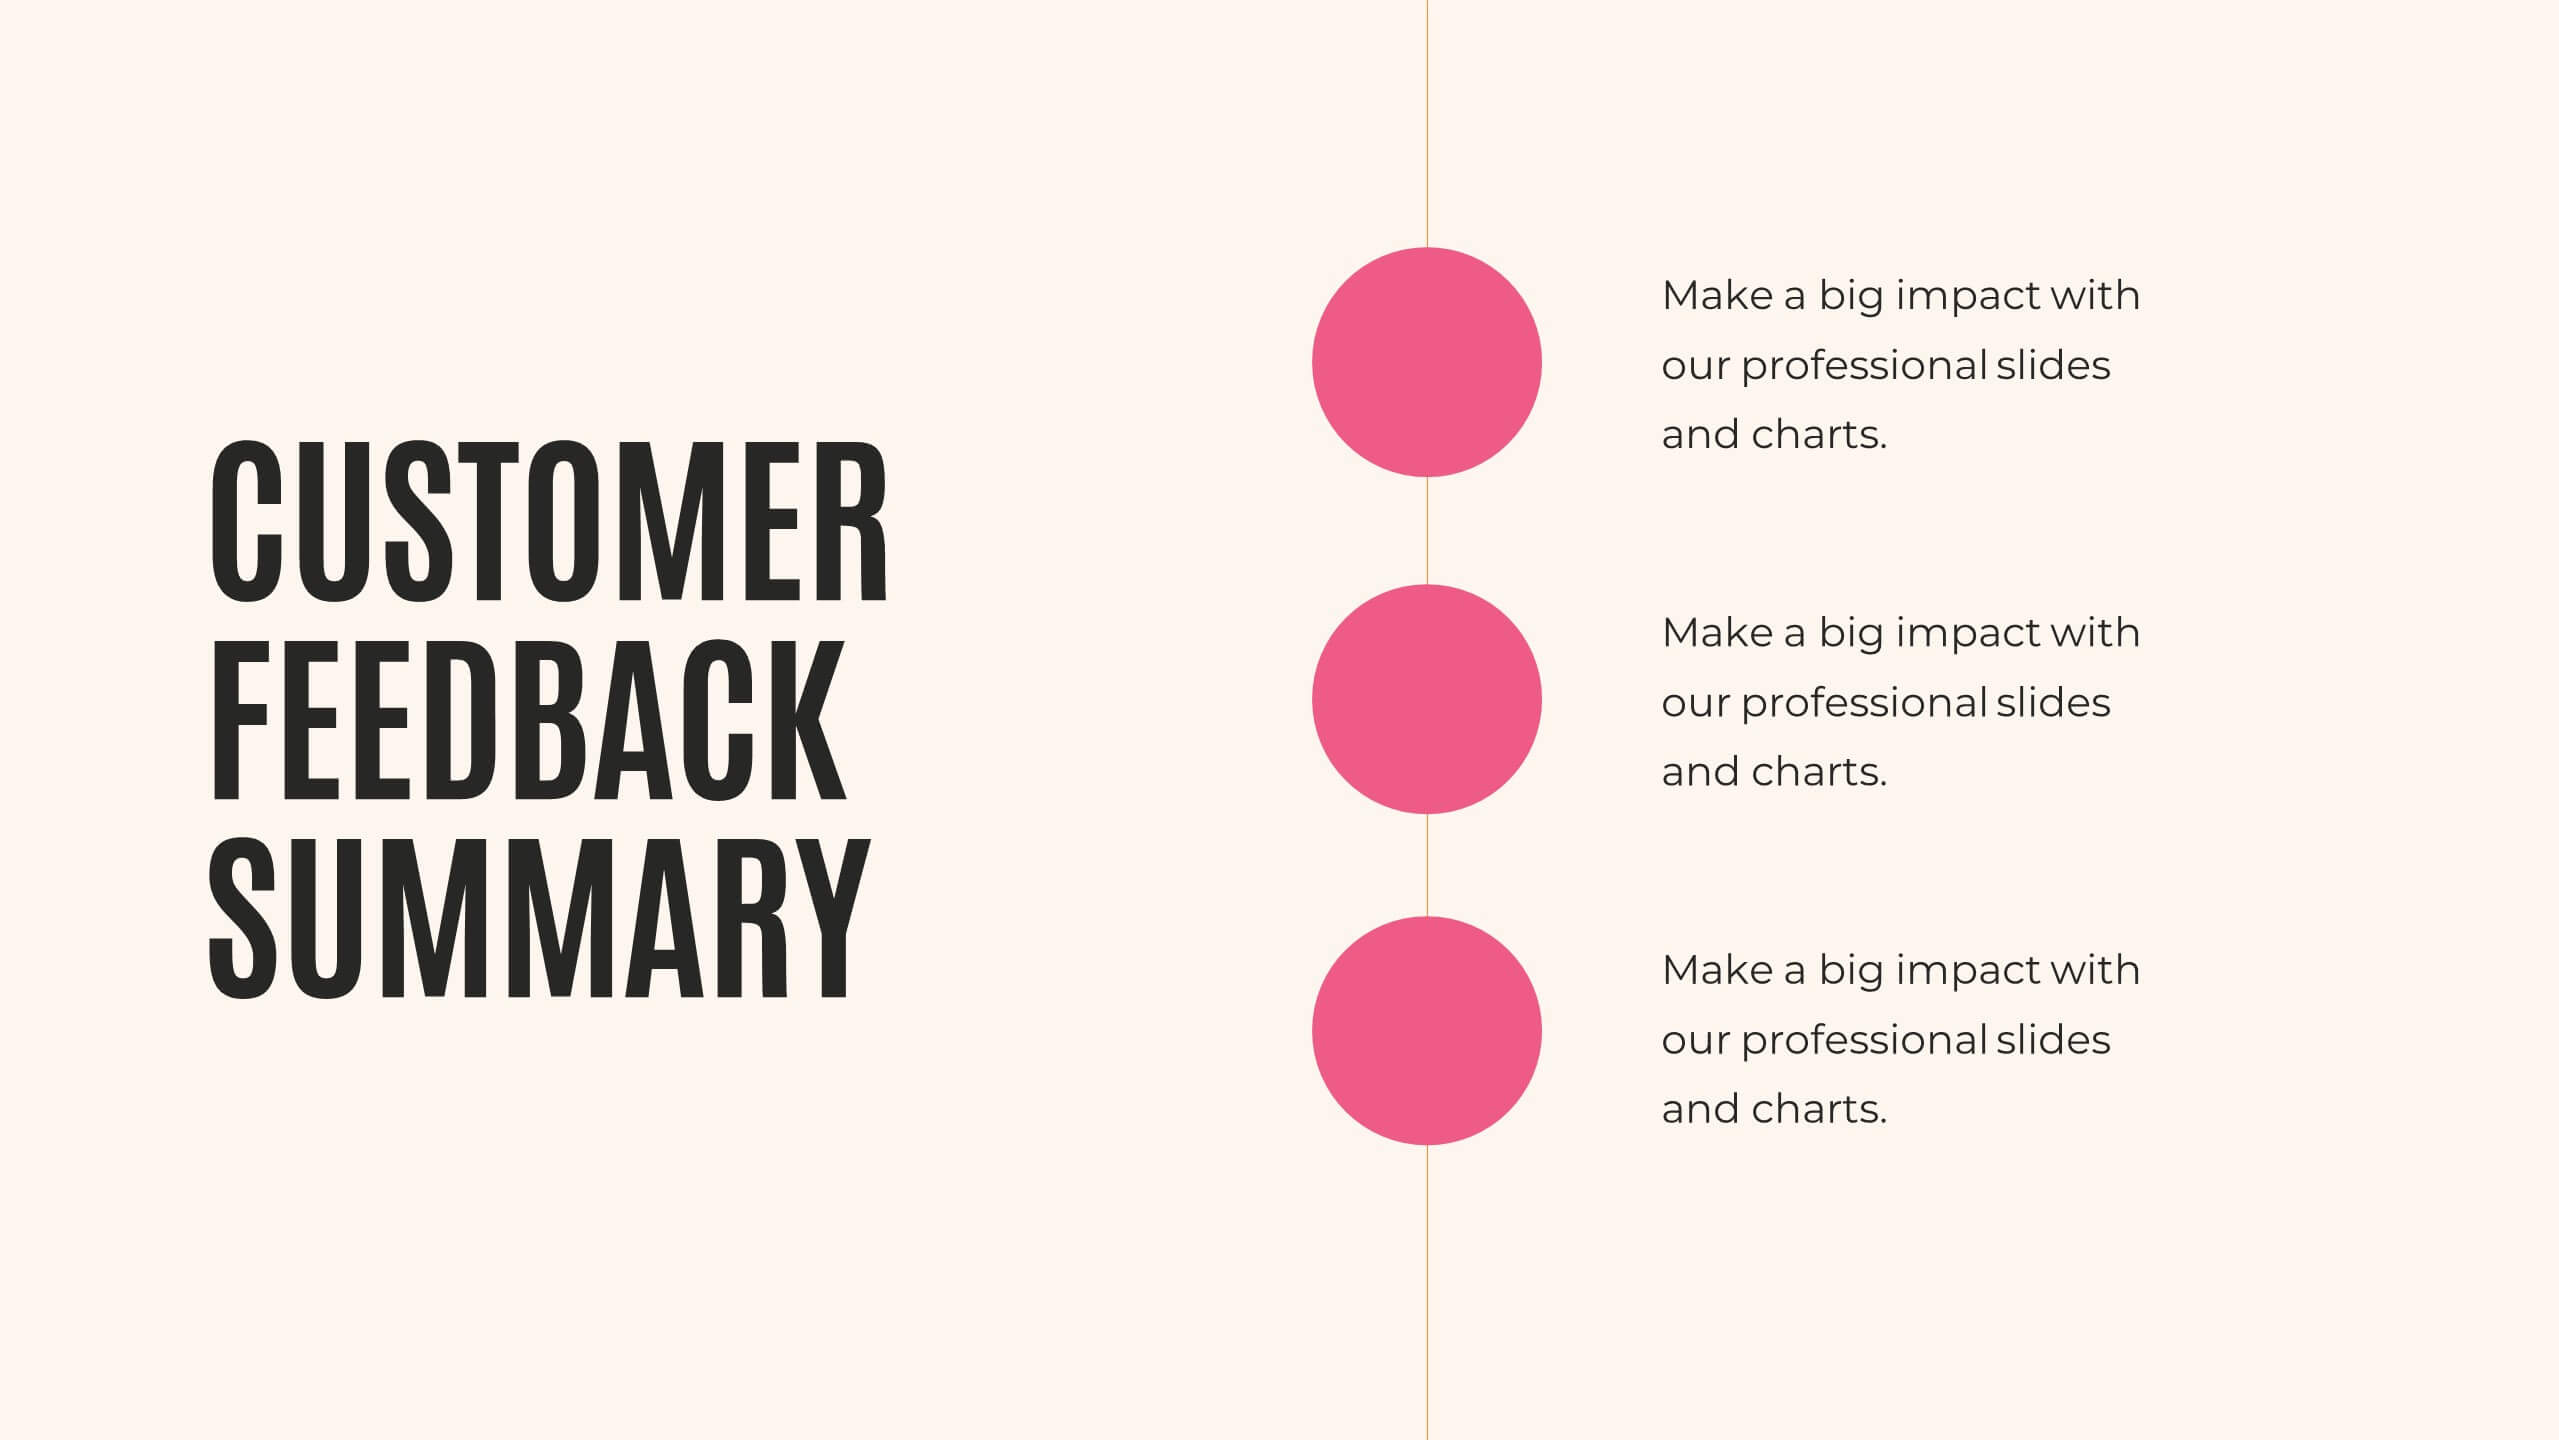
User Experience Rating System Presentation
Evaluate user satisfaction with this user experience rating system template! Designed to visually represent feedback levels, this structured layout helps businesses analyze customer experiences, identify strengths, and address pain points. Perfect for UX research, surveys, and performance assessments. Fully customizable and compatible with PowerPoint, Keynote, and Google Slides


7 diapositivas
Investment Group Infographic
An investment group, is a collective of individuals or entities that pool their financial resources to invest in various financial instruments or assets. This infographic template is a high-octane journey through the dynamic world of investments, designed to empower and energize your financial understanding. Prepare to take you audience through a thrilling ride through the investment cosmos, where your money takes center stage and financial growth is the ultimate goal. This Investment Infographic isn't just about numbers and charts, it's a thrilling expedition through the realms of finance.
21 diapositivas
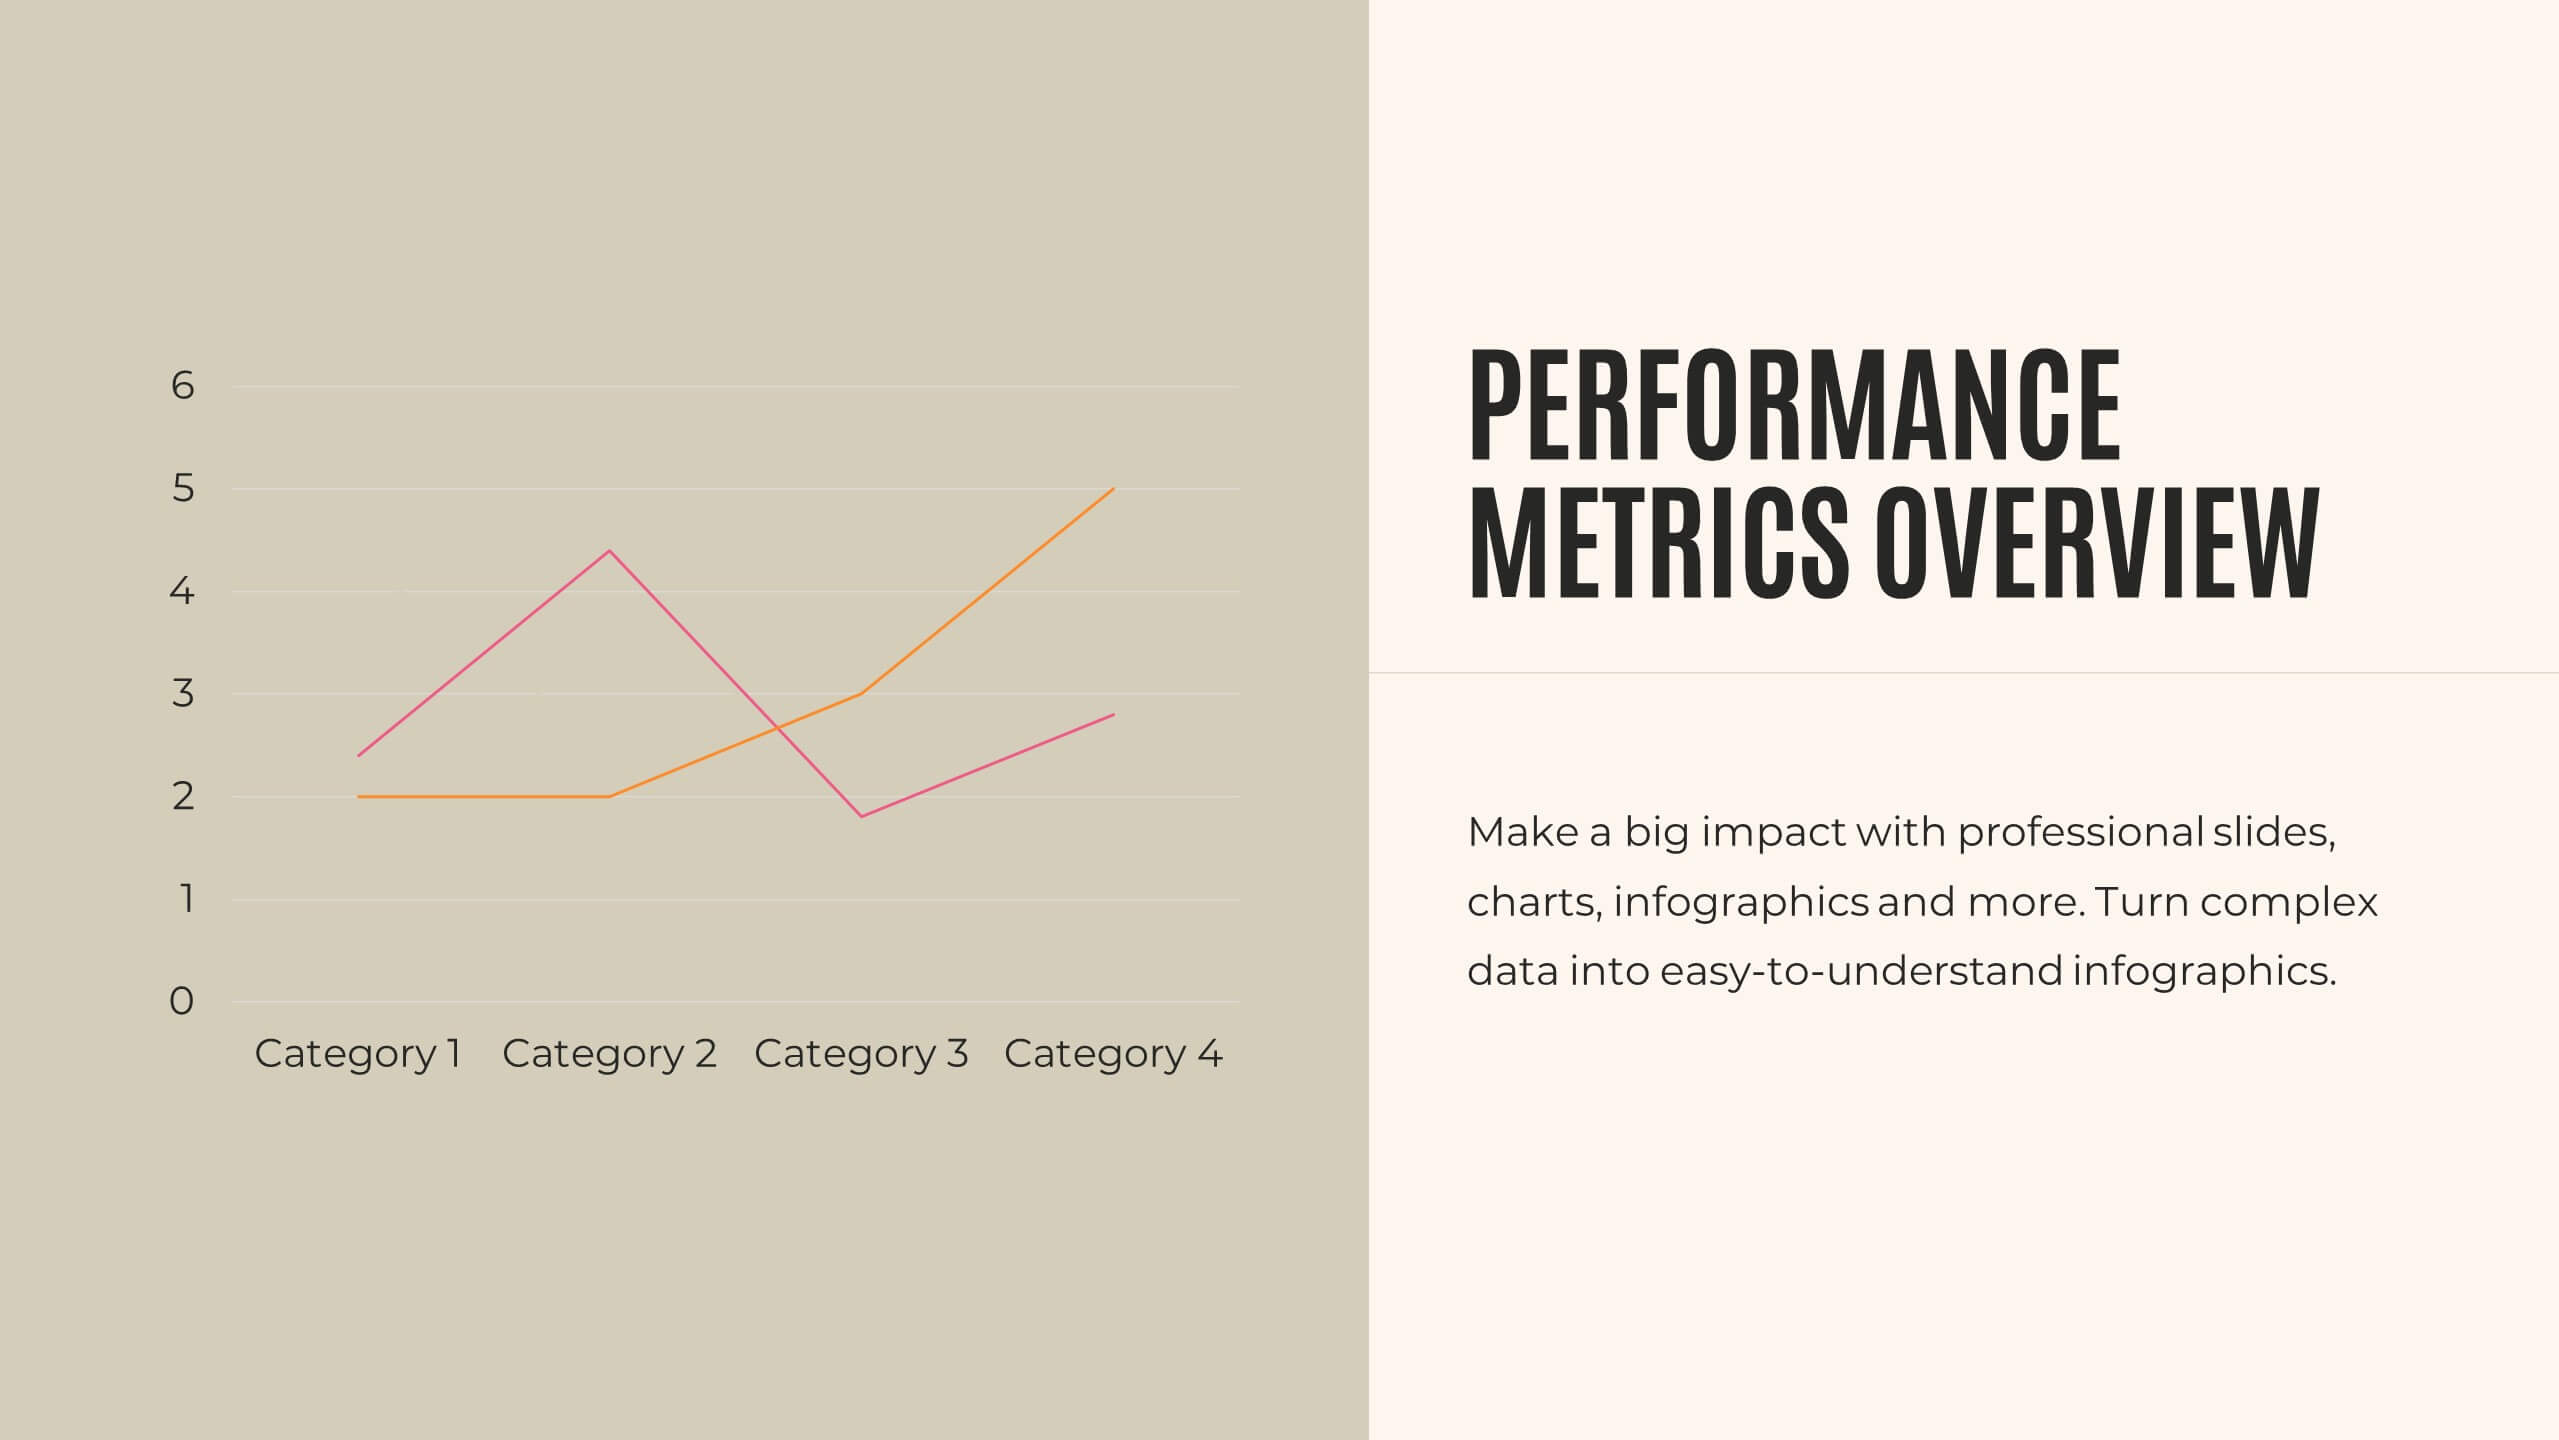
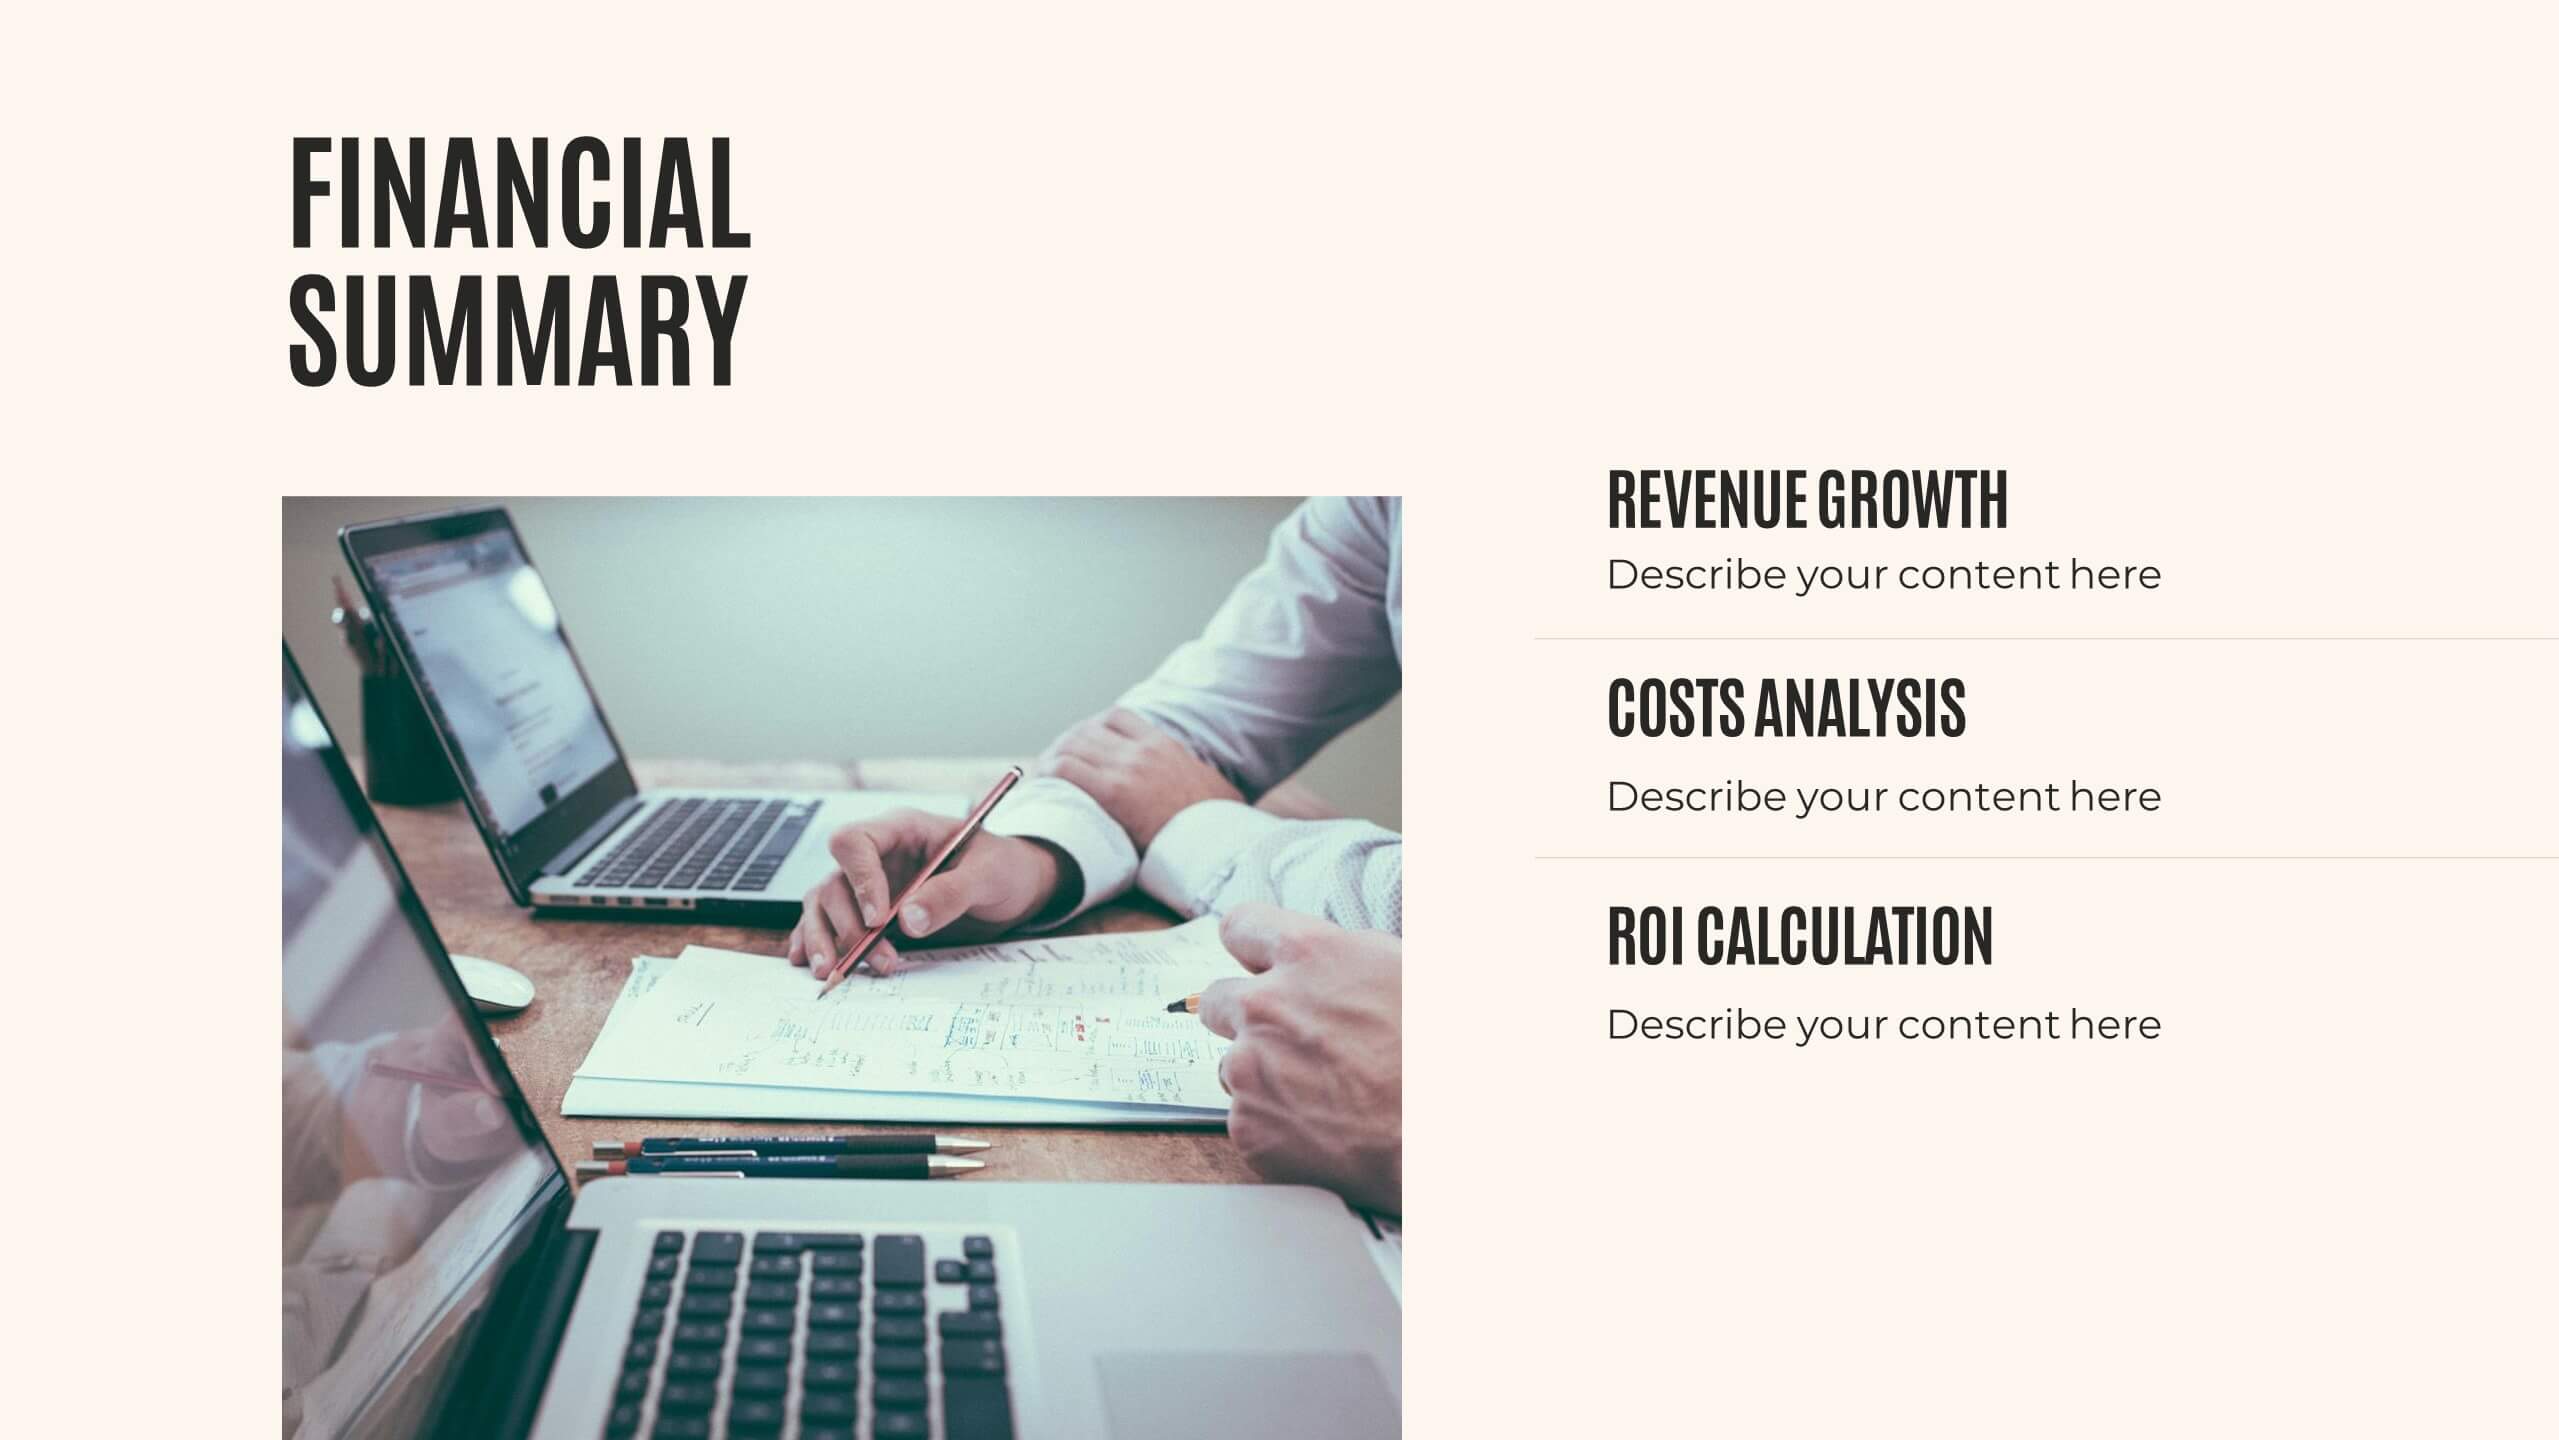
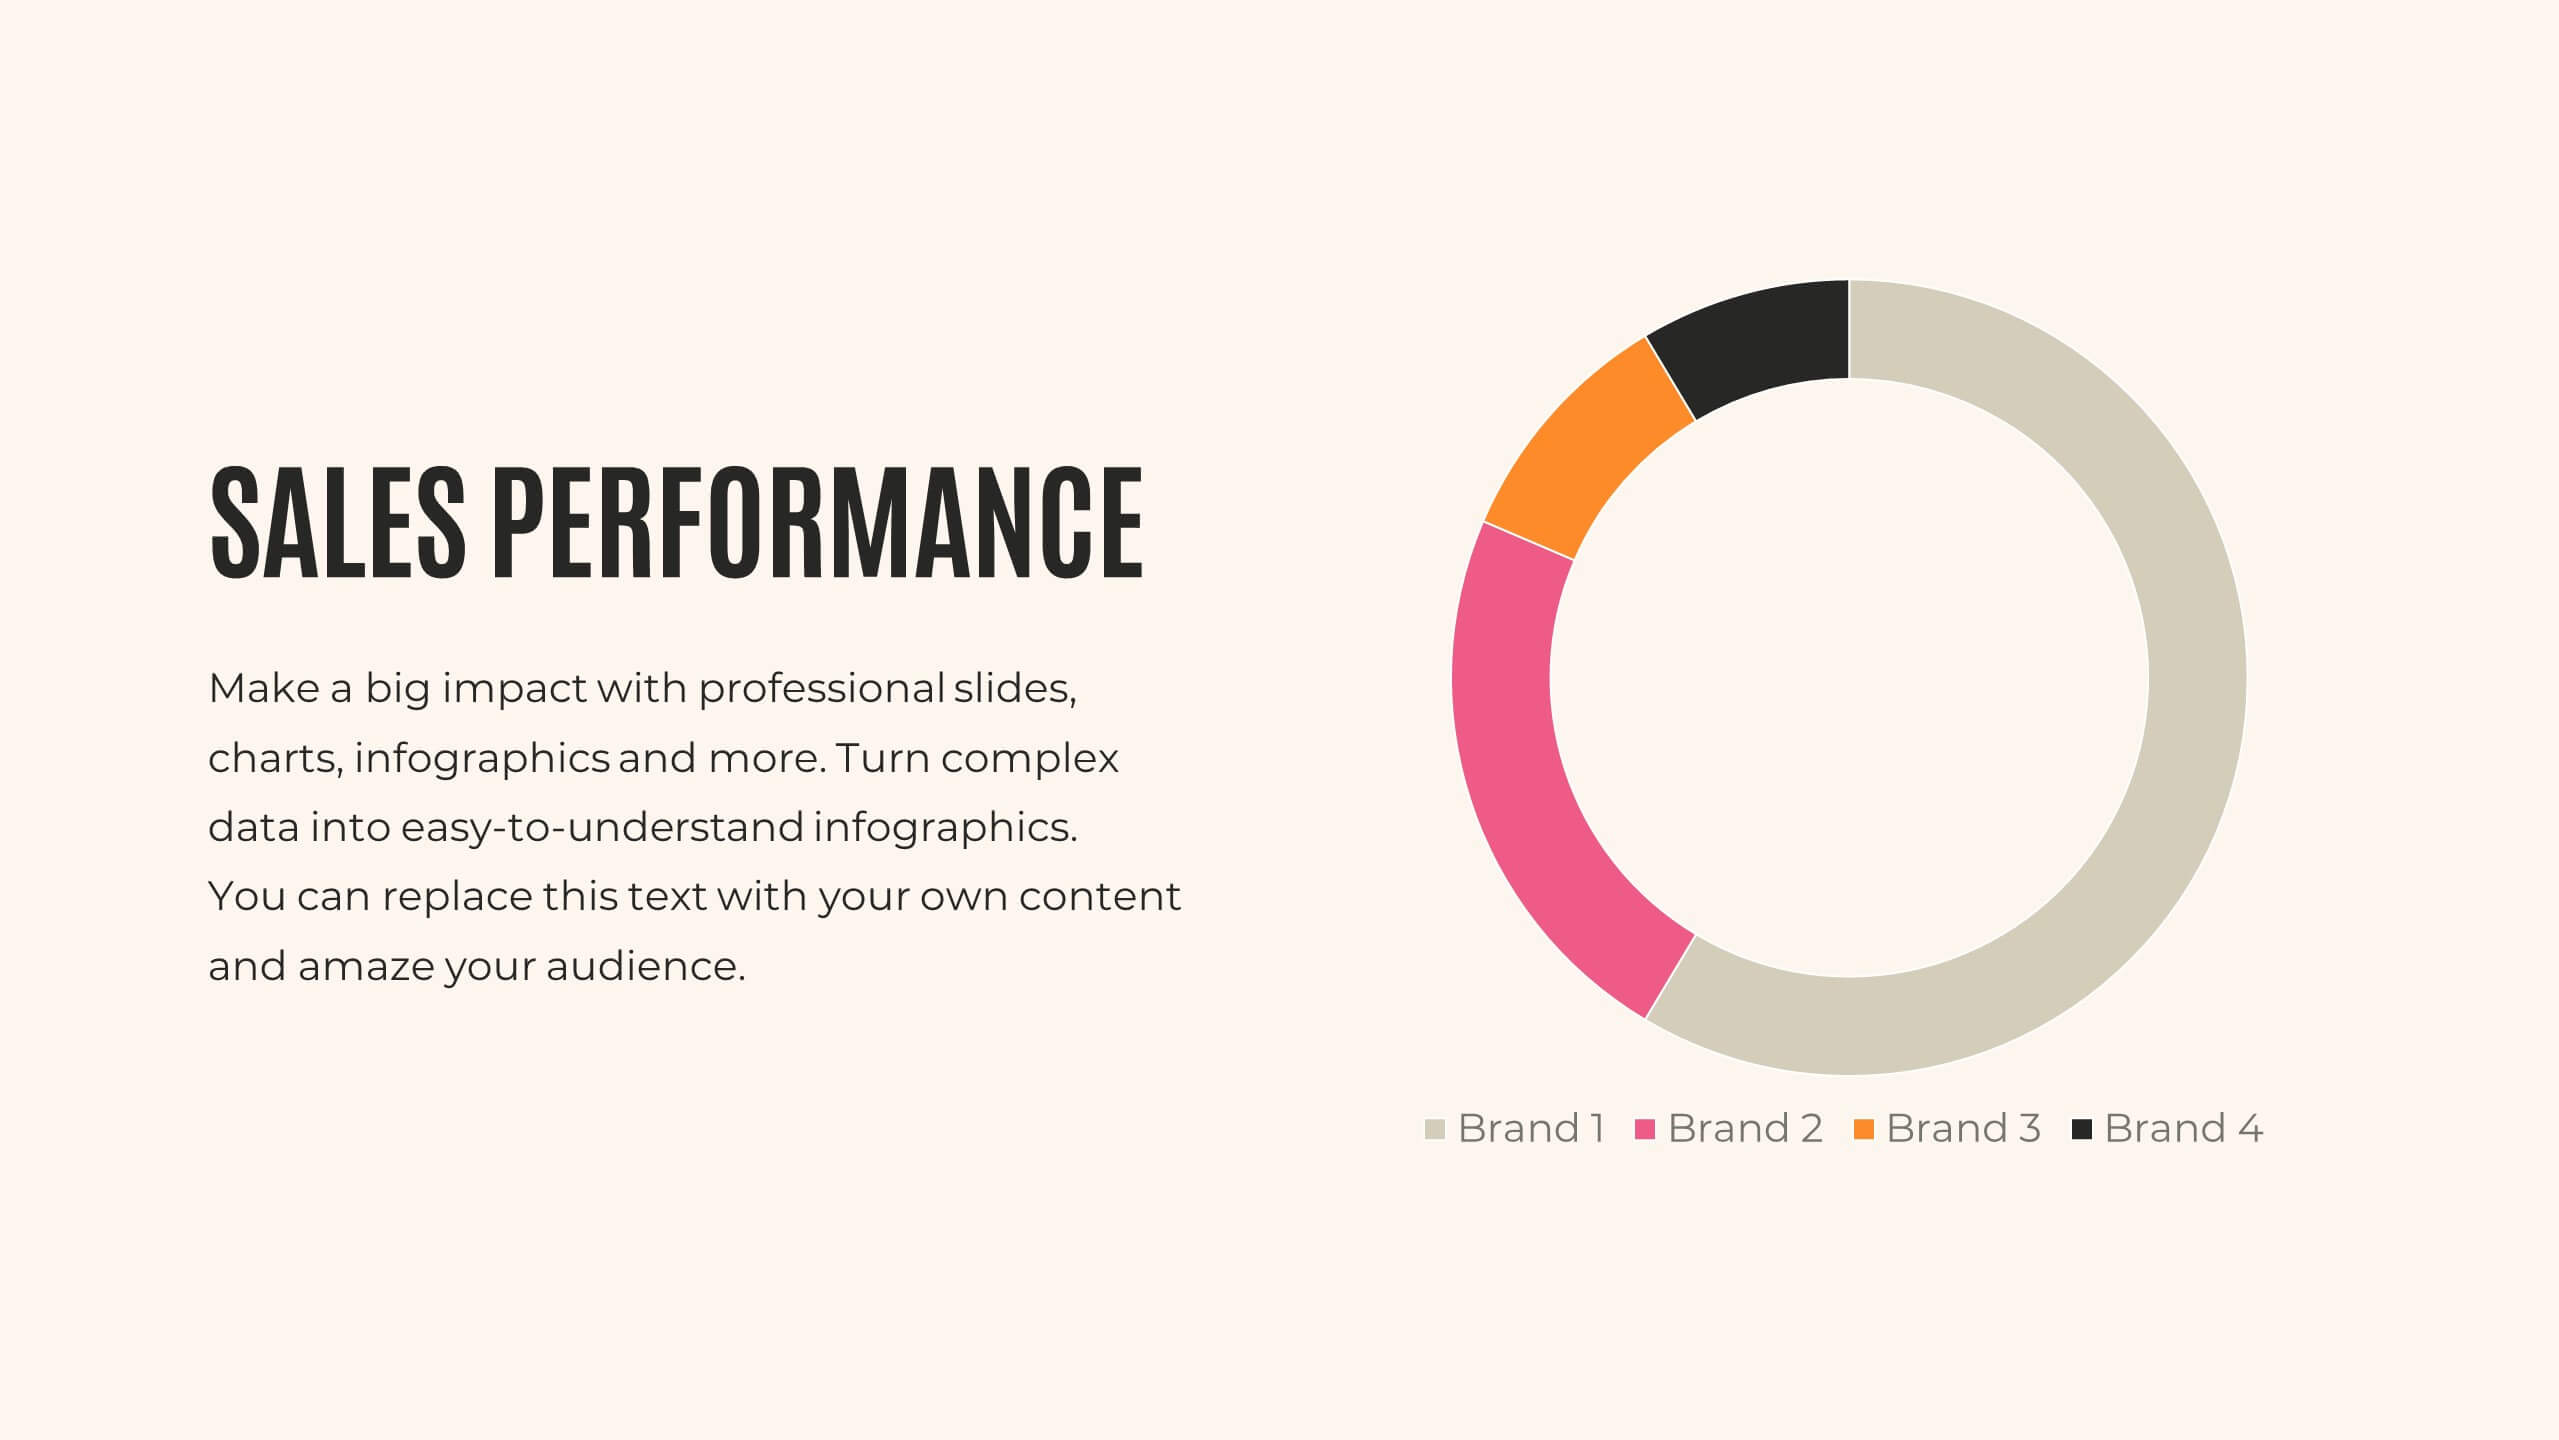
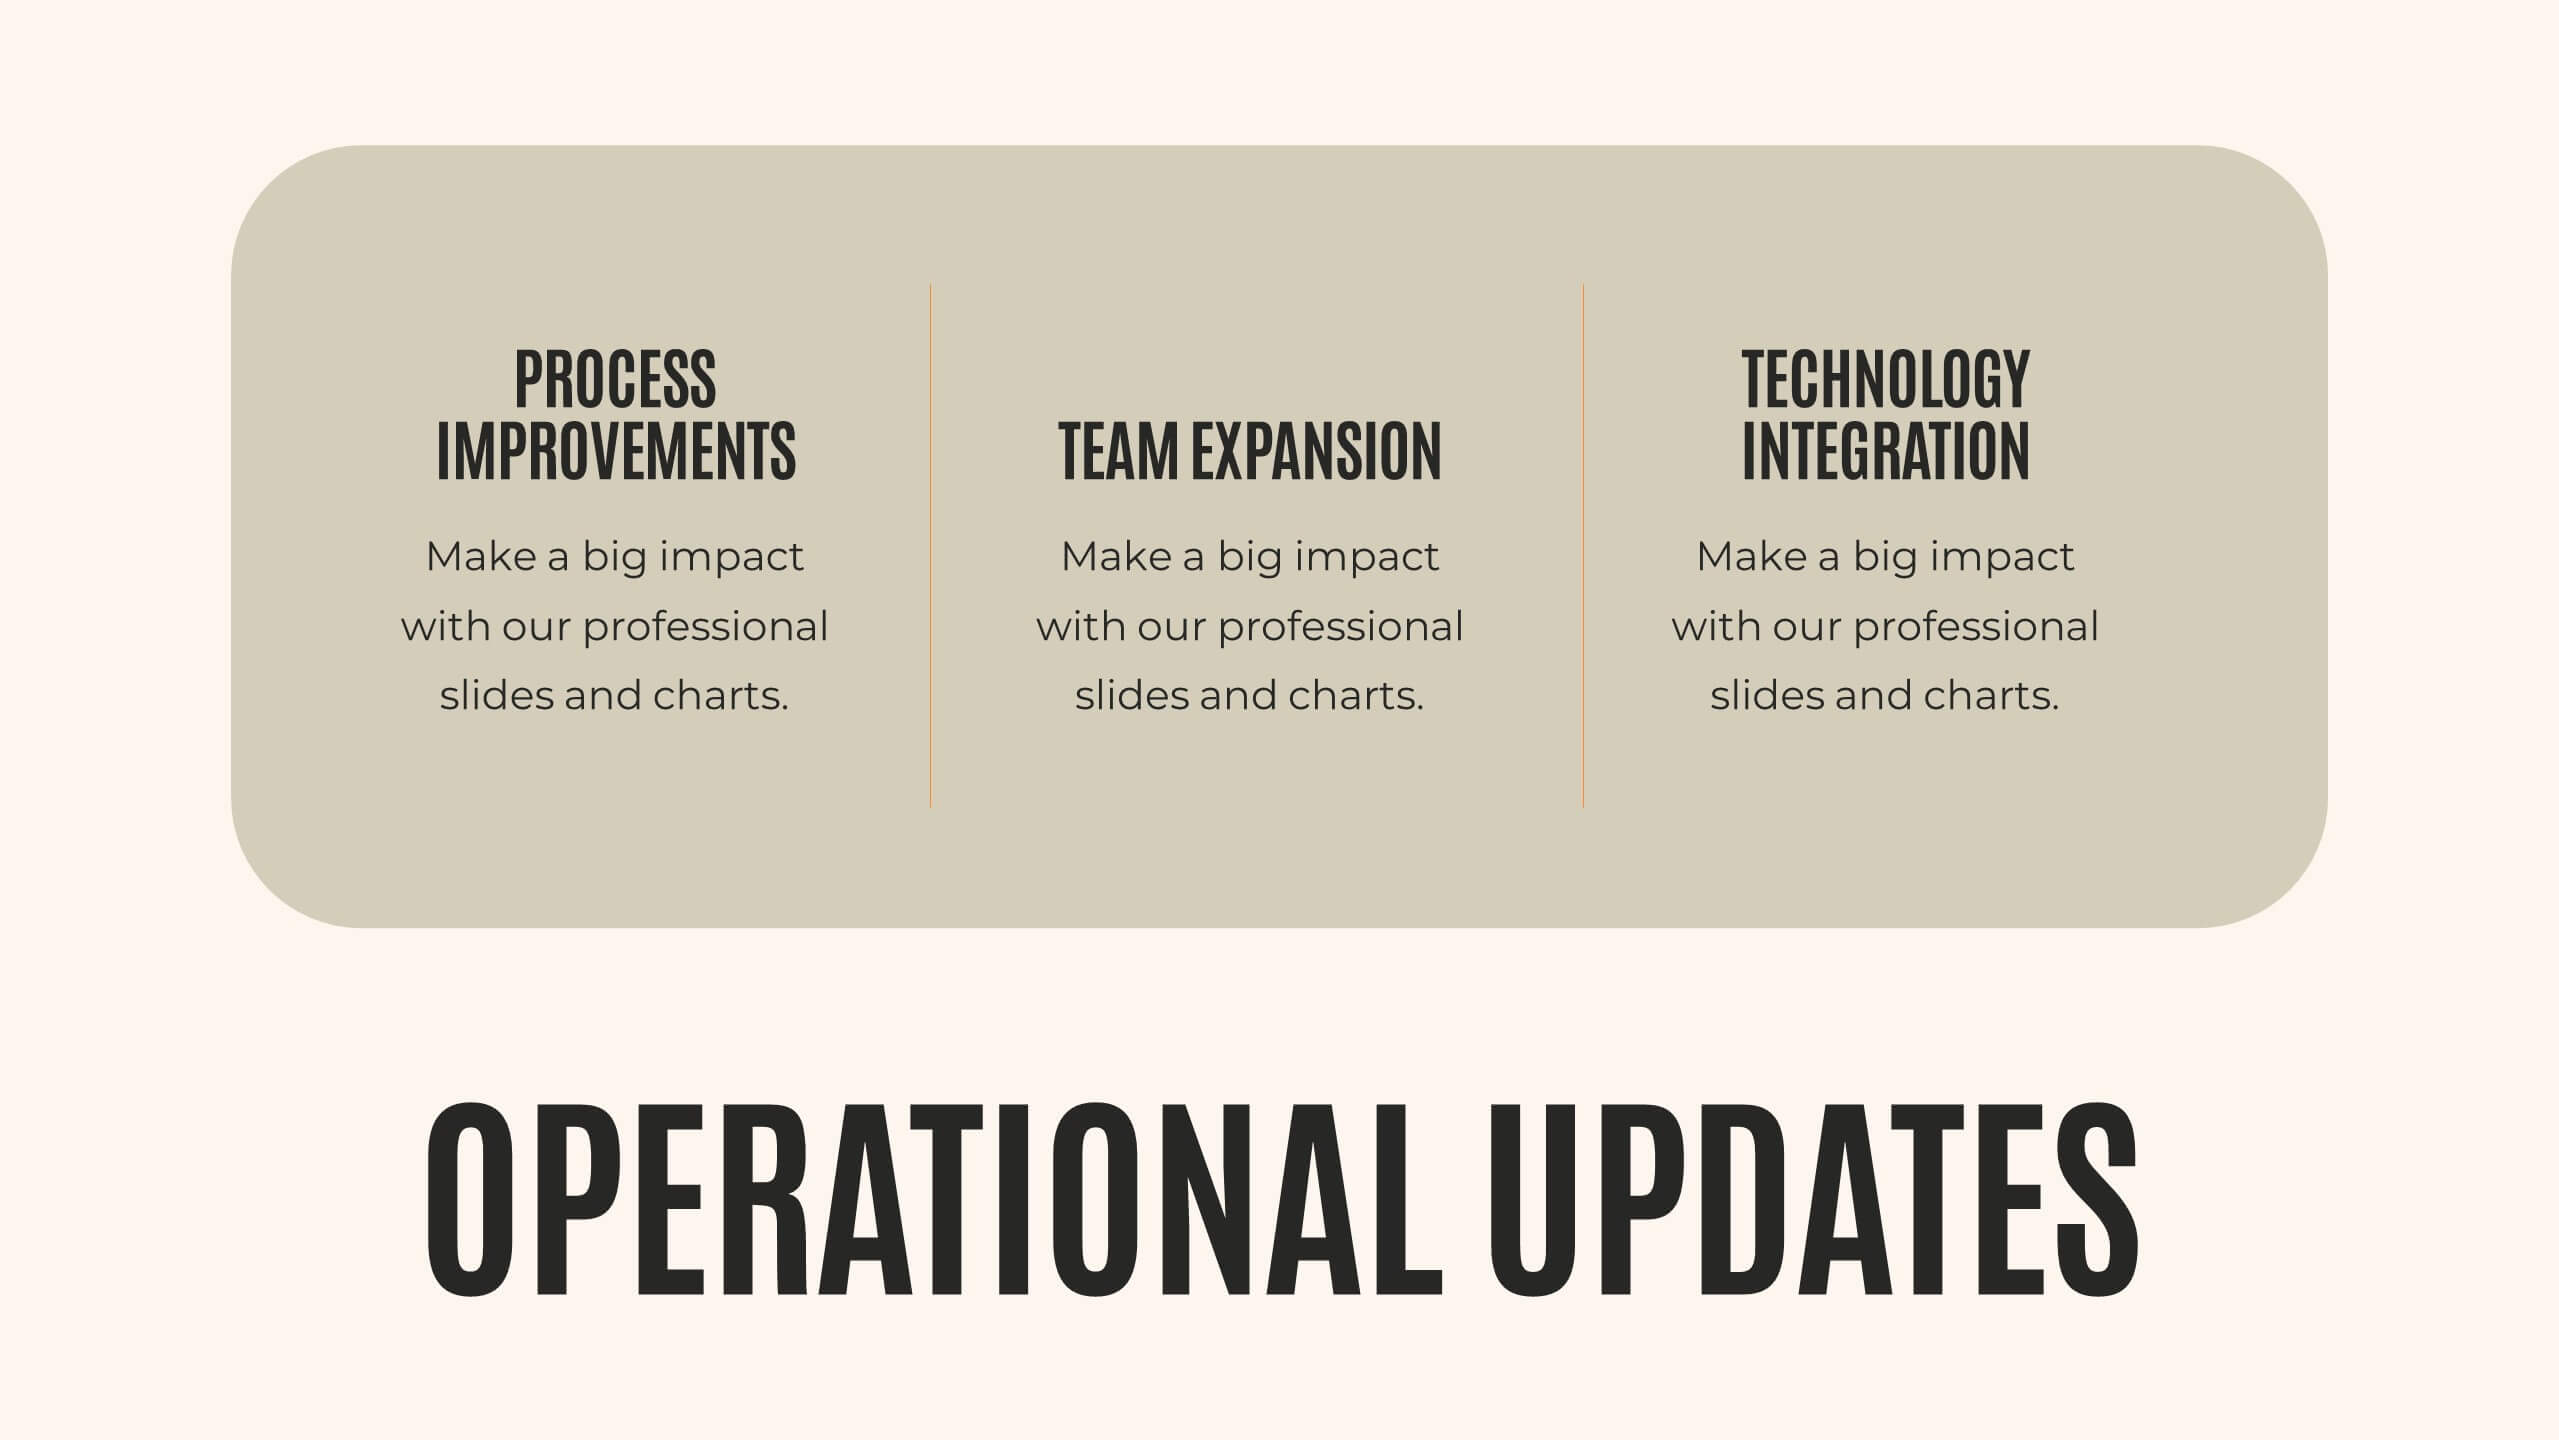
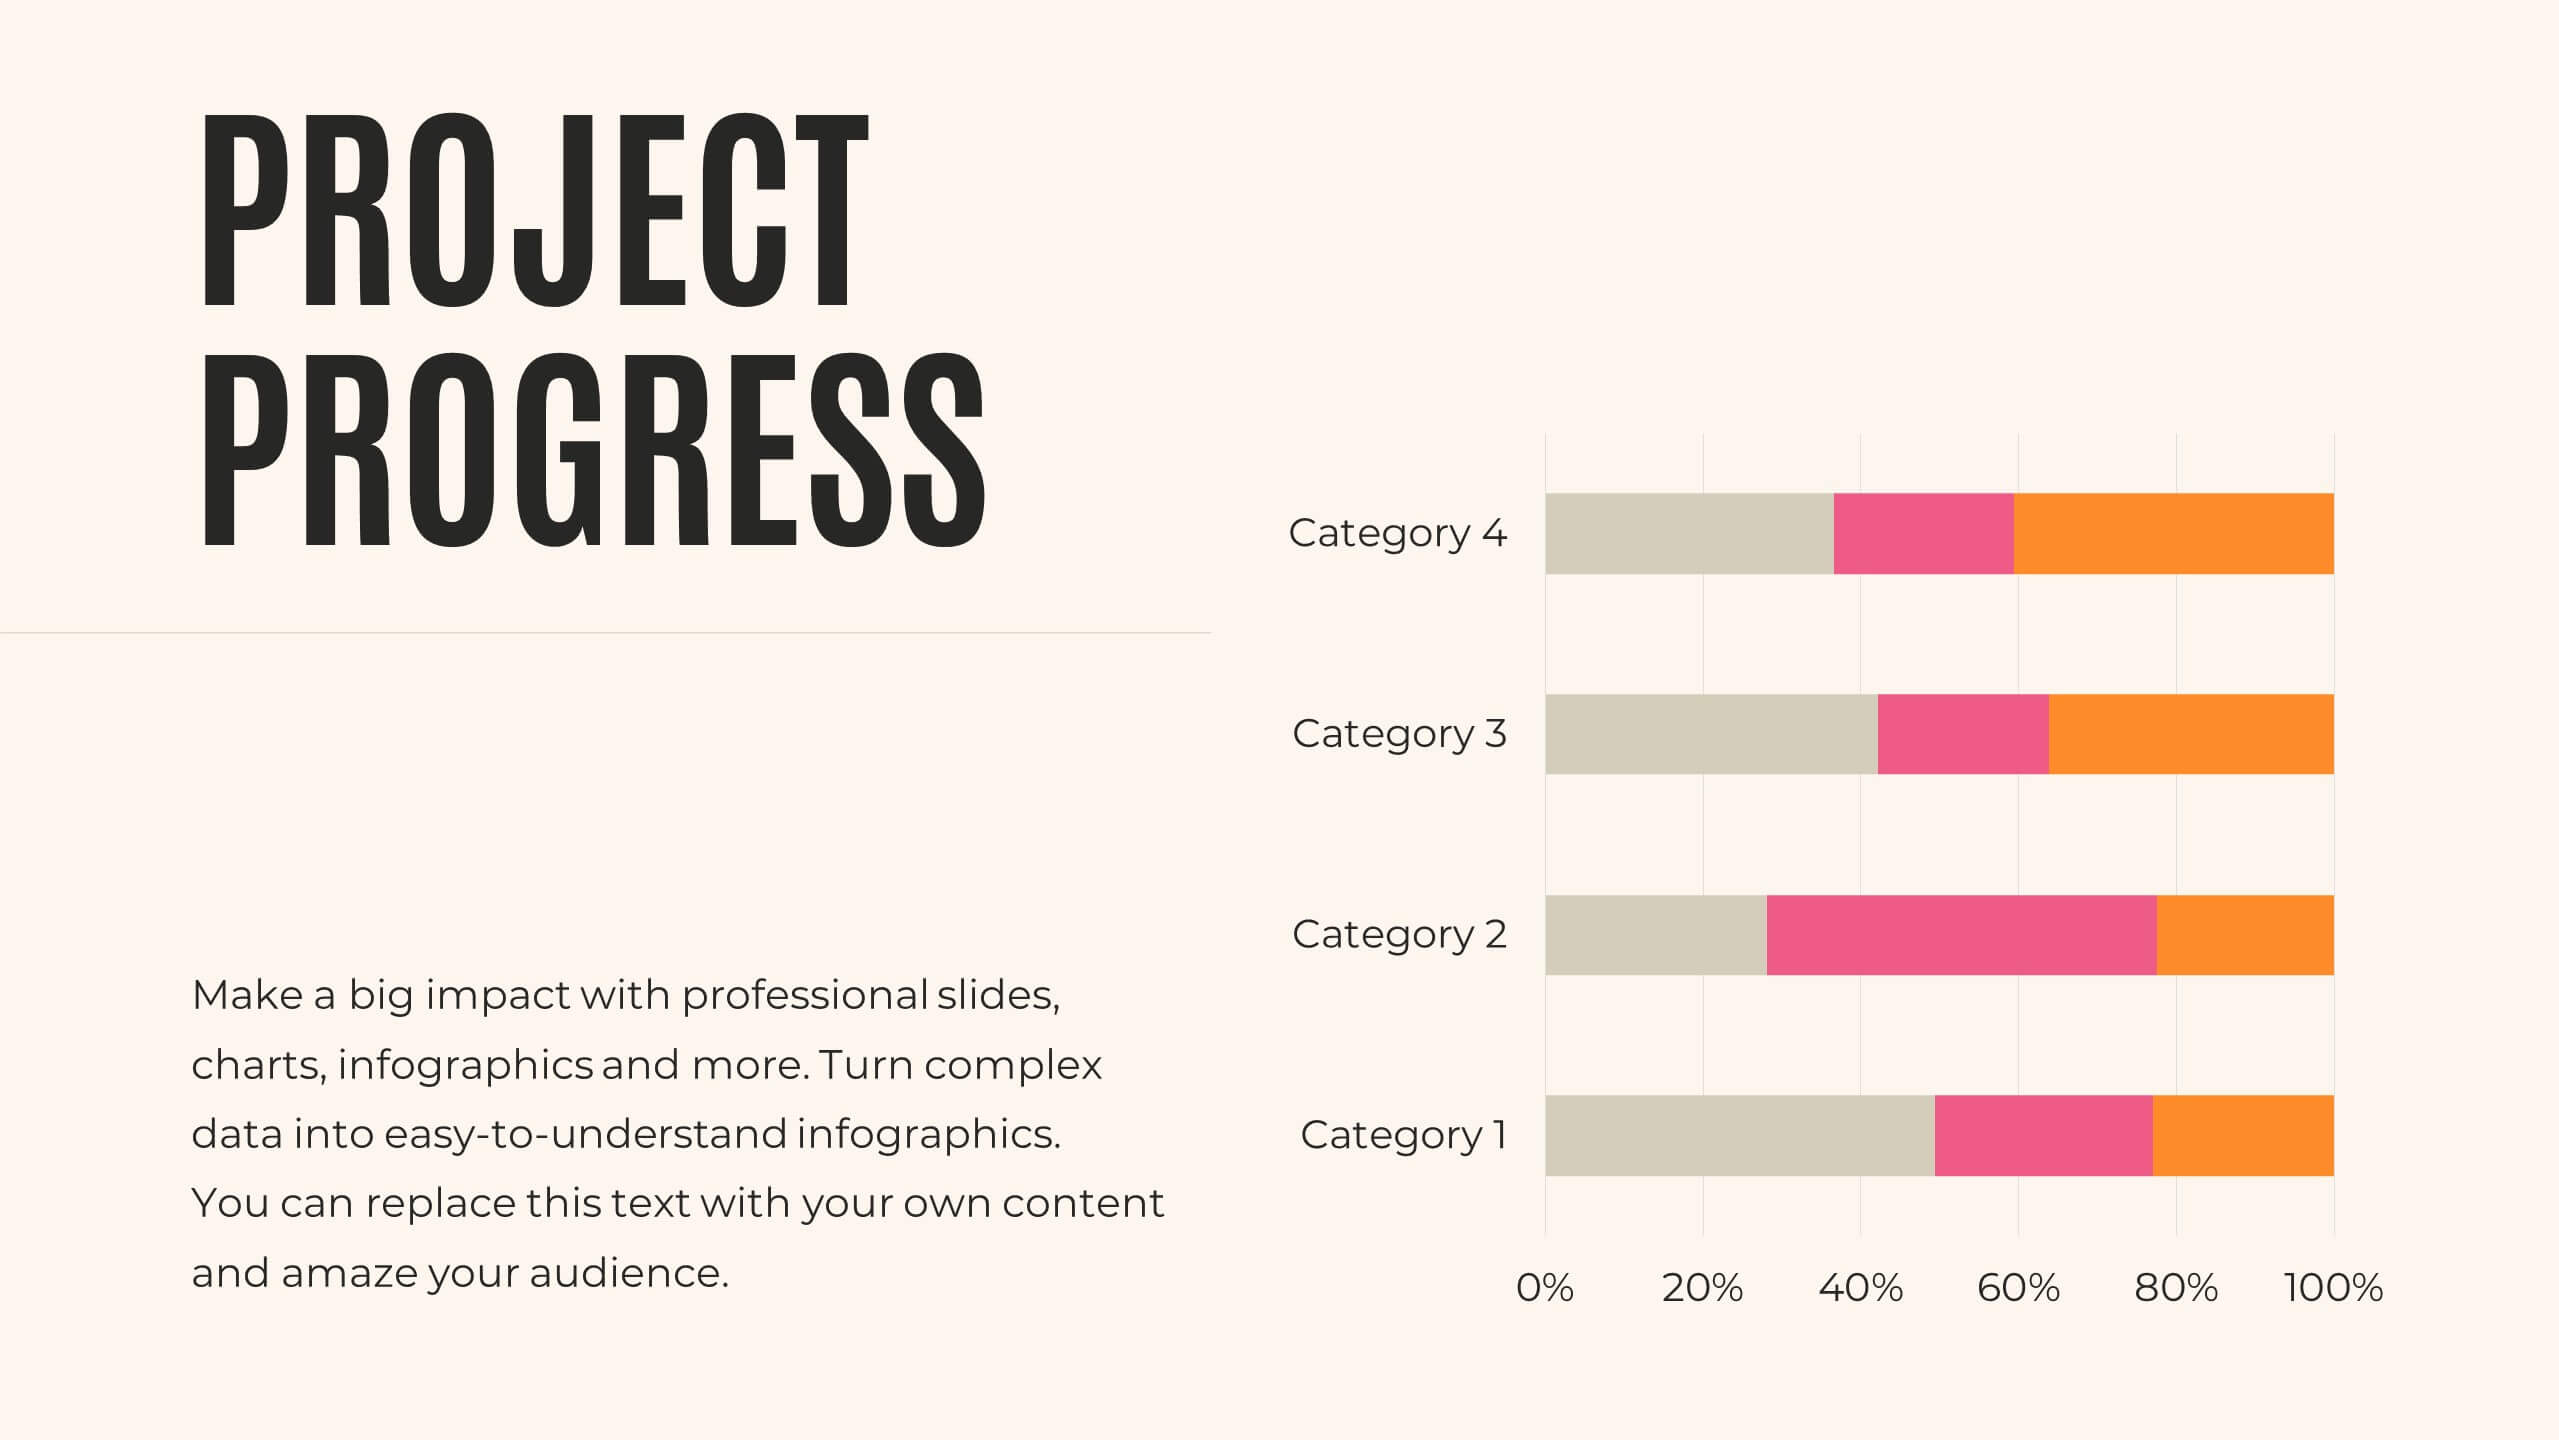
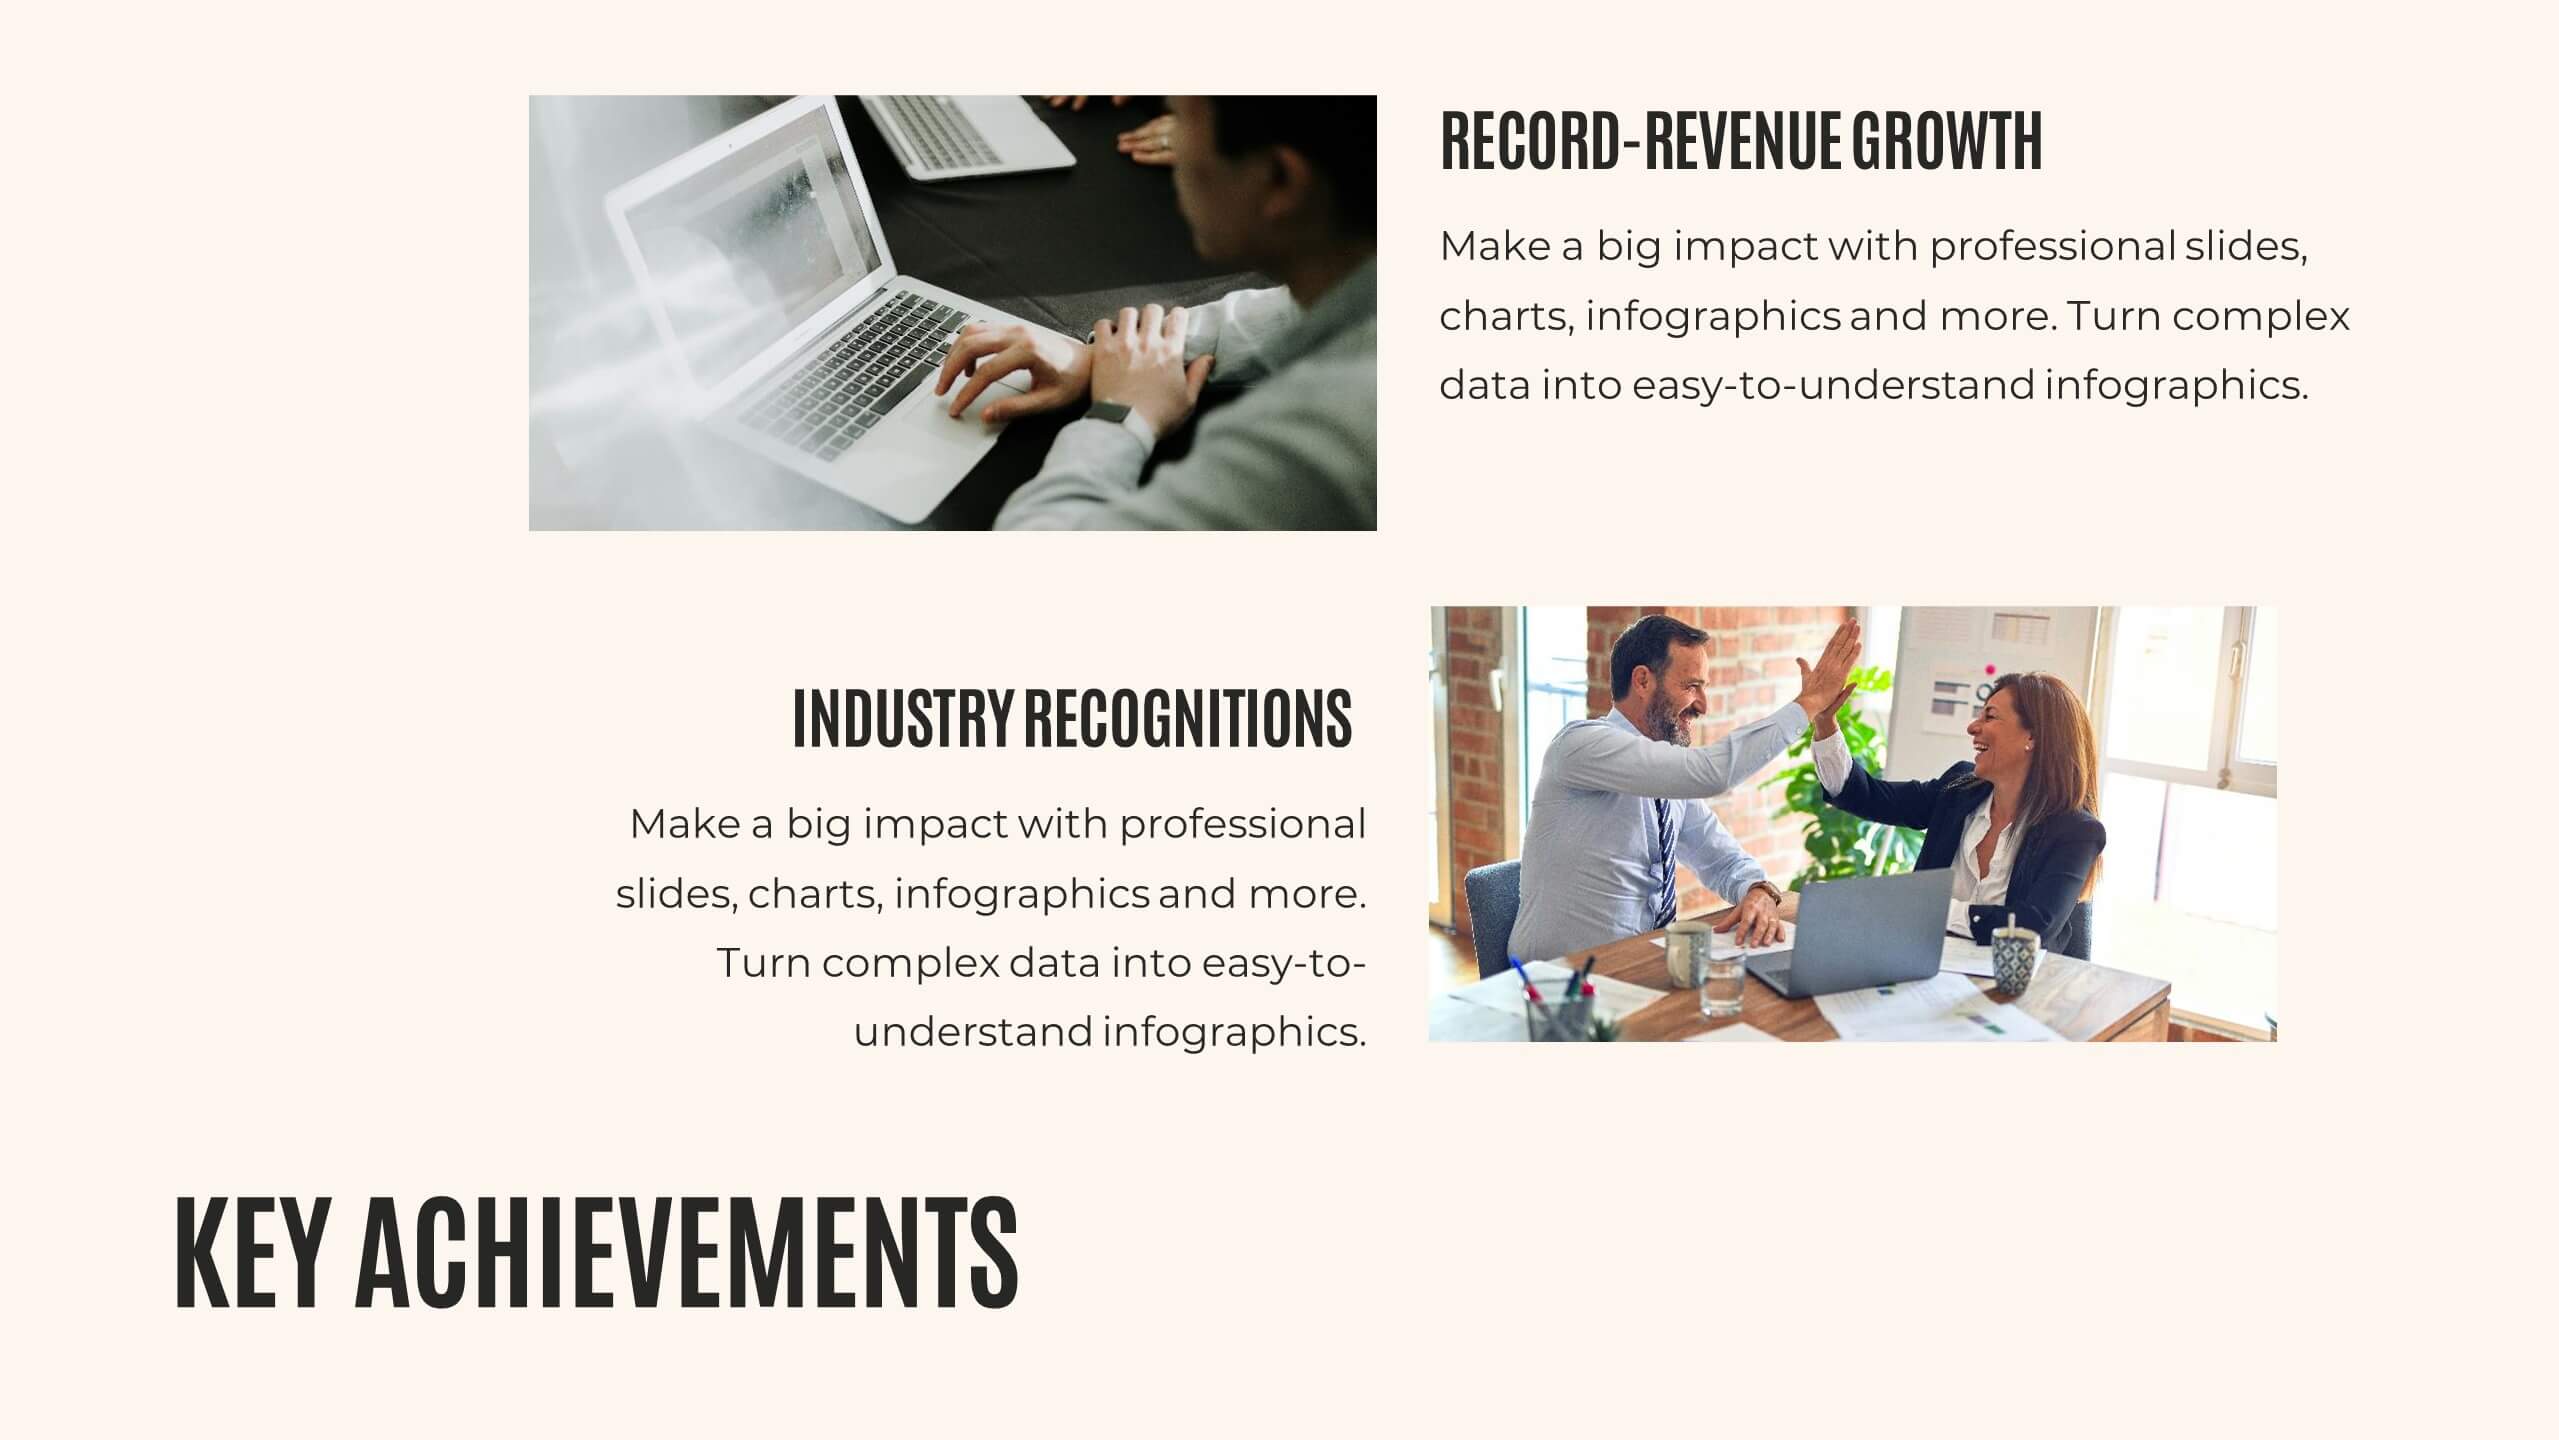
Journey Annual Report Presentation
Present your annual report with clarity and impact! This template covers agenda, key highlights, financial summary, sales performance, and project progress. Ideal for detailing achievements, insights, and future priorities. Compatible with PowerPoint, Keynote, and Google Slides, it ensures your data is visually compelling and easy to understand. Showcase your success effortlessly!


7 diapositivas
SCRUM Process Infographic
Scrum is an agile framework used in software development and project management. Embark on an agile journey through the scrum Process with our infographic template. This illustrative and informative infographic provides a clear visual guide to this methodology, facilitating a swift and efficient path to project success. Compatible with Powerpoint, Keynote, and Google Slides. This is an informative and visually engaging presentation that brings the effectiveness of scrum methodology to life, encouraging individuals and teams to sprint towards project excellence with precision and collaboration.


20 diapositivas
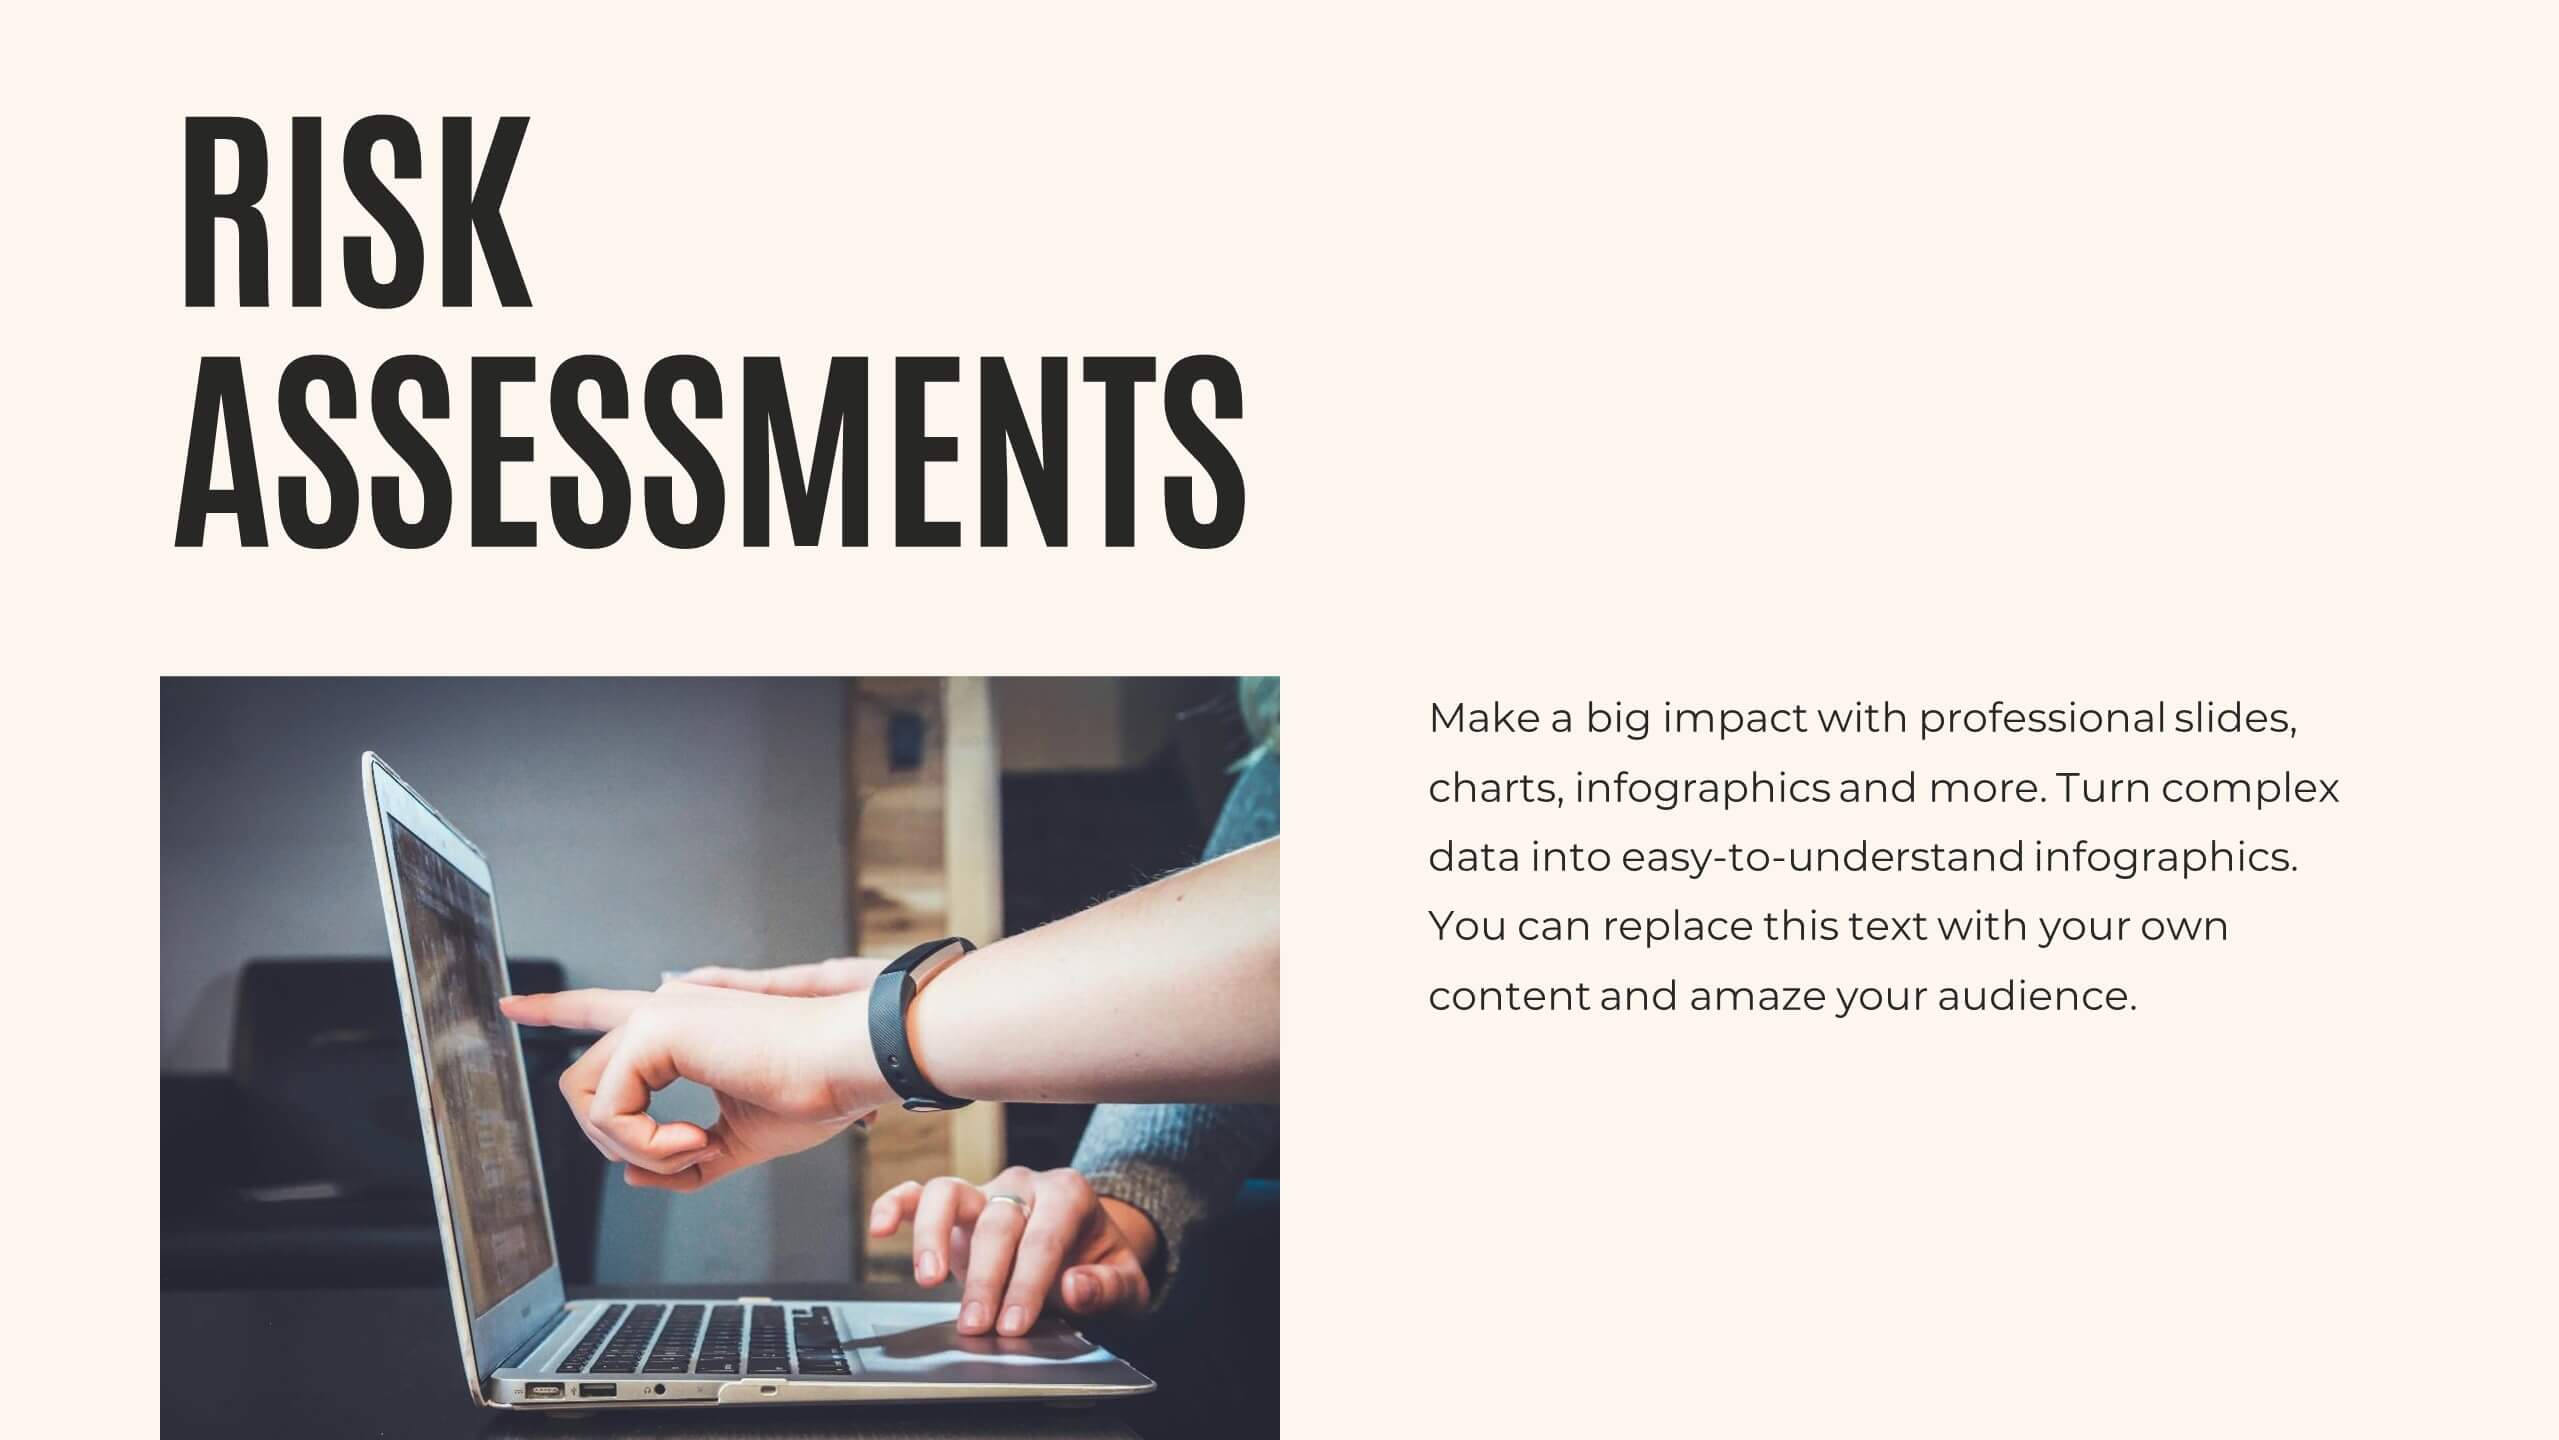
Visionix Project Management Plan Presentation
Streamline your project planning with this clean and modern presentation template. Covering key aspects such as objectives, timeline, budget breakdown, and risk management, it helps you organize and communicate your project strategy effectively. Ideal for business teams and project managers. Compatible with PowerPoint, Keynote, and Google Slides for easy customization.


20 diapositivas
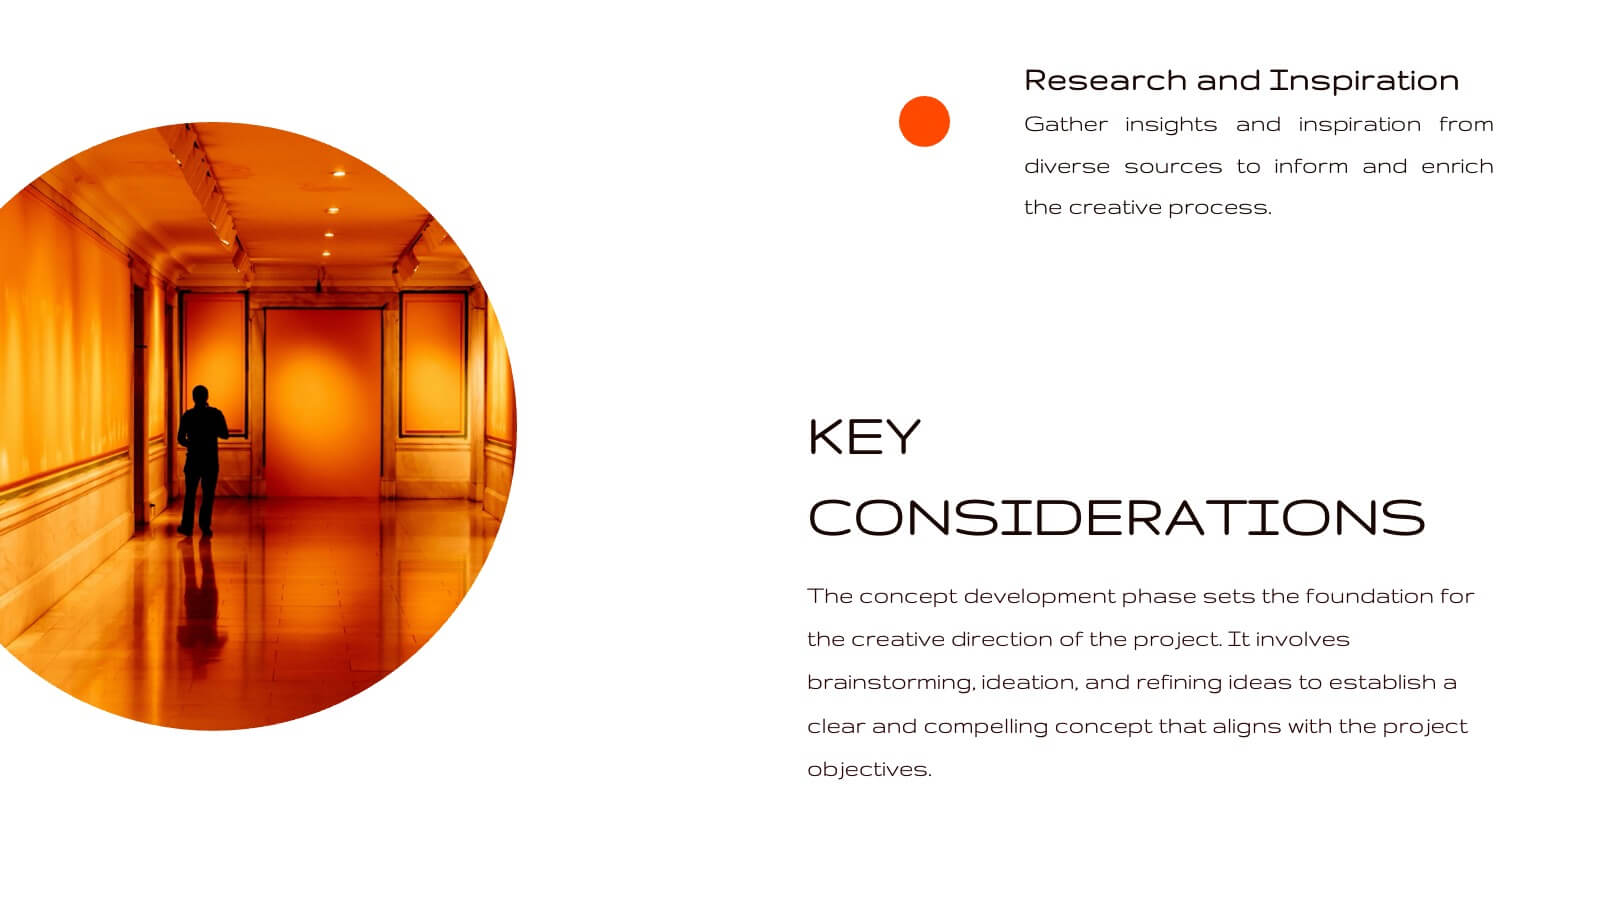
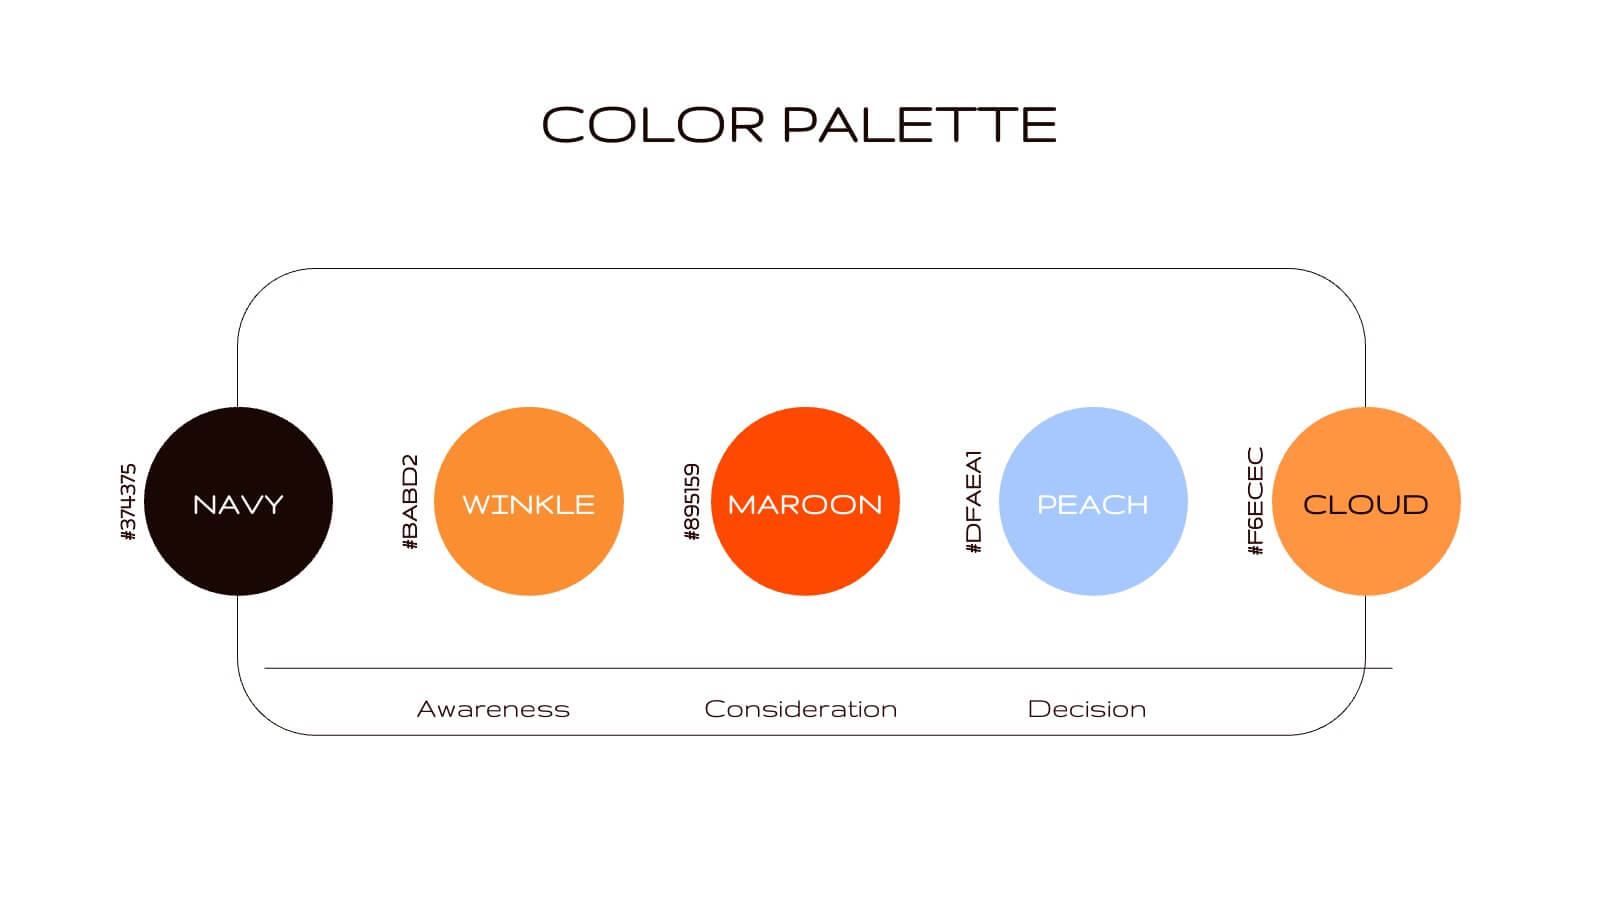
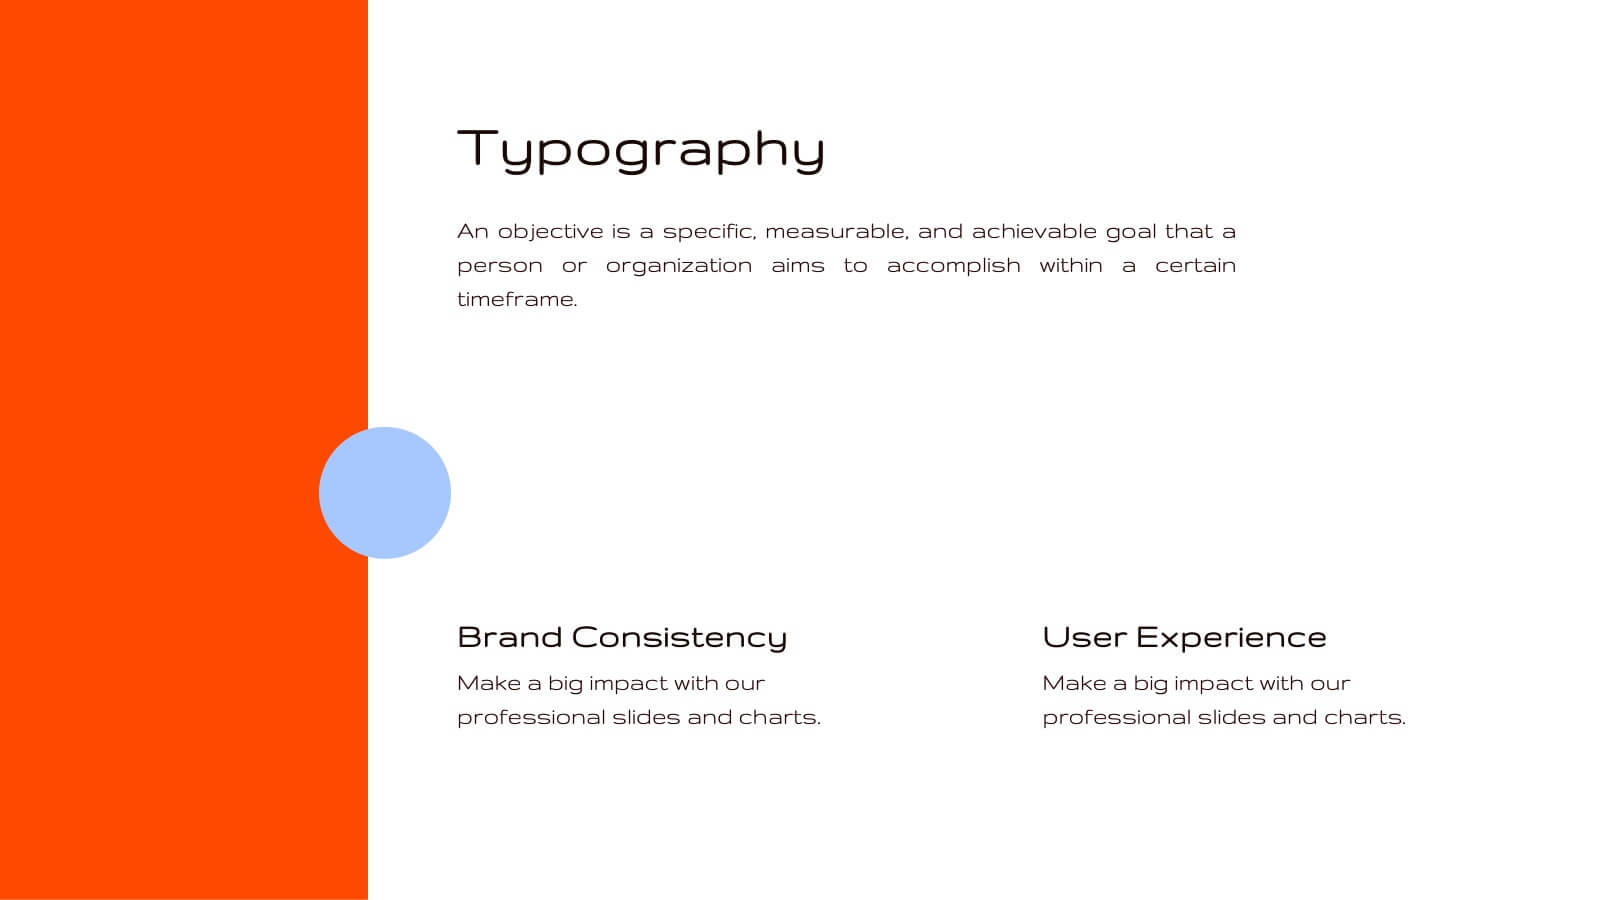
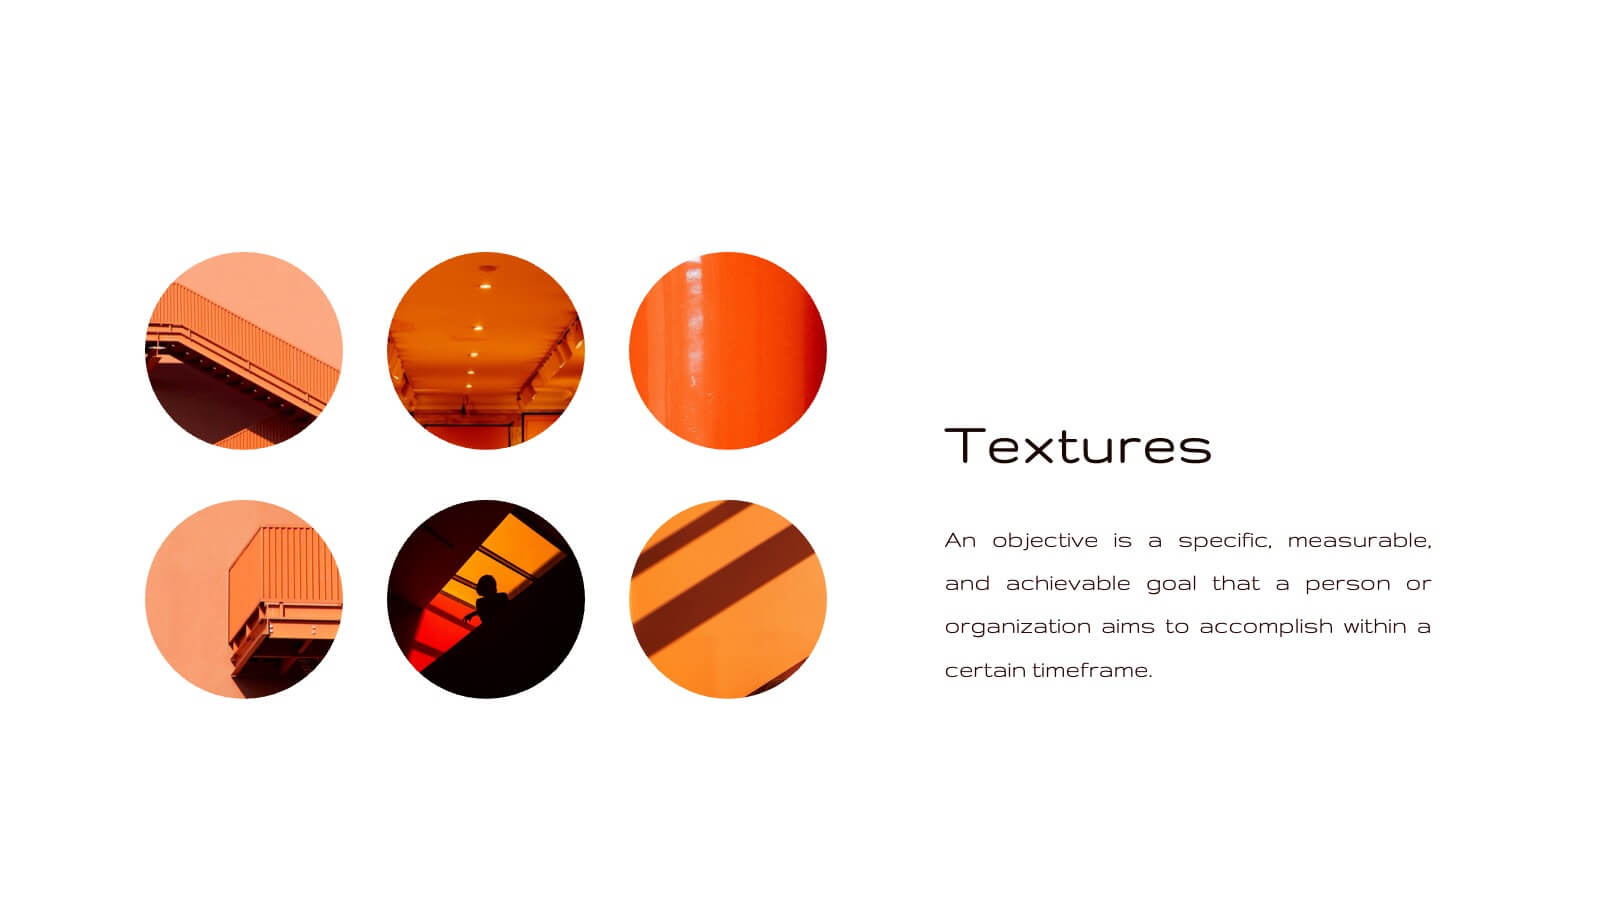
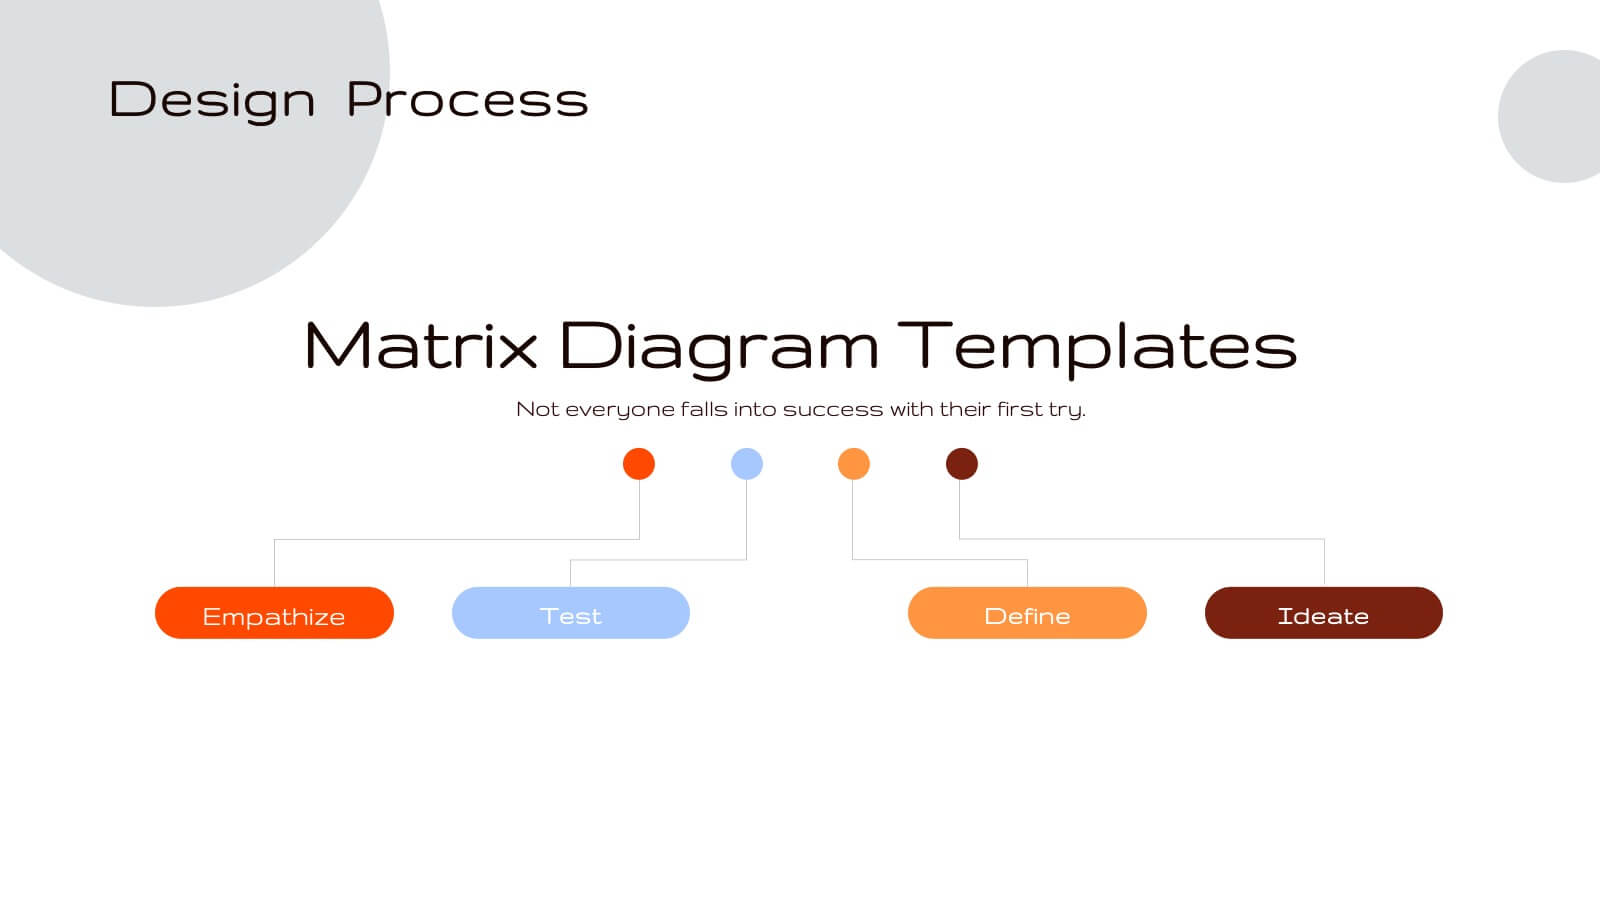
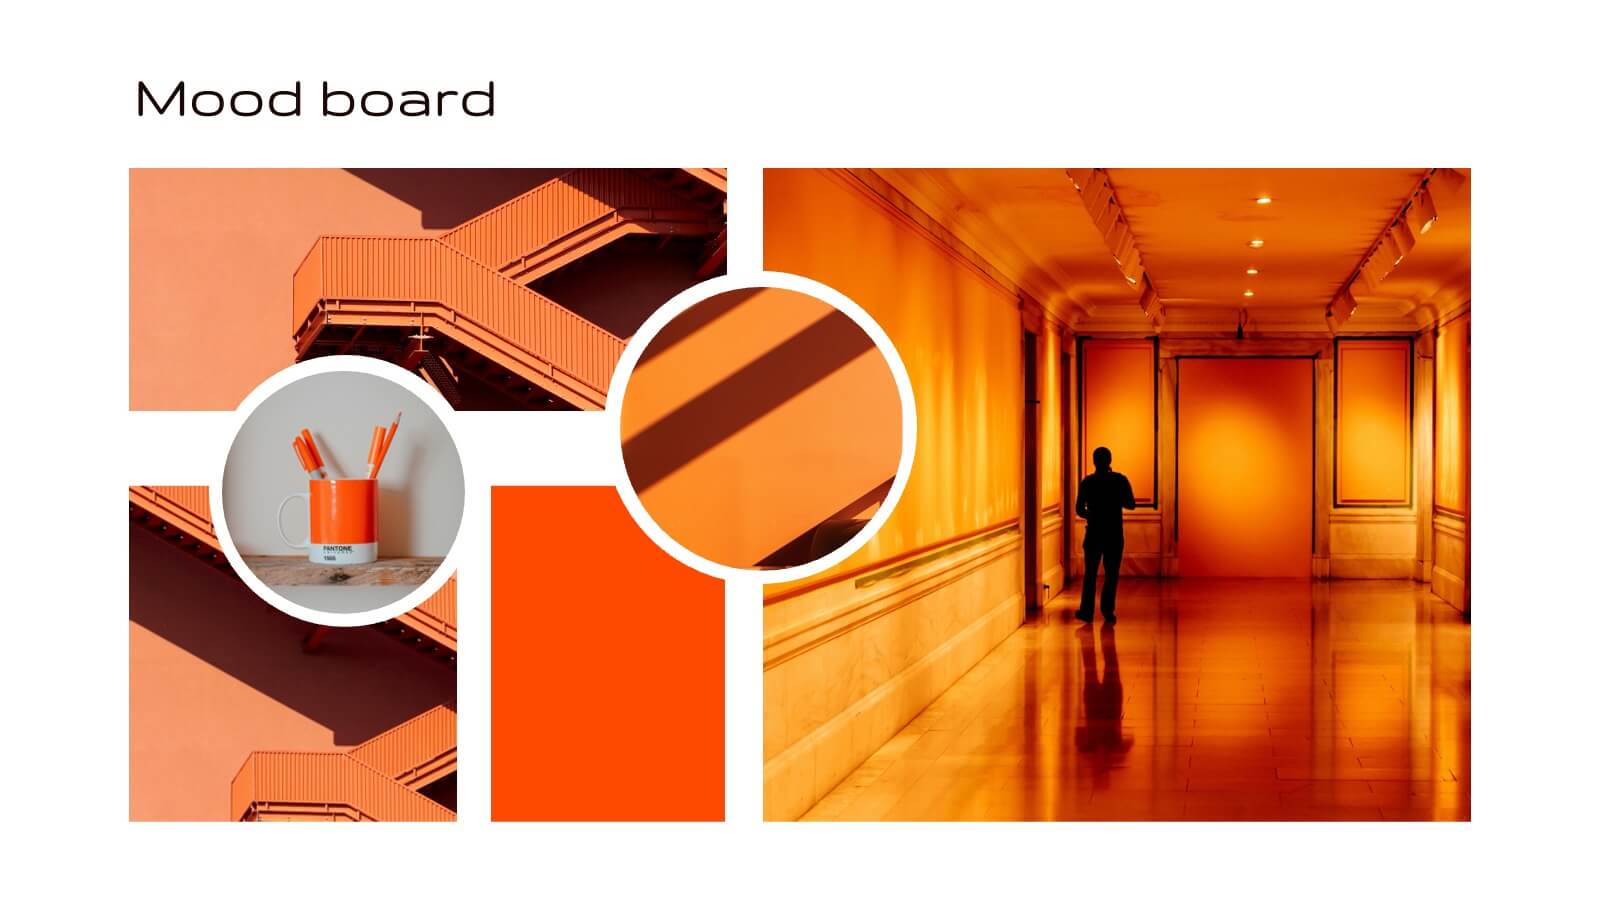
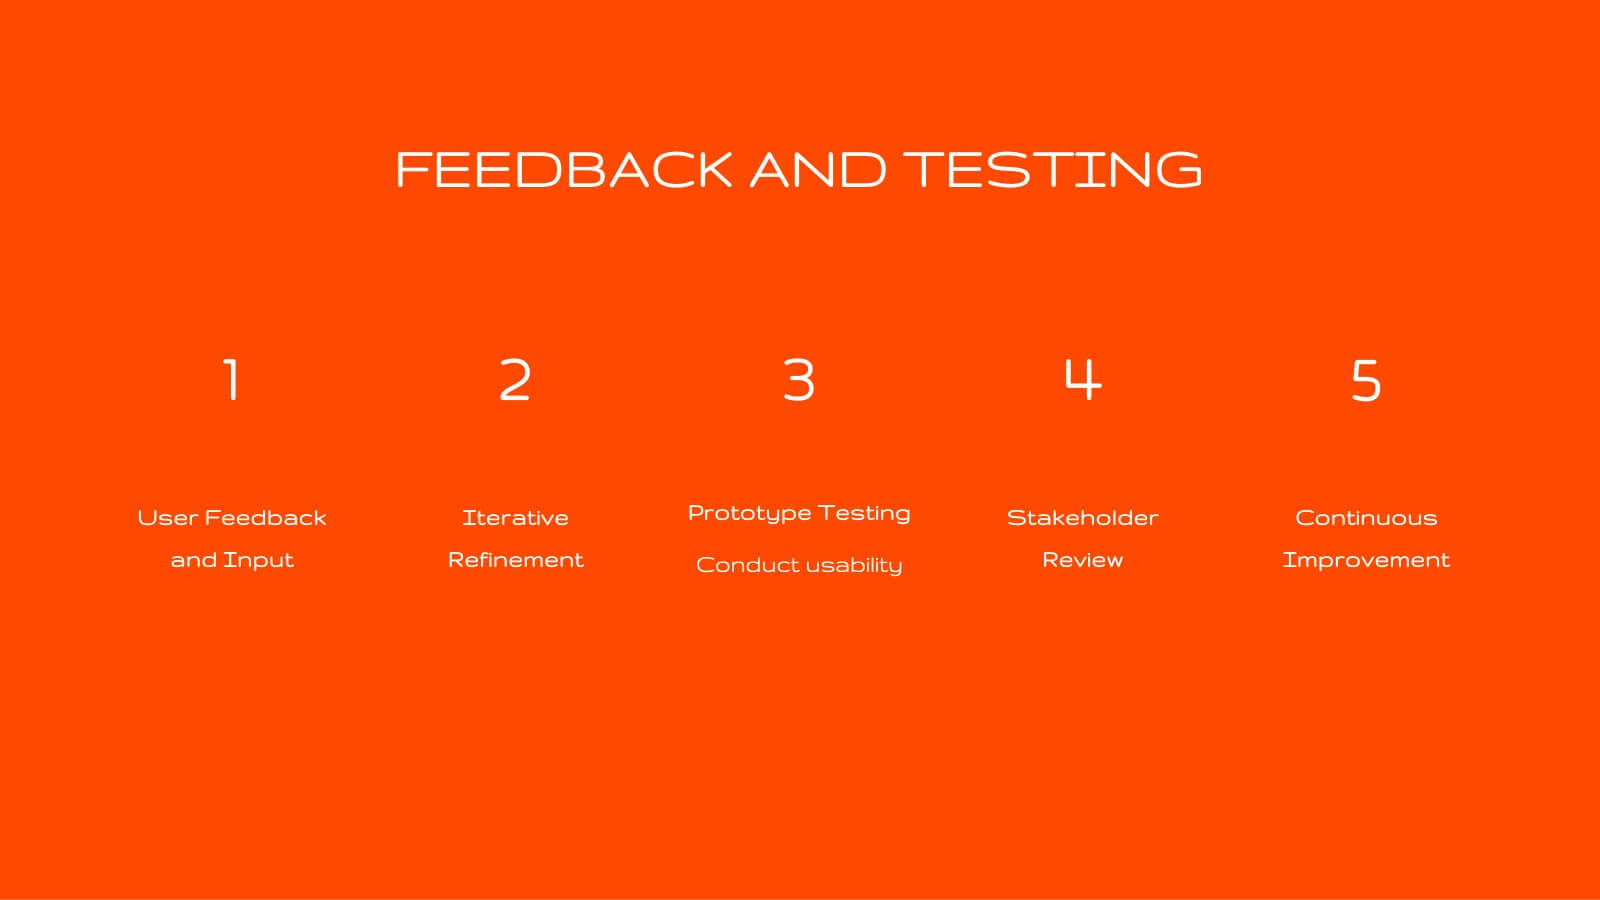
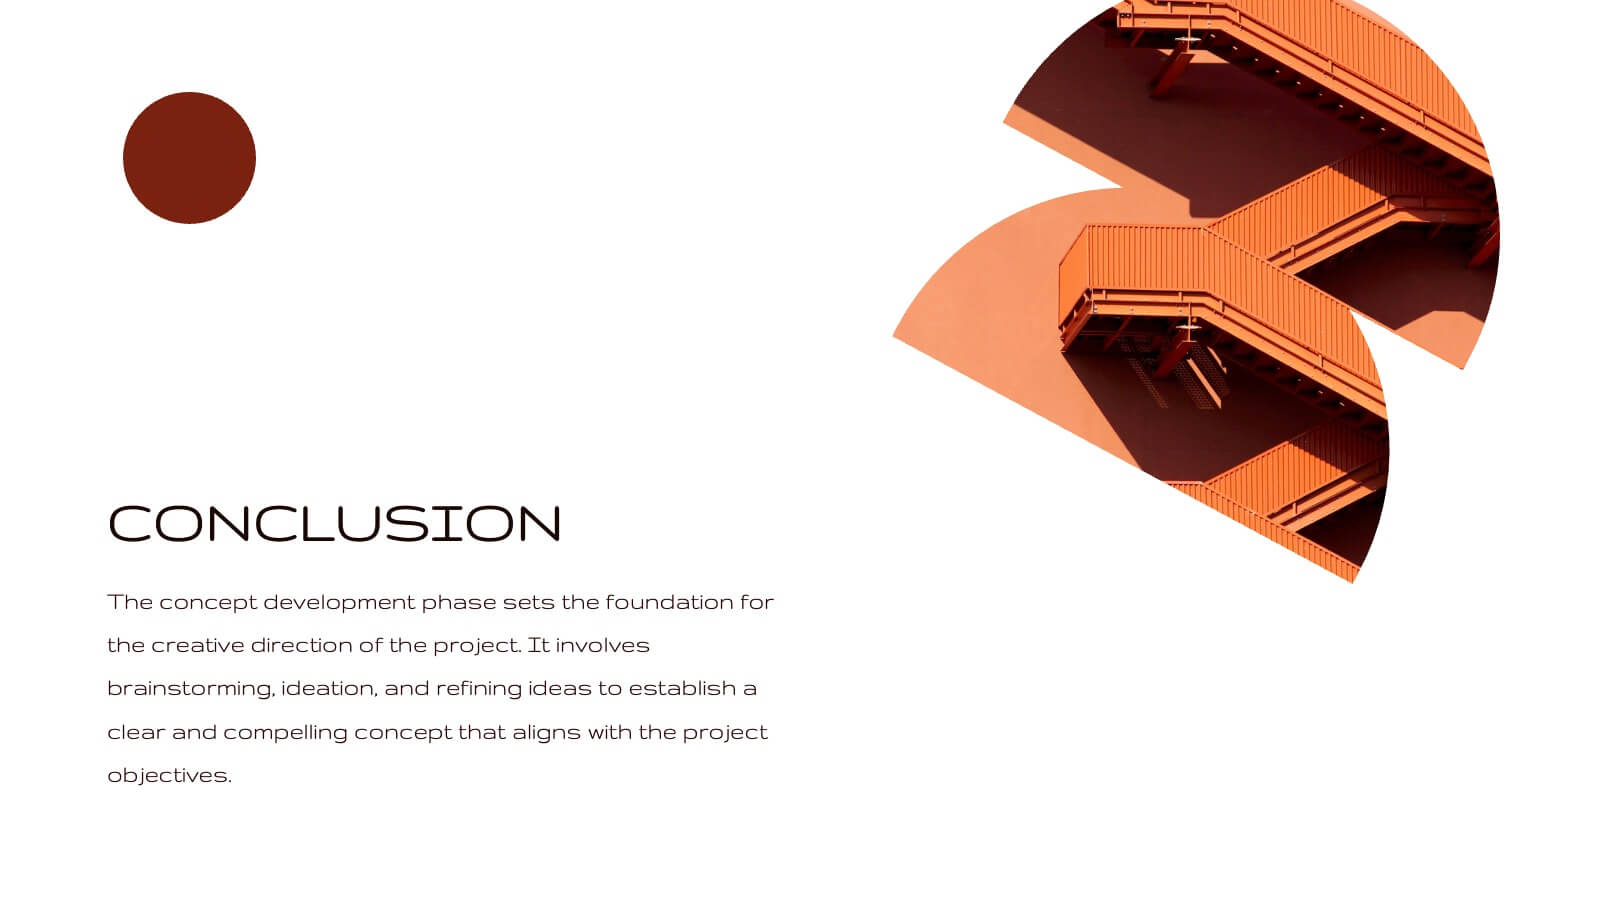
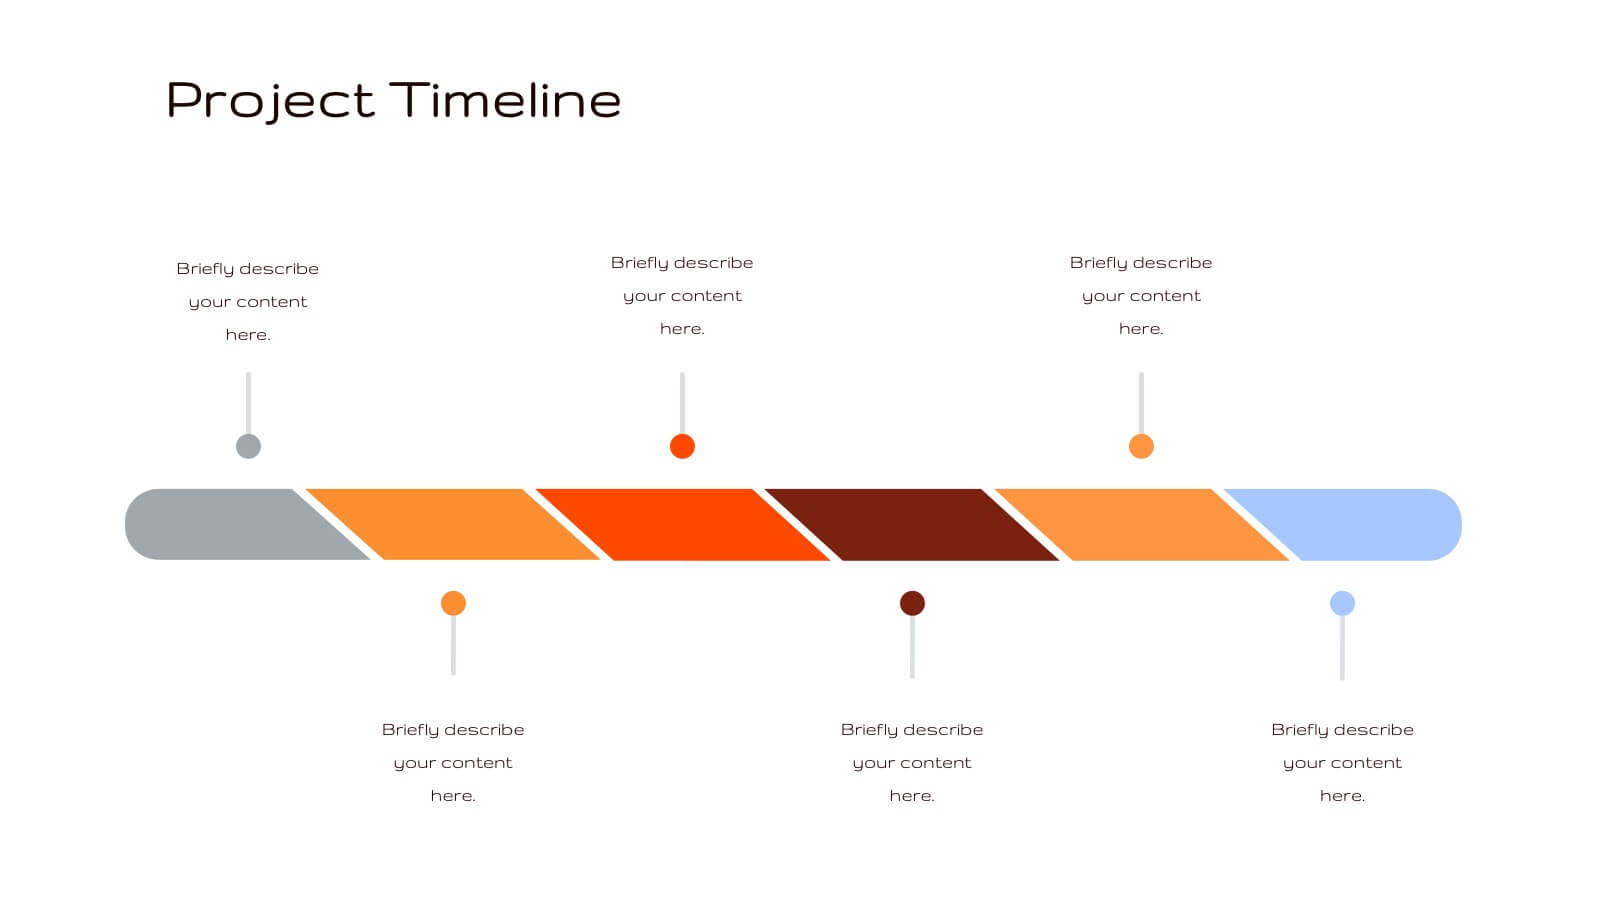
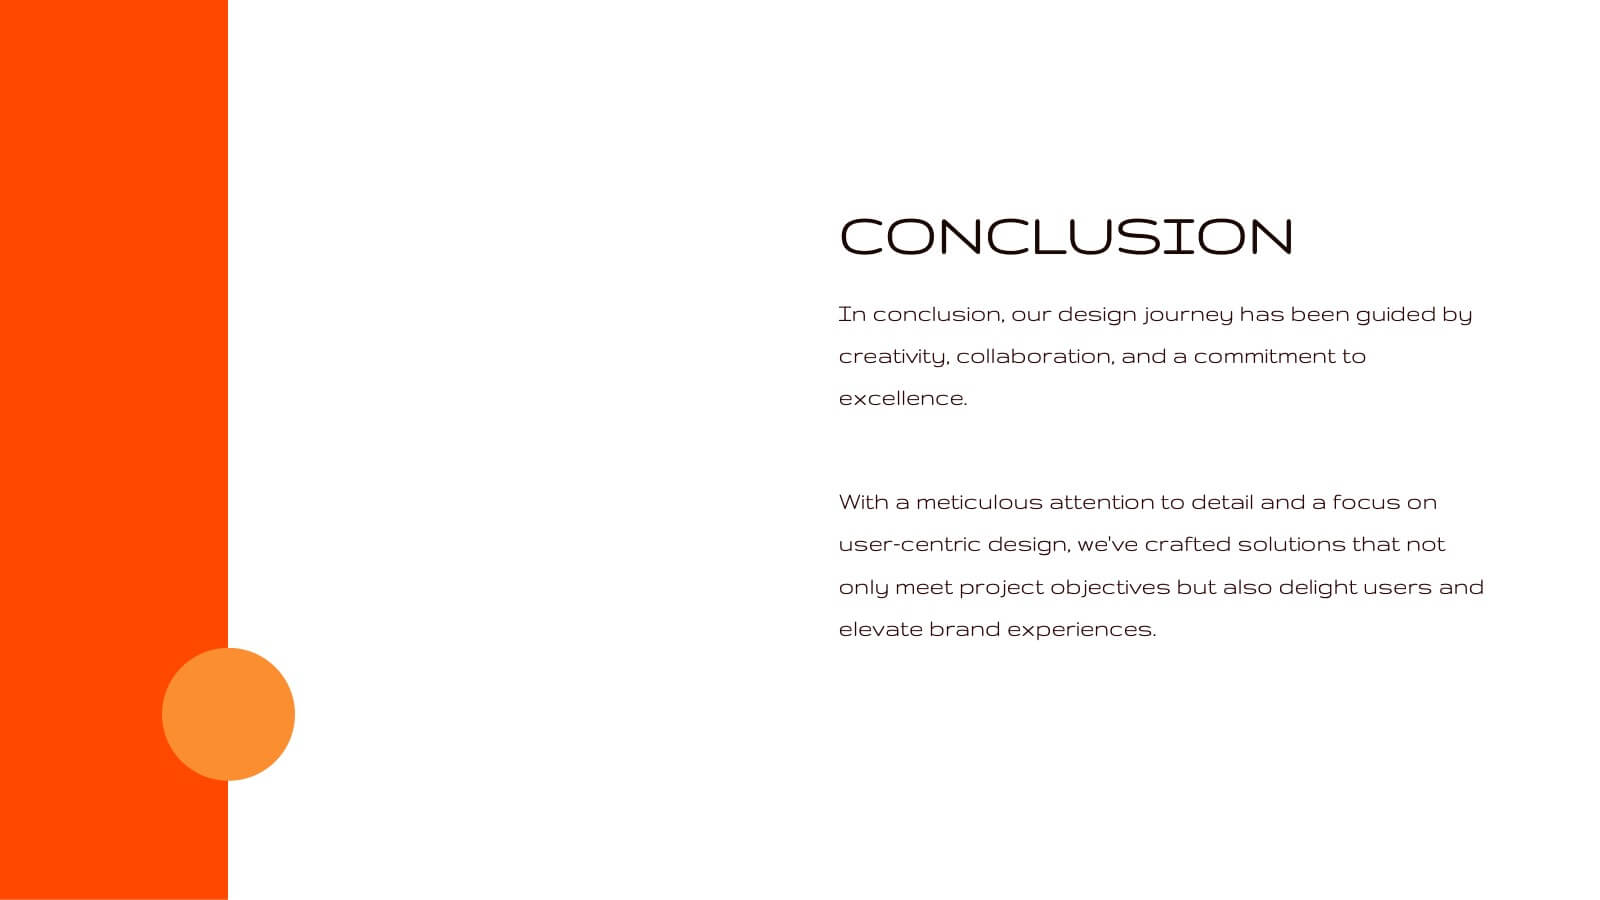
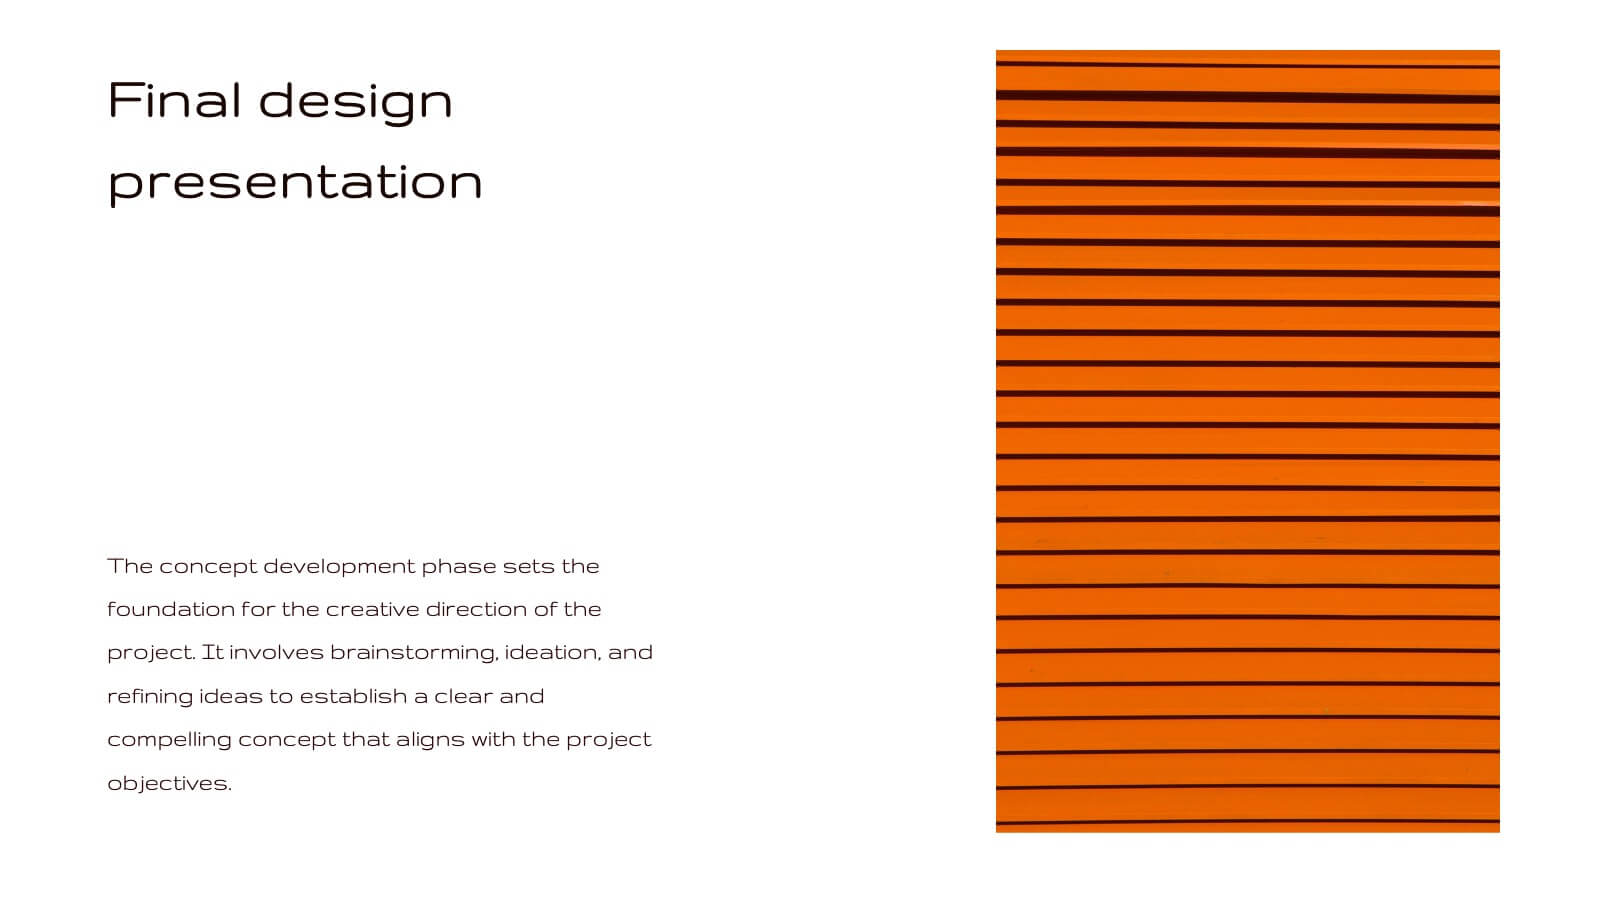
Quasar Design Strategy Proposal Presentation
Elevate your design strategy presentations with this modern, engaging template. Perfect for showcasing design briefs, concept development, and project timelines, it features a sleek layout with a cohesive color scheme. Highlight key elements like typography, textures, and feedback processes to captivate your audience. Compatible with PowerPoint, Keynote, and Google Slides, it ensures seamless presentations on any platform.


4 diapositivas
Breakthroughs in Scientific Discovery Presentation
Highlight research milestones with this Breakthroughs in Scientific Discovery Presentation Template. Designed with a lab flask graphic that fills up with percentages, this layout is perfect for showcasing progress, success metrics, or phased experimentation. Ideal for researchers, science communicators, and biotech presentations. Fully editable in PowerPoint, Keynote, and Google Slides.


5 diapositivas
Long-Term Strategy Slide Presentation
Ignite big ideas with a bold, forward-moving layout that makes long-range goals feel inspiring and achievable. This presentation helps you outline future plans, key milestones, and strategic priorities with clarity and visual impact. Easy to edit and fully compatible with PowerPoint, Keynote, and Google Slides.
22 diapositivas
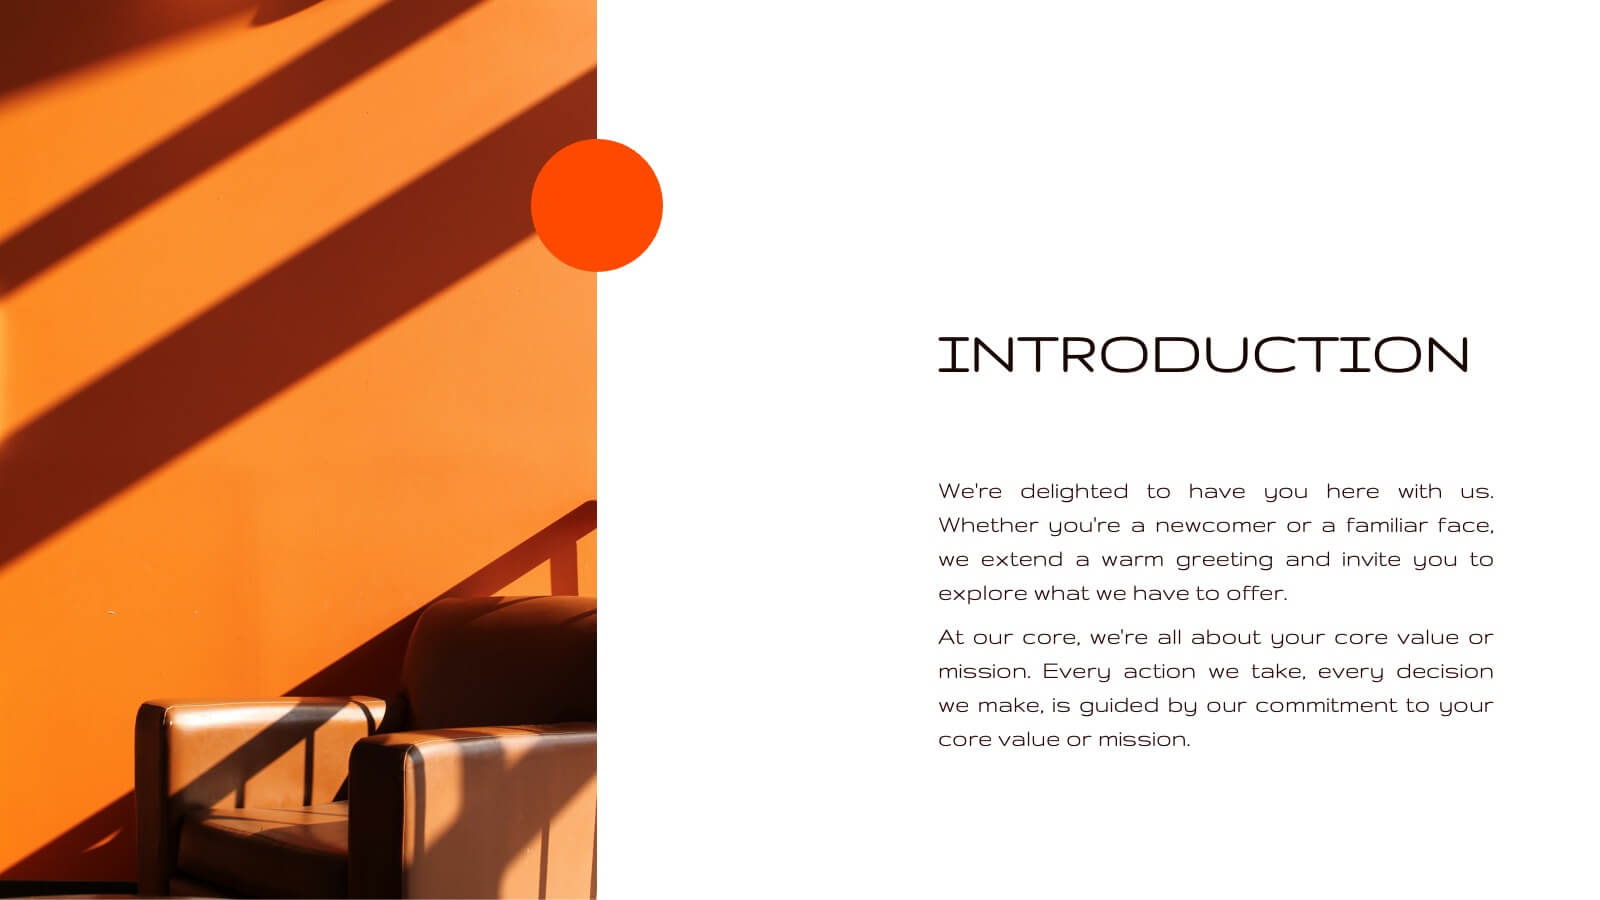
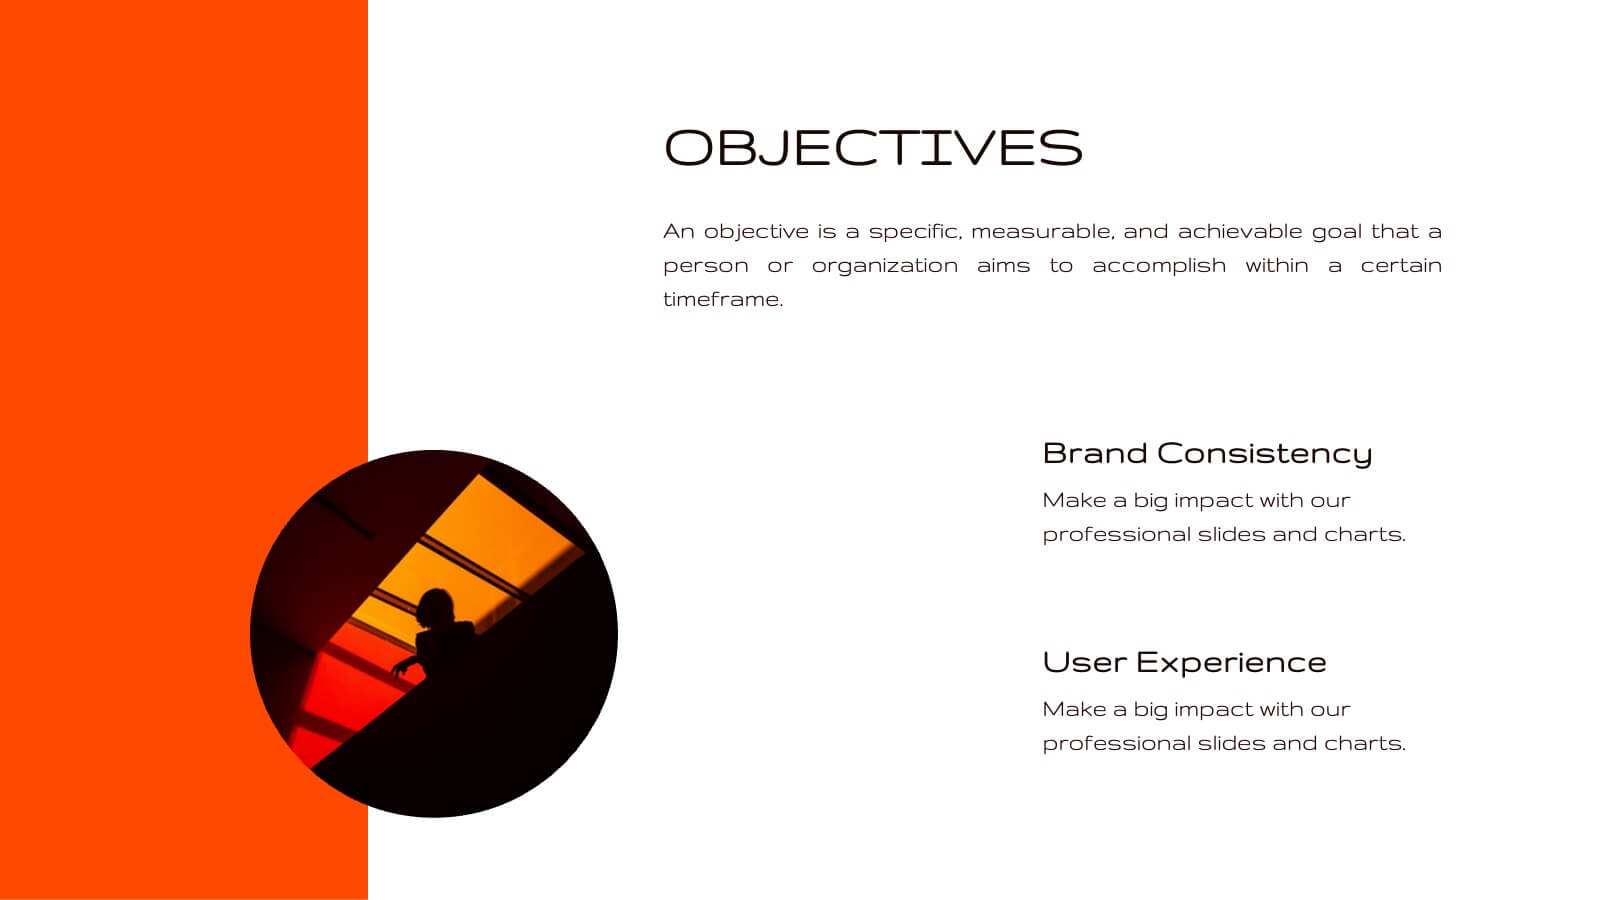
Radiance Creative Design Report Presentation
Bring your design ideas to life with this vibrant, engaging presentation template. Ideal for showcasing creative processes, concept development, and project timelines, it features a striking color palette and clean layout. This template is designed to captivate your audience and clearly communicate your design vision. Compatible with PowerPoint, Keynote, and Google Slides, it’s perfect for any platform.


4 diapositivas
Sustainable Farming Practices Presentation
Explore the essentials of sustainable farming with our visually engaging presentation template. Perfect for educational and advocacy purposes, it outlines key practices that promote environmental sustainability in agriculture. This template features easy-to-understand graphics and placeholders for comprehensive discussions on eco-friendly farming techniques.


2 diapositivas
Professional Thank You Closing Slide Presentation
Make your last impression count with a clean, modern closing slide that wraps up your presentation in style. This template is designed to help you leave a professional mark while displaying contact info, brand visuals, or a thank-you note. Fully compatible with PowerPoint, Keynote, and Google Slides for flexible use.


5 diapositivas
Six Sigma DMAIC Process Flow Presentation
Streamline your process improvement with this Six Sigma DMAIC Flow template. Visually organize each stage—Define, Measure, Analyze, Improve, Control—using clean, professional layouts. Perfect for Lean Six Sigma projects, quality control, and operational excellence. Fully customizable in PowerPoint, Keynote, and Google Slides for versatile team presentations and process reviews.


10 diapositivas
Lean Six Sigma Business Strategy Presentation
Enhance your operational efficiency with our Lean Six Sigma Business Strategy template! This user-friendly guide helps you navigate through the core stages—Define, Measure, Analyze, Improve, and Control—optimizing processes and reducing waste. Compatible with PowerPoint, Keynote, and Google Slides, this template is perfect for professionals aiming to drive business excellence through structured problem-solving.


3 diapositivas
Company Mission and Core Values Presentation
Present your brand’s purpose with clarity using this streamlined infographic slide. Divided into three distinct sections—Mission, Vision, and Values—each with icon support and editable text, this layout offers a clean and professional structure for showcasing your company’s guiding principles. Ideal for pitch decks, onboarding, and strategic planning presentations. Fully compatible with PowerPoint, Keynote, and Google Slides.
22 diapositivas
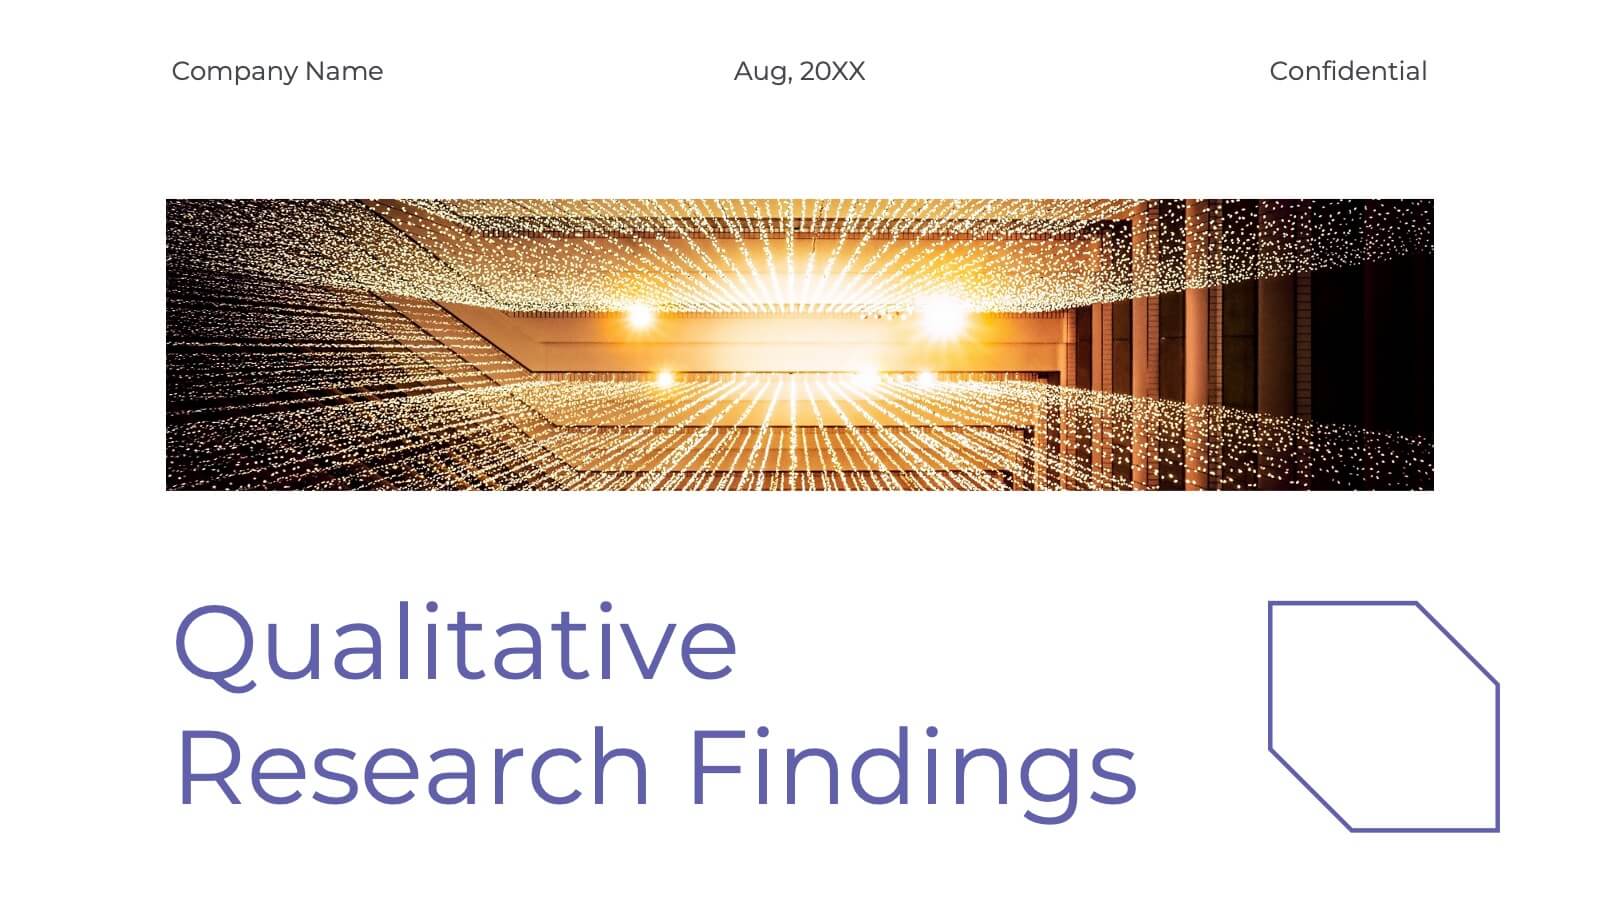
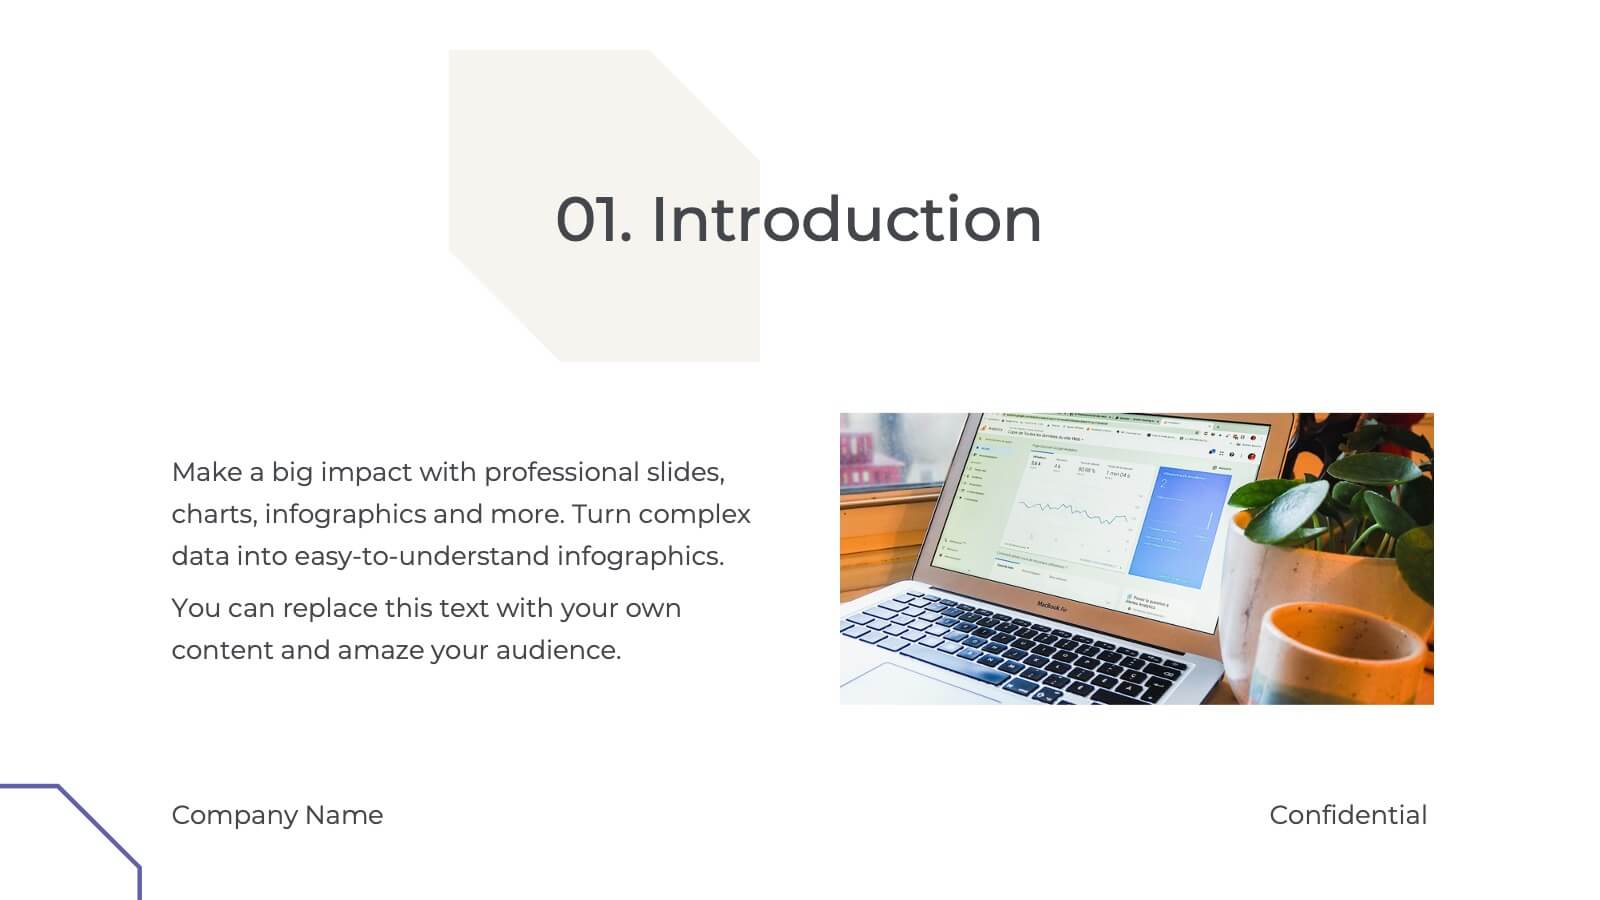
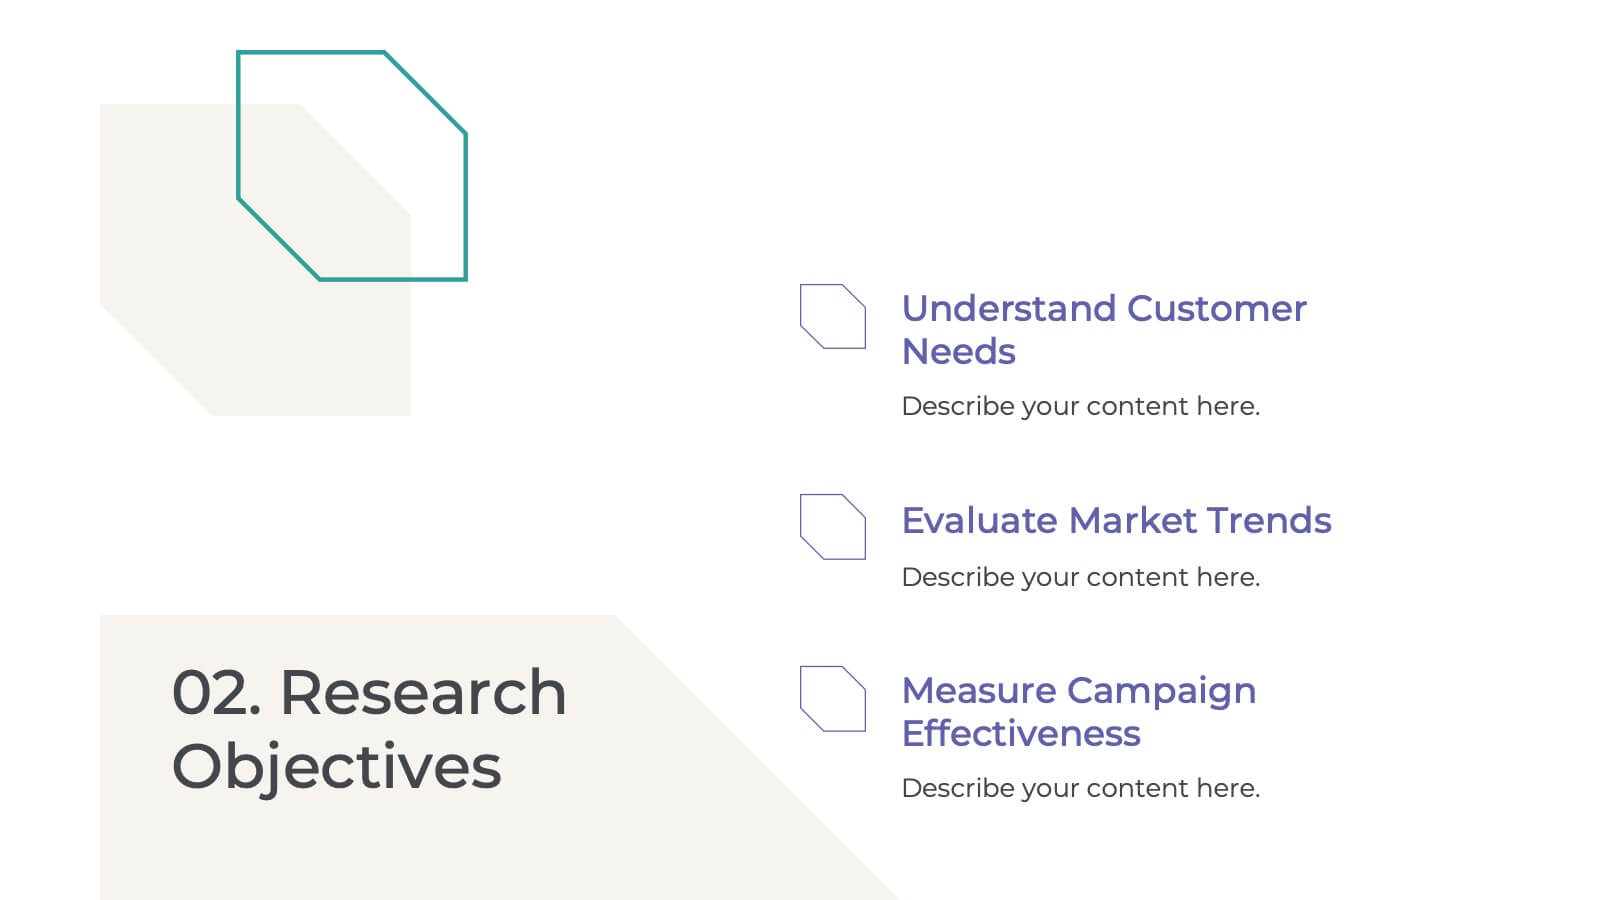
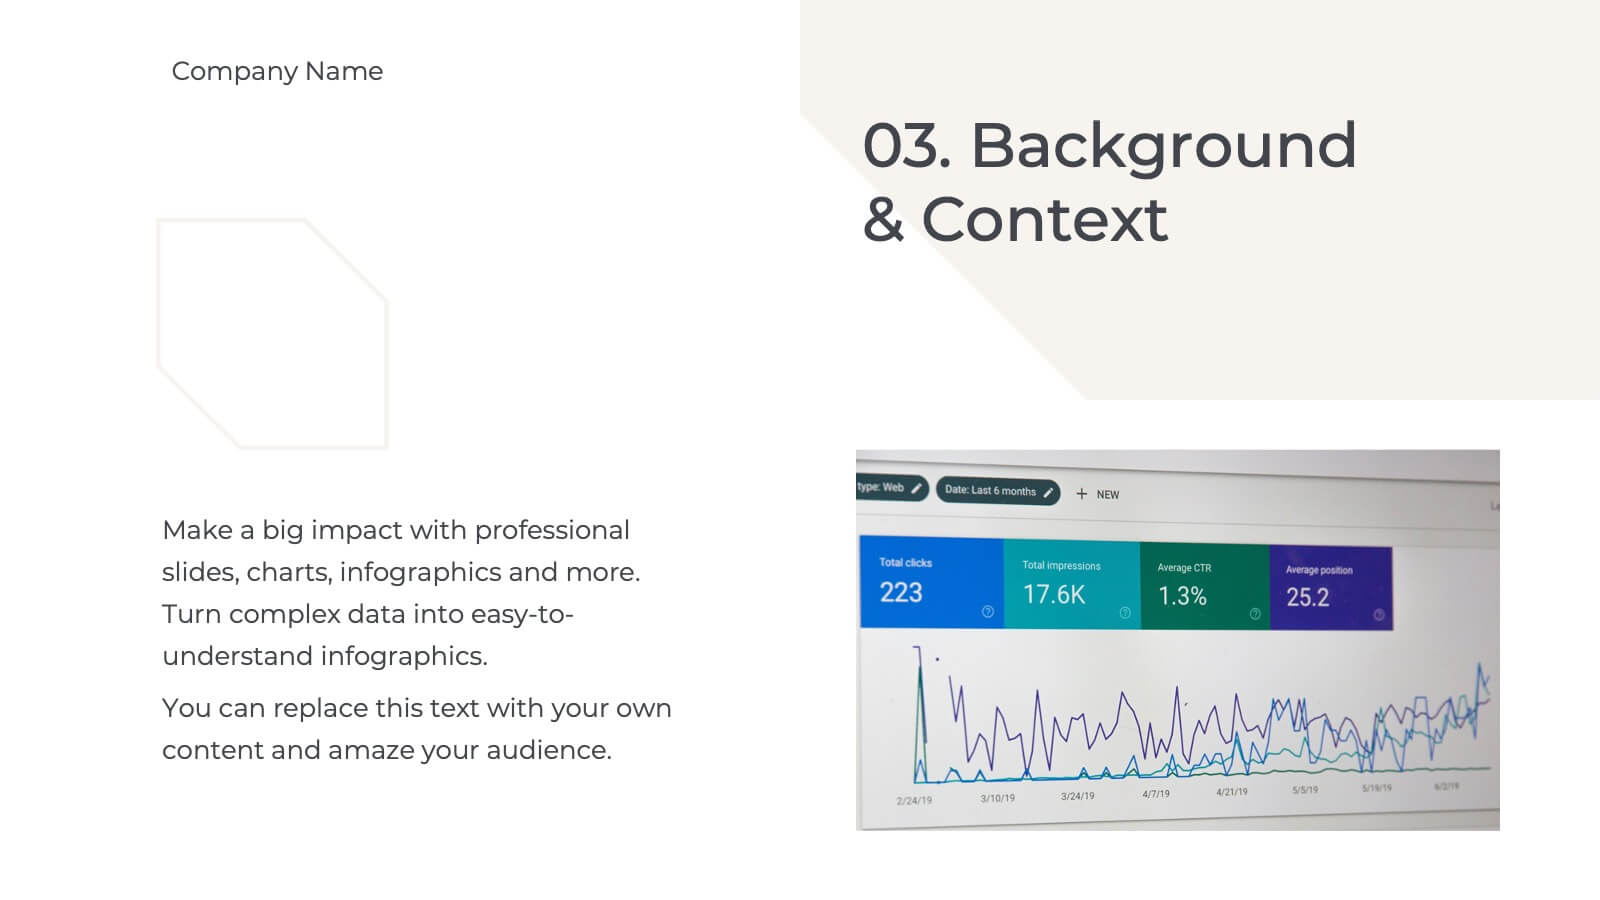
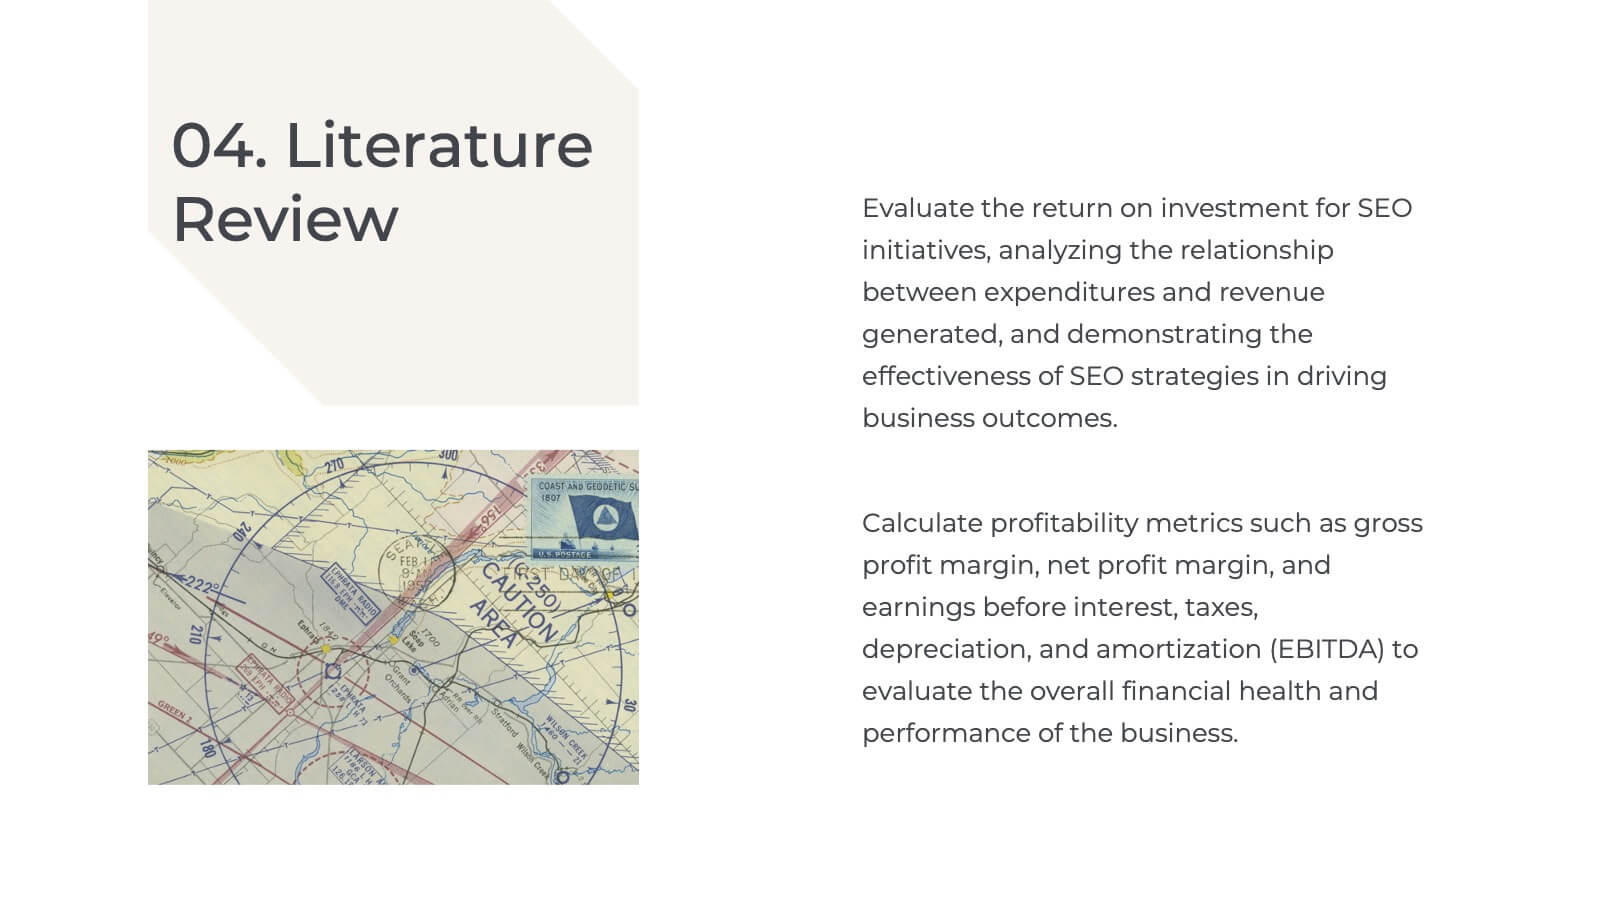
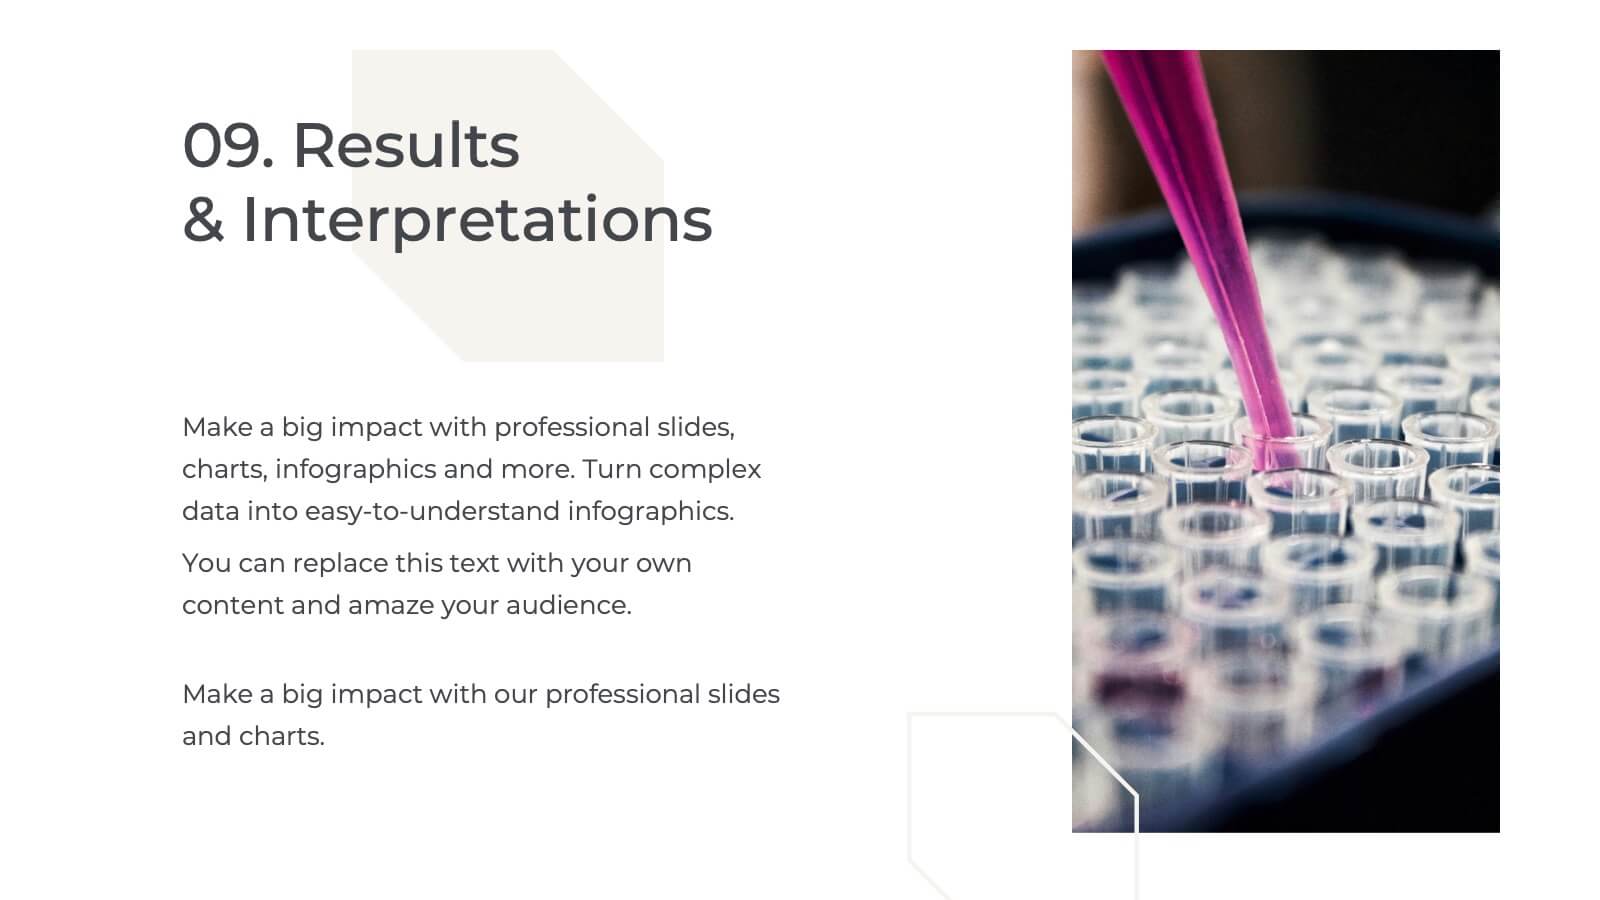
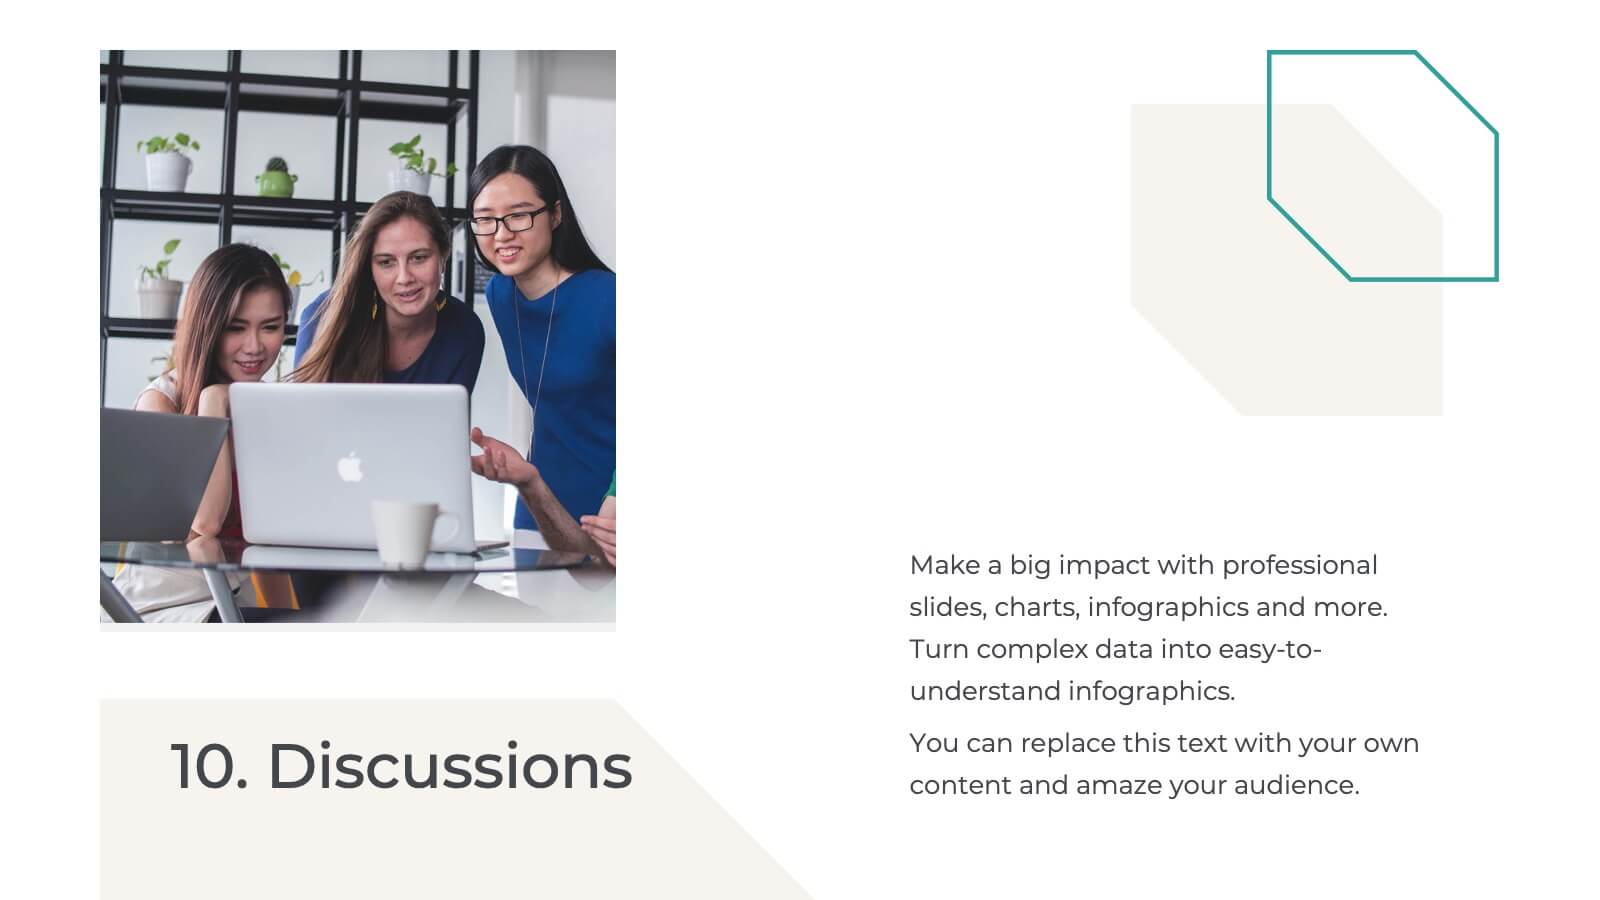
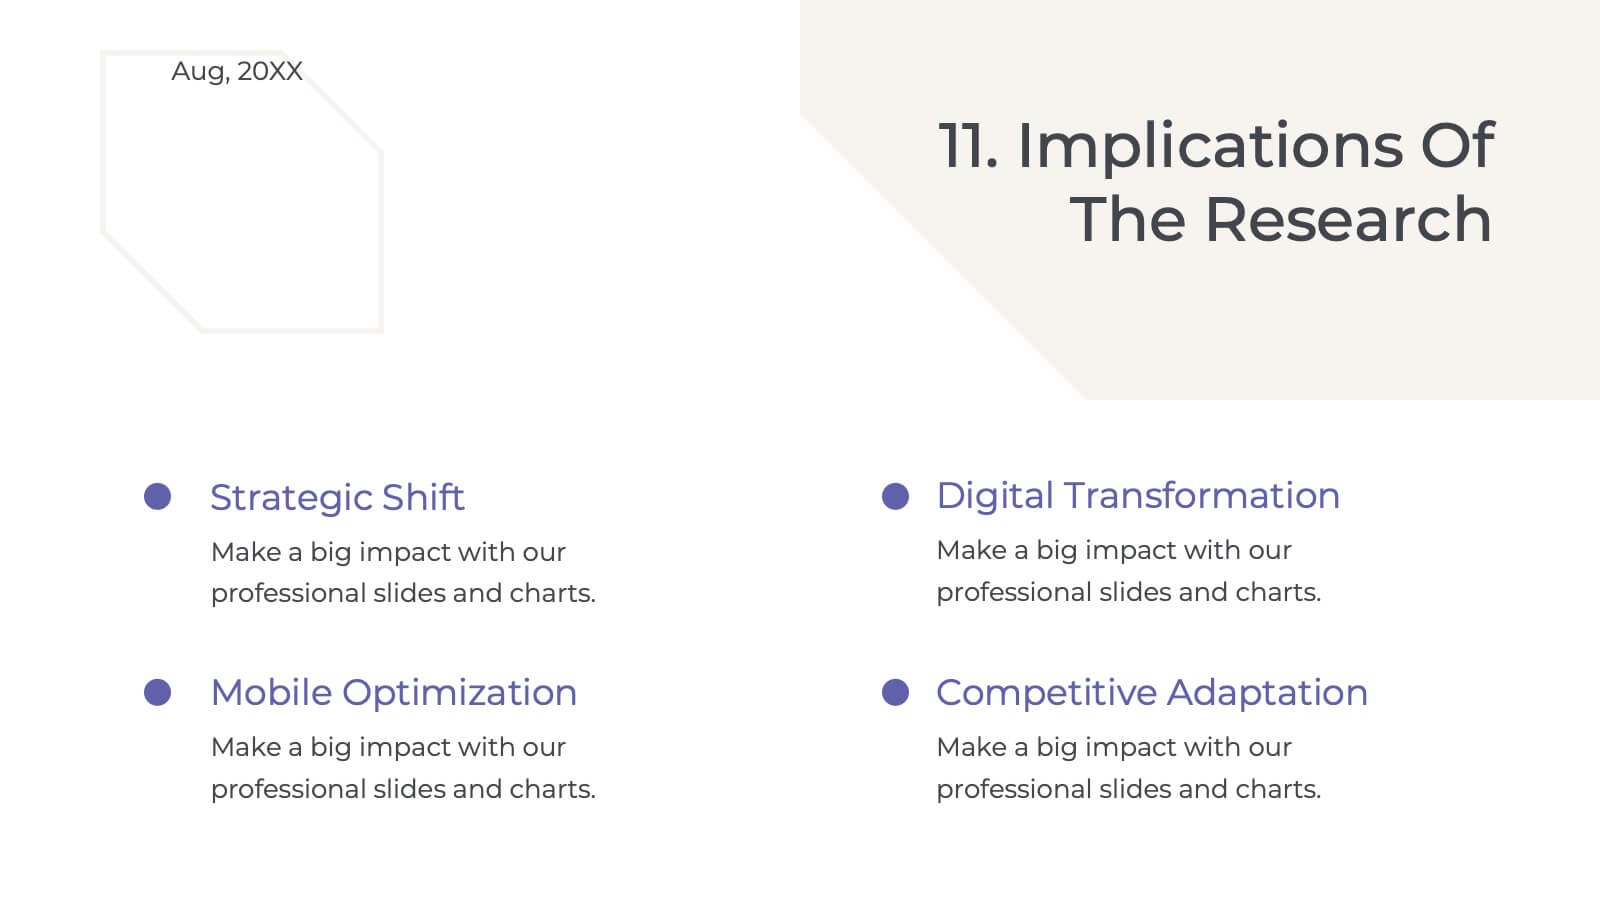
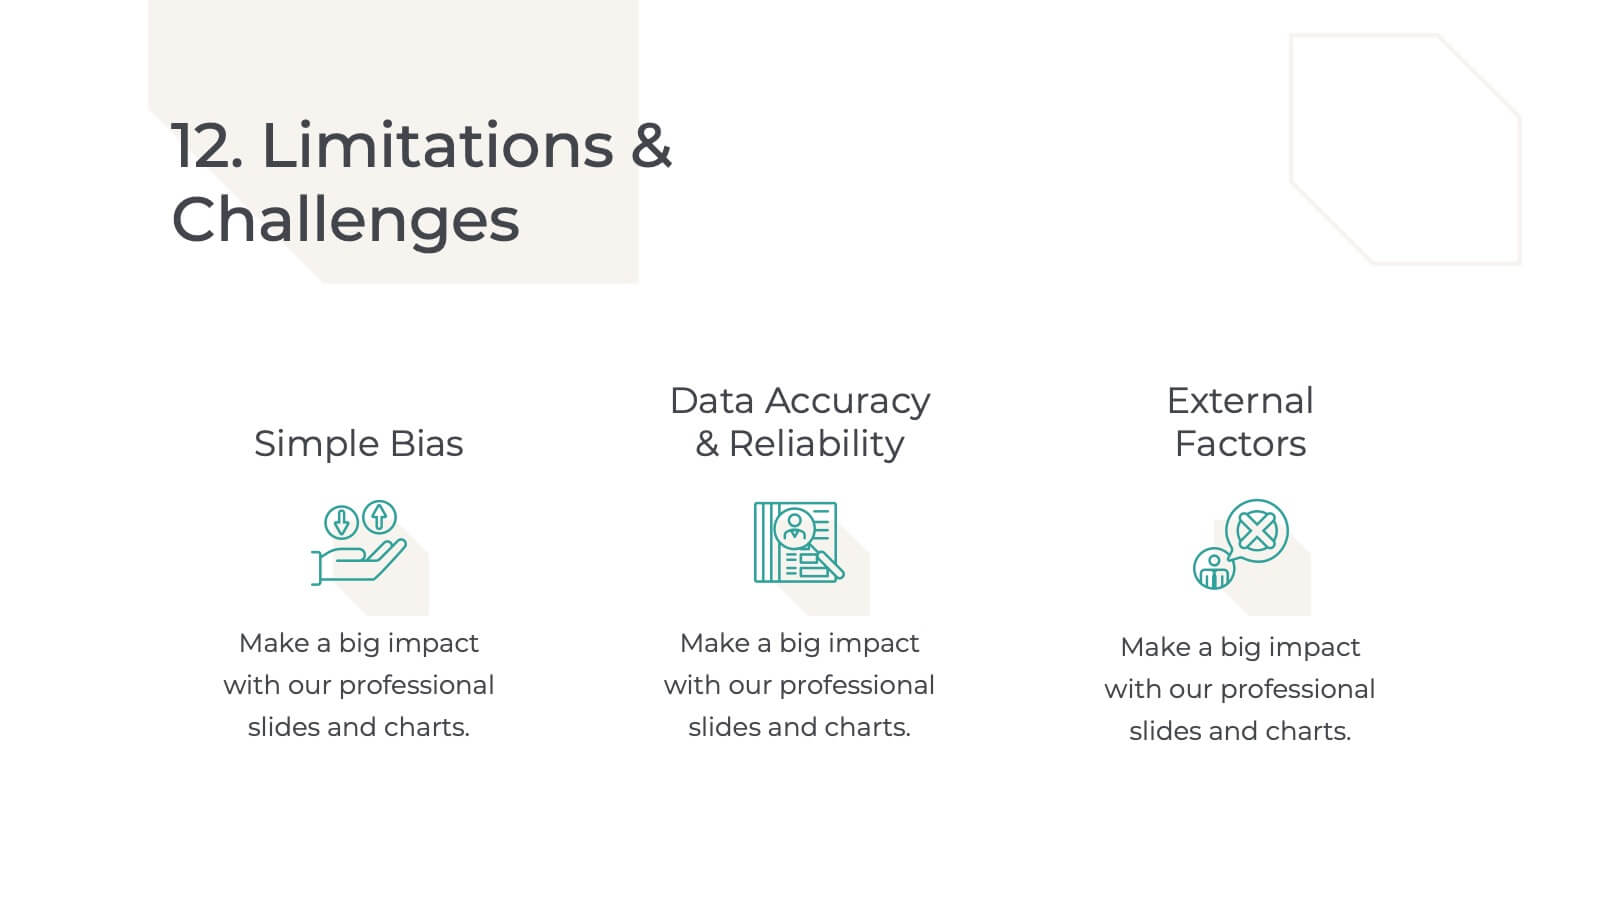
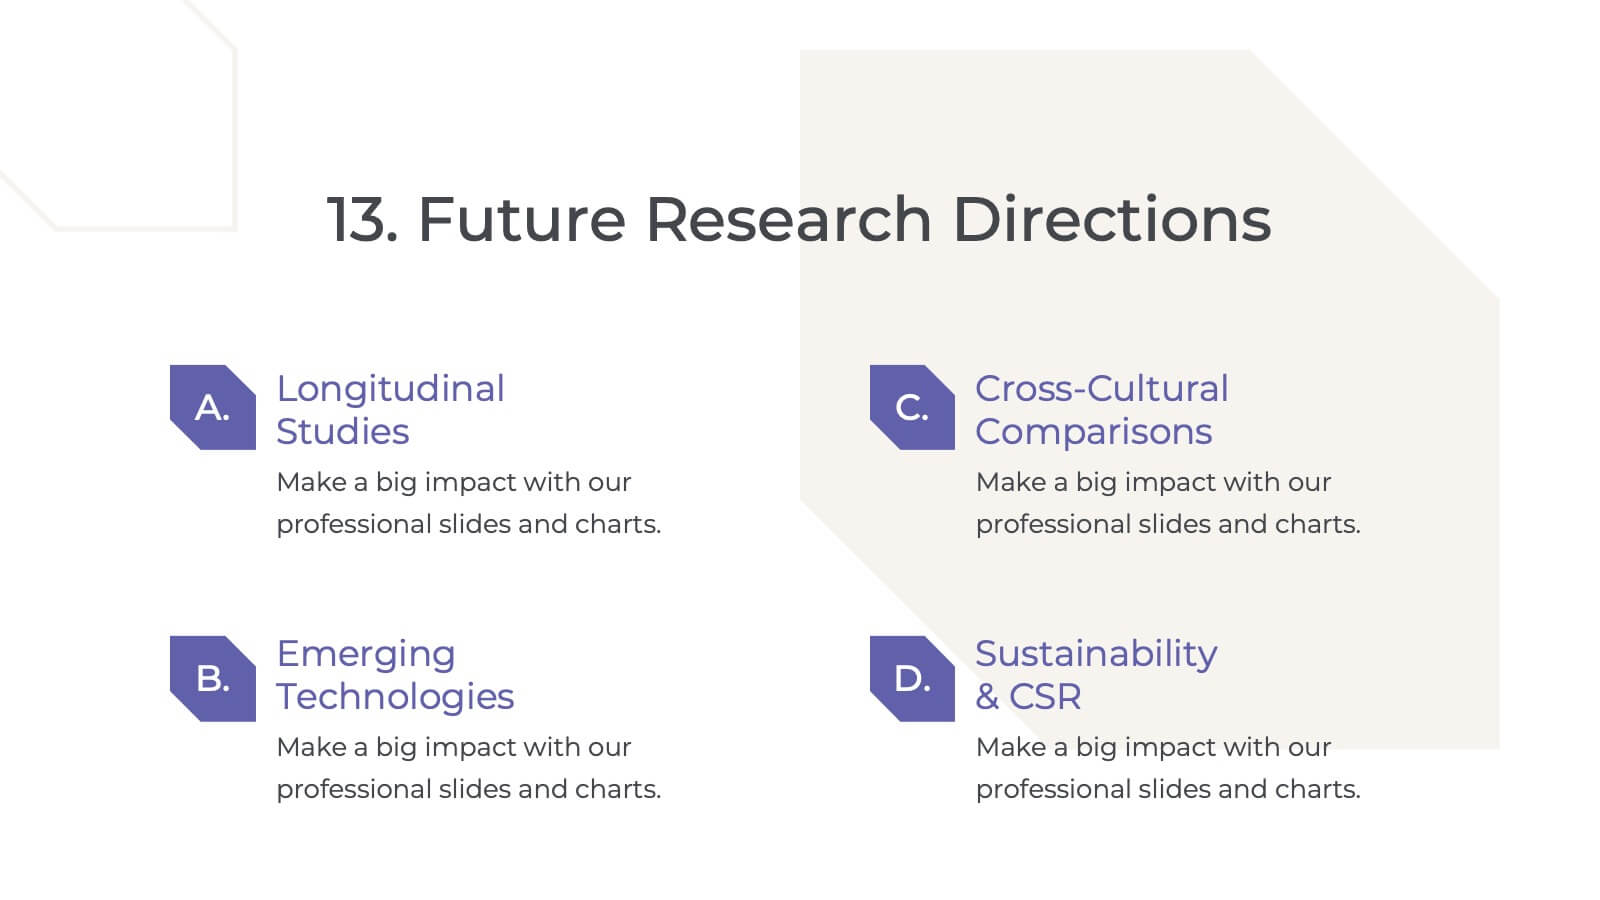
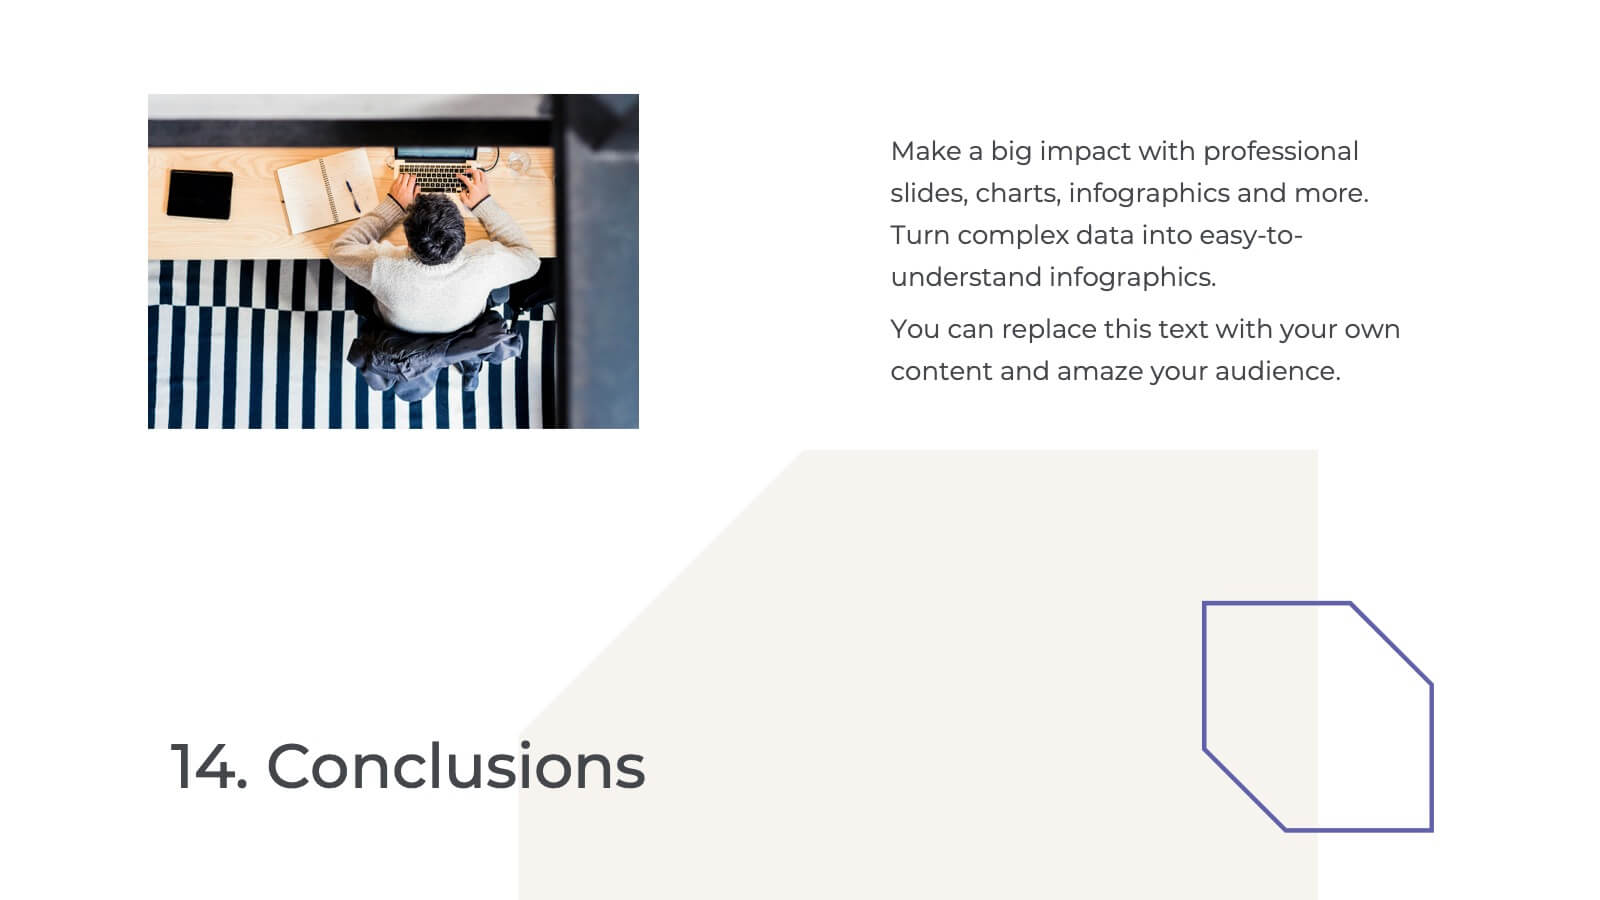
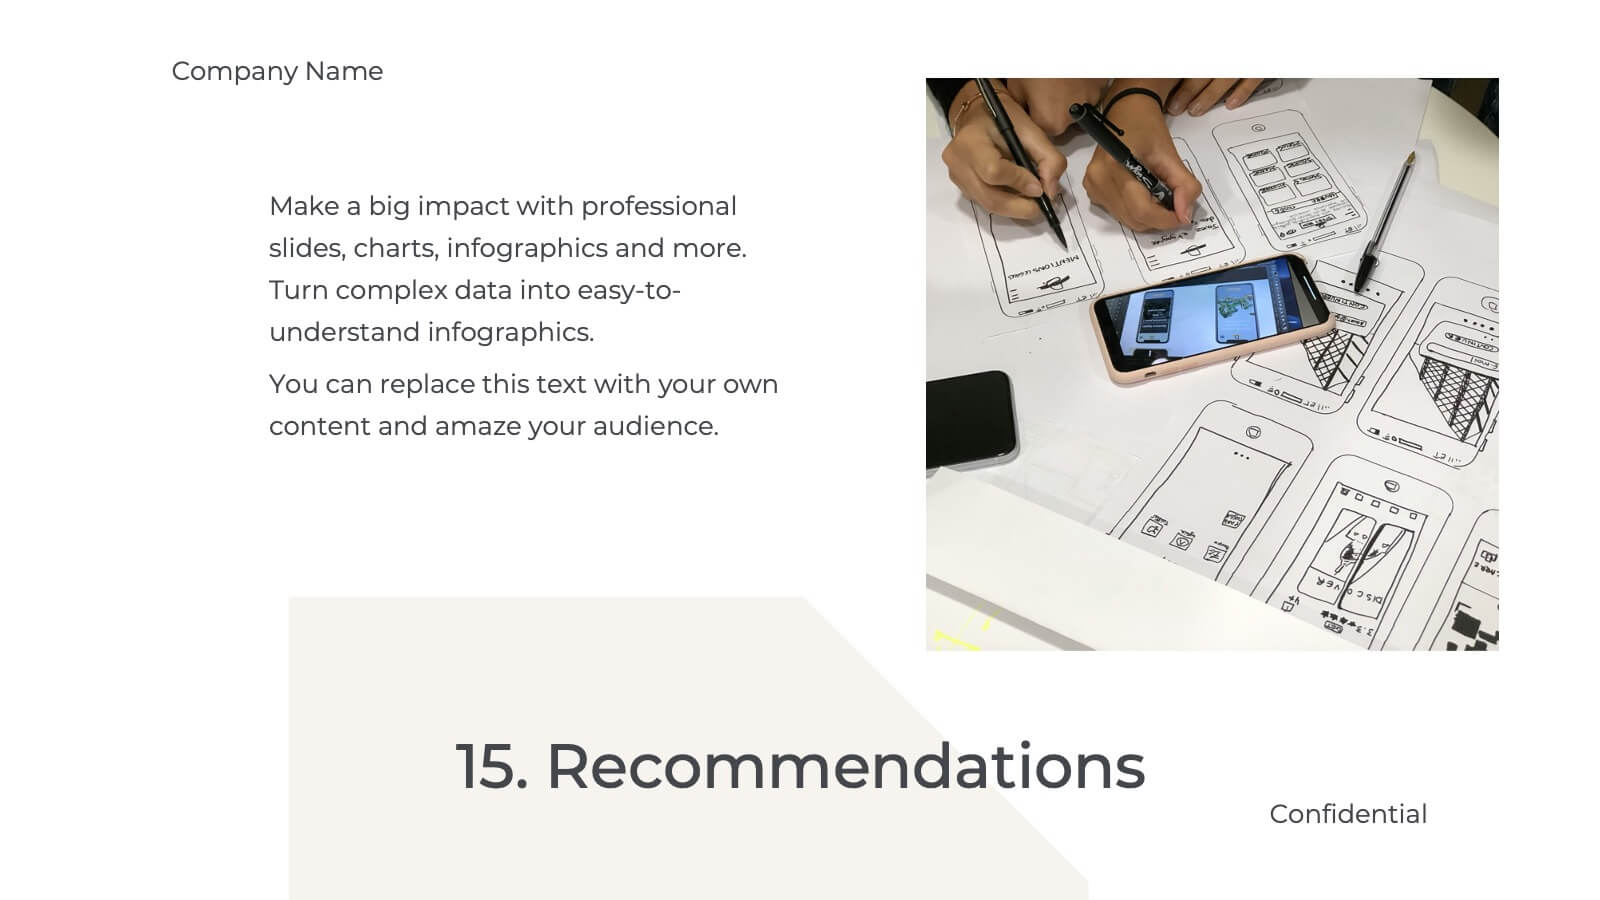
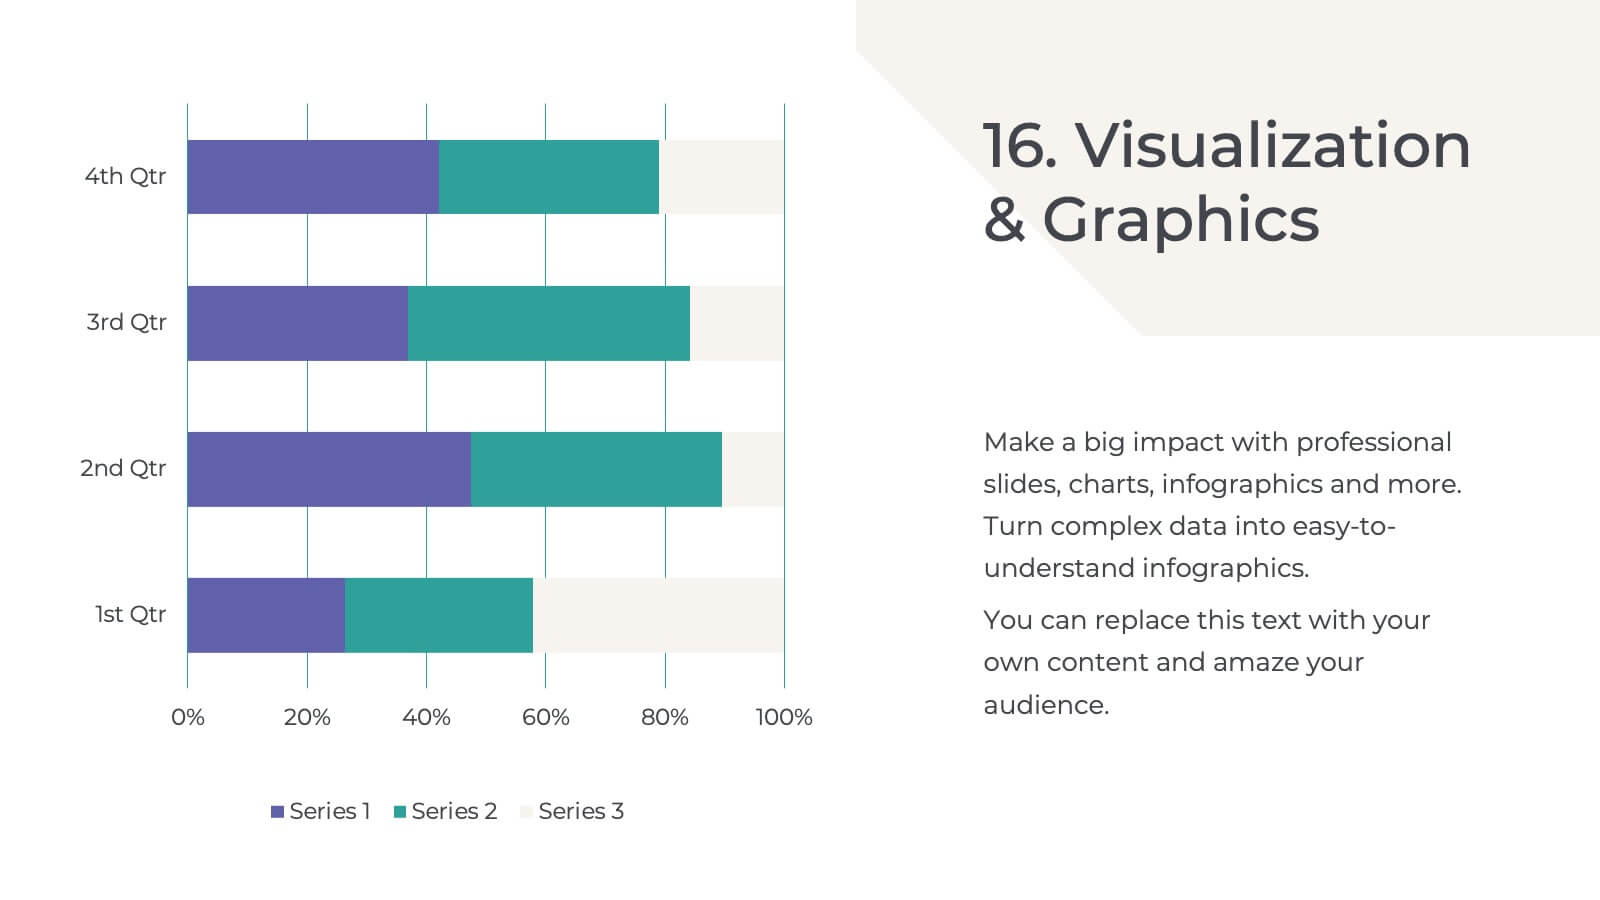
Palladium Qualitative Research Findings Presentation
Present your qualitative research findings effectively with this sleek, professional template. It includes sections for objectives, data analysis, key findings, and recommendations. Ideal for organizing research insights clearly, it's customizable and compatible with PowerPoint, Keynote, and Google Slides, ensuring smooth collaboration and impactful presentations for your audience.