


Características


¿Tienes alguna pregunta?
Recomendar


4 diapositivas
Organic Farming Overview Presentation
Present your sustainable agriculture strategies with this organic farming overview template, featuring vibrant icons and clean layouts. Perfect for eco-friendly initiatives, farm project plans, and environmental reports. Fully editable in Canva, PowerPoint, and Google Slides, allowing you to adjust colors, icons, and text to align with your branding and goals.


20 diapositivas
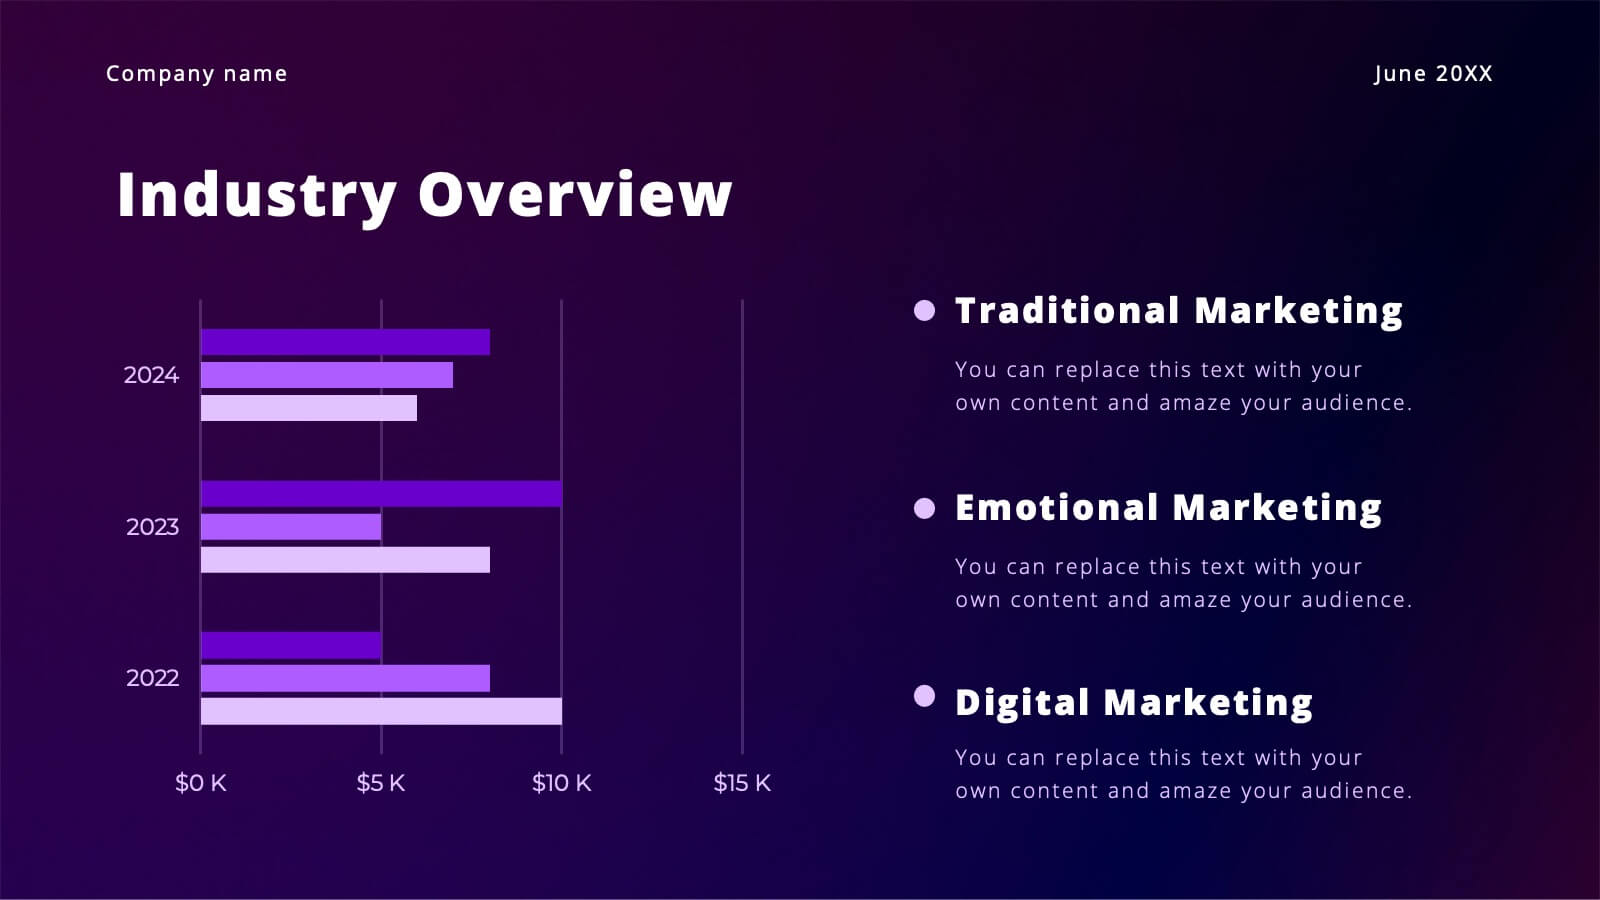
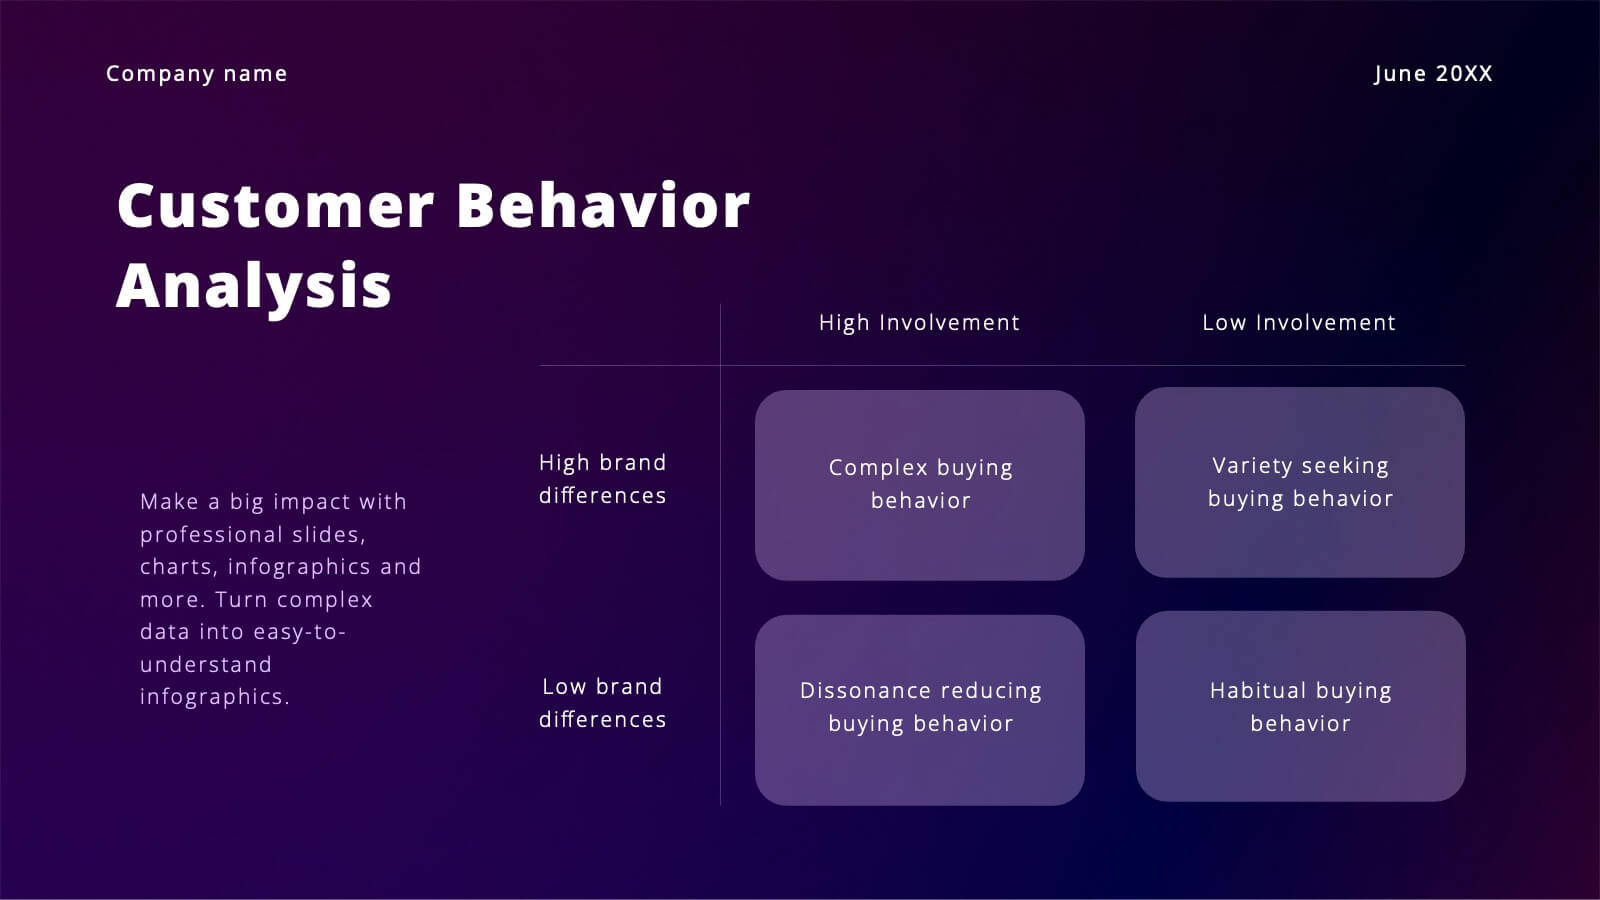
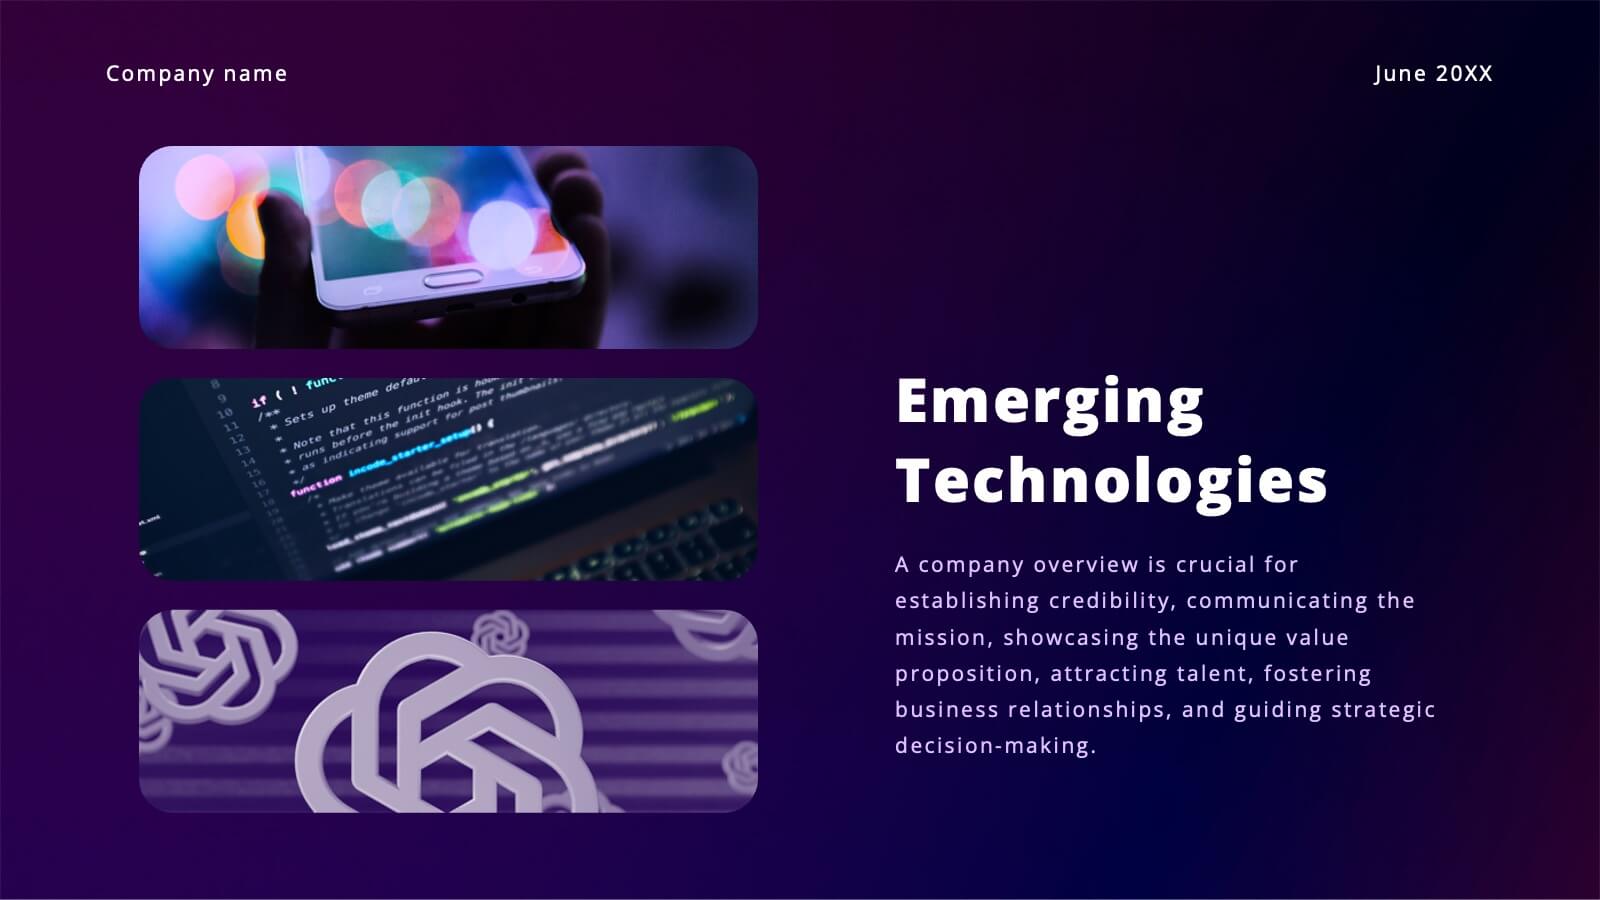
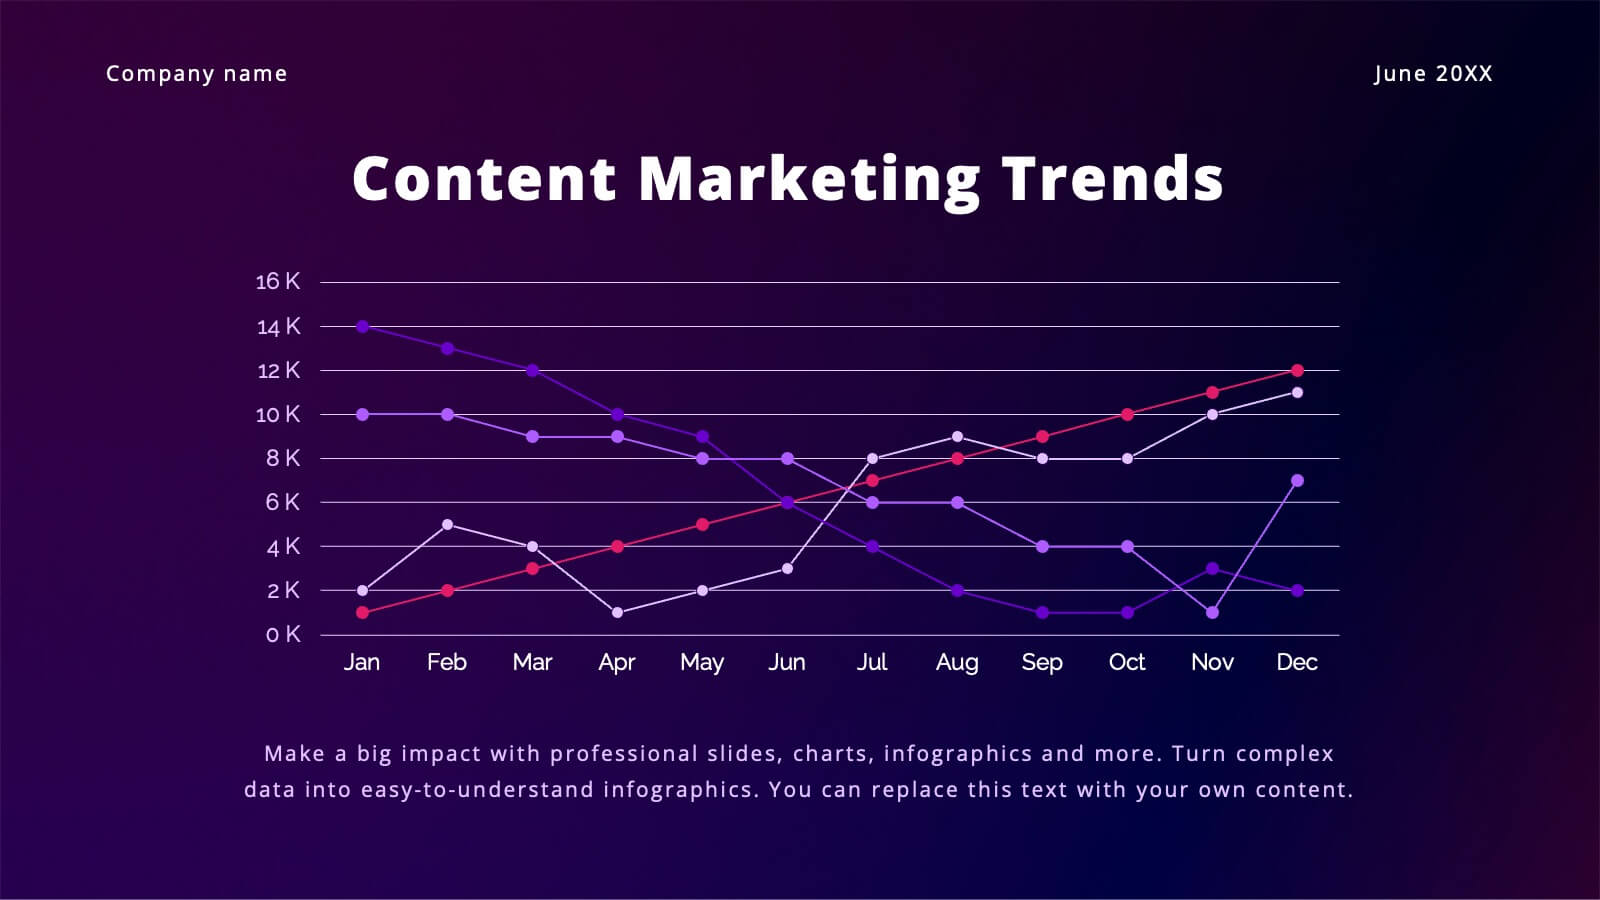
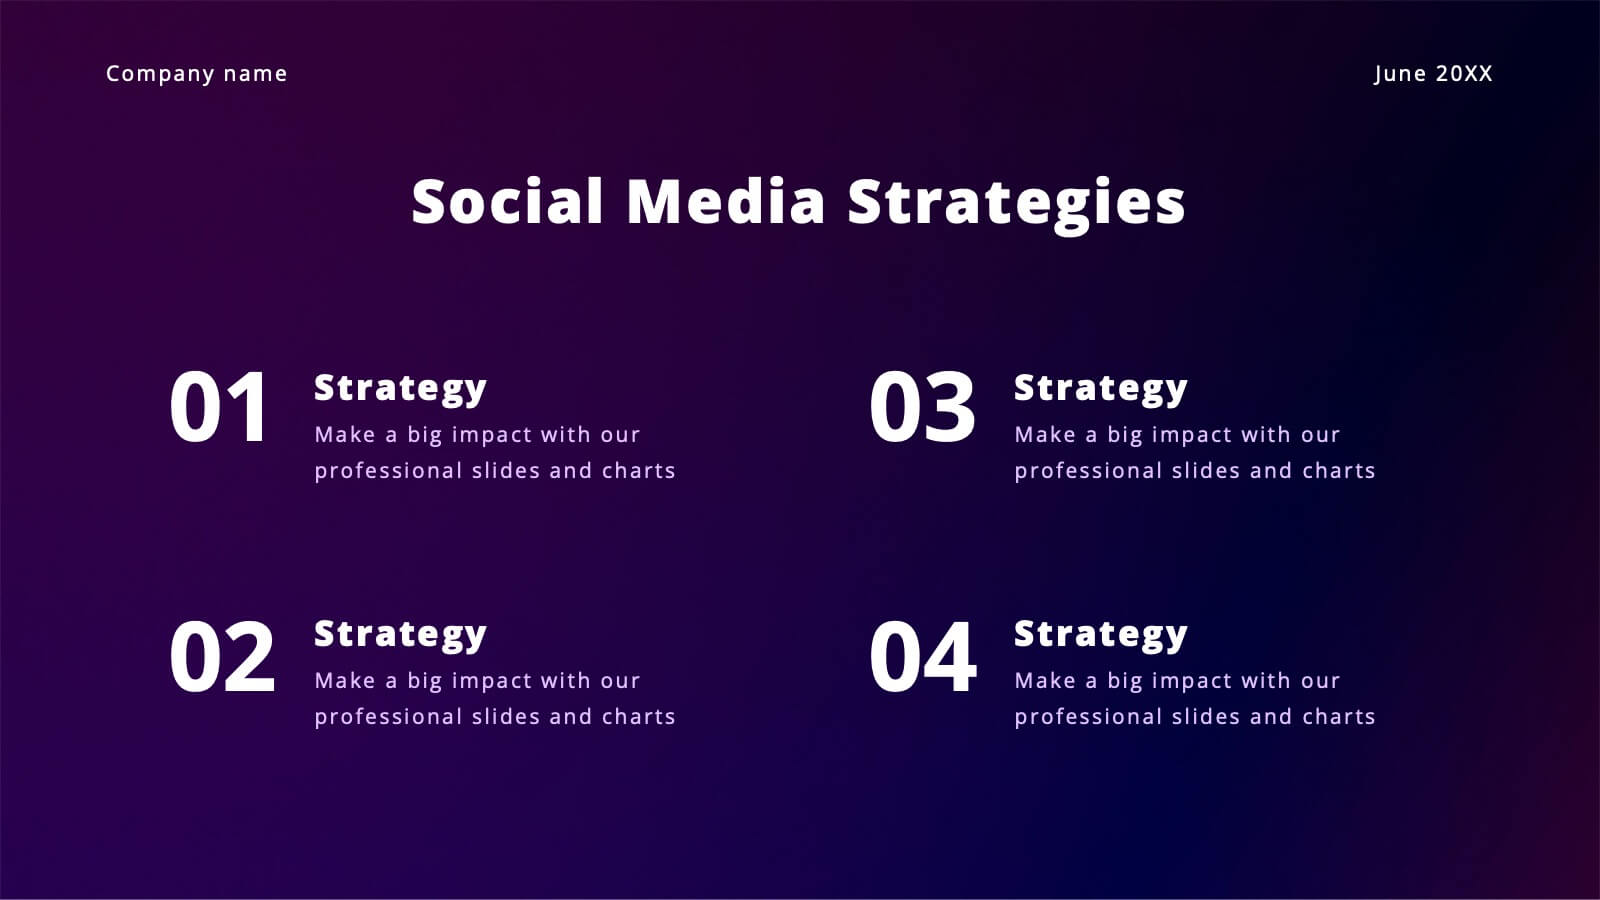
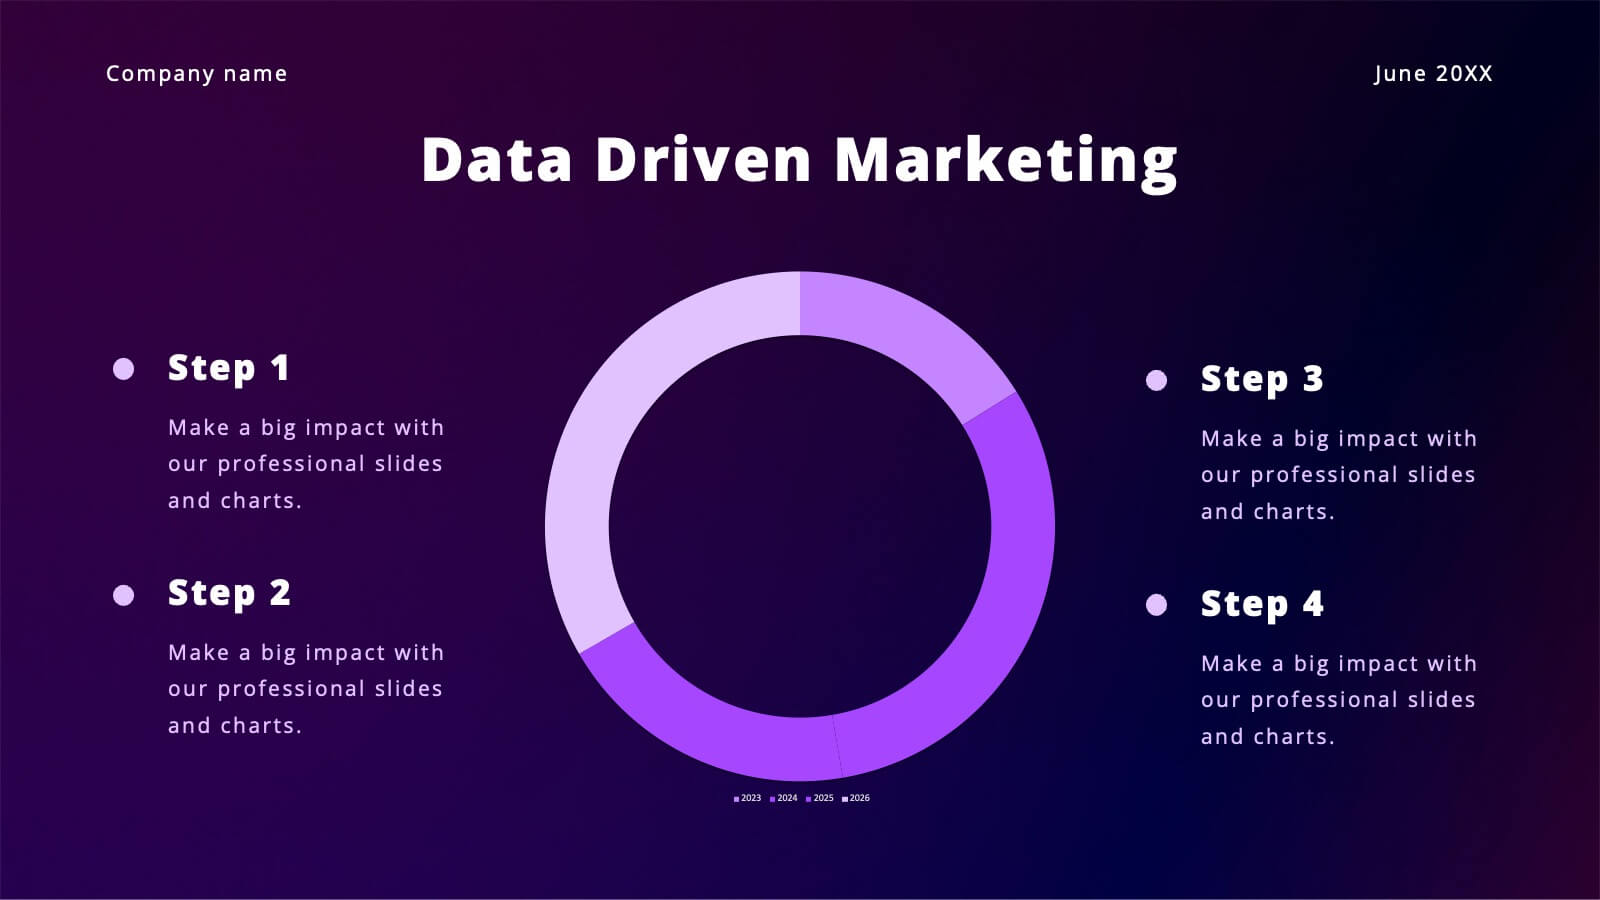
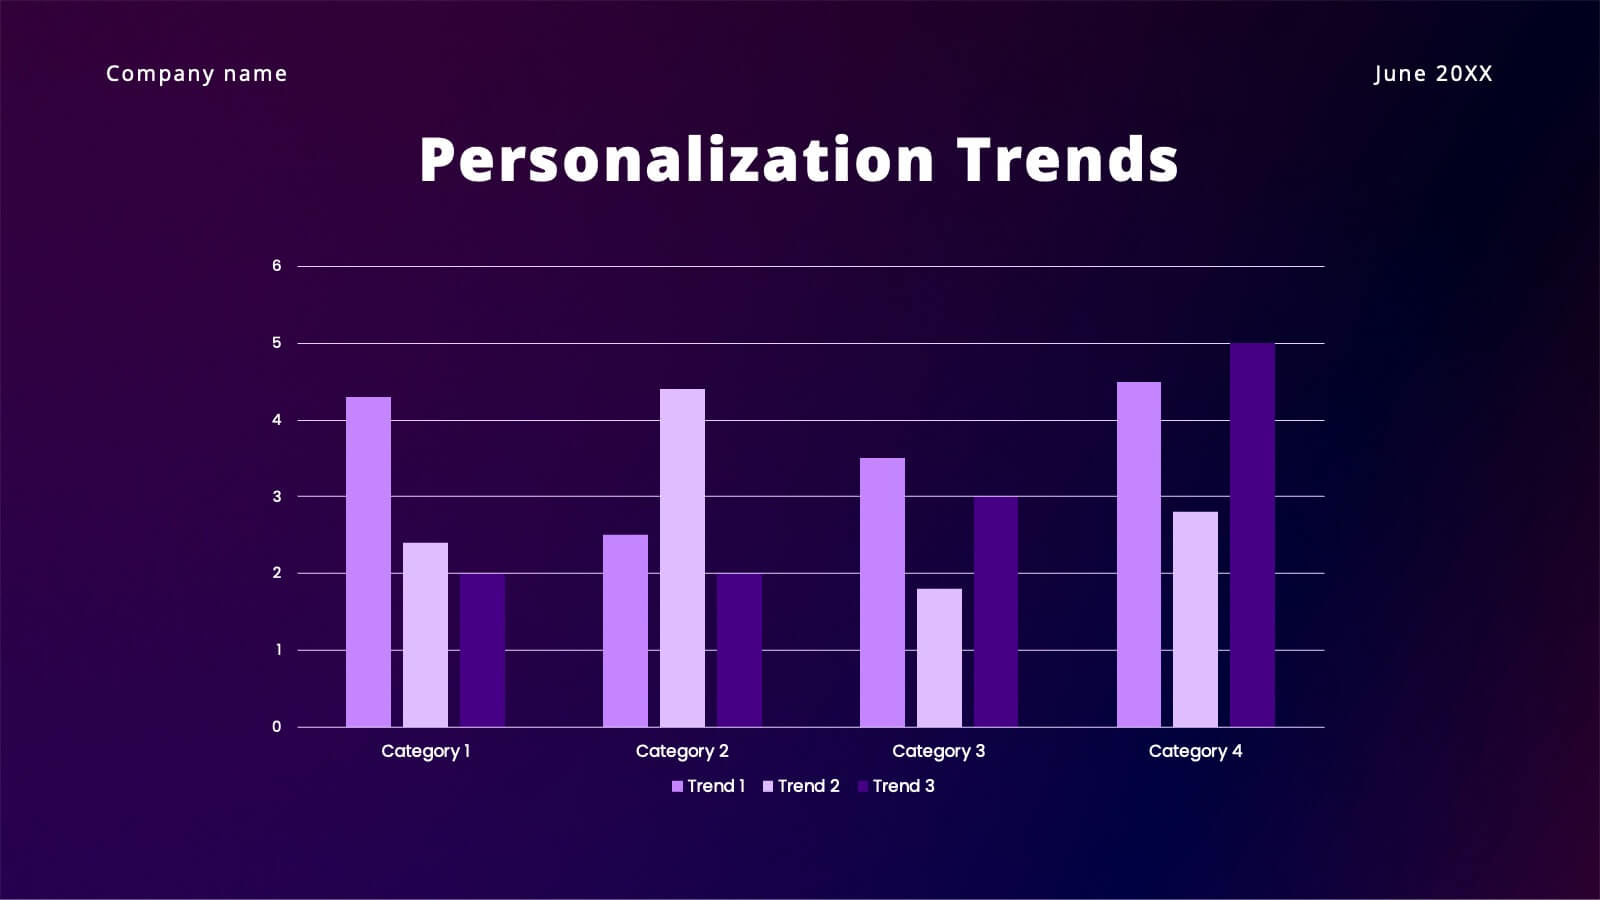
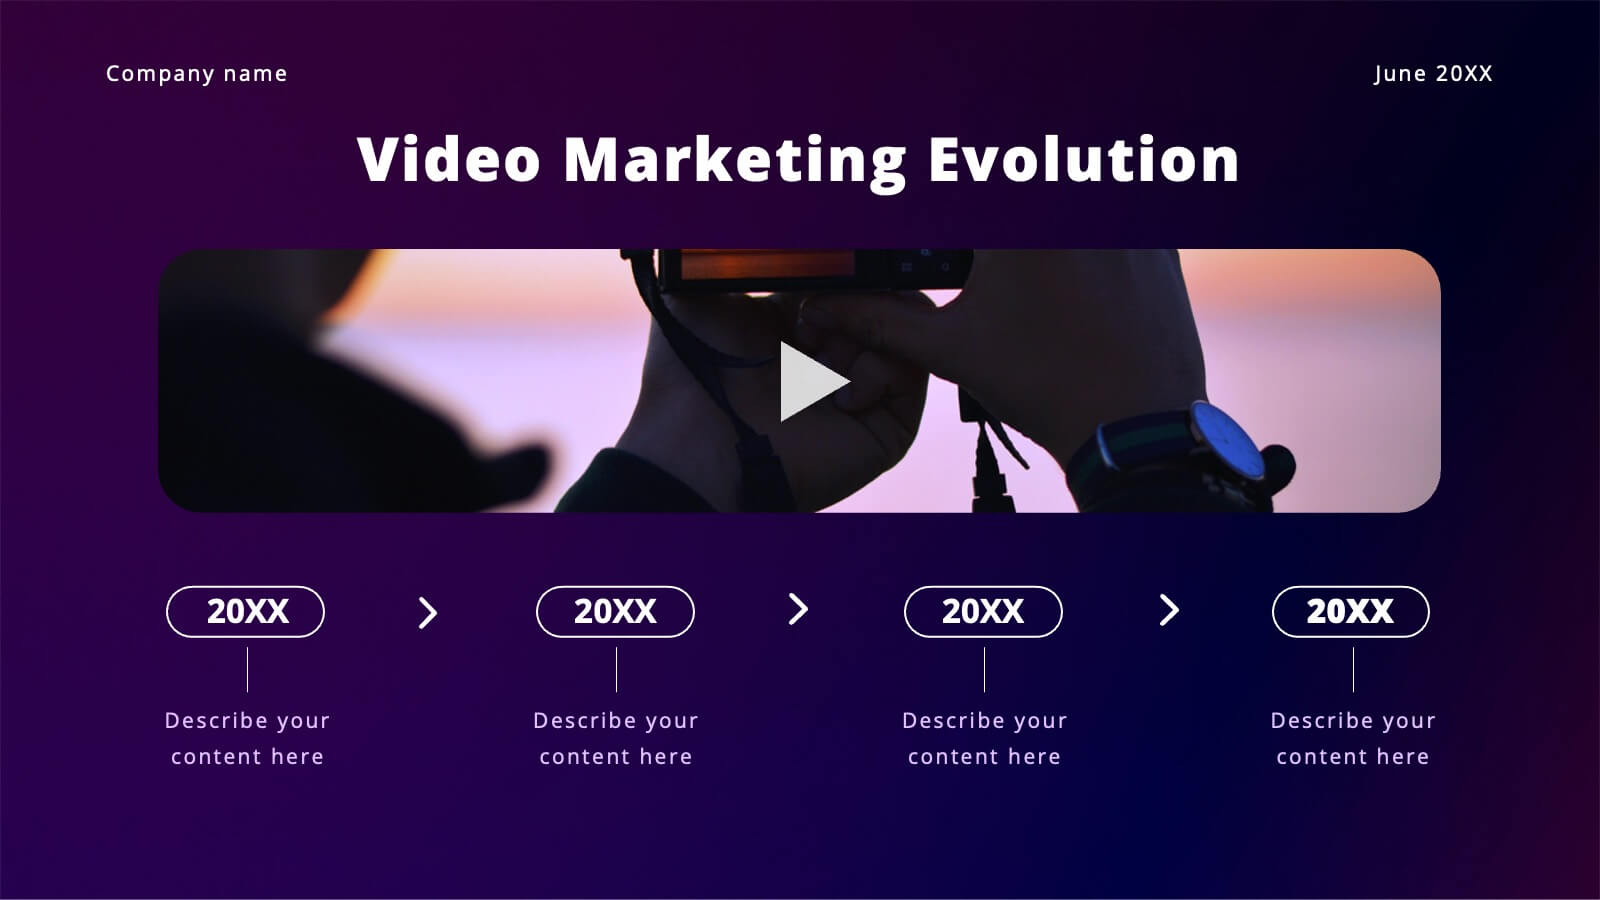
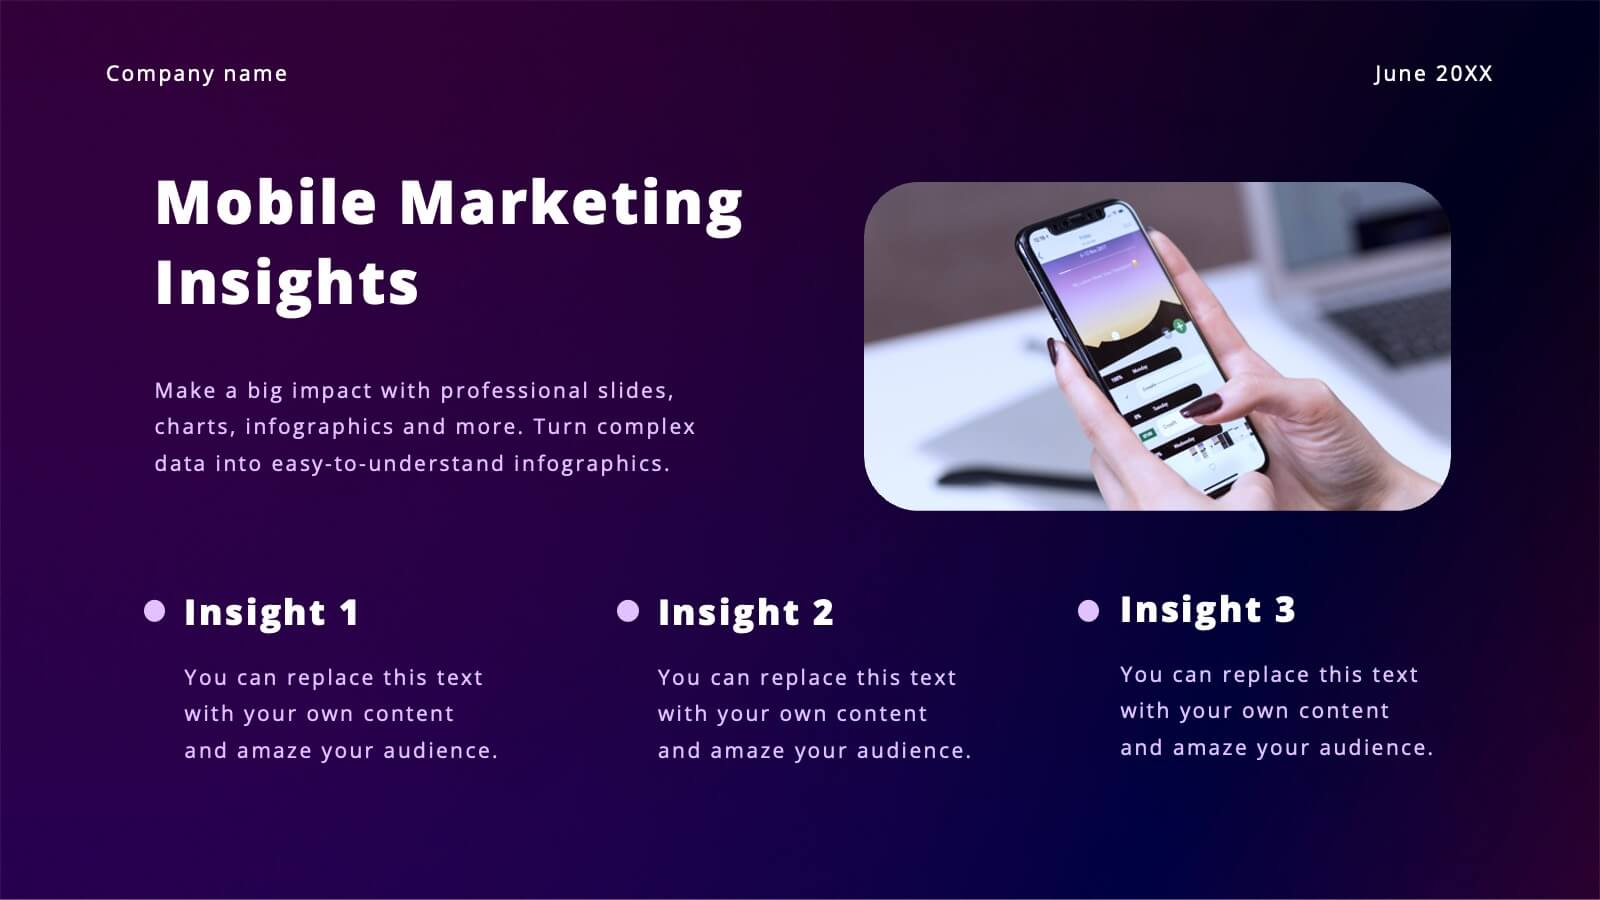
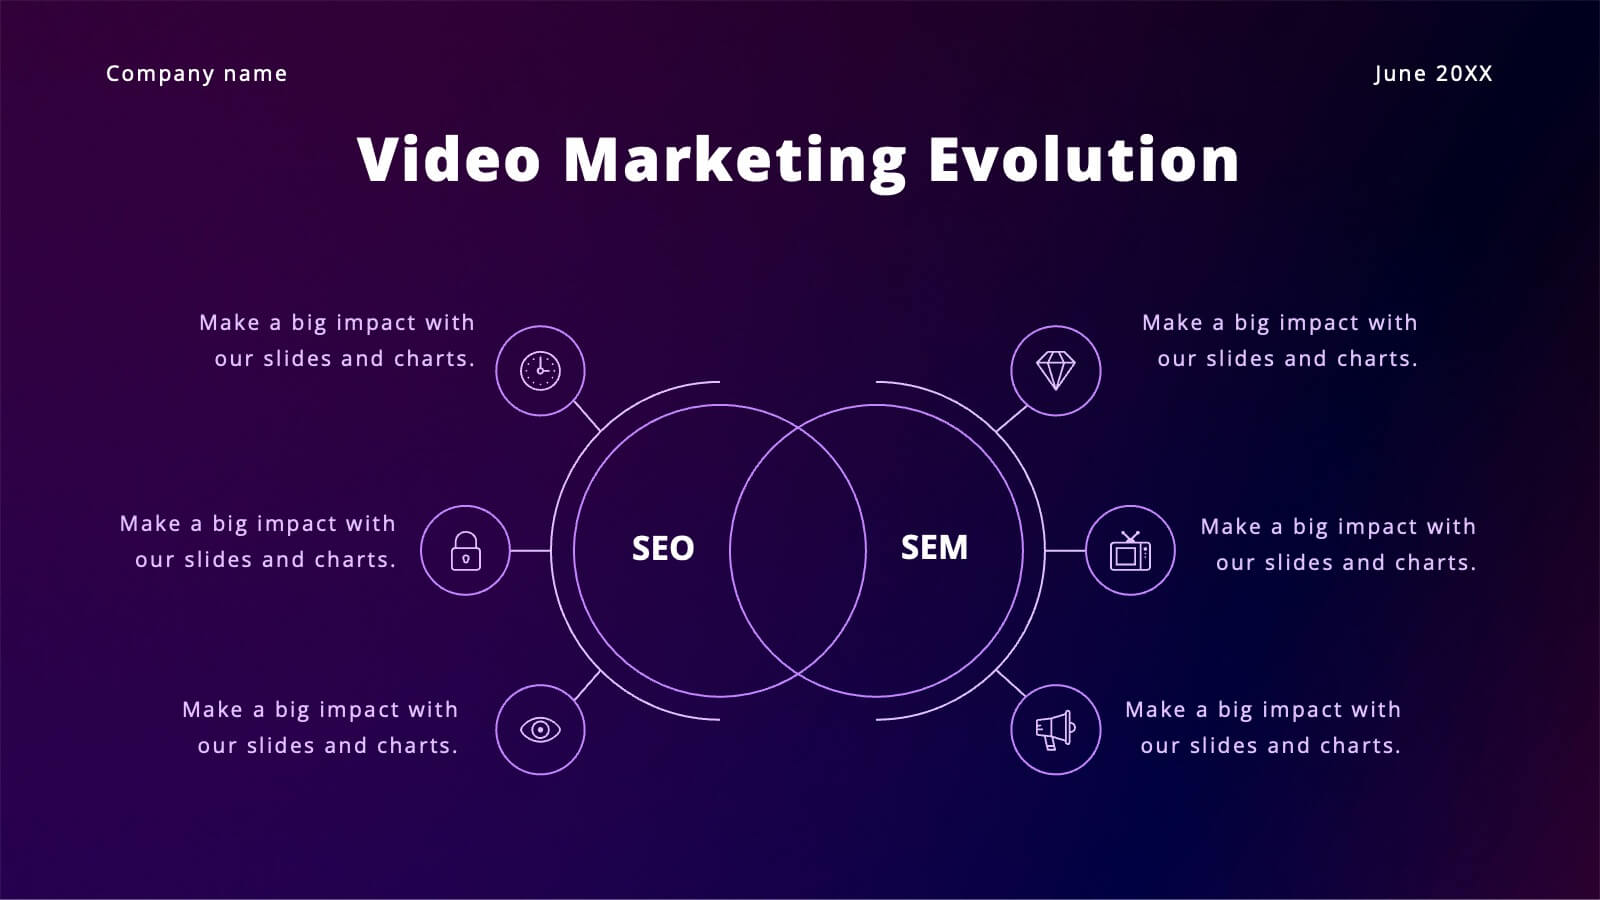
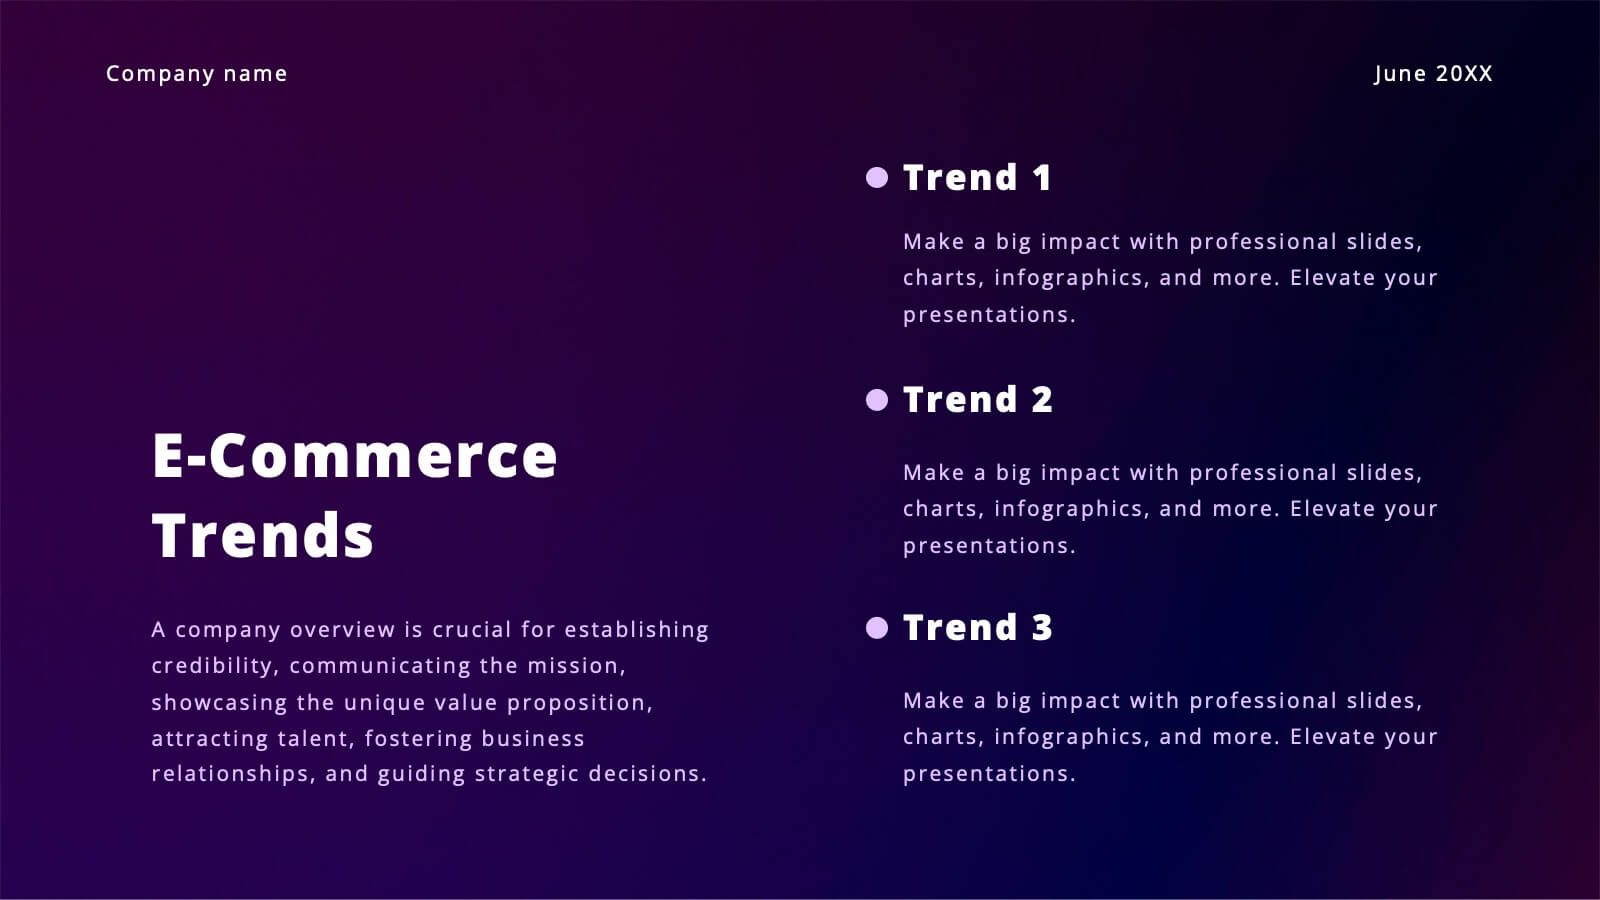
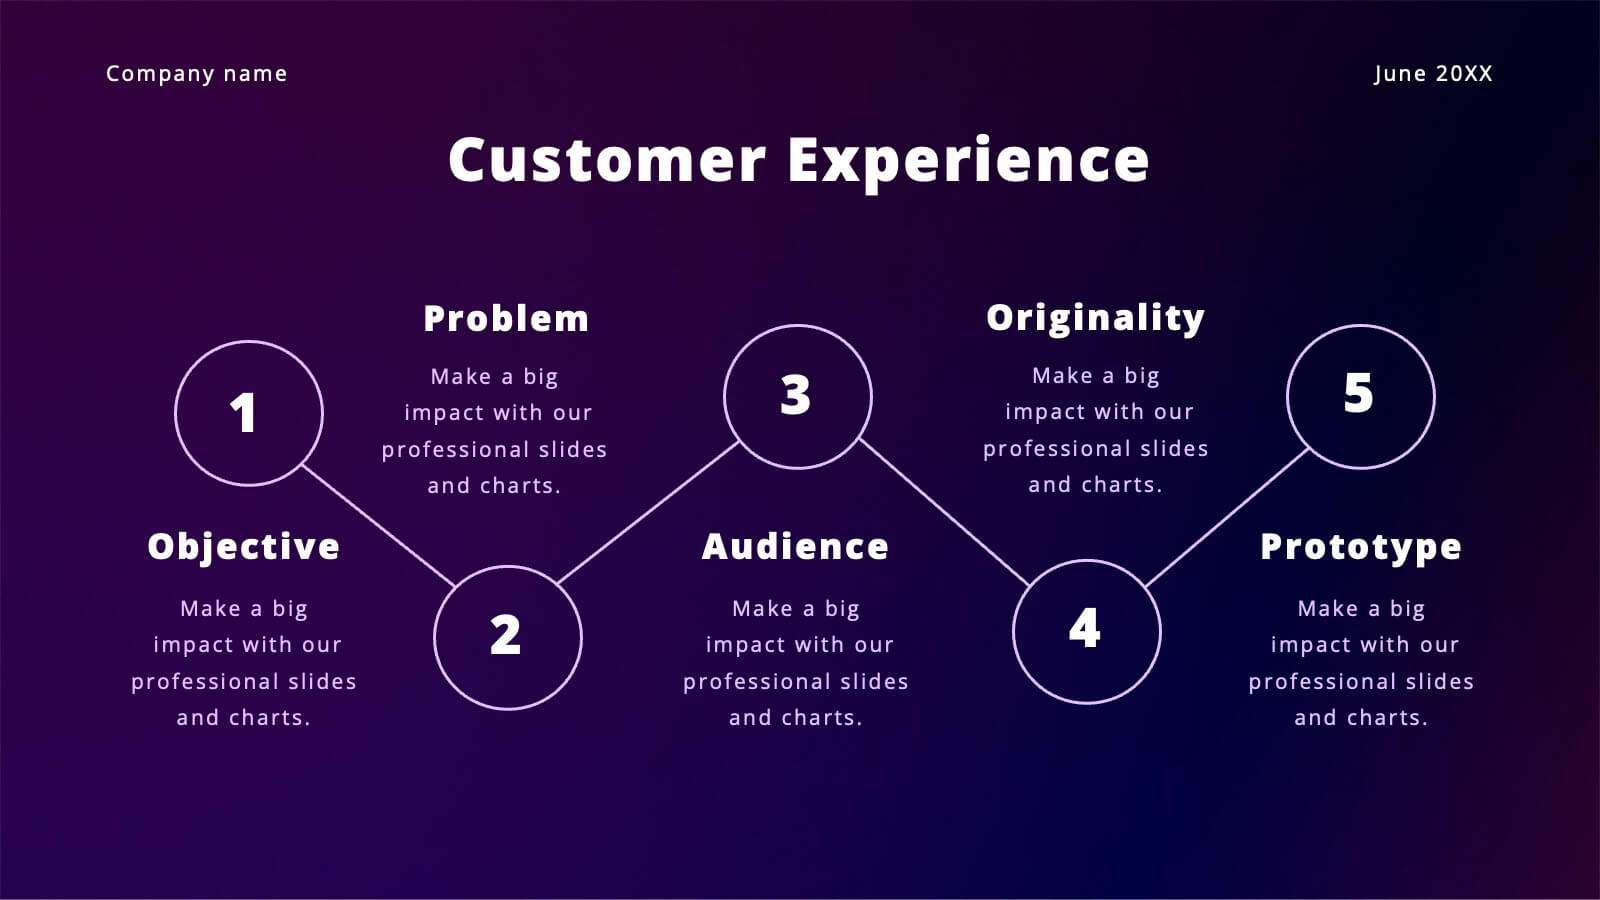
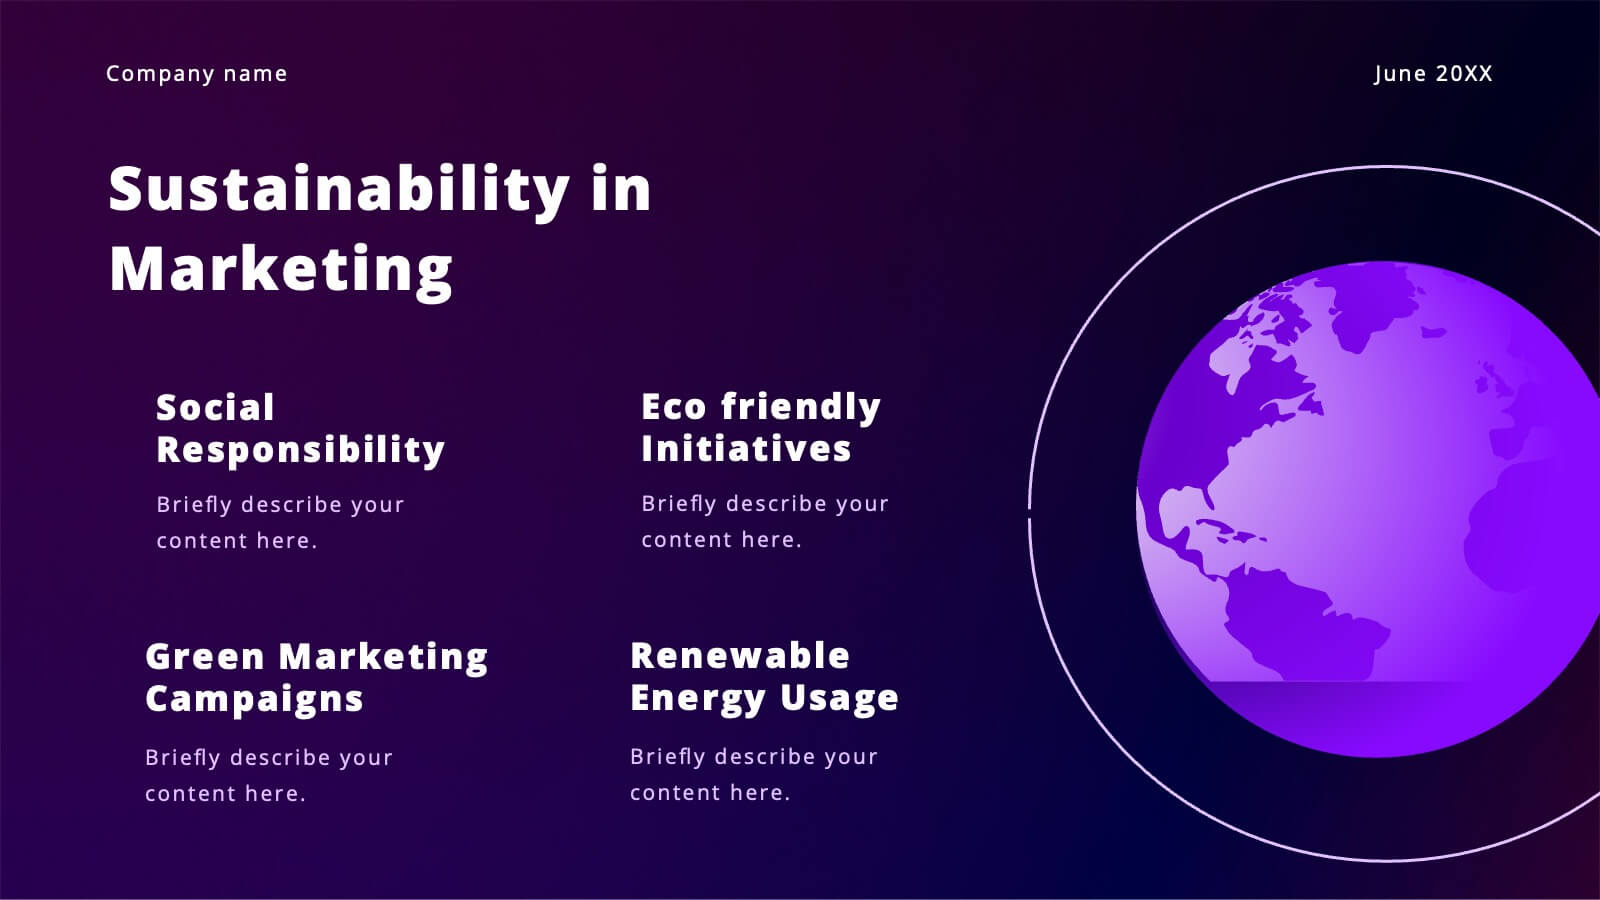
Vibrant Content Marketing Pitch Deck Presentation
Boost your marketing pitch with this vibrant deck! Covering industry overviews, customer behavior analysis, and emerging technologies, it’s designed to captivate your audience. Highlight social media strategies, data-driven marketing, and e-commerce trends effortlessly. Perfect for presenting a comprehensive marketing plan. Compatible with PowerPoint, Keynote, and Google Slides. Make your next pitch stand out!


6 diapositivas
Decision-Making Using Tree Diagrams Presentation
Clarify complex decisions with the Decision-Making Using Tree Diagrams Presentation. This slide design features a clear, hierarchical structure that helps visualize choices, outcomes, and decision paths step by step. Perfect for business strategy, risk analysis, or logic-based planning. Fully editable in PowerPoint, Keynote, and Google Slides.


4 diapositivas
Goal-Oriented 30 60 90 Plan Outline Presentation
Make your first impression unforgettable with this bold, easy-to-follow layout that breaks down goals into manageable steps. A 30-60-90 plan helps teams and new hires align on expectations, outcomes, and milestones. Perfect for onboarding or strategic planning. Fully editable in PowerPoint, Keynote, and Google Slides for maximum compatibility.


7 diapositivas
Big Data Infographic Presentation Template
This Big Data Infographic template is the perfect tool for any business presentation. This template has been designed to help you create truly engaging data-driven visuals, with powerful typography and interesting details that help draw in your audience. Introduce your business to the world with this big data infographic template. It's just what you need to describe the role of big data in the evolution of modern businesses. Our Big Data Infographic Presentation features all the tools for you to create wonderful charts, graphs, transitions and striking shapes both for your text and images.


7 diapositivas
Brain Planning Infographic Presentation
Looking for a modern and personable brain Infographic? This template is the perfect choice! It contains all the elements you need to make a successful and engaging infographic. This template is perfect for brainstorming, business marketing, academic projects and personal infographics. You can use this template to help you plan, refine and present a successful pitch. From project to execution and profit this brain infographic breaks down the process into smaller, more manageable steps. Impress your audience with your facts and figures using this unique, colorful infographic!


5 diapositivas
Medical Supplies Infographics
Medical supplies refer to the various equipment, instruments, tools, and consumables that are used in healthcare settings to diagnose, treat, and manage medical conditions. These vertical infographics provide an overview of essential medical supplies used in healthcare settings. They aims to educate and raise awareness about the importance of medical supplies in delivering quality patient care and maintaining a safe healthcare environment. The infographics utilize visually appealing graphics, icons, and color schemes that are relevant to the medical field. These visuals help viewers easily recognize and understand the different types of supplies.


10 diapositivas
Agile Project Status Review Presentation
Streamline your Agile methodologies with our "Agile Project Status Review" presentation templates. Designed to enhance visual communication, these templates help you effectively display project phases from start to finish. Ideal for dynamic project management, they are compatible with PowerPoint, Keynote, and Google Slides, ensuring seamless integration into your workflow.


4 diapositivas
Iceberg Metaphor Diagram Presentation
Make your message feel deeper and more intriguing with a visual that instantly shows there’s more beneath the surface. This presentation helps you highlight hidden factors, core insights, and layered data using a clear, structured iceberg illustration. Ideal for strategy, analysis, and storytelling. Fully compatible with PowerPoint, Keynote, and Google Slides.


26 diapositivas
Understanding the Stock Market Presentation
Step into the exciting world of finance with our dynamic and sleek presentation template, perfect for understanding the stock market! This comprehensive guide simplifies complex financial concepts, making it an ideal resource for beginners, students, and professionals. Featuring a sophisticated collection of slides, this template covers key topics such as market trends, investment strategies, and financial analysis. The design integrates bold colors, sharp graphics, and well-organized layouts to keep your audience engaged and informed. Infographics and charts break down intricate data, while mockups offer realistic previews of stock market tools. Fully customizable and versatile, this template can be adapted to suit various presentation needs and styles. It is compatible with PowerPoint, Keynote, and Google Slides, ensuring smooth and professional presentations across different platforms. Perfect for financial workshops, educational seminars, or anyone looking to deepen their understanding of the stock market.


7 diapositivas
Brainstorm Bubble Map Infographic
A brainstorm bubble map is a visual representation used to generate and organize ideas, concepts, or information around a central theme or topic. This infographic template is designed to be a versatile tool commonly utilized in brainstorming sessions, planning, problem-solving, or organizing thoughts. Compatible with Powerpoint, Keynote, and Google Slides. Fully customizable, visualize a multitude of colorful bubbles branching out from the central theme, each encapsulating a unique idea or concept. The vibrant and lively color palette adds an element of fun, reflecting the joy that comes from a successful brainstorming session.


6 diapositivas
Digital Marketing Strategy and Trends Presentation
The "Digital Marketing Strategy and Trends" template is designed to help marketers visualize and present their strategies and market trends effectively. It facilitates clear mapping of key steps in digital marketing campaigns, making it easier to convey complex strategies in a digestible format. This template is compatible with PowerPoint, Keynote, and Google Slides, ensuring it can be utilized across various platforms for diverse audiences.


10 diapositivas
Key Takeaways List Presentation
Streamline your key points with our "Key Takeaways List Presentation" template. This versatile infographic design offers a clear, structured format for enumerating crucial information across four distinct stages. Each stage is visually represented with vibrant, color-coded sections to ensure readability and impact. Whether you're summarizing a meeting, outlining project steps, or highlighting important data, this template provides a straightforward way to communicate your message effectively. Compatible with PowerPoint, Keynote, and Google Slides, it's ideal for professionals seeking to make their presentations more engaging and organized.


4 diapositivas
Task Automation Workflow Presentation
Streamline your operations with the Task Automation Workflow template, designed to visualize automated processes and optimize efficiency. Perfect for project managers and teams, this template helps clarify task dependencies, process flows, and automation impact. Fully customizable and compatible with PowerPoint, Keynote, and Google Slides for seamless workflow presentations.


21 diapositivas
Starchime UX Case Study Presentation
Showcase your UX design process with this case study template, covering research, user journey mapping, wireframes, and usability testing. Ideal for presenting design insights and outcomes. Compatible with PowerPoint, Keynote, and Google Slides, it’s perfect for a clear, professional, and impactful UX design presentation.


4 diapositivas
4-Quadrant RACI Chart Slide Presentation
Bring structure and clarity to your workflow with a bold, pyramid-style layout that makes responsibilities instantly understandable. This presentation helps teams outline who leads, supports, approves, and informs across key tasks, turning complex processes into a clean visual map. Fully editable and compatible with PowerPoint, Keynote, and Google Slides.


22 diapositivas
Crystal Business Plan Presentation
This business plan template is ideal for presenting strategies, conference overviews, and session details. With slides for keynote speakers, breakout sessions, and networking breaks, it offers a dynamic and professional layout. Compatible with PowerPoint, Keynote, and Google Slides, it ensures a clear and organized flow for any business presentation.