


Características


¿Tienes alguna pregunta?
Recomendar


7 diapositivas
Change Management Principles Infographic
Change is the only constant in the business realm, and mastering its management can be the linchpin to success. The change management principles infographic, in its harmonious palette of gray, blue, and red, provides a visually compelling overview of the key tenets governing successful change. Tailored for business leaders, project managers, HR professionals, and organizational consultants, this infographic streamlines complex ideas into easily digestible insights. Crafted to be fully compatible with PowerPoint, Keynote, and Google Slides, it serves as an invaluable tool to illuminate and drive conversations around change in any corporate presentation.


20 diapositivas
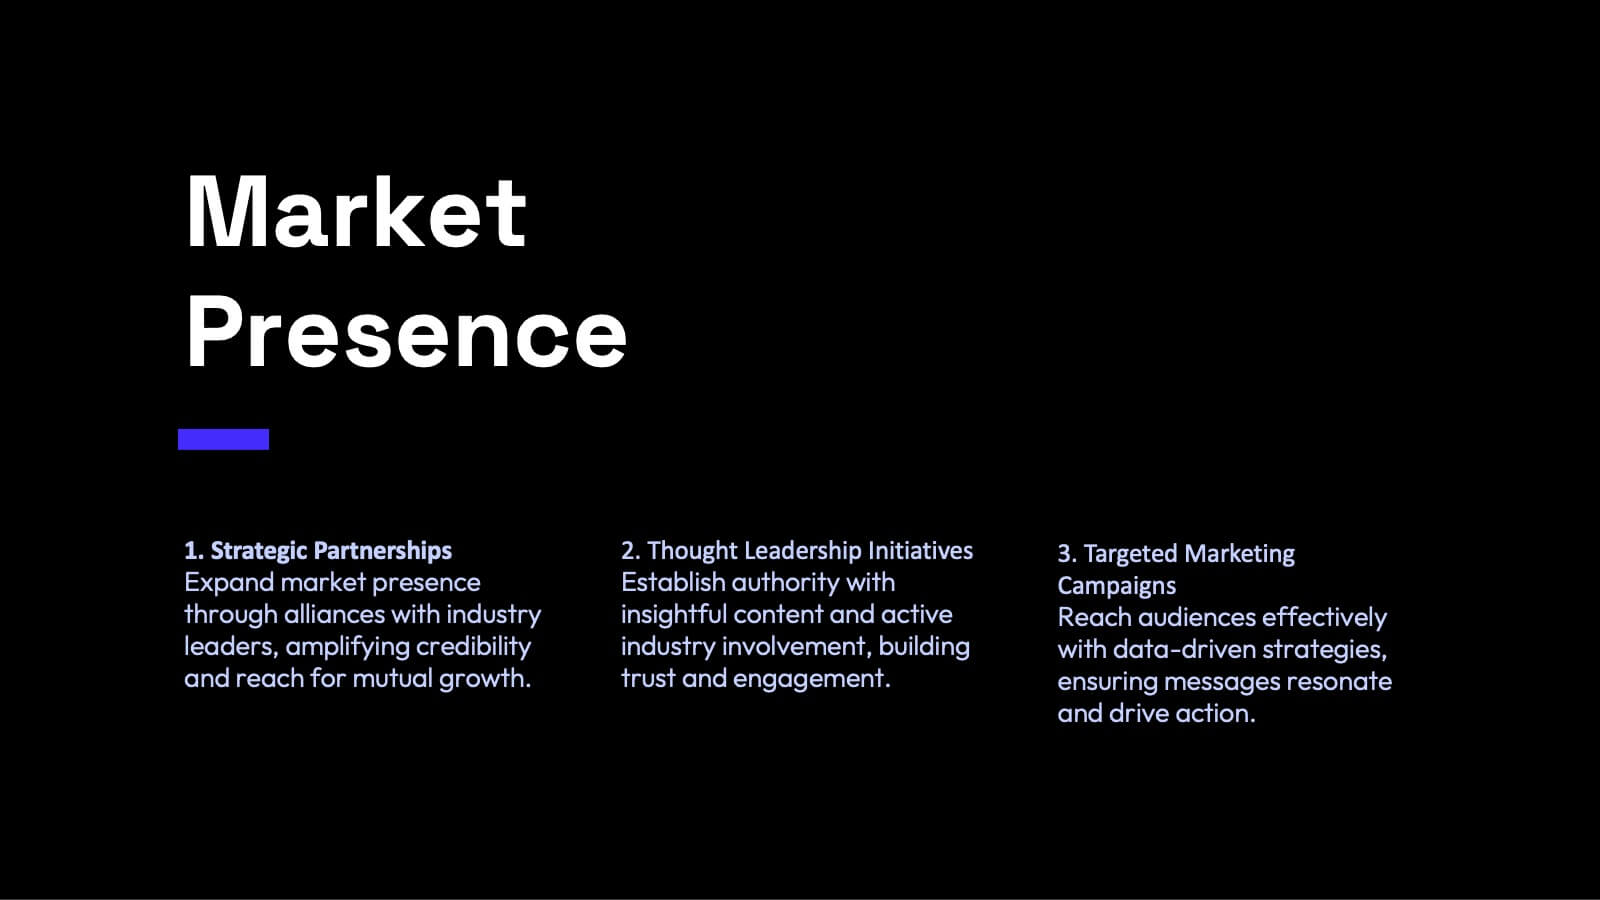
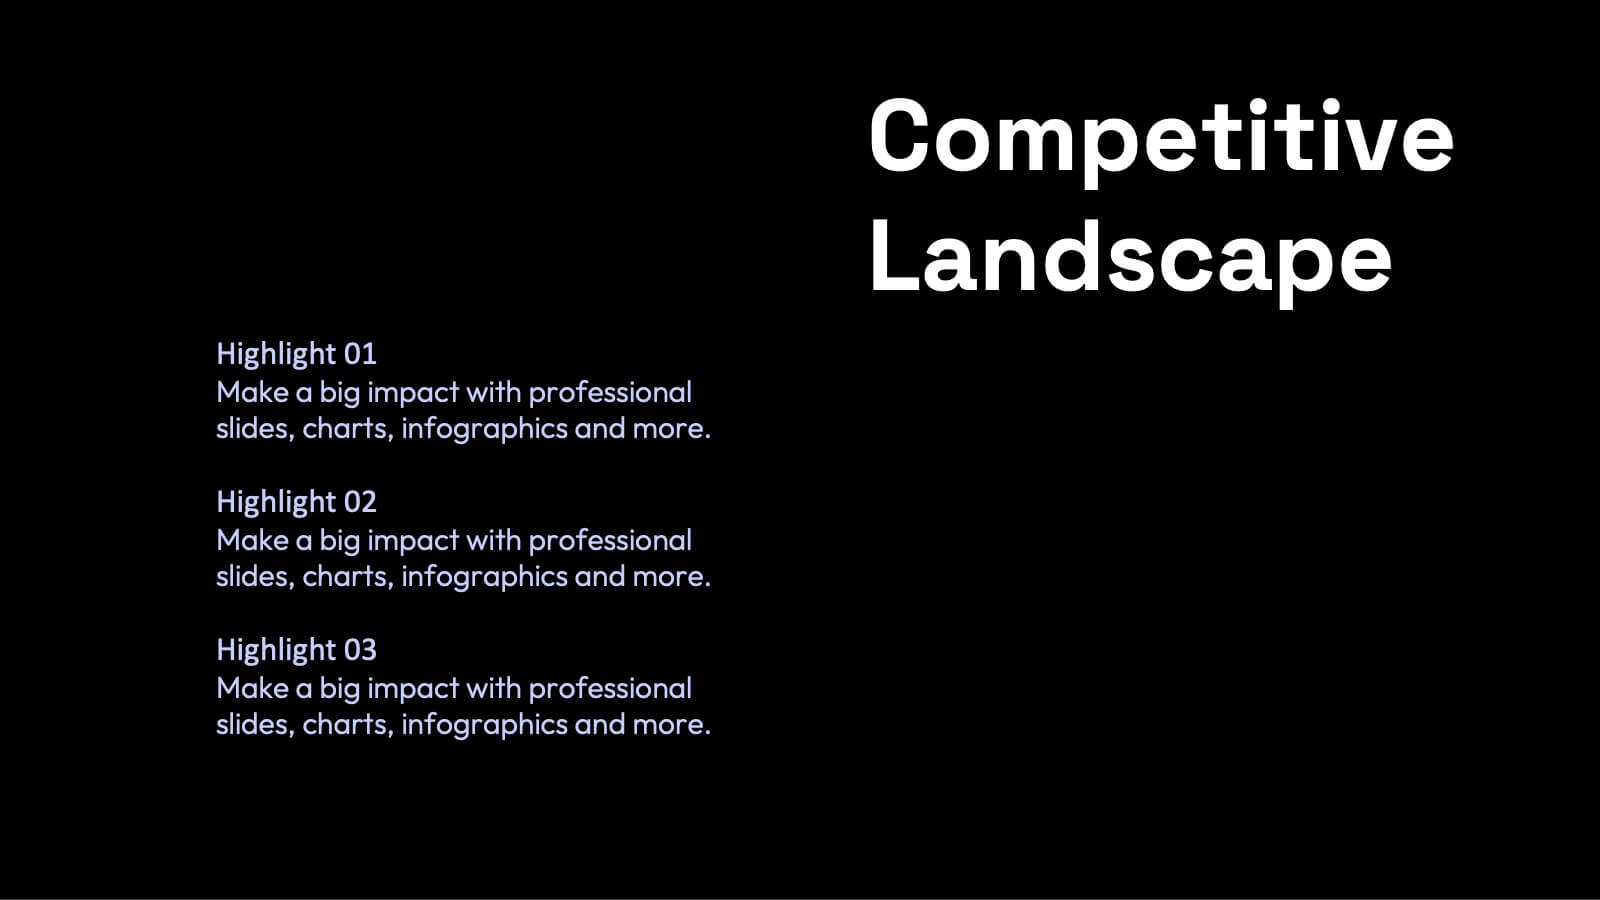
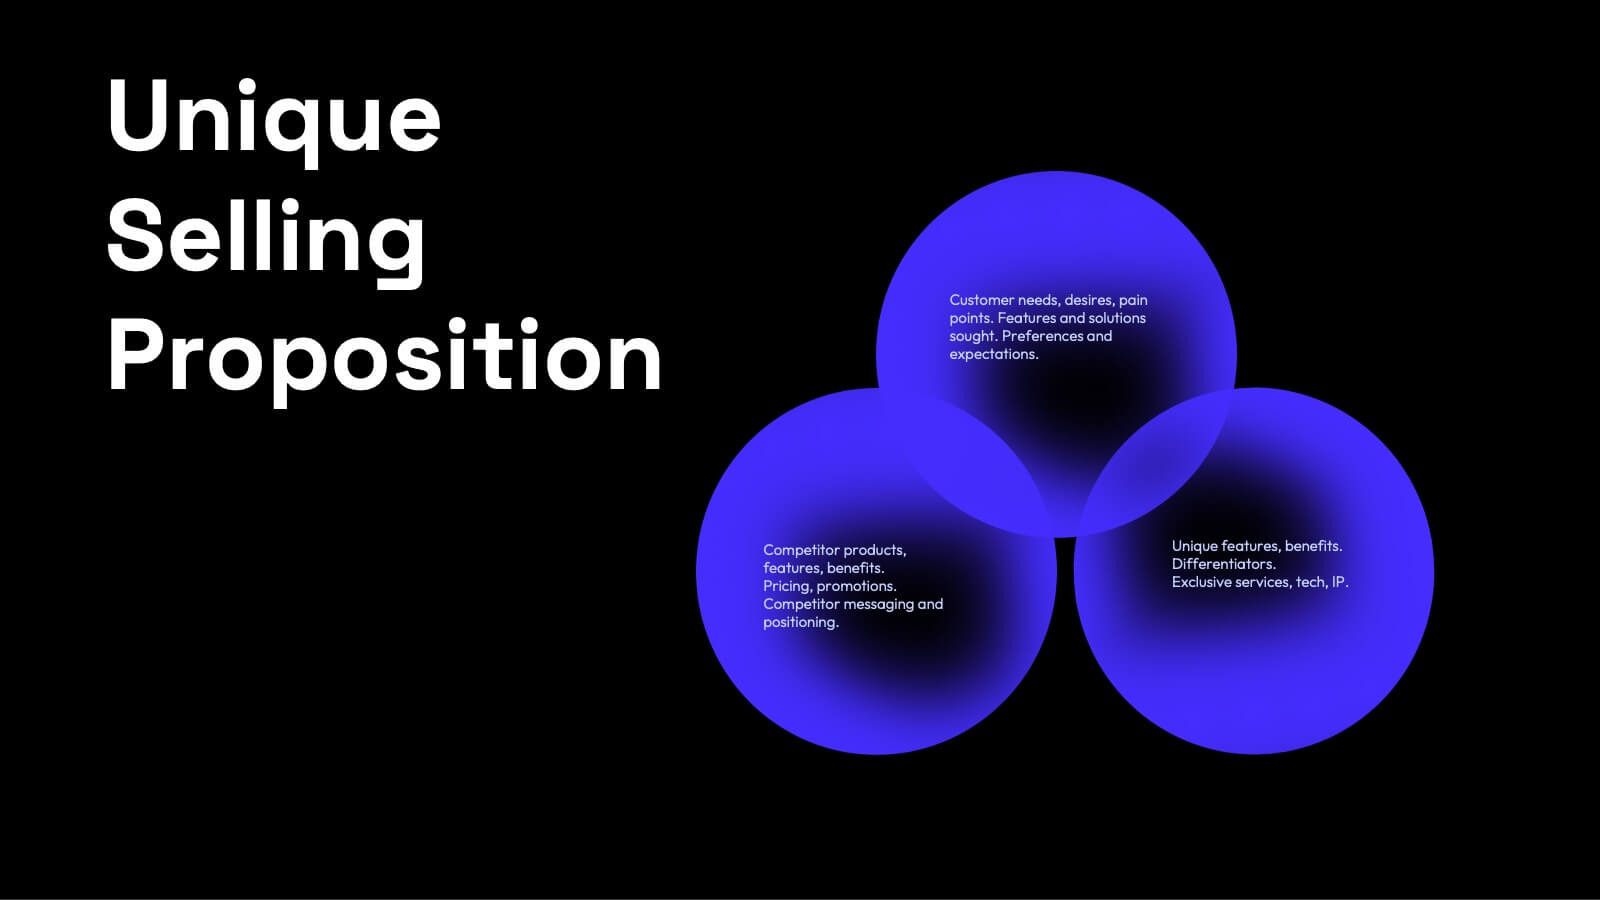
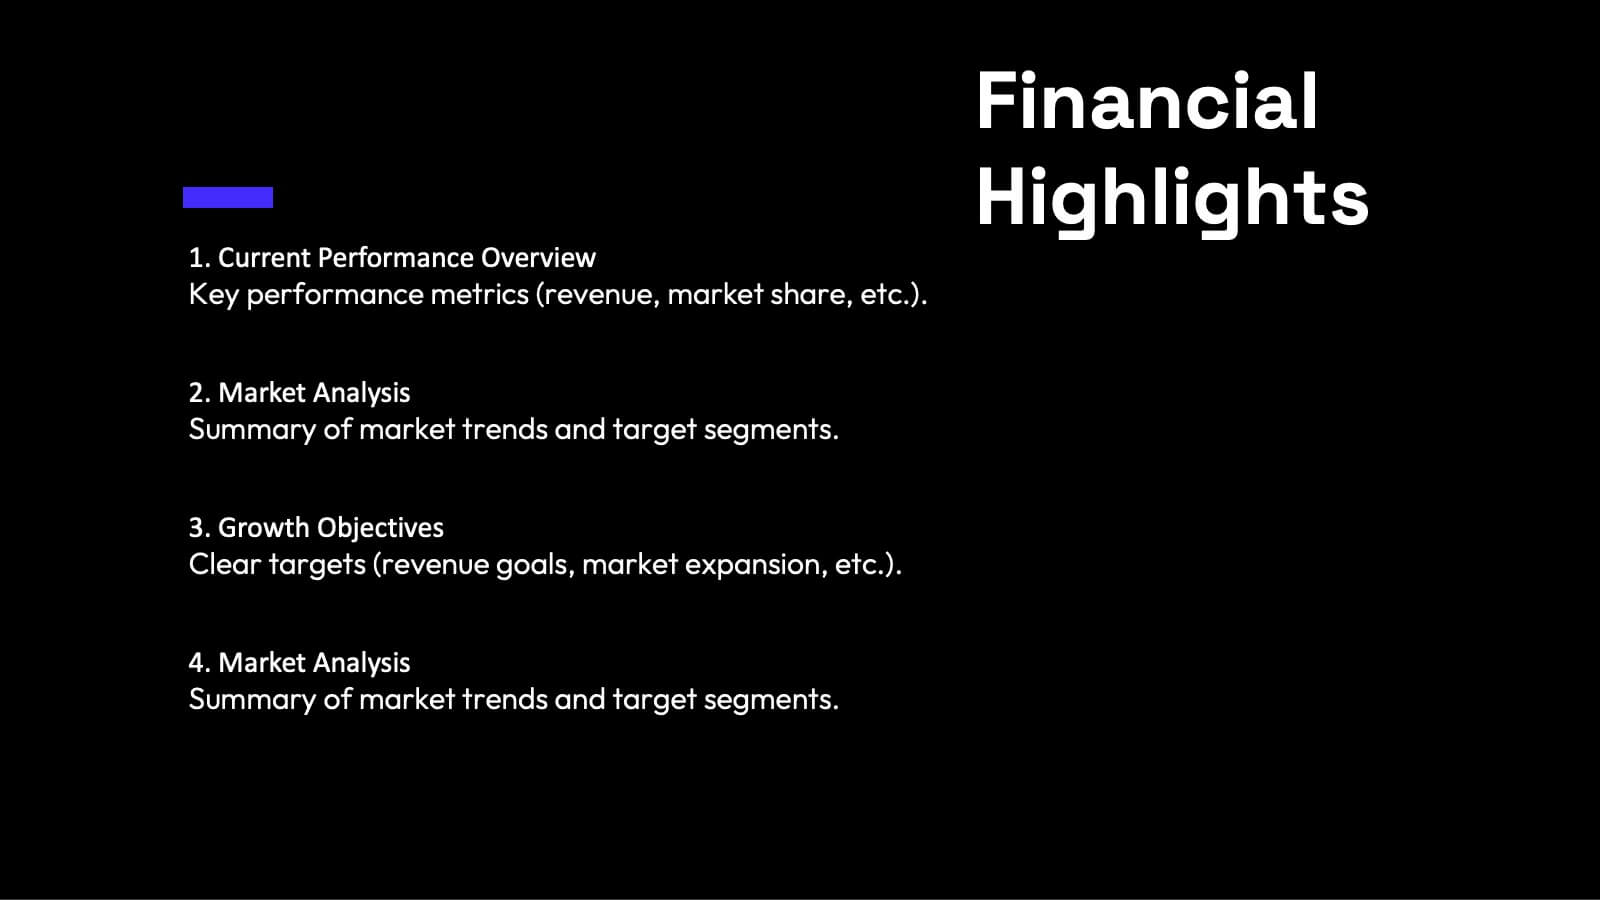
Apex Content Marketing Pitch Deck Presentation
Ignite your marketing strategy with this captivating pitch deck! Perfect for showcasing content marketing plans, it features slides on company history, target audience, and unique selling propositions. Make a lasting impression with sleek, modern designs and compelling content. Compatible with PowerPoint, Keynote, and Google Slides for a smooth presentation experience on any platform.


5 diapositivas
Interactive Data Analysis Report Presentation
Turn complex data connections into an engaging visual story with this sleek, modern layout. Ideal for presenting analytical findings, performance insights, or interconnected systems, it helps simplify information while keeping it visually dynamic. Fully editable and compatible with PowerPoint, Keynote, and Google Slides for easy customization and professional results.


5 diapositivas
New Hire Employee Onboarding Flow Presentation
Make a lasting first impression with a clear, engaging flow that guides new hires through every step of their onboarding journey. Perfect for HR teams and managers, this presentation simplifies complex processes with visual structure and clarity. Fully compatible with PowerPoint, Keynote, and Google Slides for easy customization and use.


7 diapositivas
Team Infographic
This collection of slides is meticulously designed to present detailed information about a team's structure and dynamics, ideal for team meetings, training sessions, and onboarding processes. Each slide is tailored to showcase various aspects of team organization, utilizing graphical elements like charts, timelines, and diagrams to visually represent relationships and project phases. The color schemes are engaging yet professional, ensuring the audience's focus is maintained. These templates are highly versatile and customizable, allowing adjustments in text, color, and design elements to suit specific team needs. They are particularly useful for managers and team leaders aiming to foster clear understanding of team objectives and workflows. By setting a common ground for expectations and performance, these slides are strategic assets in building effective, well-informed teams, contributing significantly to their cohesion and success.


26 diapositivas
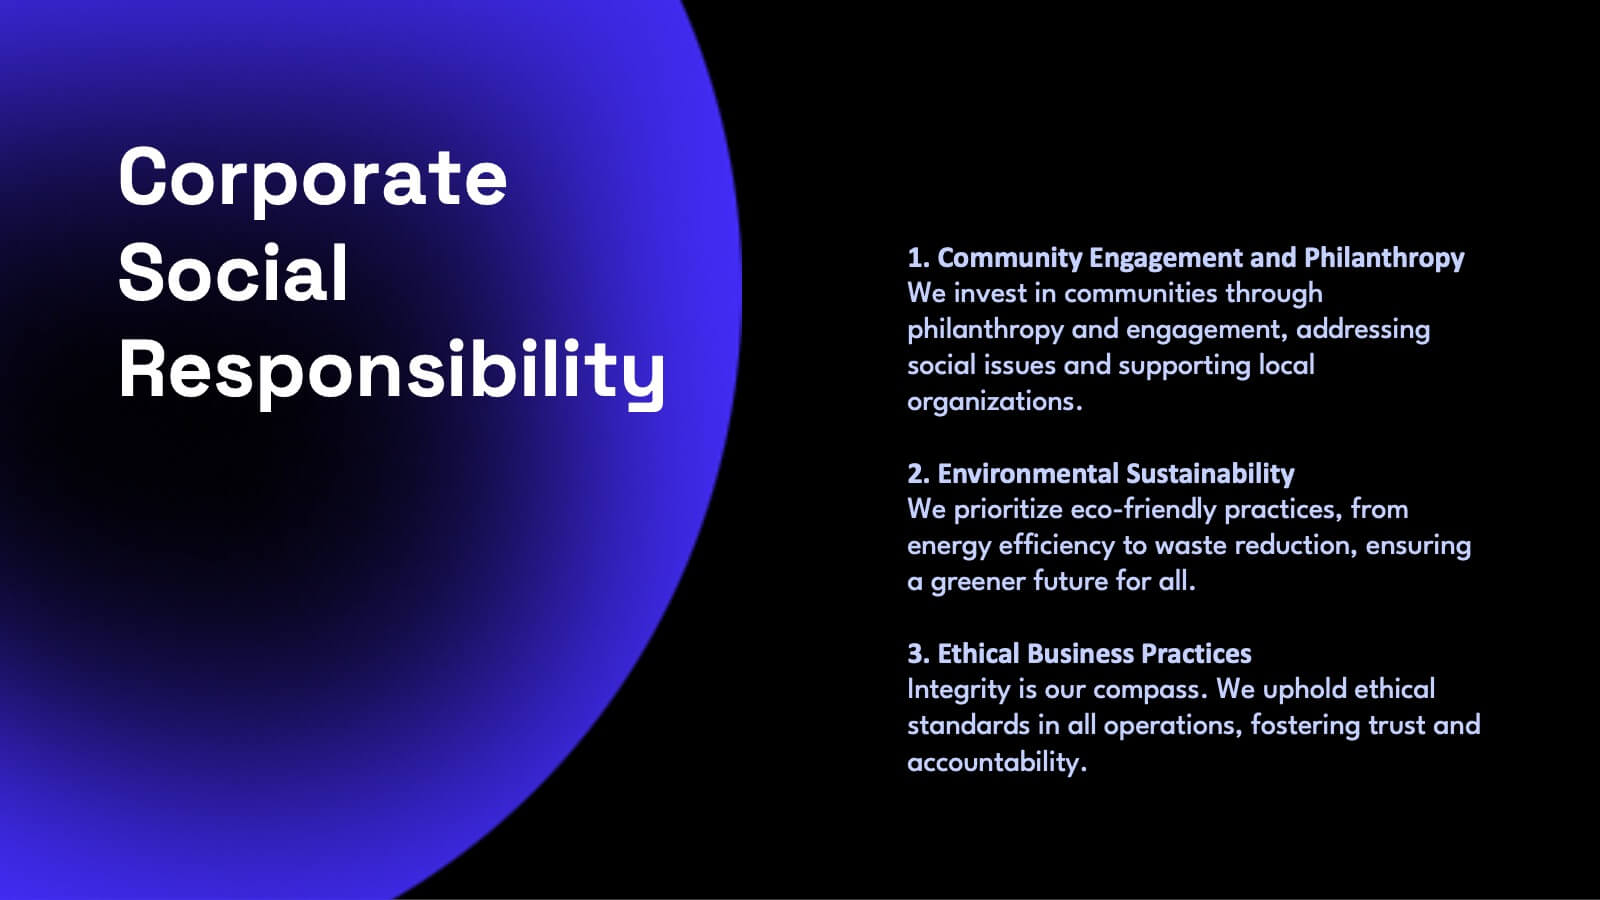
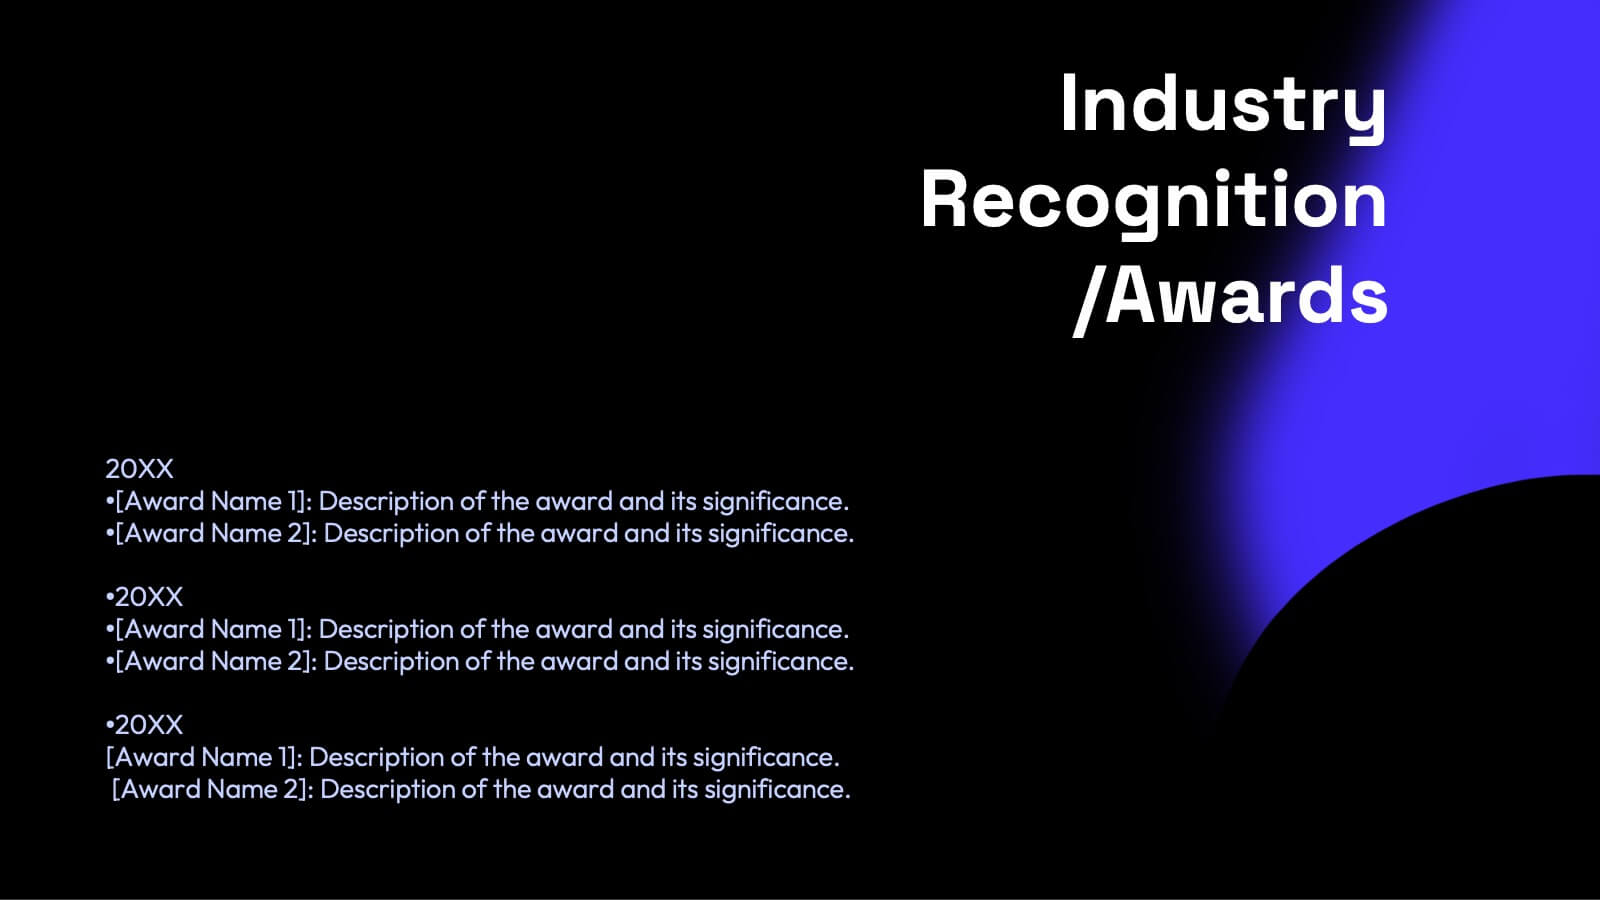
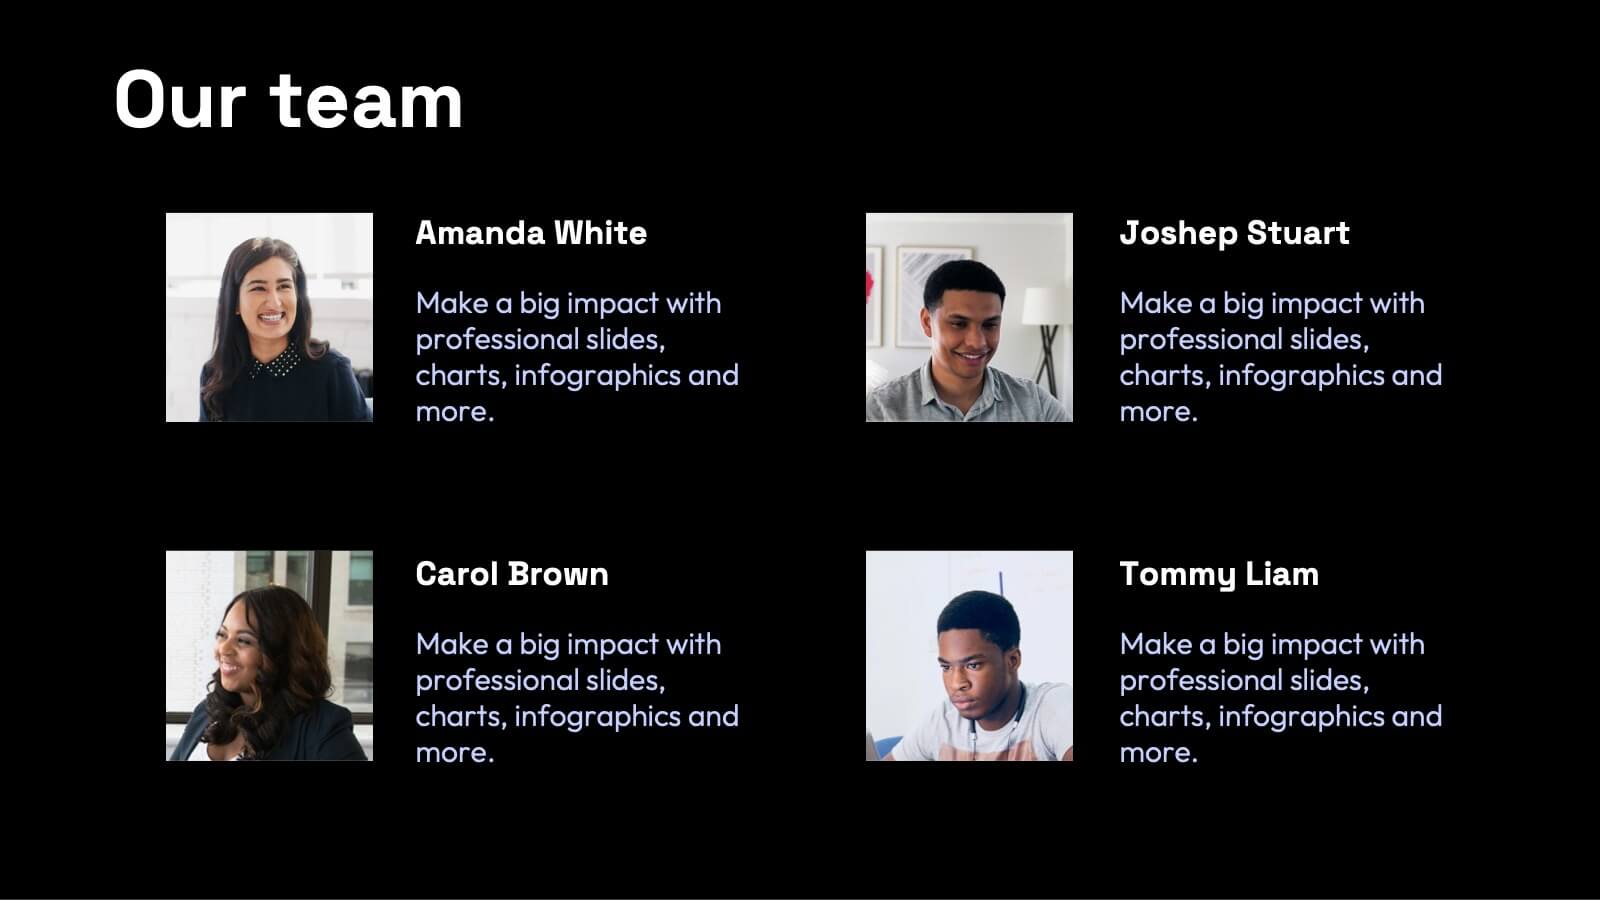
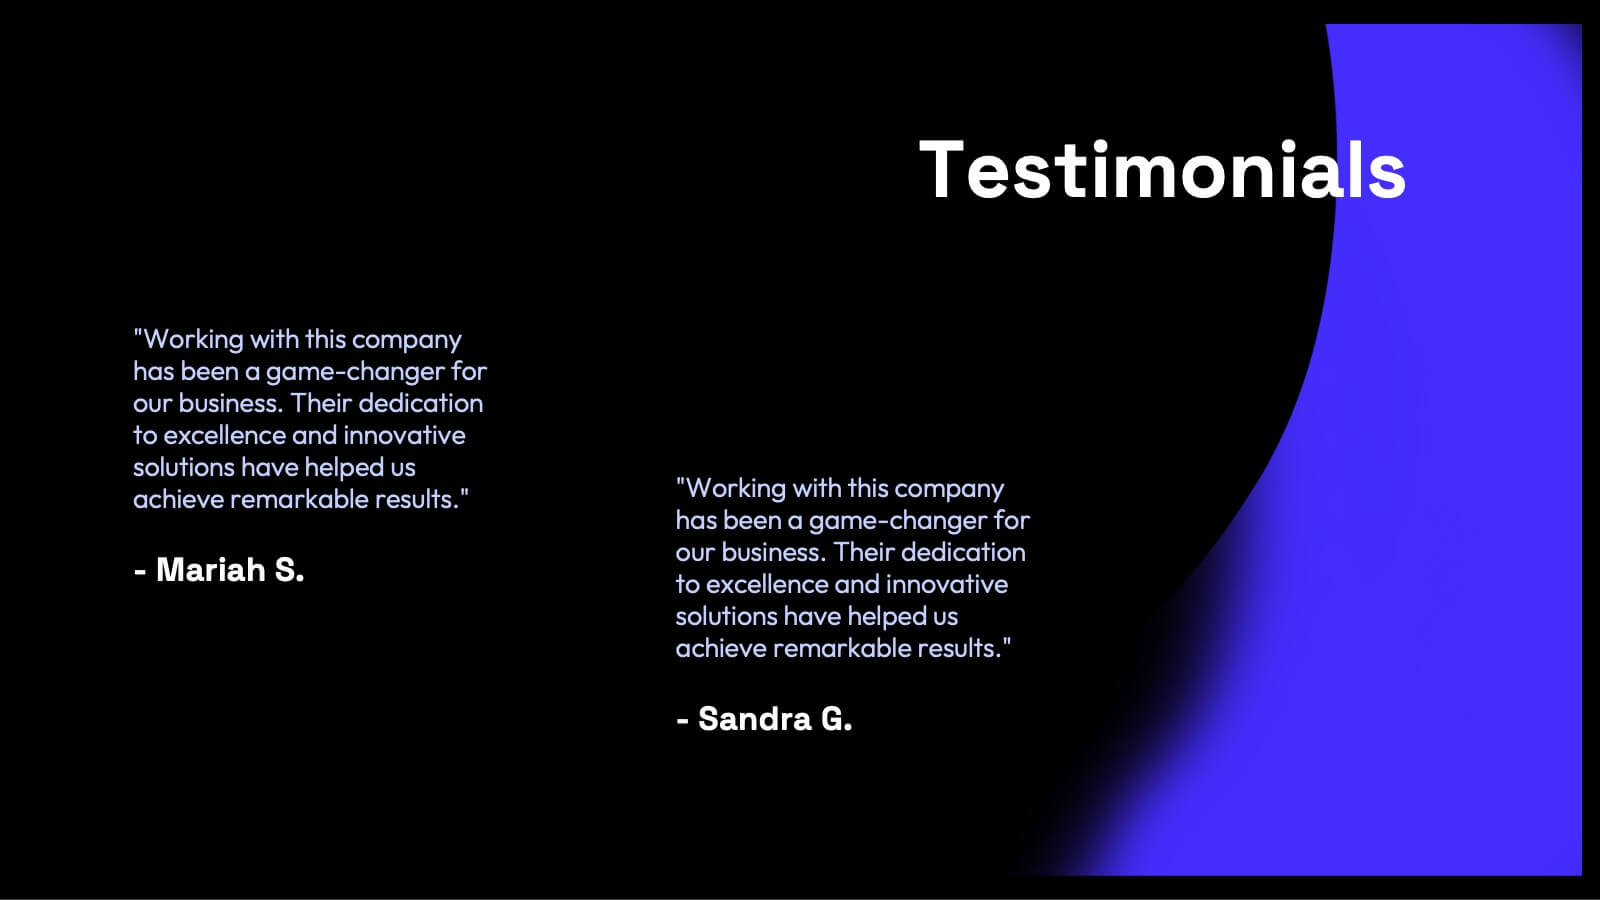
Company Profile Simple Duotone Presentation
Introducing our premier company profile presentation template, designed to beautifully encapsulate the essence of your business. Set against a backdrop that transitions from the serene blue sky to a deeper, more intense blue, this template evokes feelings of limitless possibilities and profound depth. This dual-tone theme, with its varying shades of blue, not only emphasizes trust, professionalism, and reliability but also creates an atmosphere of calm and stability, essential attributes for showcasing your company's strengths and accomplishments. Modern in its layout, our template facilitates a structured presentation of your company's history, mission, achievements, and future aspirations. The design intricately merges the visuals of the expansive sky with the profound depth of the darker hue, creating a narrative that speaks of a firm foundation with an eye on soaring to new heights. Perfectly compatible with both PowerPoint and Google Slides, this template offers ease of customization. Whether it's adjusting the content to fit your corporate story or tweaking the design elements, this template offers flexibility and user-friendliness. Dive deep into your company's journey and aspirations with this exquisite blue-themed template. It's not just a presentation; it's a reflection of your company's ethos and vision. Utilize this template to give stakeholders, partners, and employees a p....


5 diapositivas
Employee Feedback Survey Report Presentation
Deliver clear insights into team sentiment with this employee rating slide. Designed with star rating visuals and thumbs-up iconography, it's perfect for showcasing staff satisfaction, engagement, and performance reviews. Easy to customize in PowerPoint, Keynote, and Google Slides.


4 diapositivas
Project Responsibility Chart
Streamline team coordination with this Project Responsibility Chart. Clearly define who is Responsible, Accountable, Consulted, and Informed across key tasks. Ideal for project managers and team leads ensuring role clarity. Fully editable in PowerPoint, Keynote, and Google Slides.


22 diapositivas
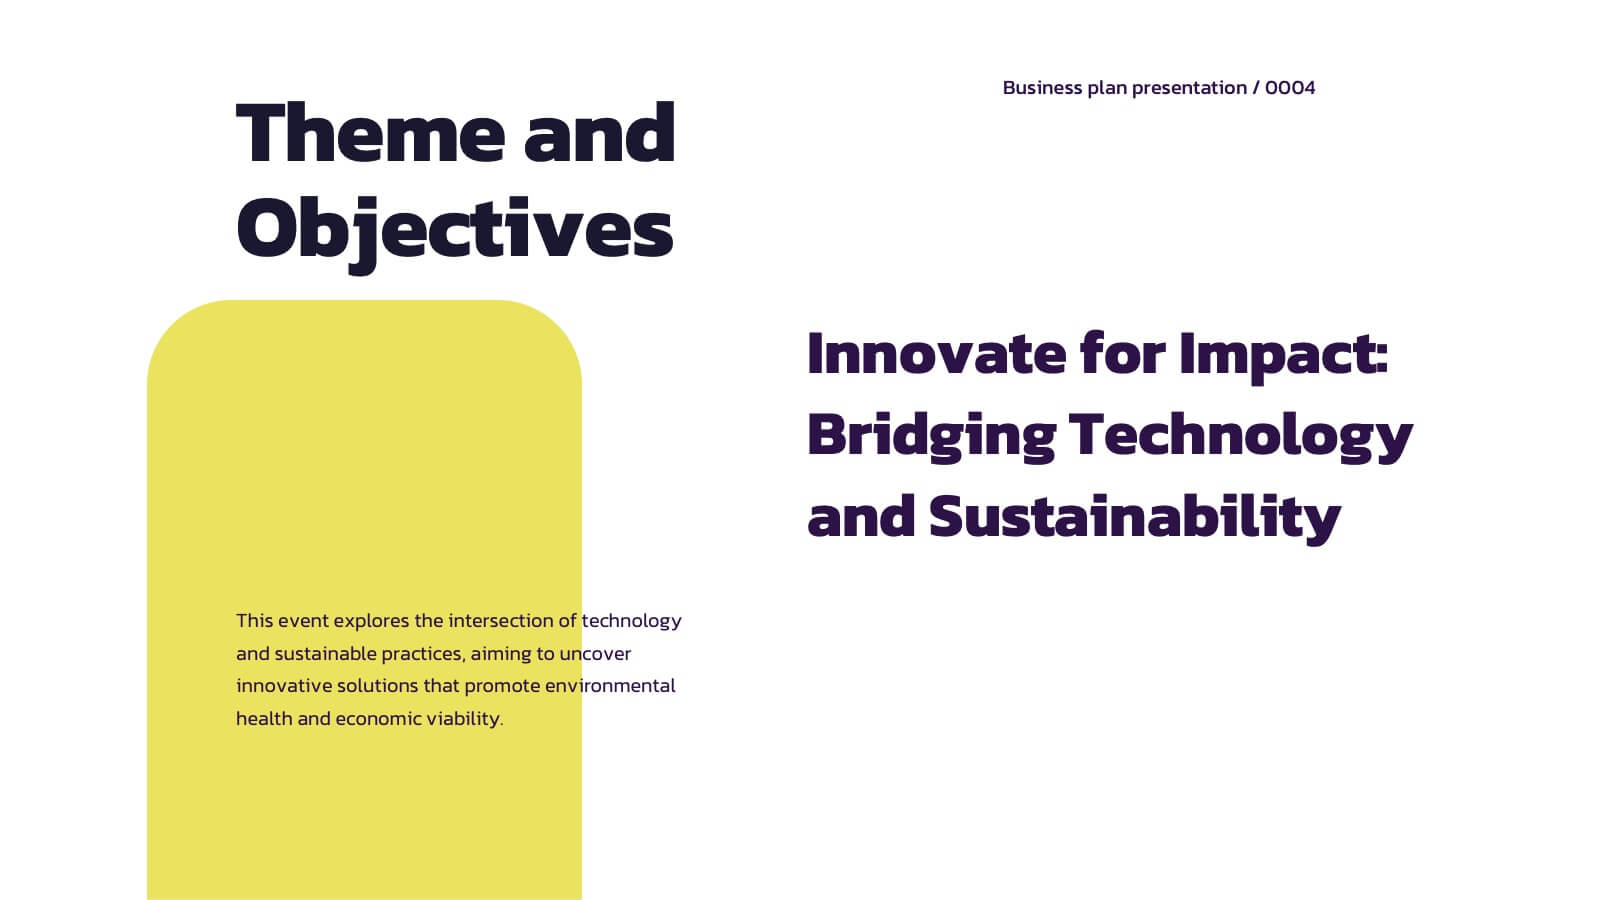
Crystal Business Plan Presentation
This business plan template is ideal for presenting strategies, conference overviews, and session details. With slides for keynote speakers, breakout sessions, and networking breaks, it offers a dynamic and professional layout. Compatible with PowerPoint, Keynote, and Google Slides, it ensures a clear and organized flow for any business presentation.


26 diapositivas
Corporate and Investment Company Profile Presentation
A corporate and investment company profile is a comprehensive document that provides detailed information about a company engaged in corporate and investment services. This presentation template is an effective way to introduce your company's services, capabilities, and track record to your audience. This template can be used to reflect your company's professionalism, expertise, and value proposition. This presentation is fully customizable and compatible with Powerpoint, Keynote, and Google Slides. This allows you to incorporate your company logo, brand colors, and relevant images that reflect your corporate identity.


26 diapositivas
Real Estate Company Profile Presentation
Step into the world of real estate, where every brick tells a story and every home harbors a dream. Our warm and bold template, draped in varying shades of brown, encapsulates the essence of properties, from cozy homes to towering skyscrapers. Boasting tailored graphics, detailed icons, and versatile image placeholders, it's more than just a visual aid; it's an experience. Seamless compatibility ensures it's ready for Powerpoint, Keynote, or Google Slides. An invaluable asset for realtors, property managers, housing agencies, or anyone looking to make an impact in the real estate market. Present with confidence; let every property shine.


7 diapositivas
Porter's Five Forces Diagram
Porter's Five Forces is a strategic framework developed by Michael Porter that helps analyze the competitive environment of an industry. The five forces are represented in a diagram to understand the competitive dynamics and attractiveness of an industry or market. In this infographic template, the forces are represented as five segments of a circle or a graphical illustration with arrows and descriptions. Compatible with Powerpoint, Keynote, and Google Slides. This template is a powerful, bold, and insightful tool that dissects competitive forces, revealing strategic insights for businesses.


21 diapositivas
Stellar Content Marketing Pitch Deck Presentation
The Stellar Marketing Pitch Deck template is designed to make your marketing strategies shine like never before! This template is perfect for showcasing your business's potential and engaging your audience with sleek, modern designs that capture attention. Start with a powerful introduction, leading into an in-depth industry overview that highlights key trends and consumer behaviors. With dedicated sections for emerging technologies, content marketing trends, and data-driven marketing, you'll have everything you need to present your innovative approach. The template also includes slides for social media strategies, influencer marketing, and SEO trends, ensuring you're covering all the bases. Personalization trends and video marketing evolution are featured to show your forward-thinking approach, while the customer experience focus slide emphasizes your commitment to quality. Finish strong with insights into e-commerce trends, brand storytelling, and sustainability in marketing. This template is fully compatible with PowerPoint, Keynote, and Google Slides, making it versatile and easy to use for any marketing presentation.


7 diapositivas
Agile Circle Methodology Infographic Presentation
Agile Methodology is a flexible and adaptive approach to project management that values customer satisfaction, teamwork, and continuous improvement. Our Agile Methodology template is perfect for academic or work presentation projects. This template is super easy to use and works with Powerpoint, Keynote, and Google Slides. It has a minimal design with, bright colors that will keep your audience engaged. With this template, you can learn all about Agile Methodology in a way that is visually appealing. Use this template to see how you and your team work more efficiently and effectively.


21 diapositivas
Kinetic Business Operations Plan Presentation
Take your business operations to the next level with this sleek and organized Business Operational Plan template! Dive into every detail, from performance metrics to employee recognition, all presented with professional design and clear layouts. Make collaboration, process improvements, and upcoming events engaging and actionable. Perfect for PowerPoint, Keynote, and Google Slides!


3 diapositivas
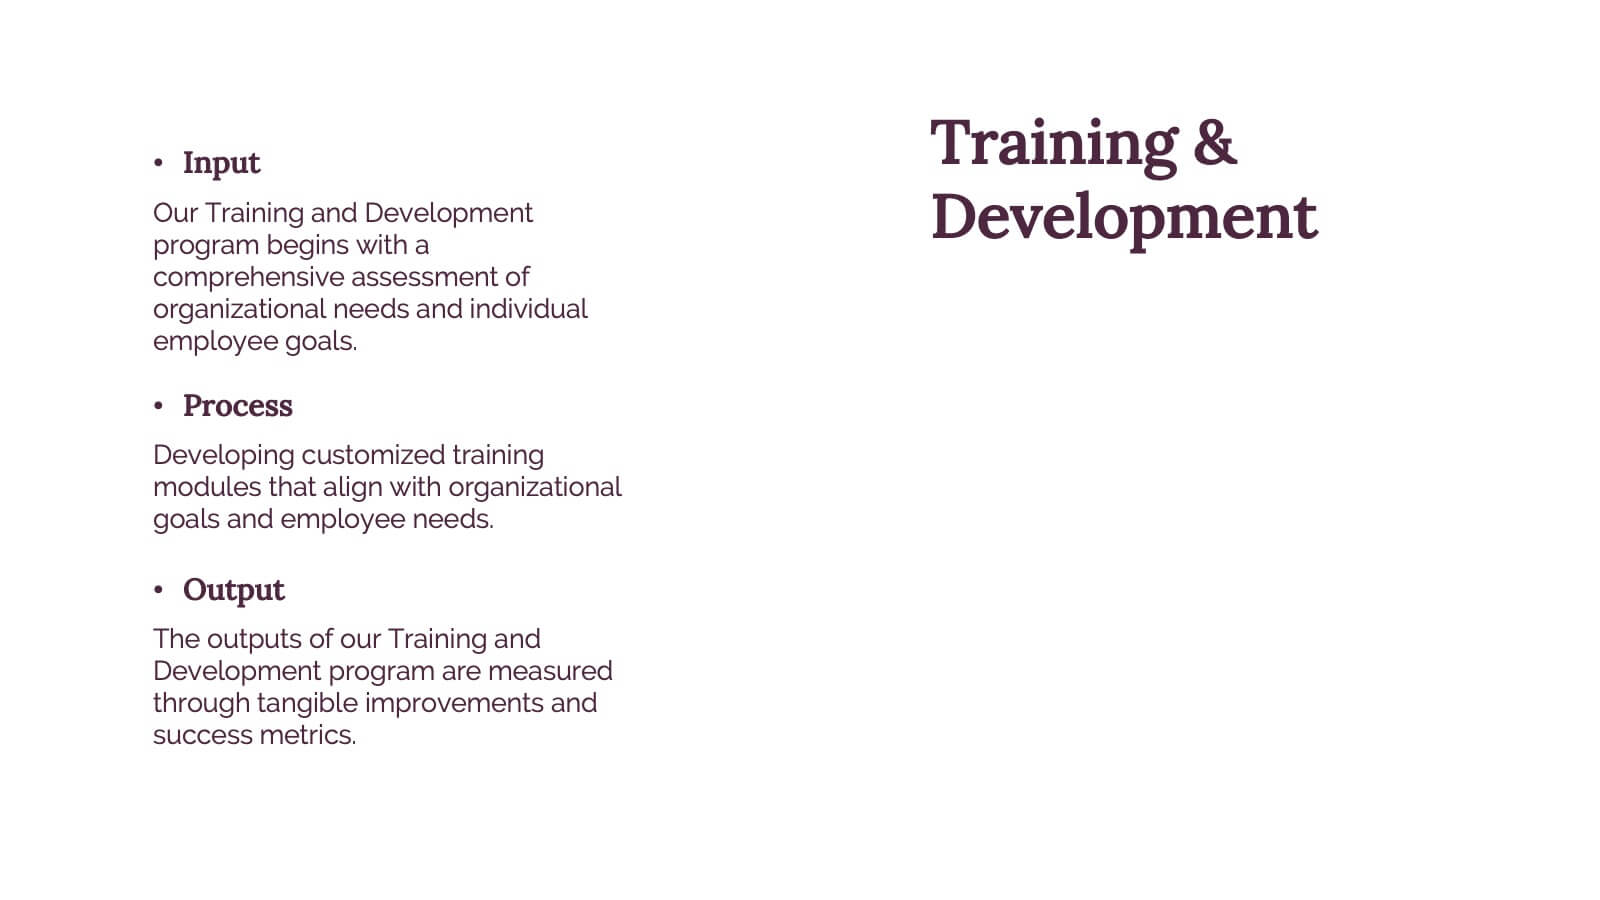
Training & Development Modules Presentation
Present your program structure with the Training & Development Modules Presentation. This slide design features a 3D cube layout that clearly illustrates three learning modules, each with space for a title, icon, and description. Ideal for onboarding, employee growth, or educational programs. Fully editable in Canva, PowerPoint, Keynote, and Google Slides.


7 diapositivas
Digital Marketing Strategies Infographic
The Digital Marketing Strategies Infographic provides a colorful and organized presentation of key performance indicators and metrics essential for evaluating the success of digital marketing campaigns. It covers various platforms and strategies, illustrating comparative engagement rates, follower counts, and other relevant data points. This infographic is an excellent resource for marketers looking to convey their campaign results in a clear, concise manner. It is suitable for use in PowerPoint, Google Slides, and Keynote presentations, ideal for illustrating progress, setting benchmarks, and sharing insights with team members, stakeholders, or clients.