


Características


¿Tienes alguna pregunta?
Recomendar


4 diapositivas
Funding & Investor Startup Presentation
Present your investment strategy with clarity and impact using this triangle diagram slide. Ideal for showcasing the relationship between key funding stages, investor types, or business milestones, this layout offers a clean structure with labeled nodes (A, B, C) and supporting icons. Fully editable in PowerPoint, Keynote, and Google Slides for seamless customization.


7 diapositivas
Butterfly Visualization Layout Presentation
Bring balance and clarity to your data storytelling with a sleek, symmetrical design that connects ideas seamlessly. This presentation is ideal for visualizing comparisons, workflows, or interconnected topics in a clean and engaging format. Fully customizable and compatible with PowerPoint, Keynote, and Google Slides.
7 diapositivas
Project Status Tracking Infographic
For any project manager or team leader, tracking the progress and status of projects is paramount. This project status tracking infographic simplifies this task, offering a visually appealing representation of every project phase. With a predominant palette of white and blue, this design captures attention and imparts clarity. Tailored for project managers, stakeholders, and team members, this infographic acts as a dynamic snapshot of ongoing tasks, completed milestones, and impending deadlines. Designed for seamless use with PowerPoint, Keynote, and Google Slides, it's your ultimate tool for effective project communication.


4 diapositivas
Breakthroughs in Scientific Discovery Presentation
Highlight research milestones with this Breakthroughs in Scientific Discovery Presentation Template. Designed with a lab flask graphic that fills up with percentages, this layout is perfect for showcasing progress, success metrics, or phased experimentation. Ideal for researchers, science communicators, and biotech presentations. Fully editable in PowerPoint, Keynote, and Google Slides.


26 diapositivas
The Rise of Smart Cities Presentation
This presentation template is dedicated to urban developers, technology enthusiasts, and policy makers interested in the advancement of smart cities. The template serves as a deep dive into the integration of technology within urban settings to boost sustainability, efficiency, and quality of life. It is designed with a sleek, modern aesthetic, using a color palette that reflects innovation and modernity, which makes it visually appealing and easy to navigate. The content is structured to demystify complex concepts about smart cities, featuring sections on IoT implementations, eco-friendly urban development, and smart public services. It includes varied slide types such as diagrams, infographics, and statistical displays to showcase data and case studies from cities that are pioneers in this domain. The template is compatible with multiple presentation platforms like PowerPoint, Google Slides, and Keynote, ensuring it can be utilized across different devices and settings. This makes it a versatile tool for presentations in educational, professional, and conference contexts, aiming to inspire and educate on the transformative power of smart urban planning.


6 diapositivas
Lean Business Canvas Framework
Simplify your business strategy with the Lean Business Canvas Framework Presentation. This slide offers a structured layout to map out key elements like partners, activities, value propositions, customer segments, and revenue streams—all in one view. Ideal for startups, business plans, or internal strategy sessions. Fully editable in PowerPoint, Keynote, and Google Slides.


7 diapositivas
Concentric Circles Report Infographic
Concentric circles are a set of circles that share the same center but have different radii. This infographic template offers an innovative and visually appealing way to present complex data or concepts, allowing you to peel back layers of insights like the concentric circles themselves. This showcases how concentric circles can elegantly represent complex data, breaking it down into easily digestible layers. Compatible with Powerpoint, Keynote, and Google Slides. This gives you the ability to easily include tips and insights on how to design and customize concentric circles to suit specific data and reporting needs.


6 diapositivas
Leadership Vision and Strategy Presentation
Present your organization’s goals with this leadership vision and strategy template, designed with a hierarchy graphic to represent team structure and growth. Perfect for strategic planning, leadership meetings, and corporate presentations. Fully editable in Canva, PowerPoint, or Google Slides, making it easy to customize colors, text, and layout to fit your brand.


5 diapositivas
Relationship Mapping Diagram Presentation
Bring clarity to complex connections with this clean and modern visual layout designed to map relationships, processes, or ideas effortlessly. Perfect for presentations that require structure and flow, it balances simplicity with professionalism. Fully customizable and compatible with PowerPoint, Keynote, and Google Slides for seamless design flexibility.


5 diapositivas
Business Ethics and Governance
Illustrate ethical processes and compliance values with this curved roadmap presentation. Designed around five connected stages—Process, Compliance, Technology, Oversight, and People—this layout helps visualize corporate governance and operational integrity. Each segment is color-coded and paired with icons for easy comprehension. Fully editable in PowerPoint, Keynote, and Google Slides.


5 diapositivas
Coffee Brewing Methods Infographics
Coffee brewing methods refer to the various techniques and processes used to extract flavor and aroma from coffee beans. These infographic templates are a visually appealing and informative presentation tool designed to showcase various methods of brewing coffee. Whether you're a coffee enthusiast, a barista, or someone interested in learning more about coffee preparation, this template provides an engaging way to explore different brewing techniques and their unique characteristics. These allows you to showcase and educate others about various coffee brewing techniques. Fully customizable and compatible with Powerpoint, Keynote, and Google Notes.


6 diapositivas
Bubble Mapping Strategy Presentation
Turn your ideas into a clear visual roadmap that captures every connection and concept in one glance. This professional presentation helps organize strategies, goals, and processes through an easy-to-follow bubble map layout. Fully customizable and compatible with PowerPoint, Keynote, and Google Slides for seamless editing and presentation.

23 diapositivas
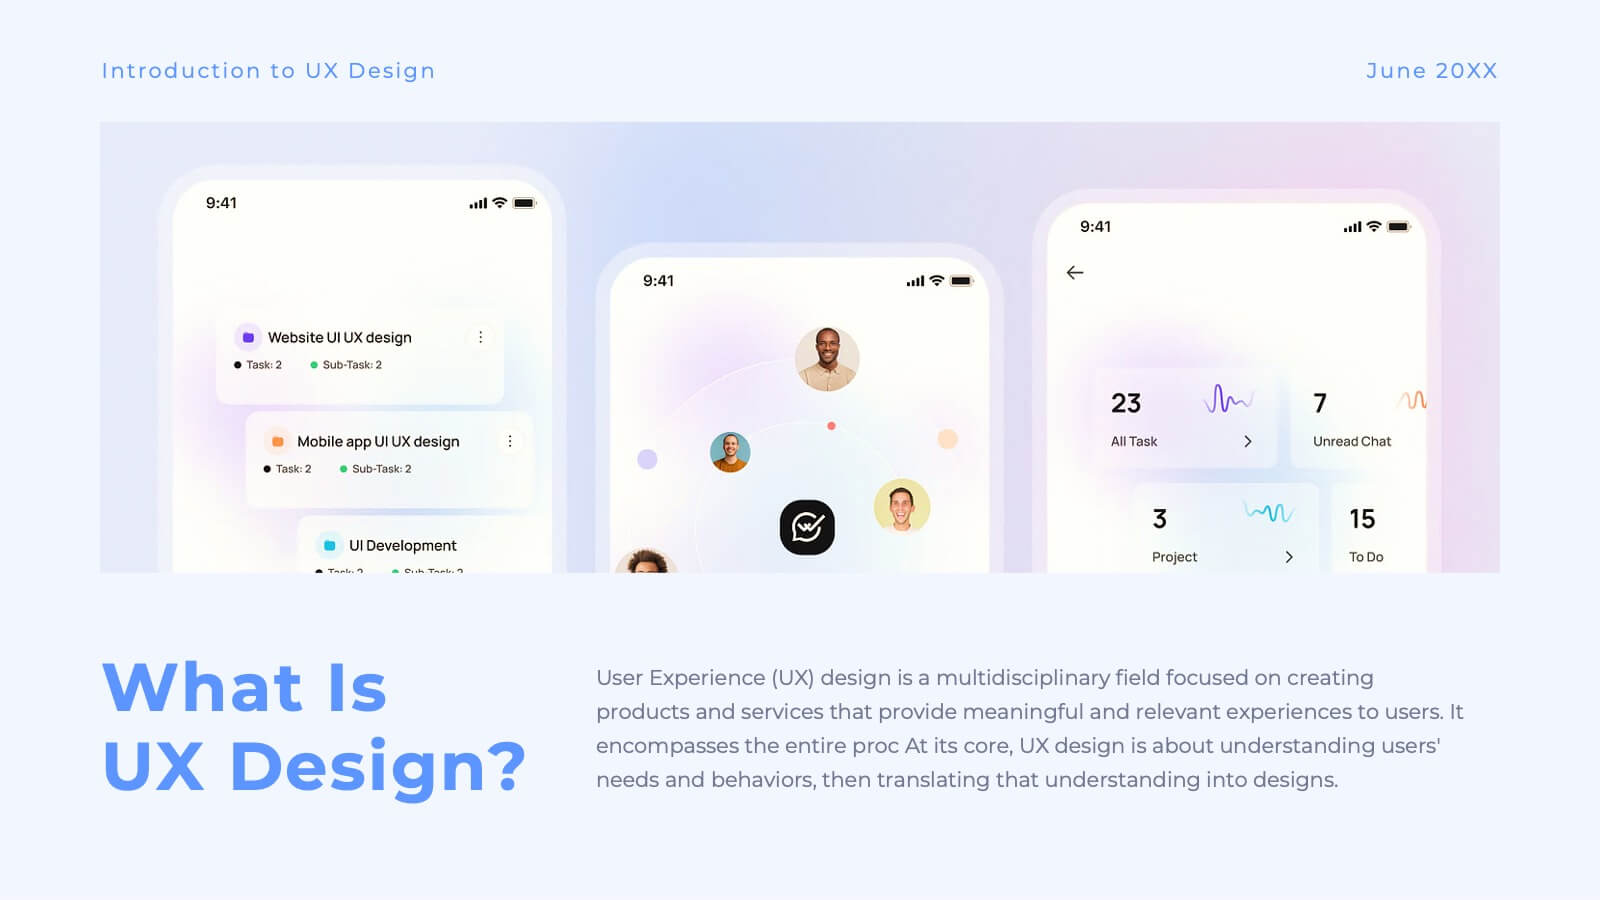
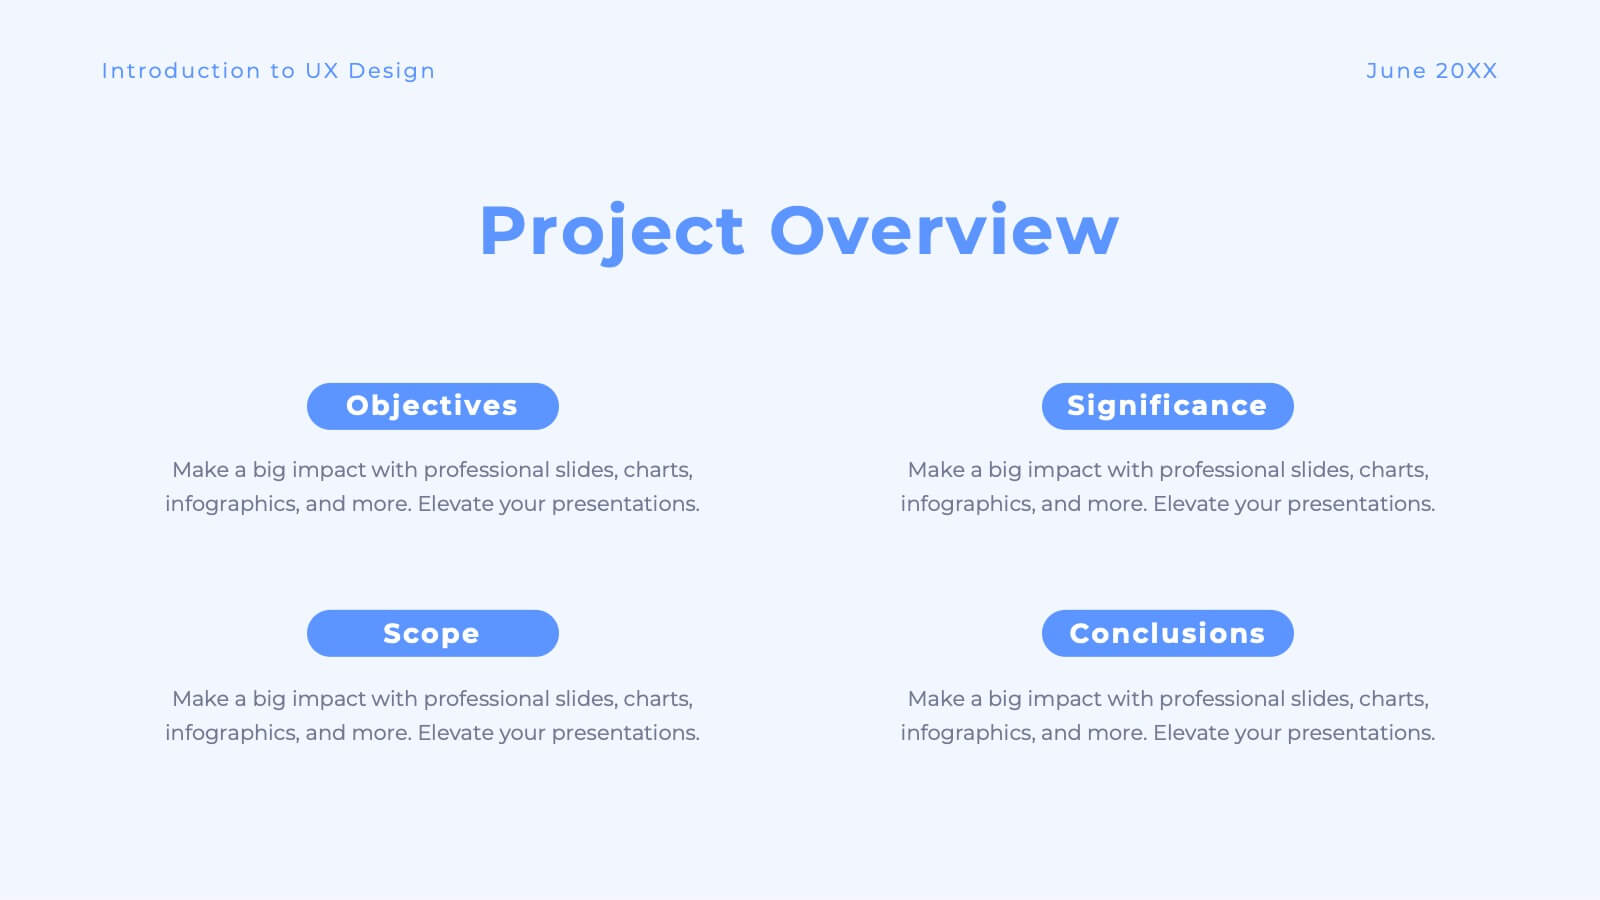
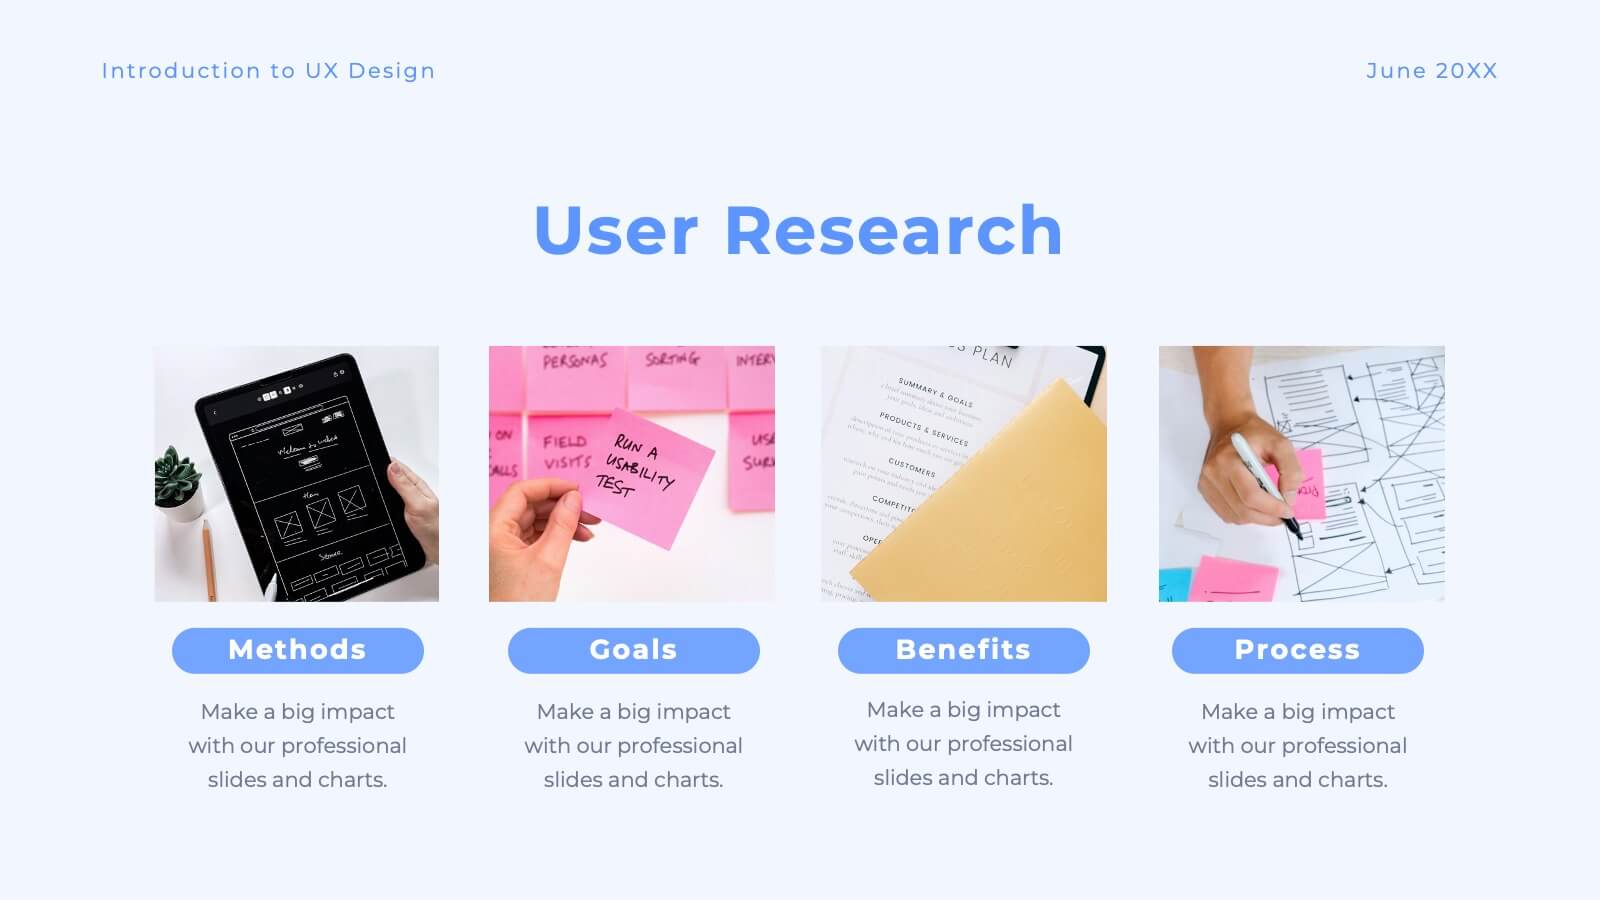
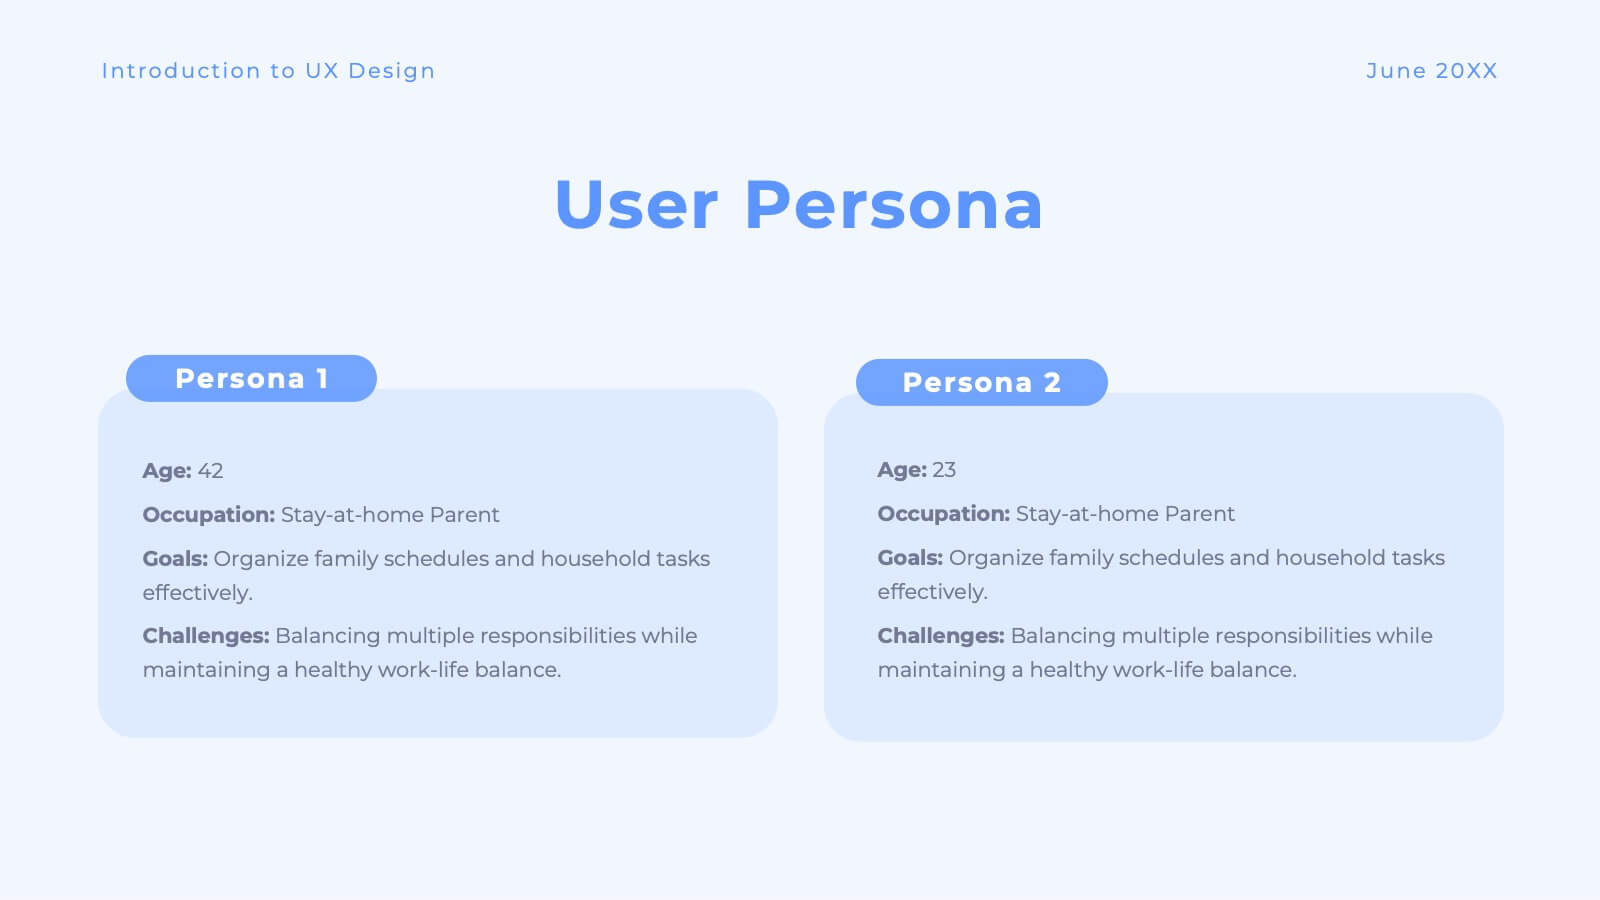
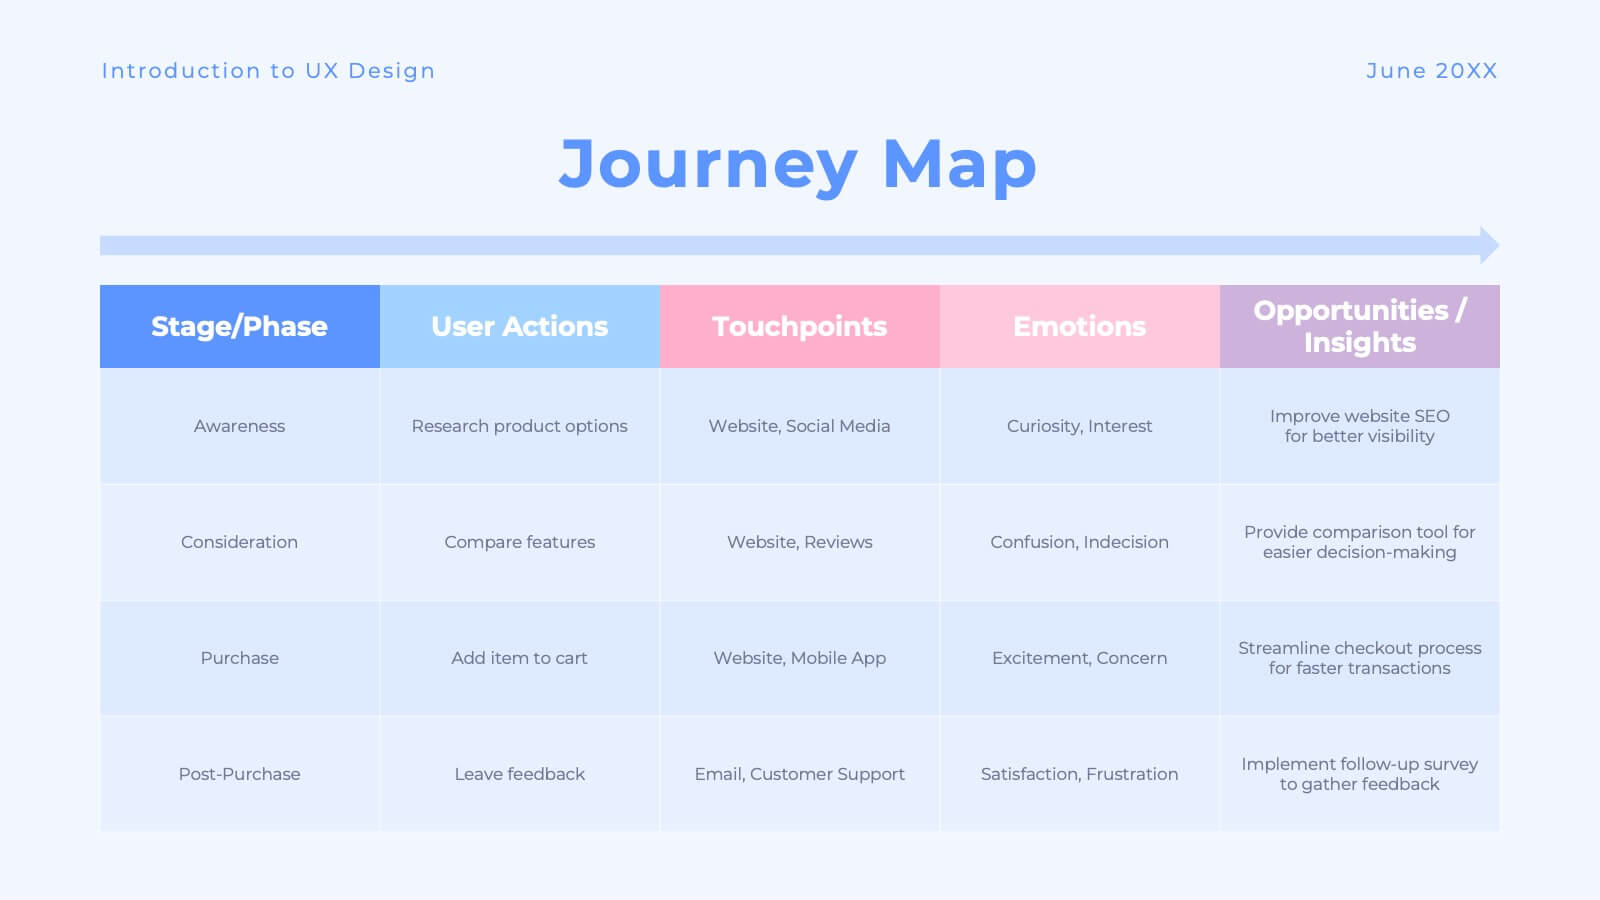
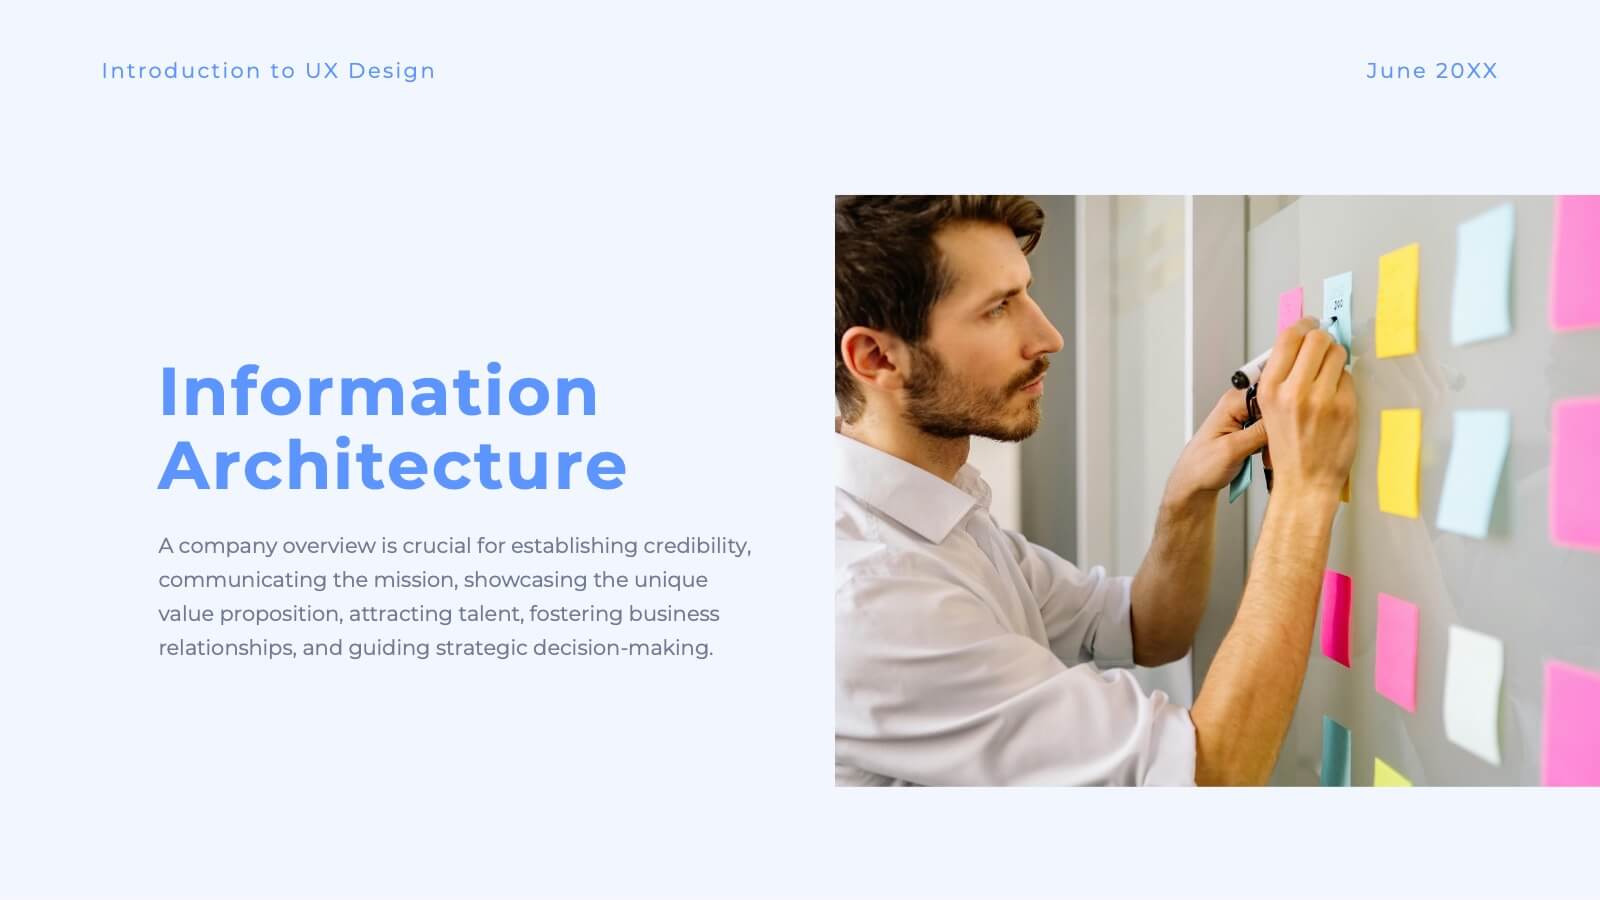
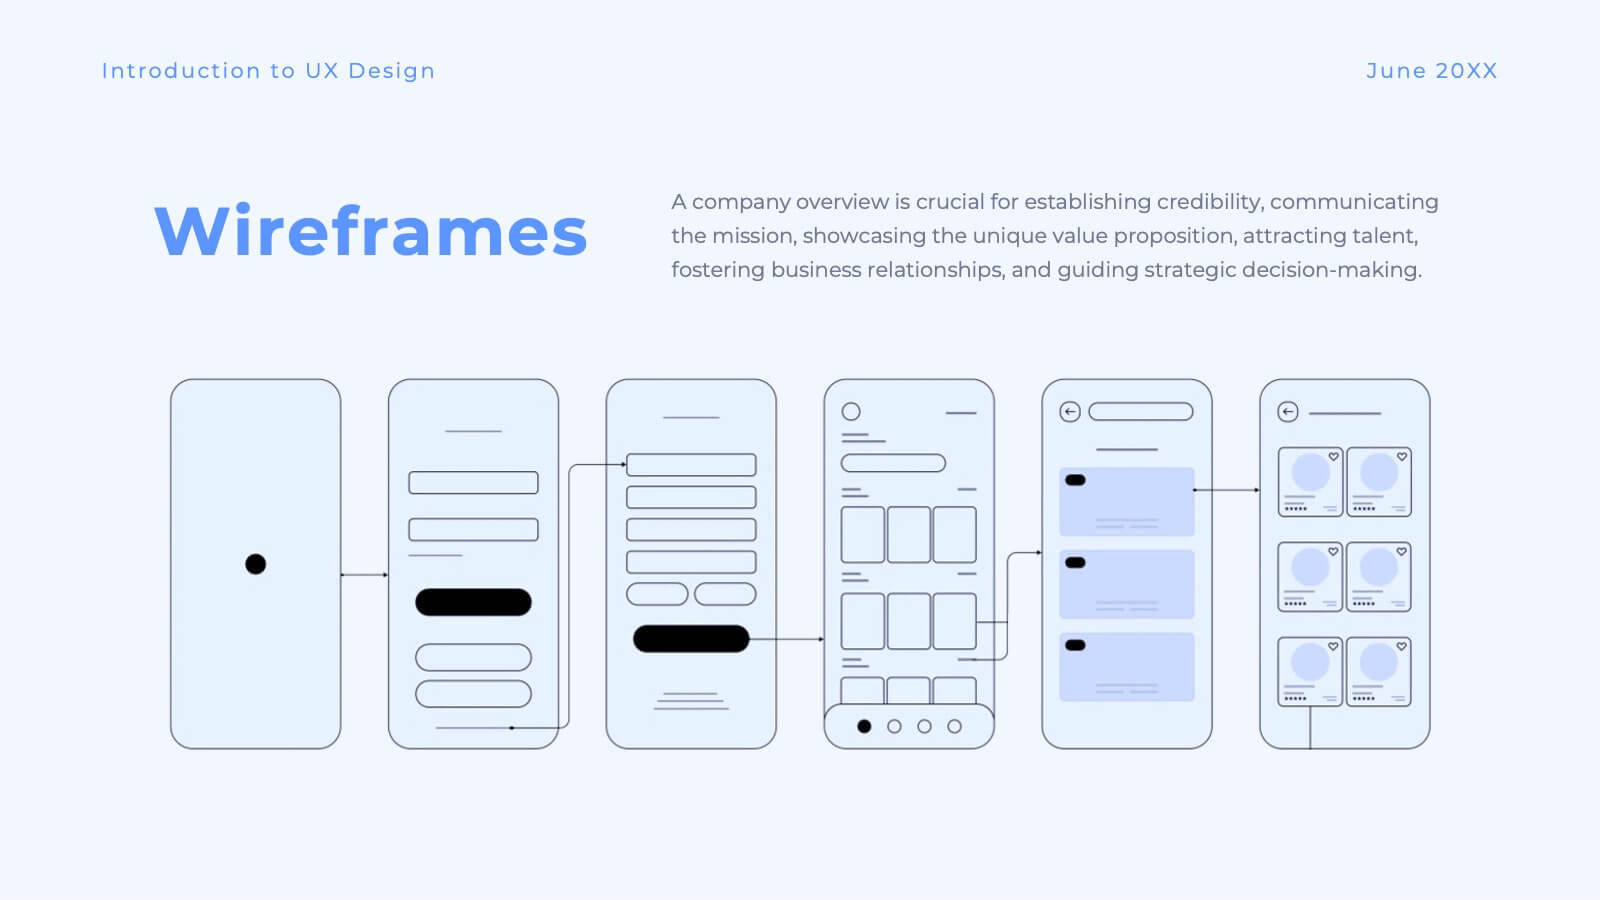
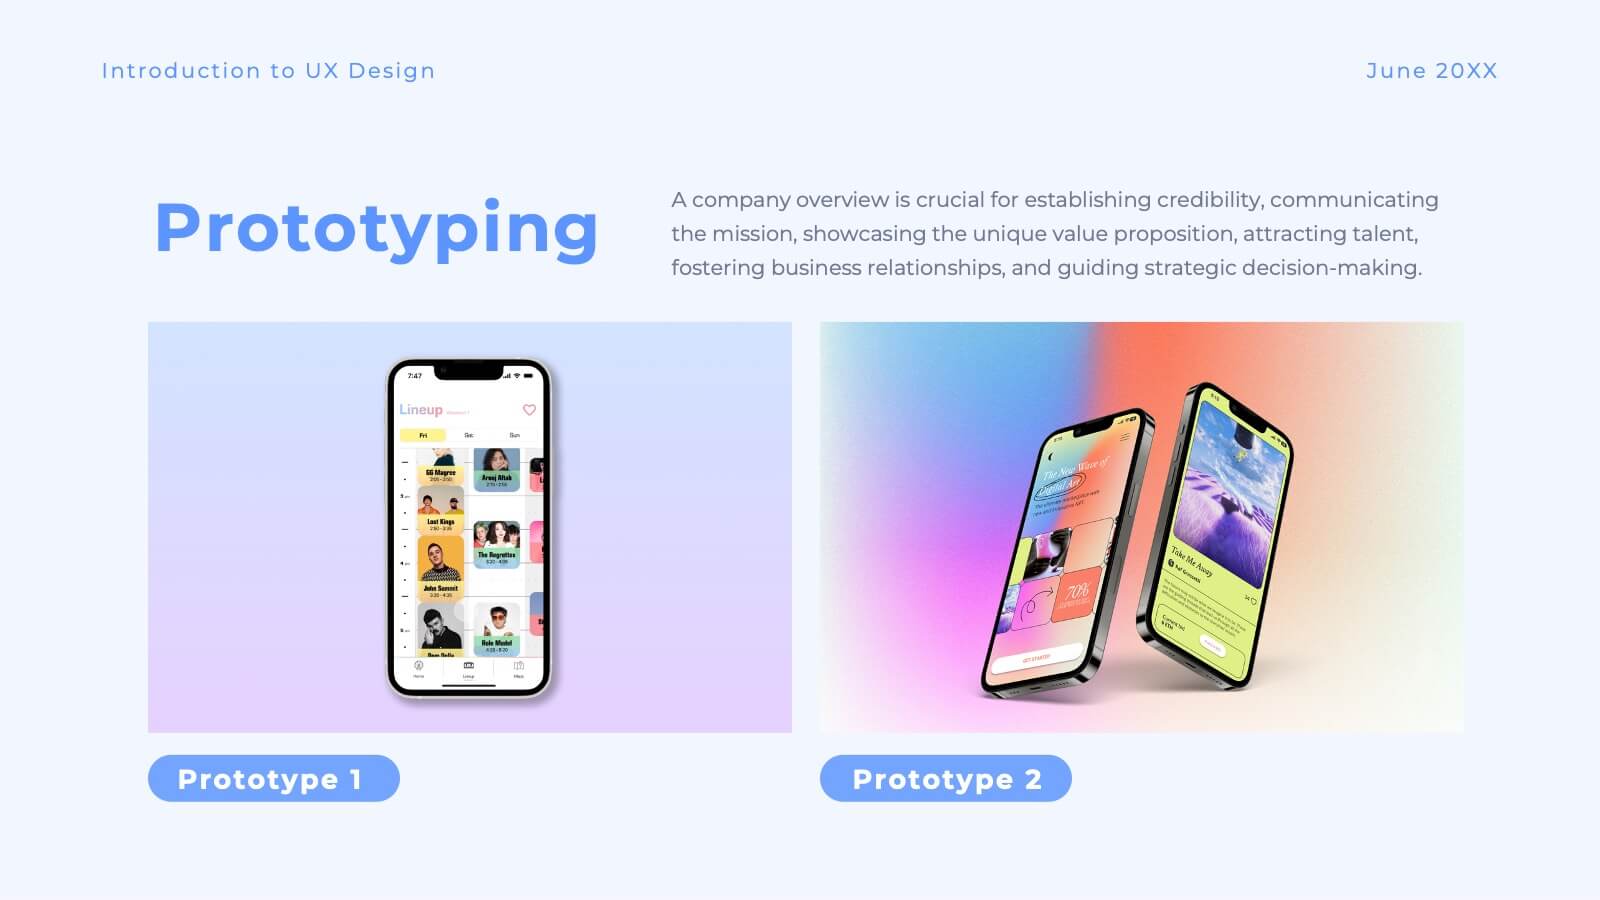
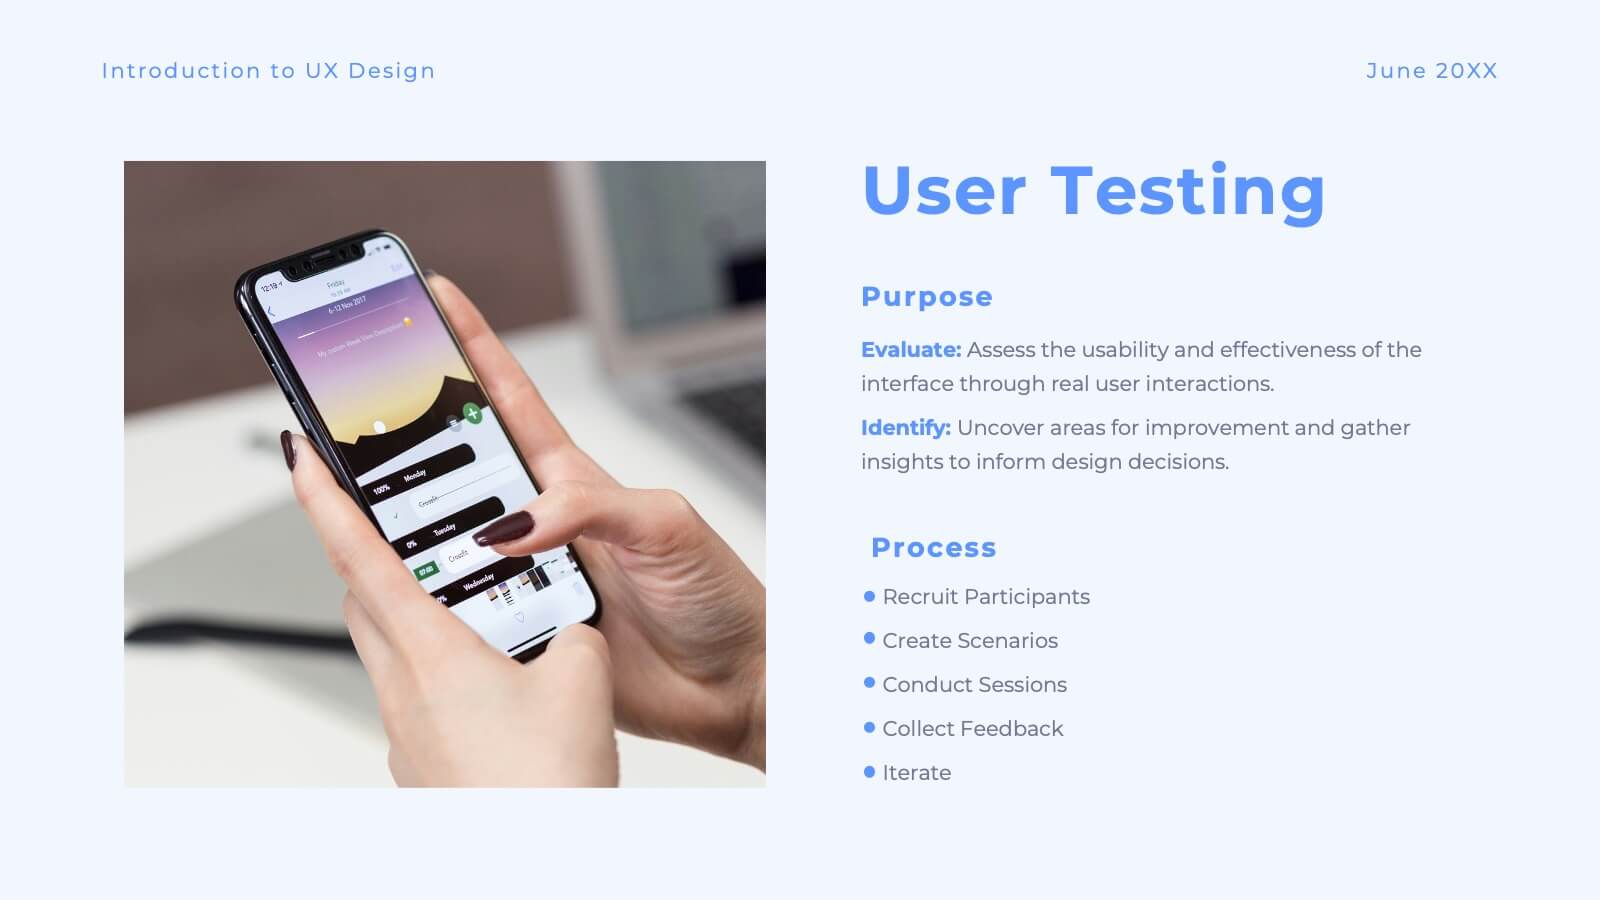
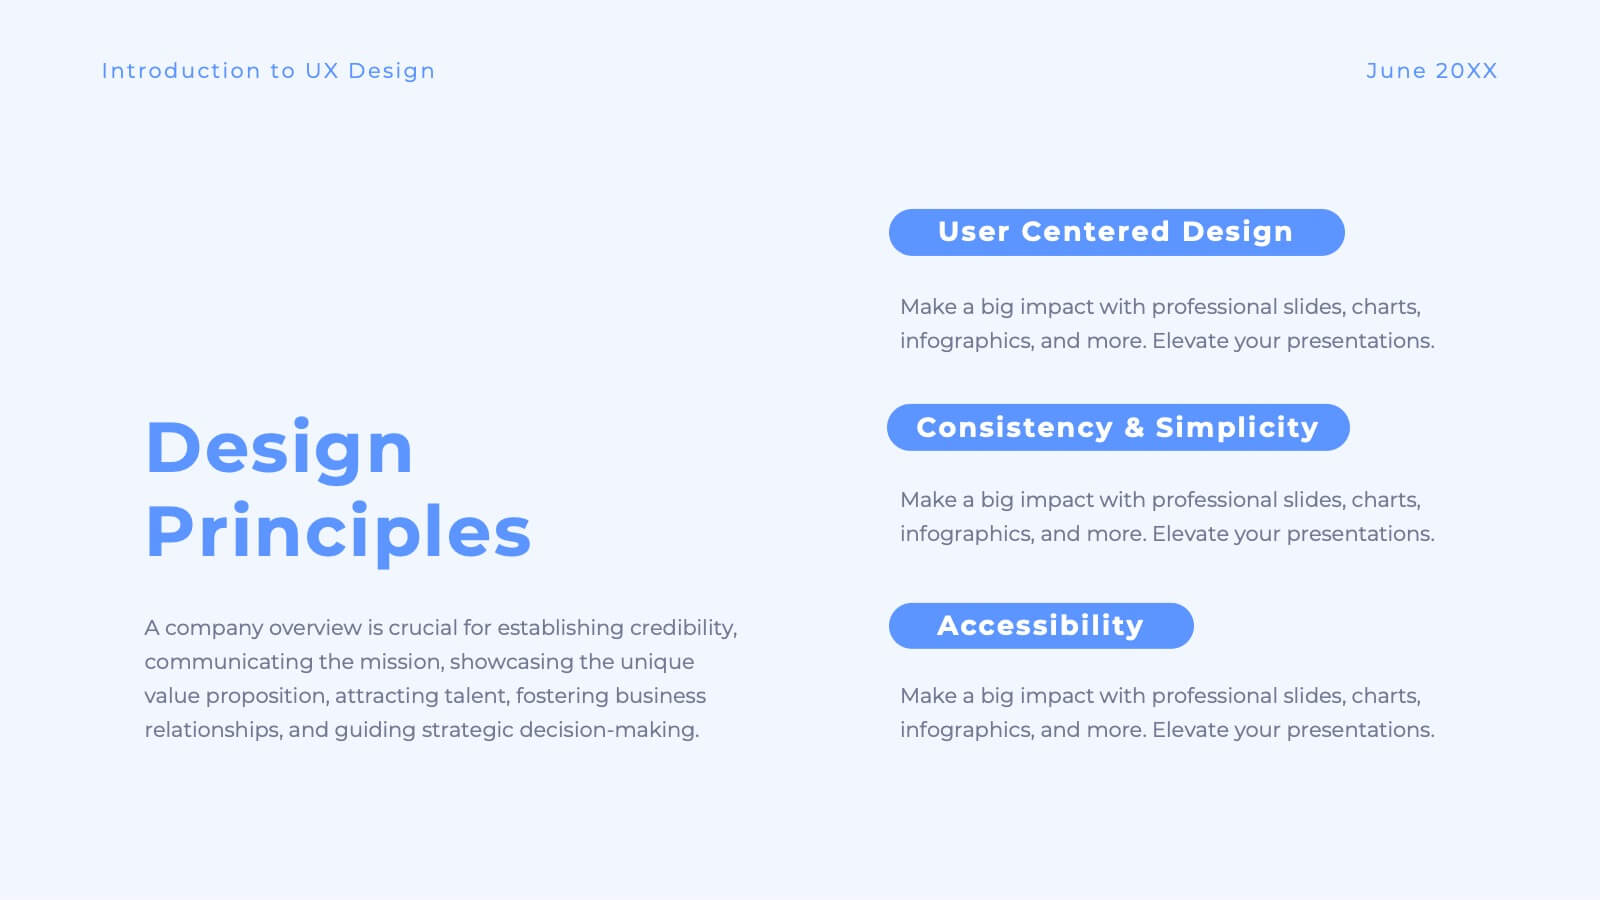
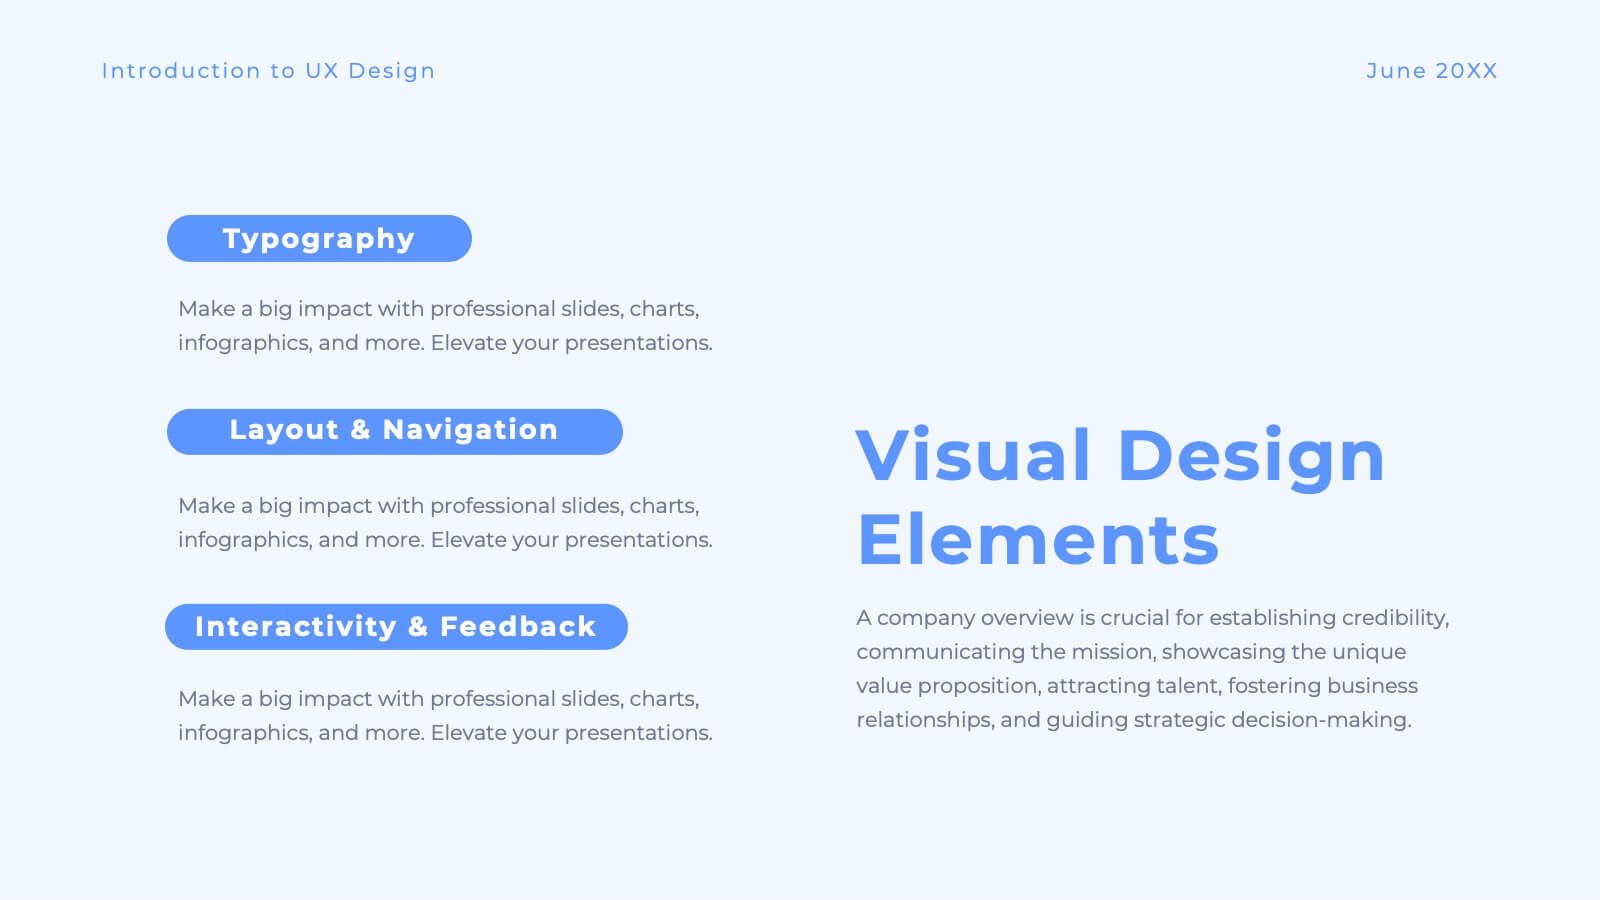
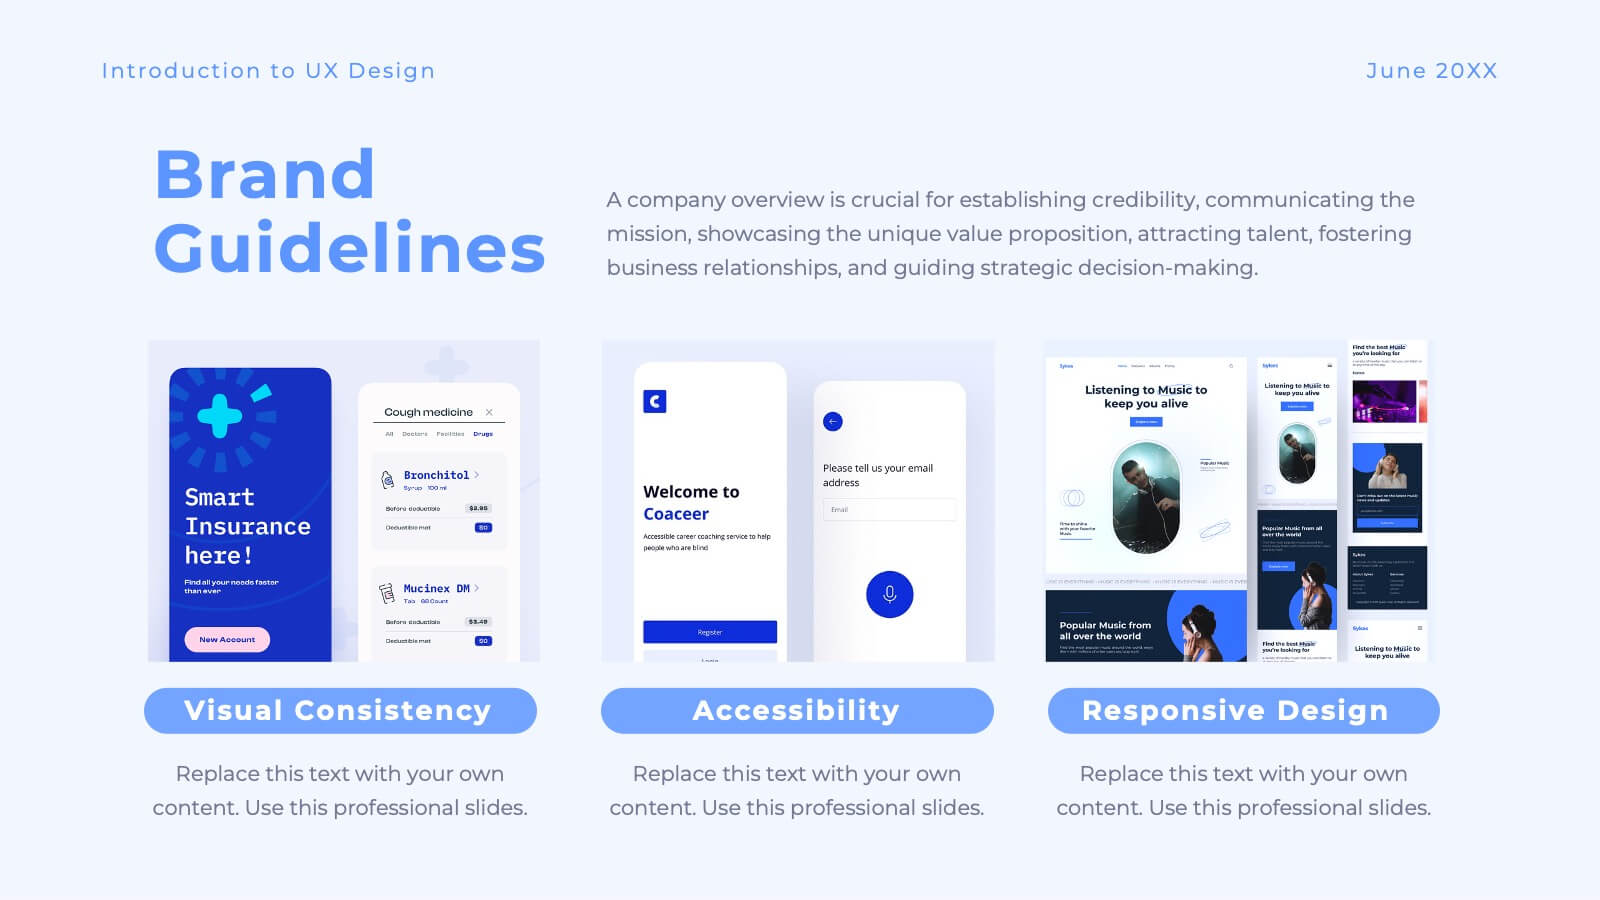
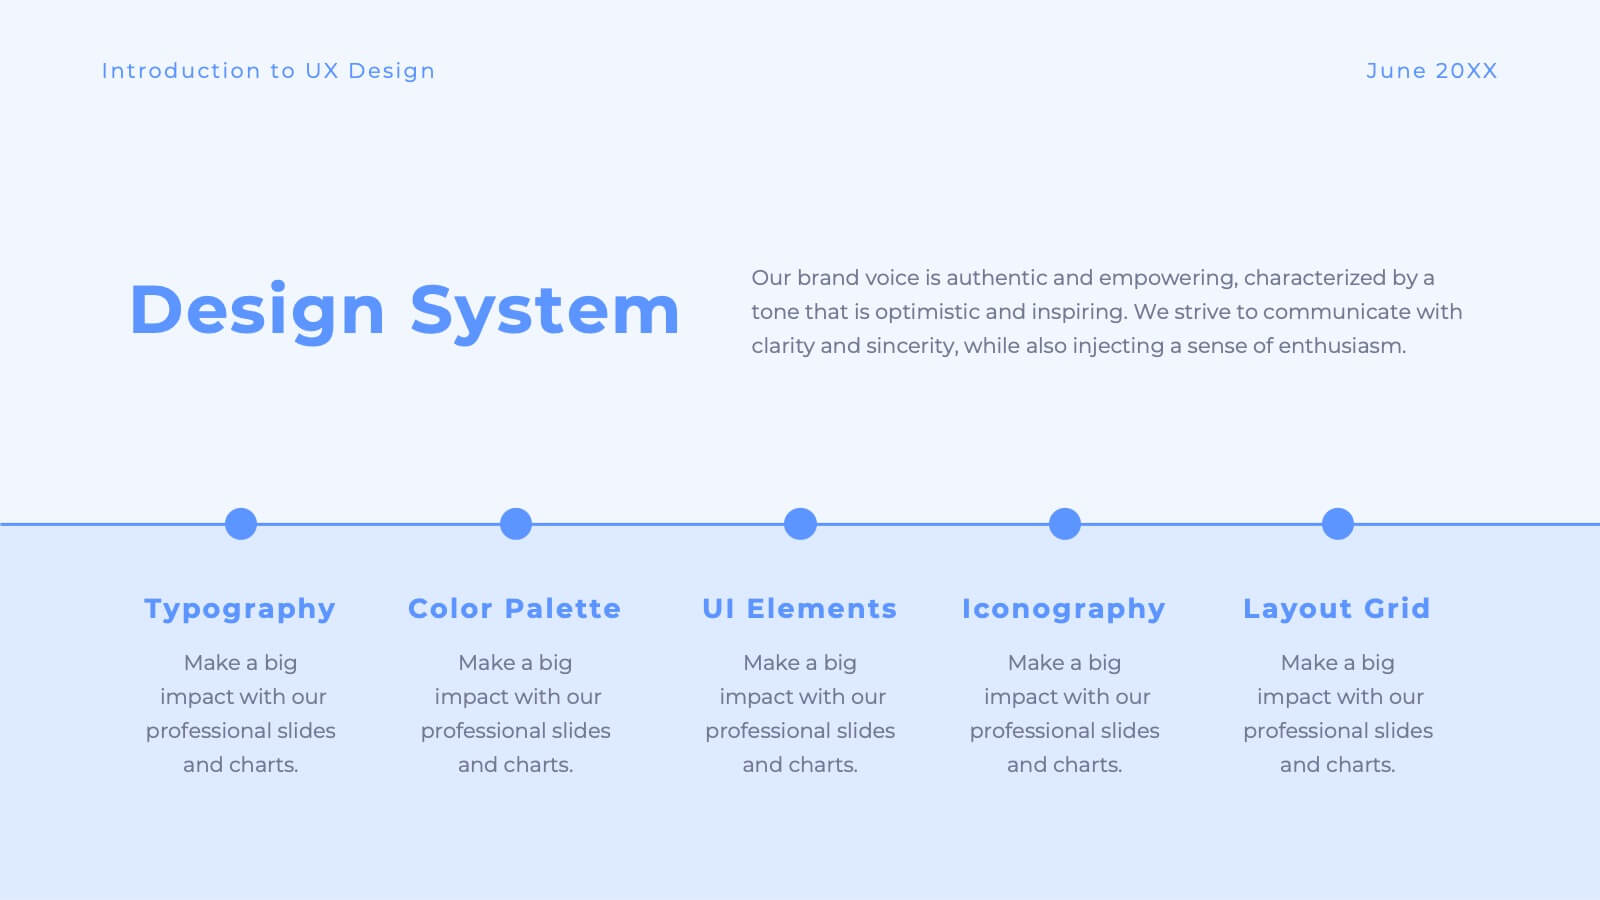
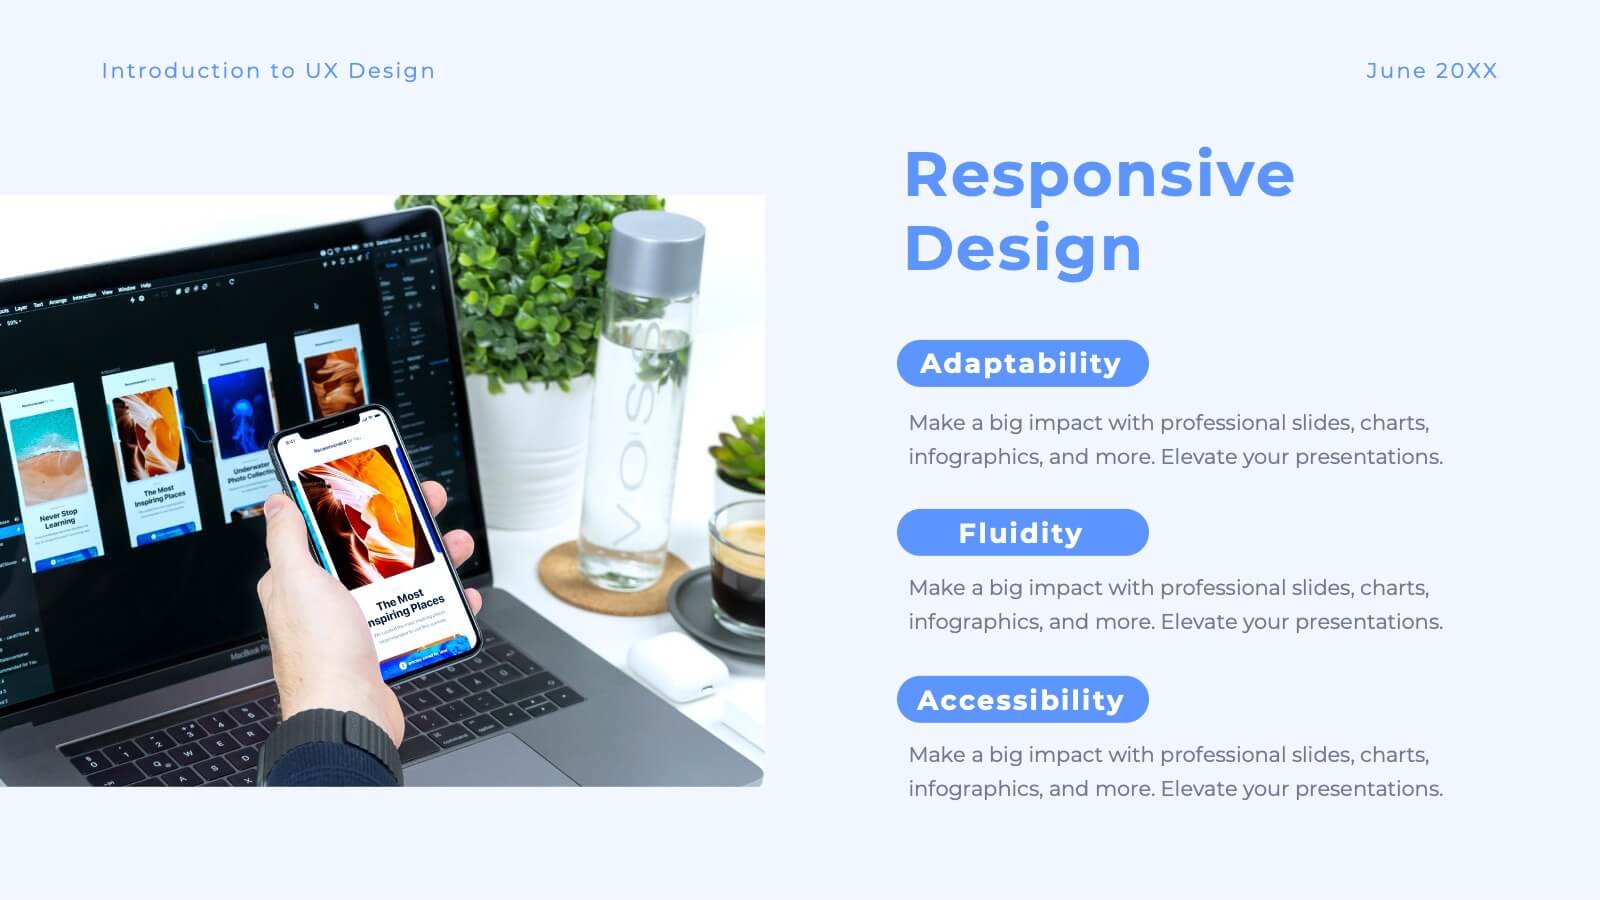
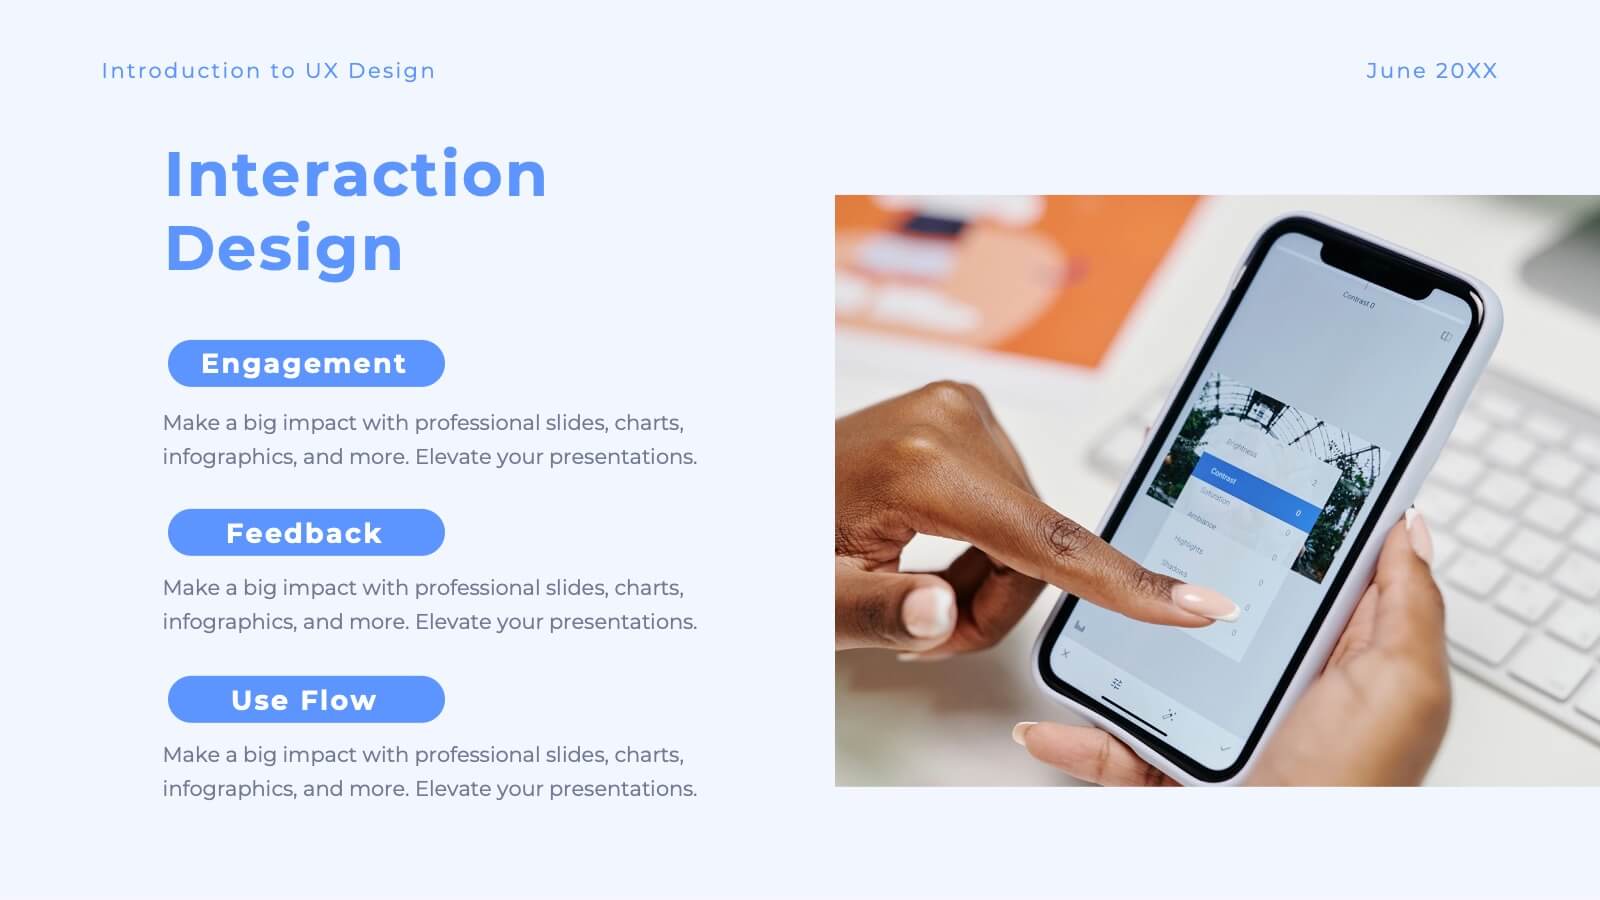
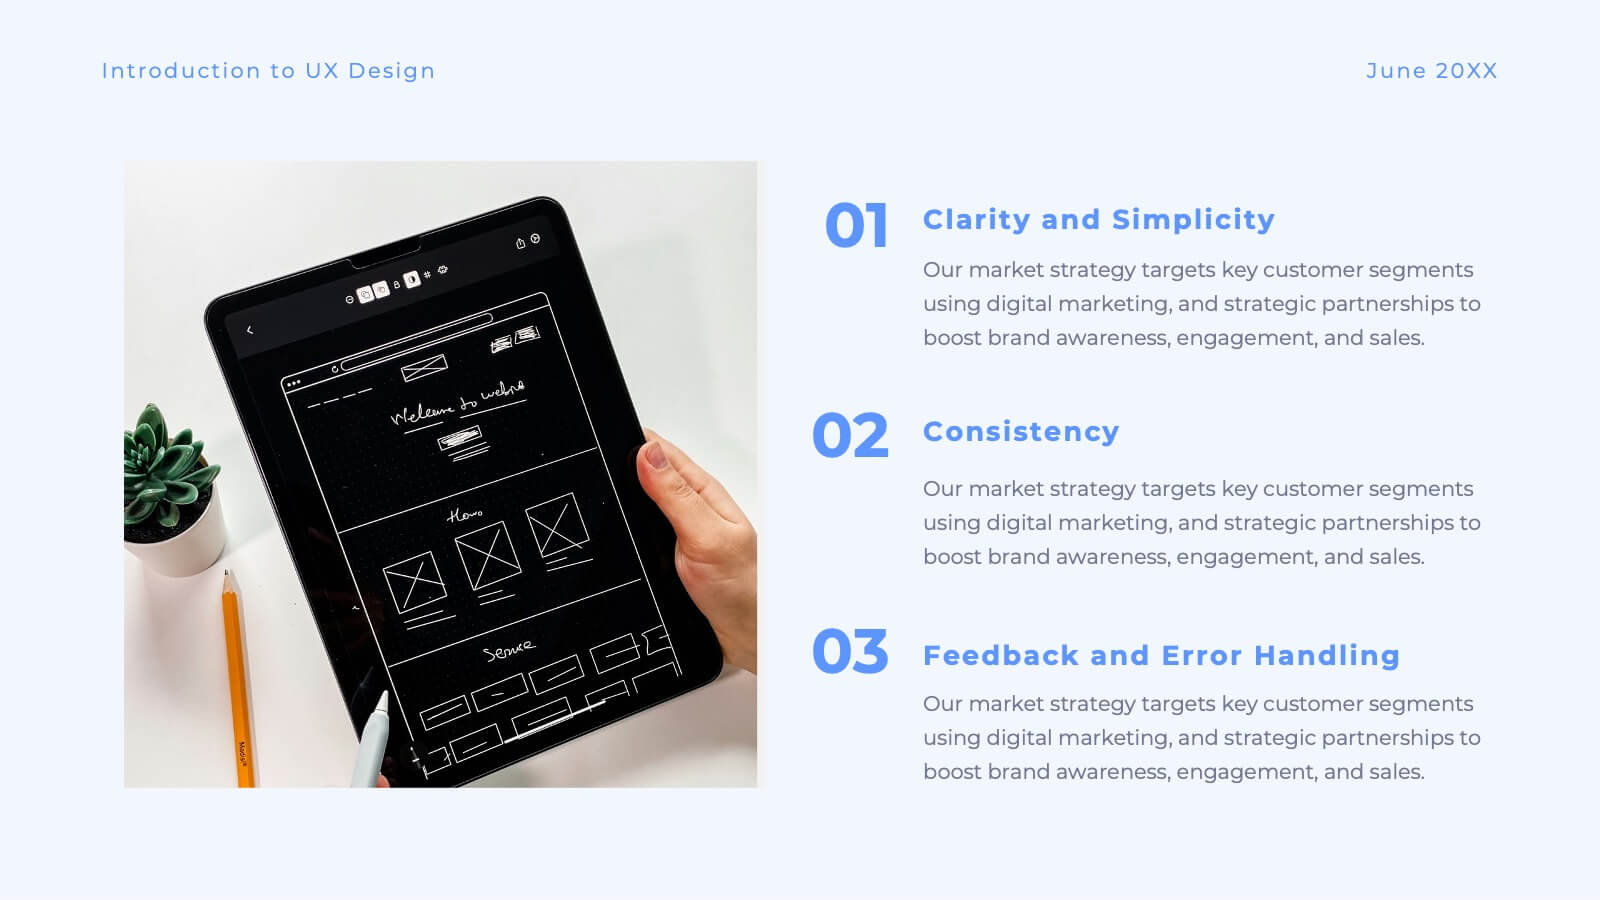
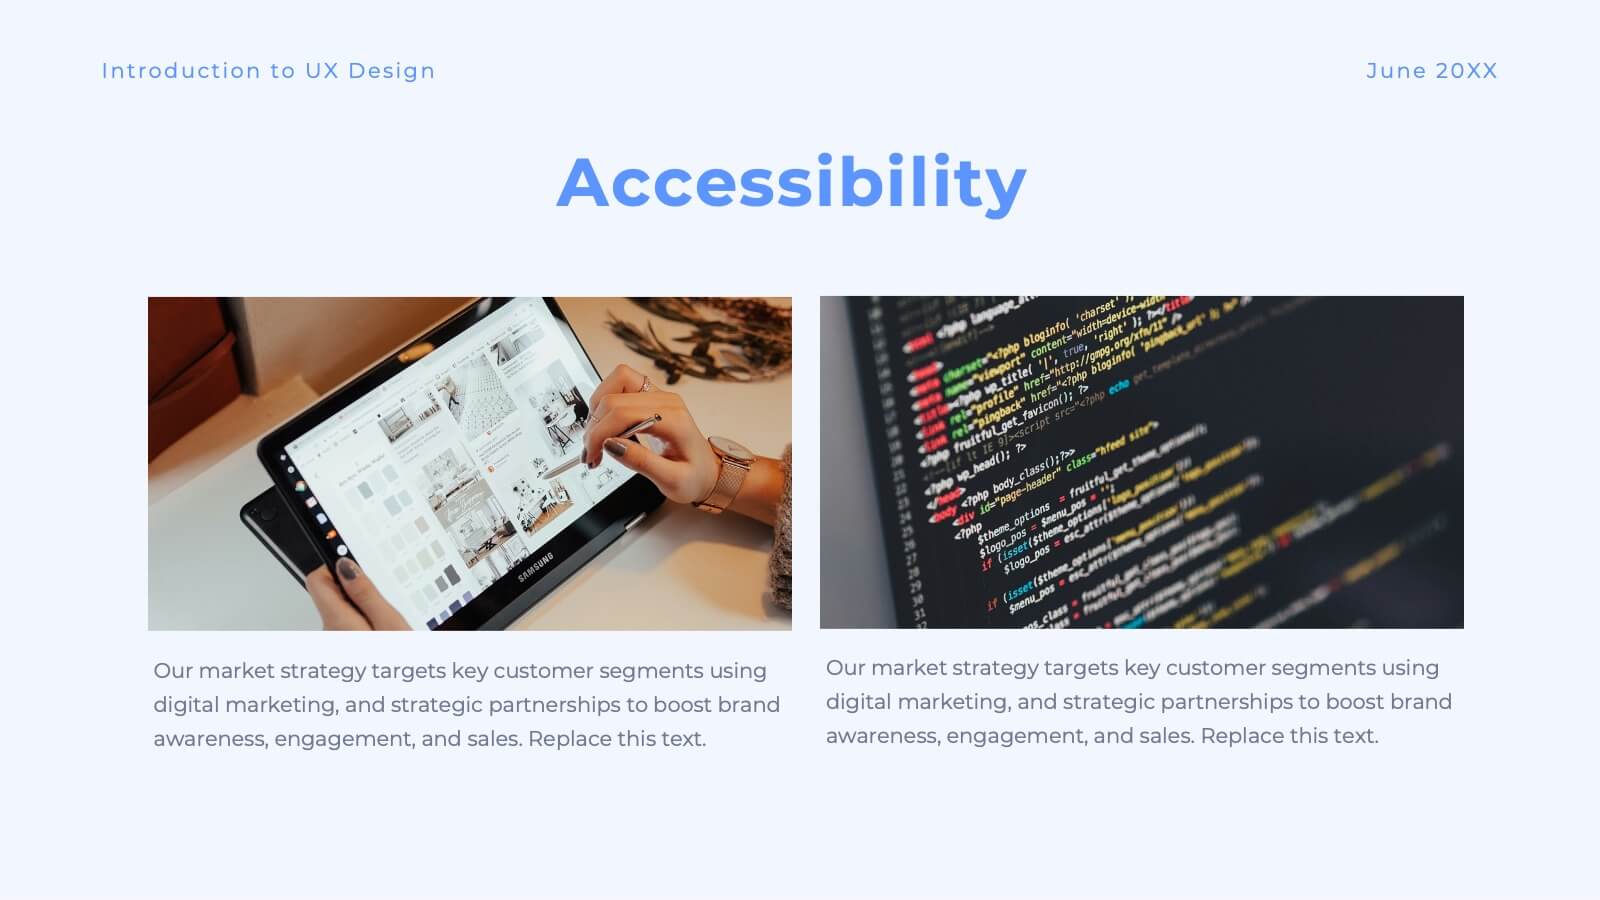
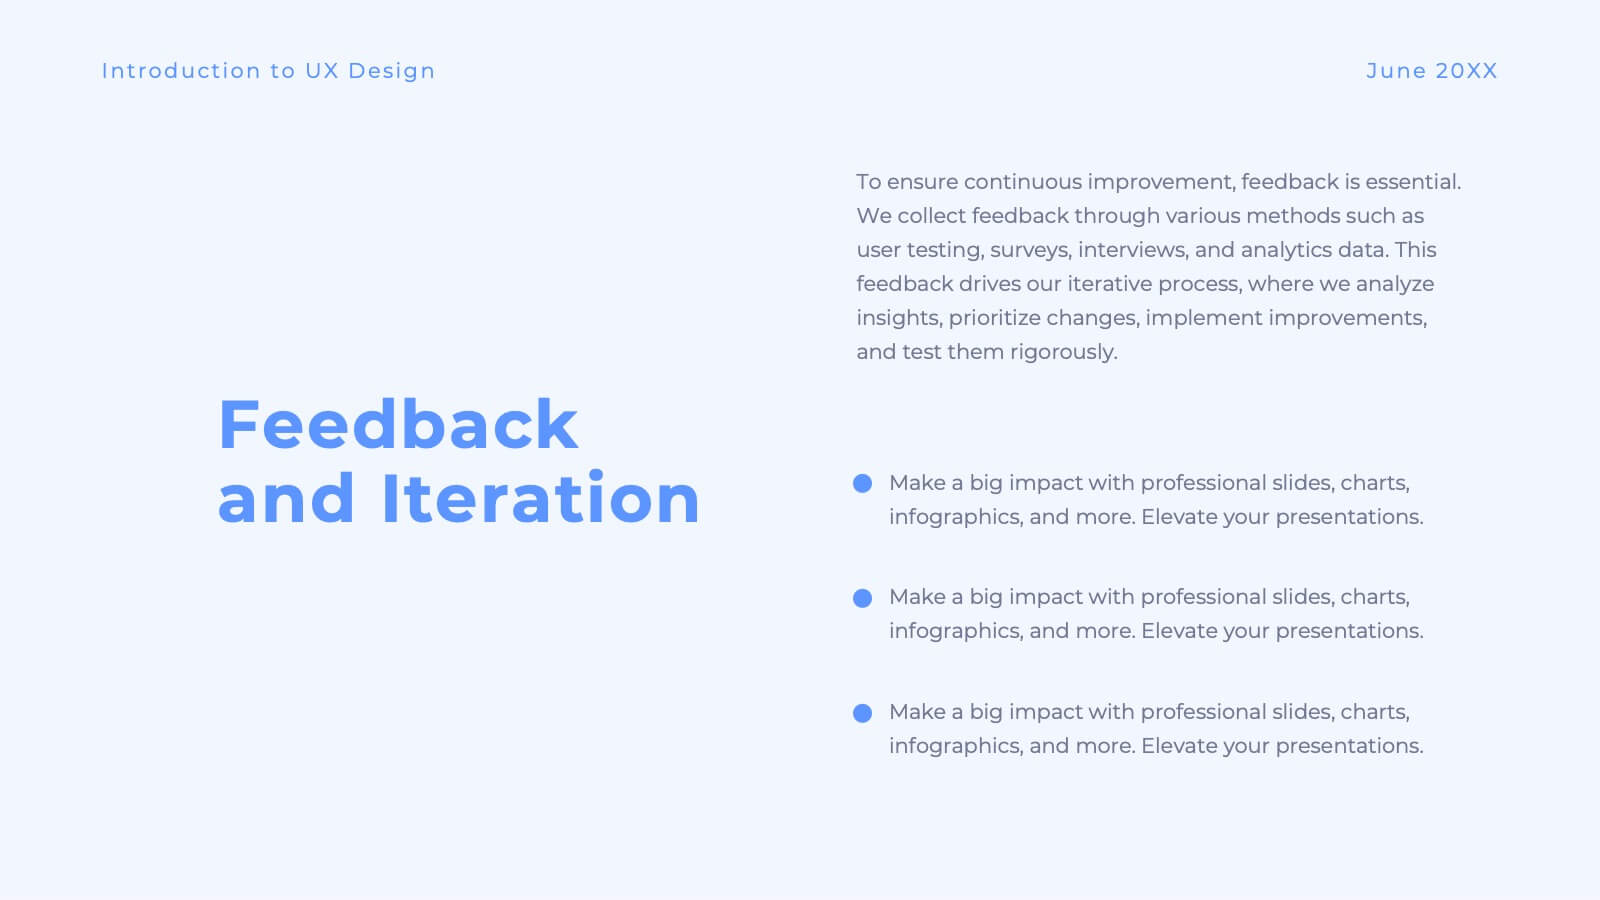
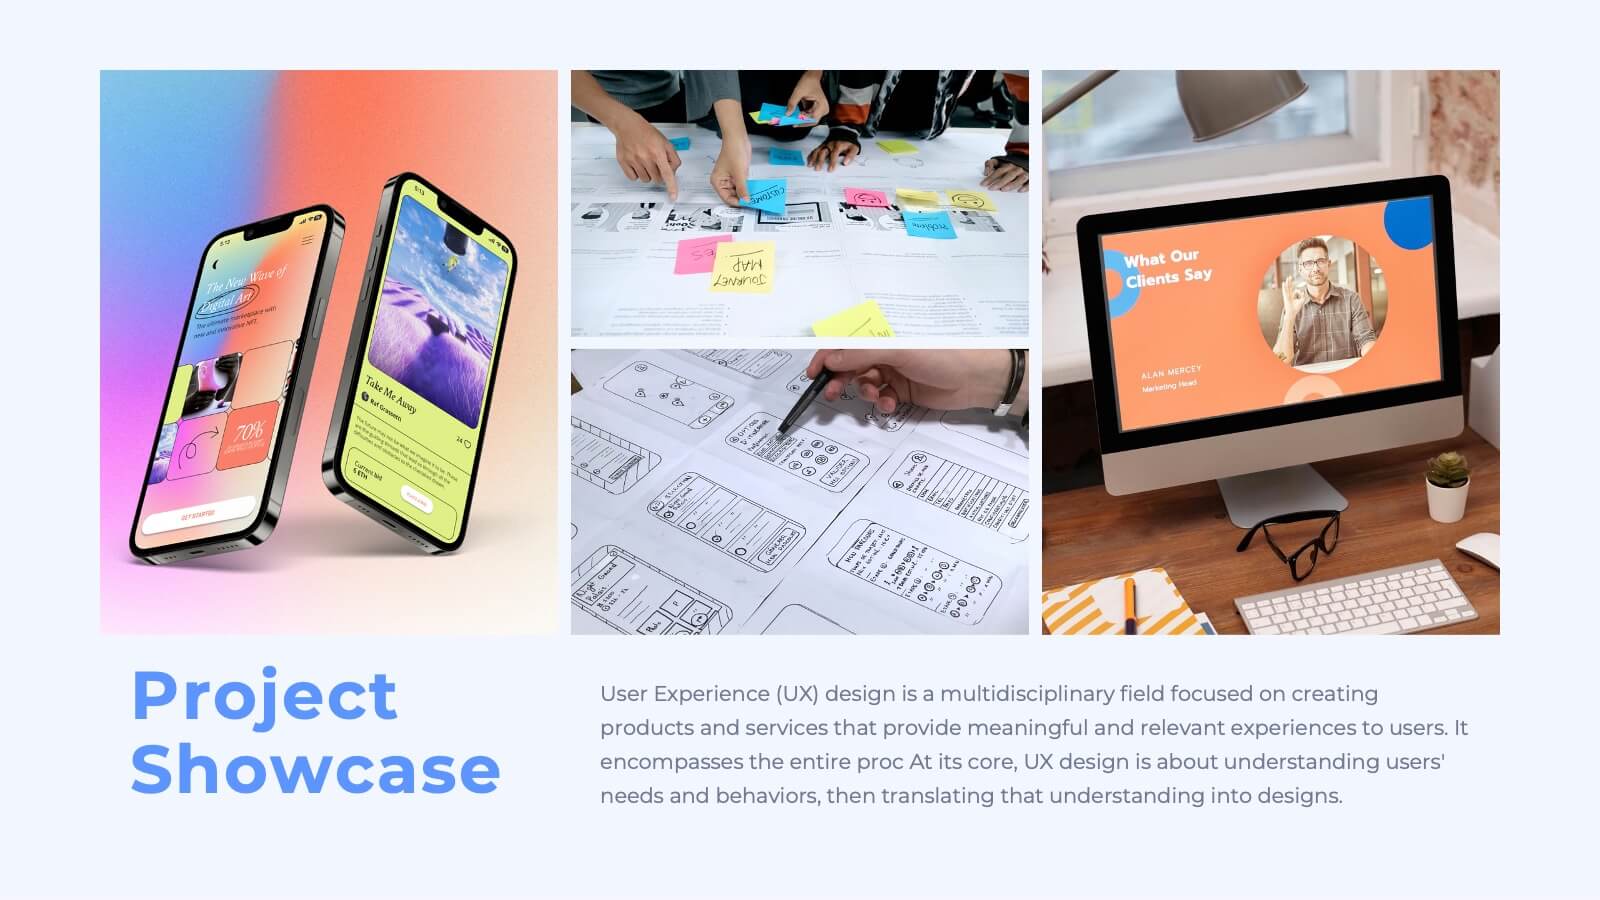
Luster UX Strategy Plan Presentation
Enhance user experience with this comprehensive UX strategy template! Perfect for outlining user research, personas, and design principles. Ideal for UX/UI designers aiming to present their strategies effectively. Compatible with PowerPoint, Keynote, and Google Slides, this template ensures your UX presentations are clear, professional, and impactful. Create exceptional user experiences today!


4 diapositivas
Restaurant Menu Design Showcase Presentation
Showcase your food offerings with this stylish Restaurant Menu Design Template. Divided into clear sections—Menu, Drinks, and Desserts—it’s perfect for restaurants, cafés, or pop-up events. Fully editable in PowerPoint, Keynote, and Google Slides, this layout lets you present items cleanly with bold titles and organized structure for easy viewing.


10 diapositivas
Modern Healthcare Technology Trends Presentation
Highlight innovations in healthcare with the Modern Healthcare Technology Trends Presentation. This slide features a central device graphic connected to four key icons, perfect for showcasing digital tools, emerging trends, or medical tech strategies. Fully customizable in Canva, PowerPoint, Keynote, and Google Slides—ideal for medical tech briefings and strategic presentations.


6 diapositivas
Digital Marketing Agency Infographic
Digital marketing refers to the use of digital channels, platforms, and technologies to promote products, services, or brands to a target audience. This infographic can help showcase the services your agency offers, your expertise, and the benefits of choosing your agency for digital marketing needs. This template is fully customizable and compatible with Powerpoint, Keynote, and Google Slides. Use icons, illustrations, and images to represent different digital marketing services and concepts. Create sections that detail the various digital marketing services your agency provides.


4 diapositivas
Cyber Threat Prevention Strategies Presentation
Clearly communicate your cybersecurity roadmap using this sleek timeline-style slide design. Each step is represented by a distinct icon and color-coded milestone, ideal for outlining protocols such as threat detection, employee training, or system hardening. Designed for IT teams, security analysts, and corporate risk departments. Fully editable and compatible with PowerPoint, Keynote, and Google Slides.