


Características


¿Tienes alguna pregunta?
Recomendar


7 diapositivas
Smart House Concept and Design Layout Presentation
Present your smart home innovations with the Smart House Concept and Design Layout Presentation. This slide features a central house icon and six circular nodes, ideal for explaining home automation systems, IoT integrations, or security features. Fully editable in Canva, PowerPoint, Keynote, and Google Slides—perfect for tech startups, product demos, and future living pitches.


4 diapositivas
Butterfly Comparison Chart Presentation
Bring clarity to your comparisons with a sleek, balanced design that highlights both sides of your data. This presentation is perfect for showing pros and cons, alternatives, or performance metrics in a visually engaging way. Fully customizable and compatible with PowerPoint, Keynote, and Google Slides.


6 diapositivas
Business Case Studies Analysis Presentation
Turn insights into impact with this clean and professional layout designed to showcase real-world business challenges and results. Perfect for summarizing objectives, methods, and key outcomes, it helps you tell a clear and compelling story. Fully compatible with PowerPoint, Keynote, and Google Slides for easy customization and presentation.

21 diapositivas
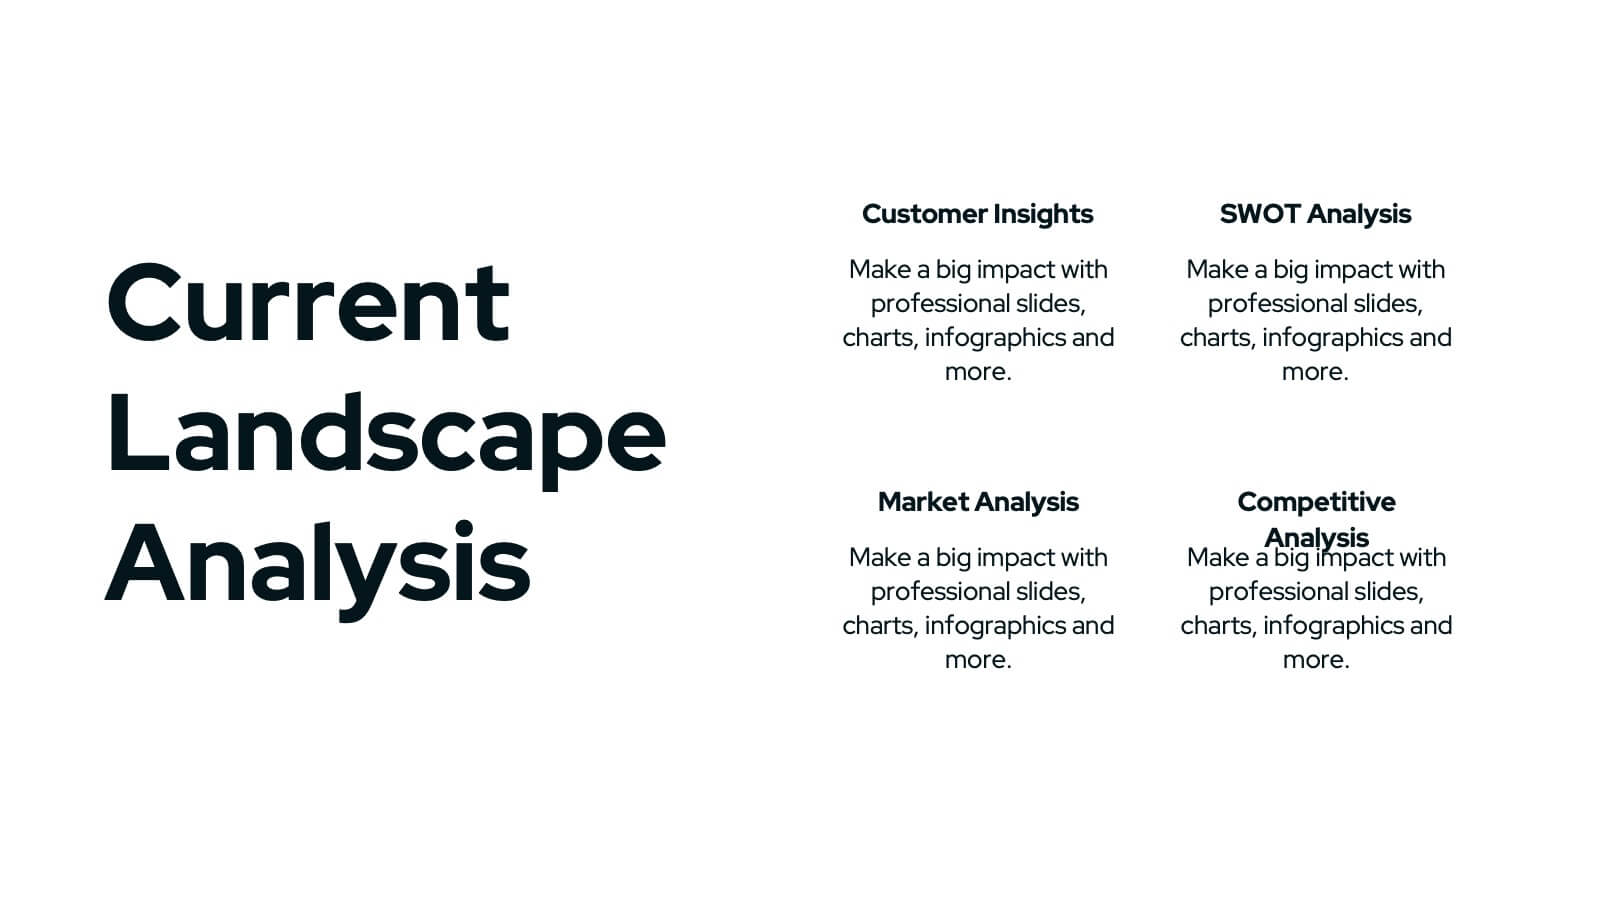
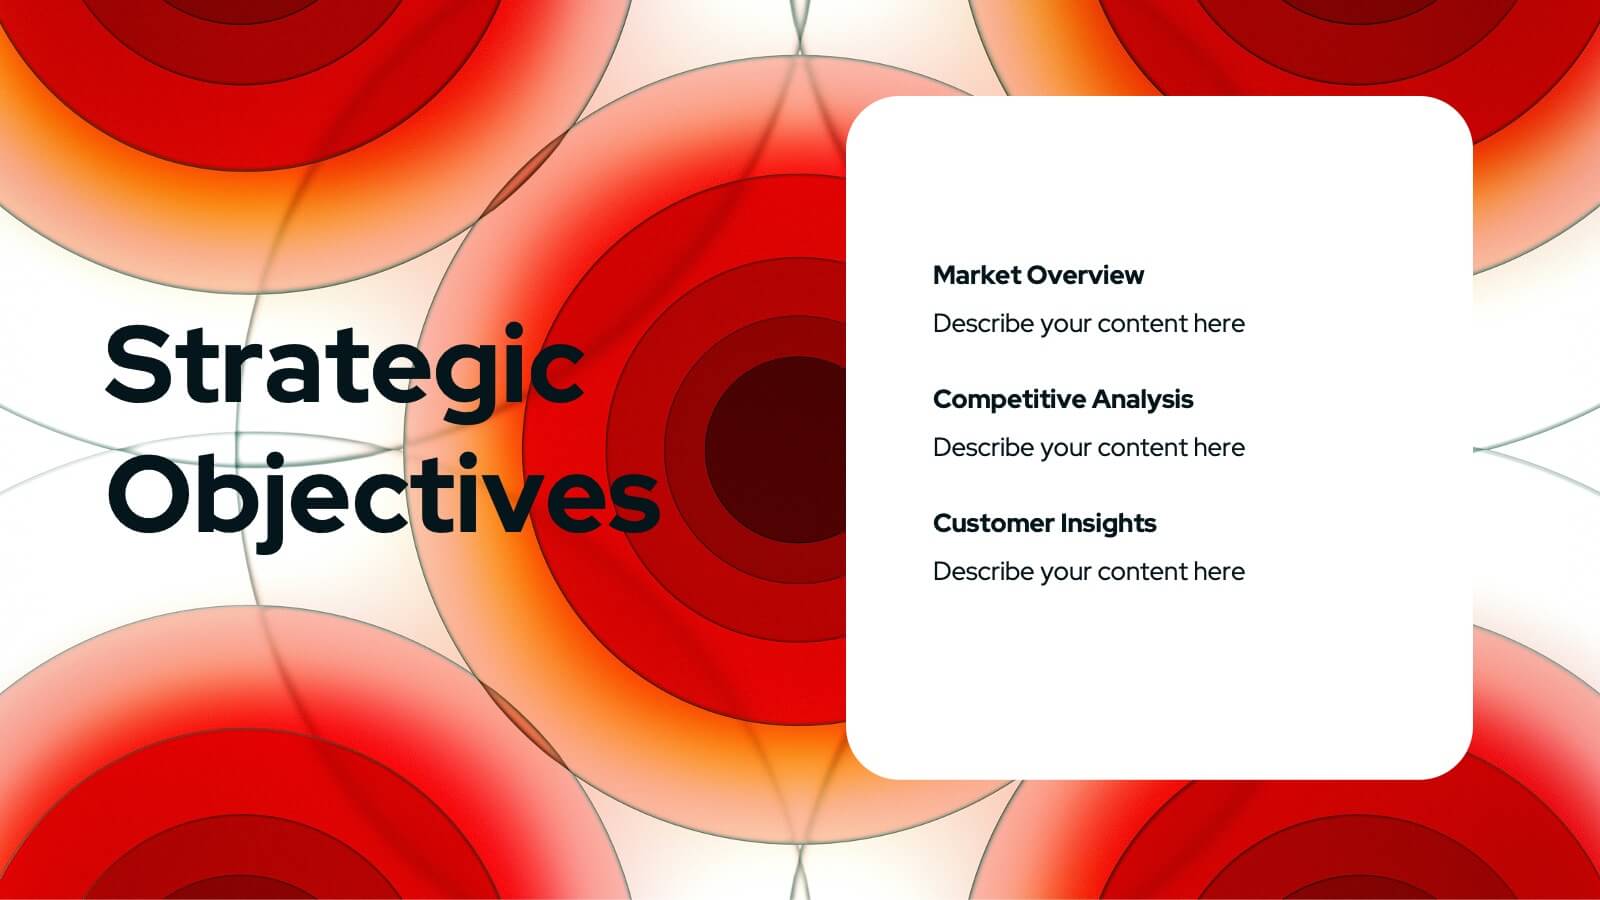
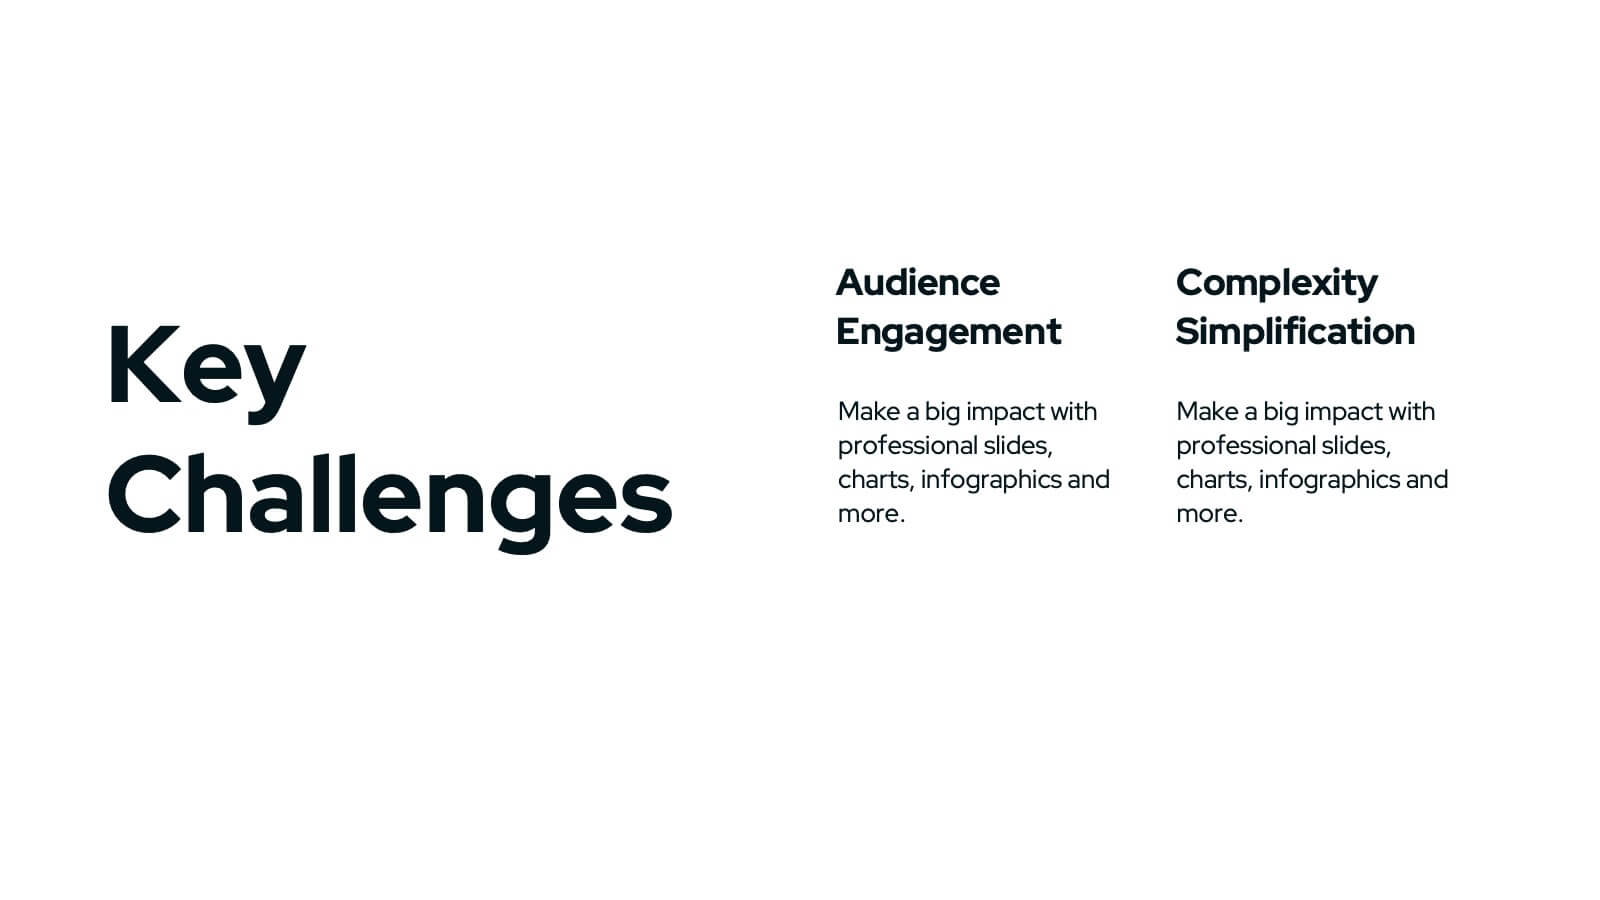
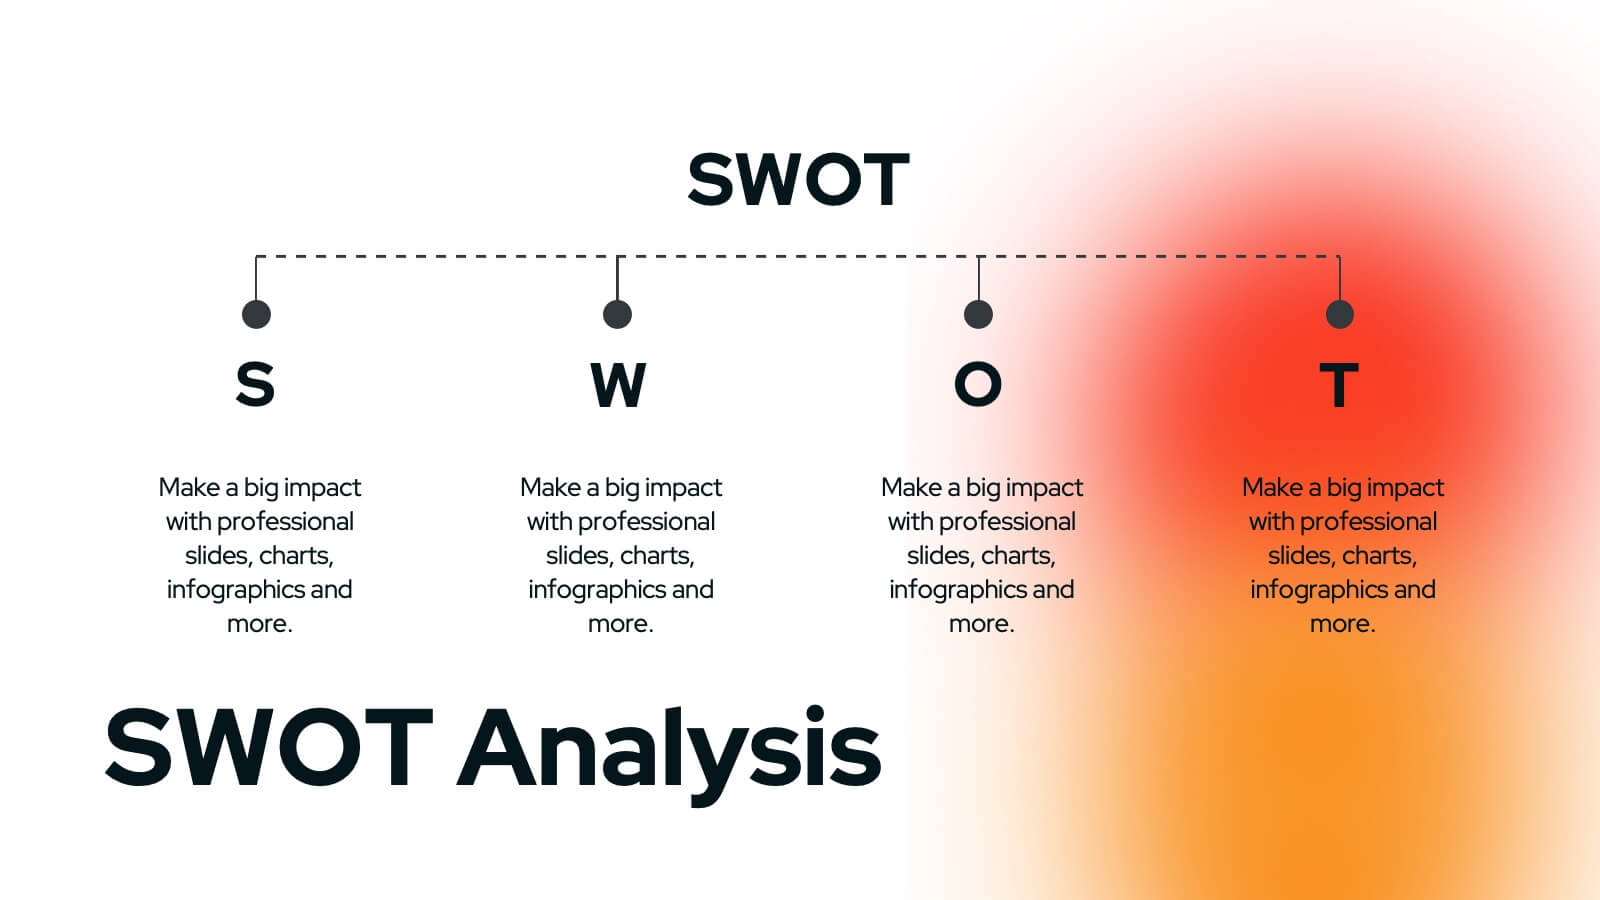
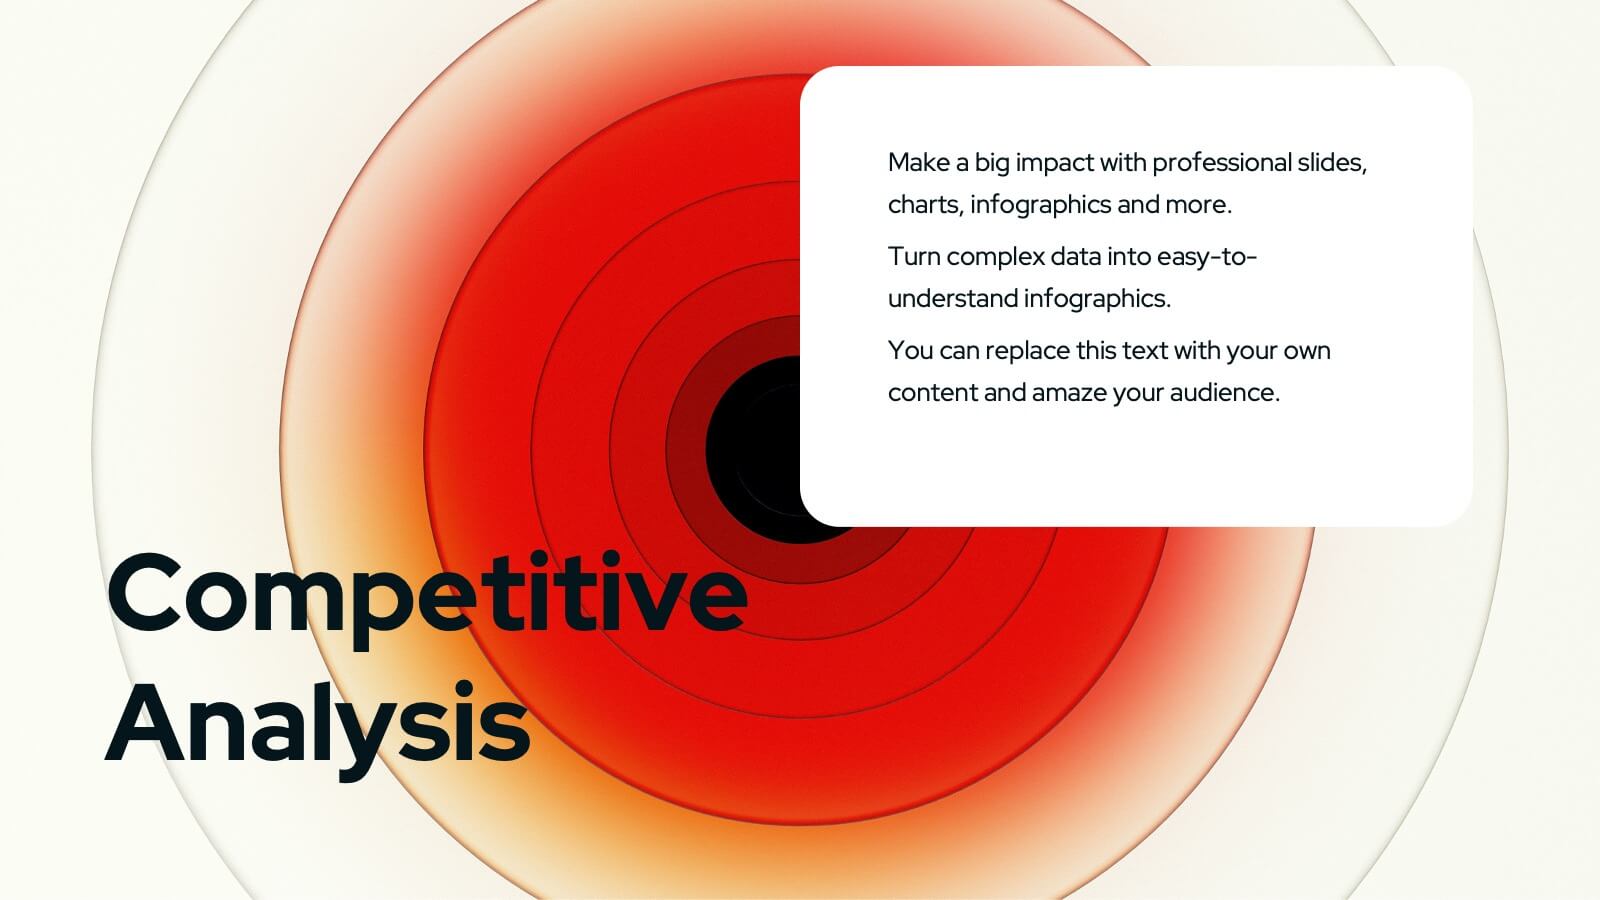
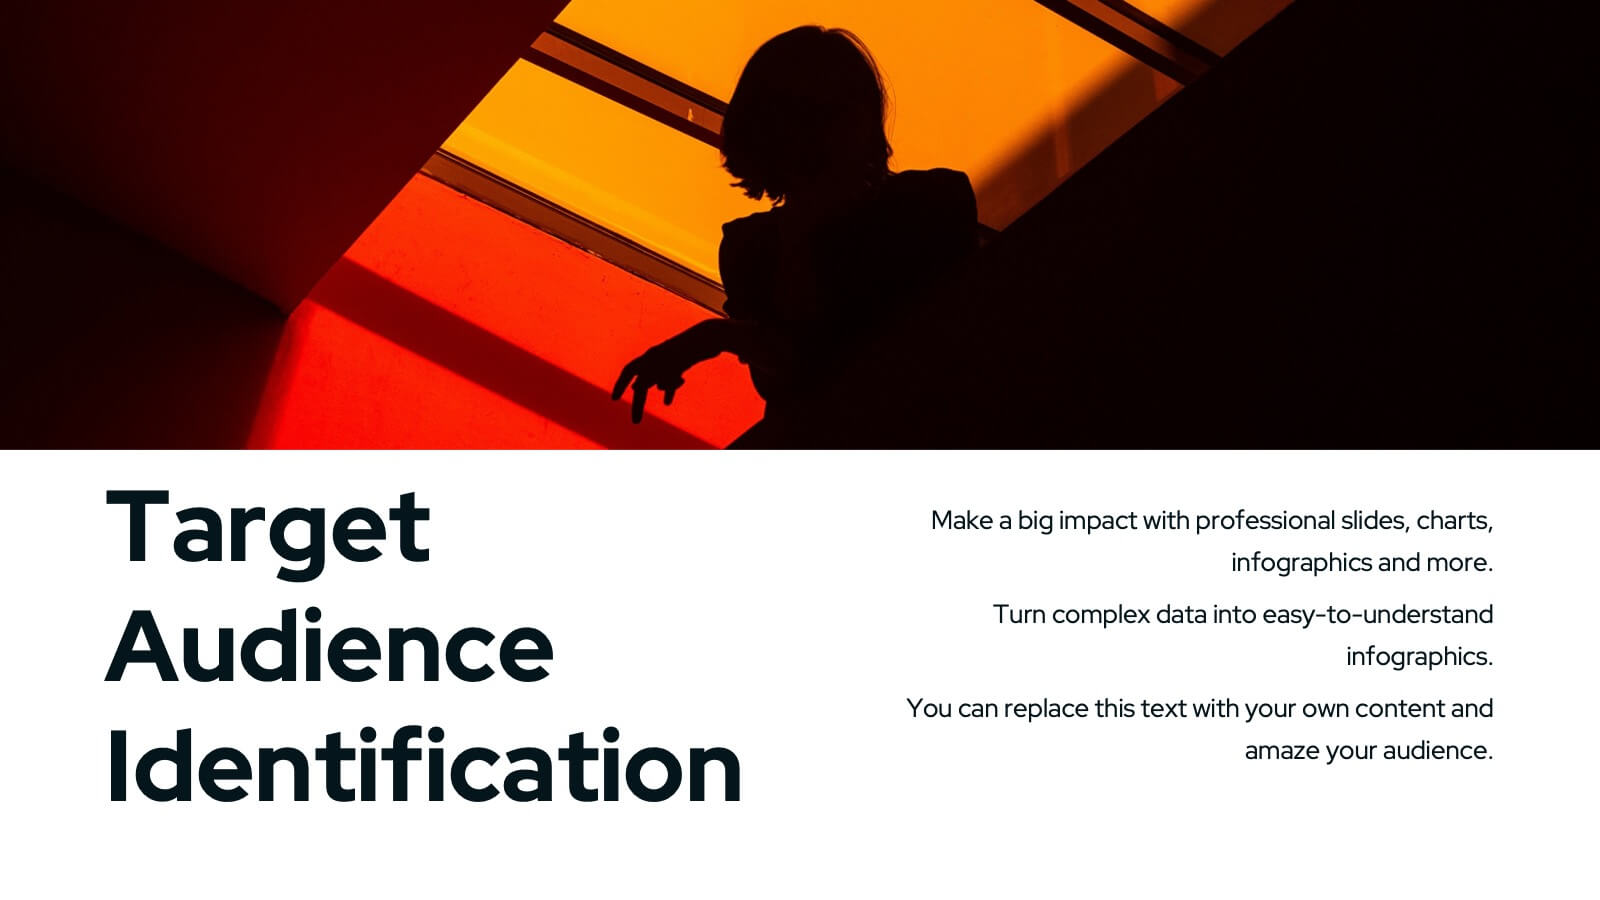
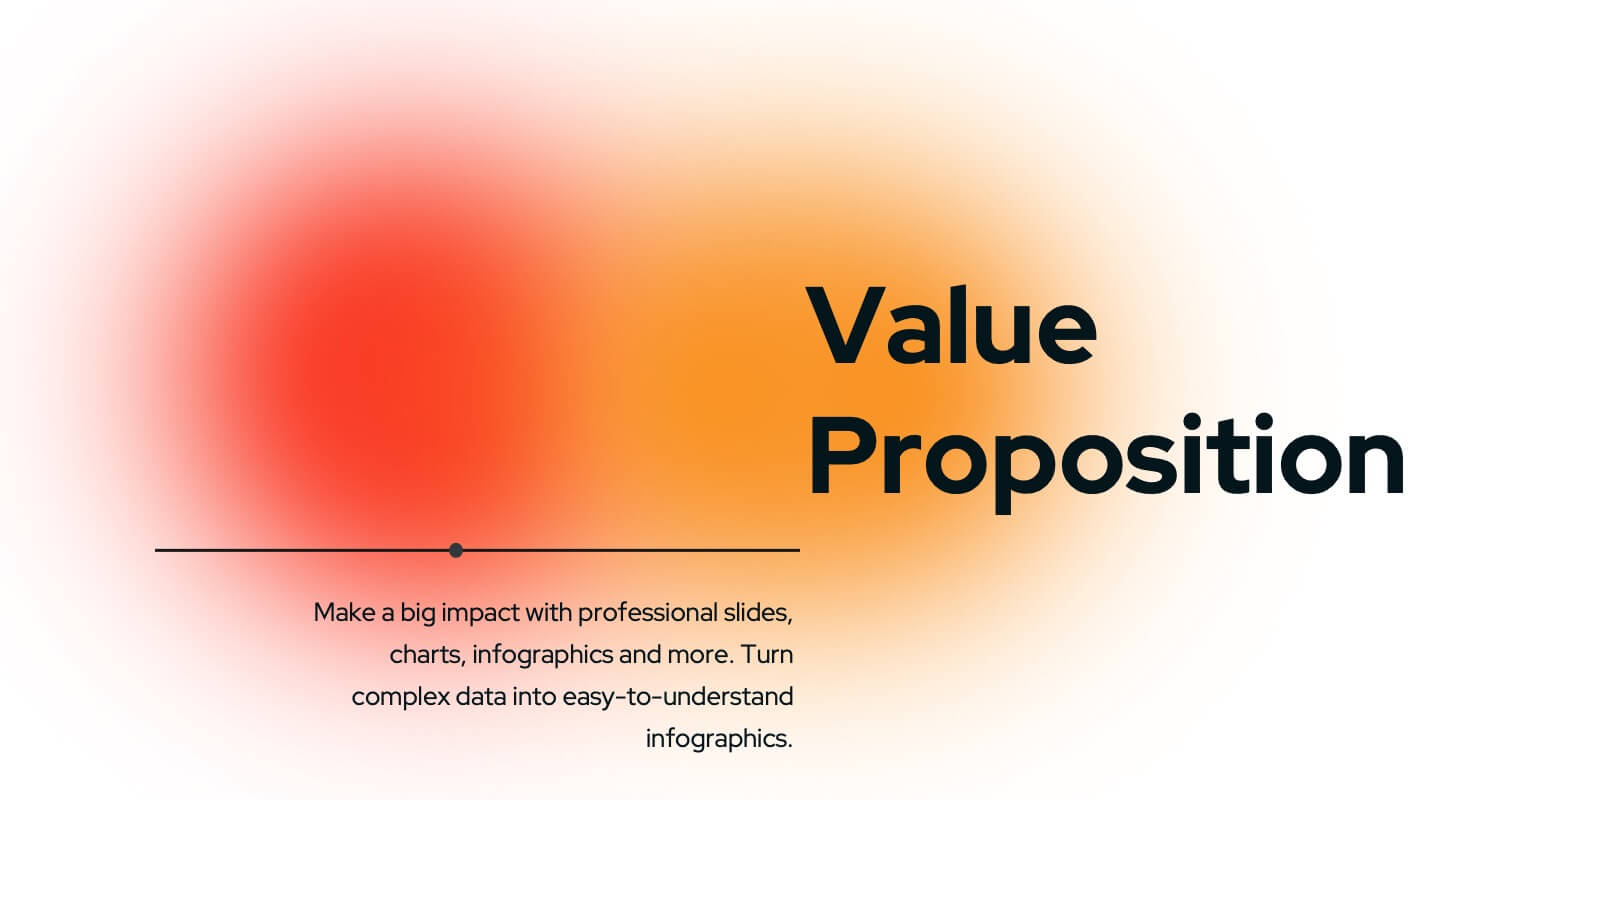
Wyrm Marketing Strategy Plan Presentation
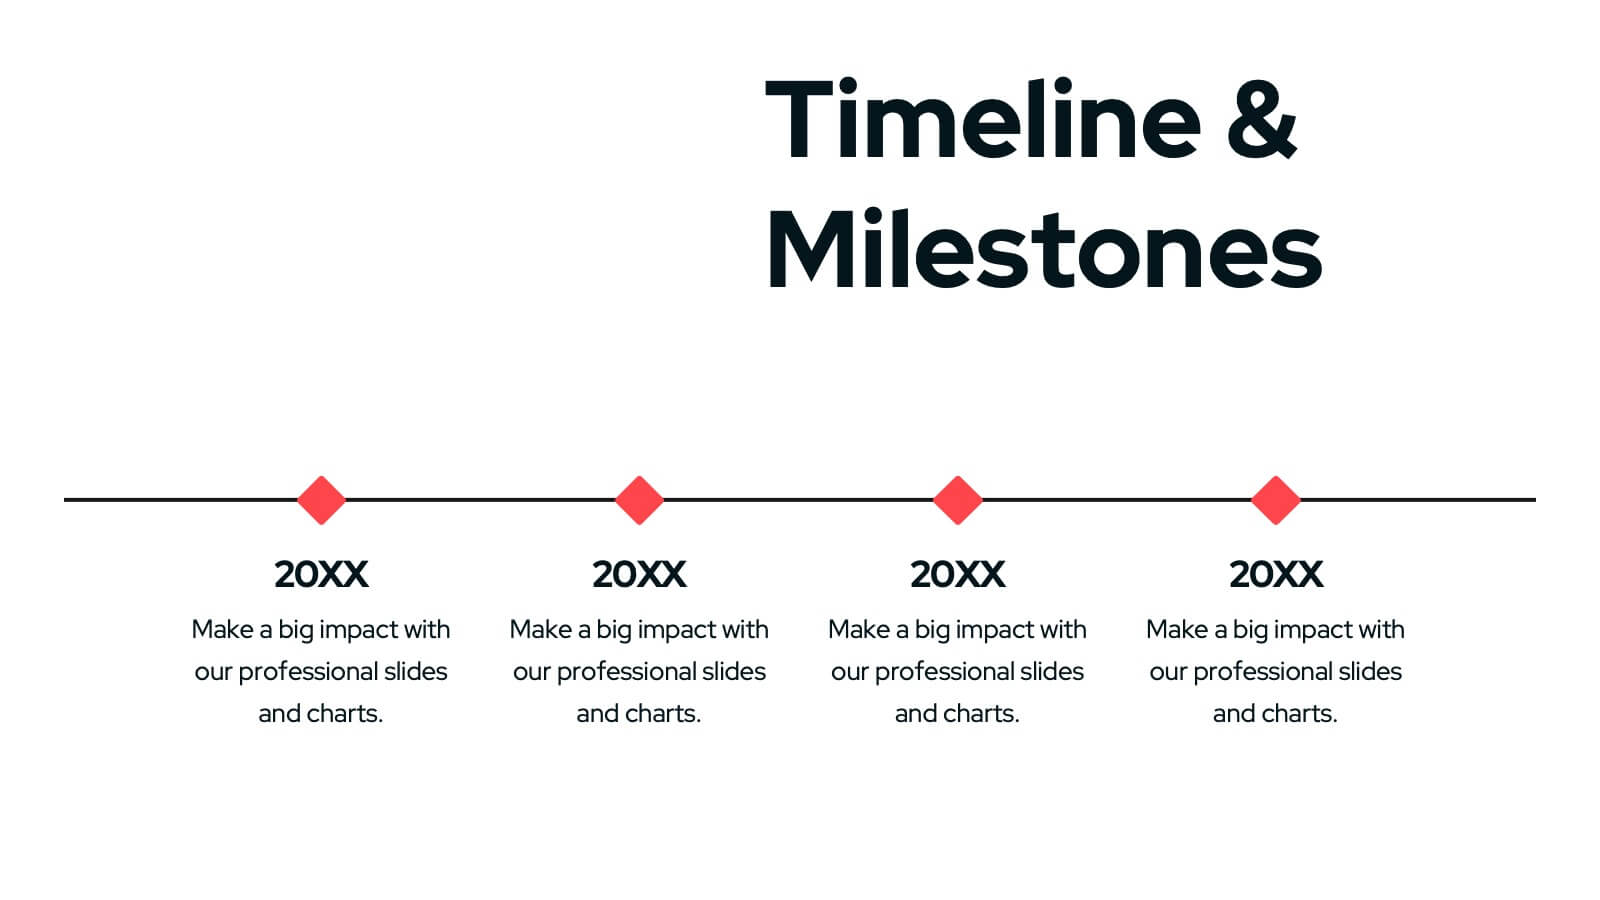
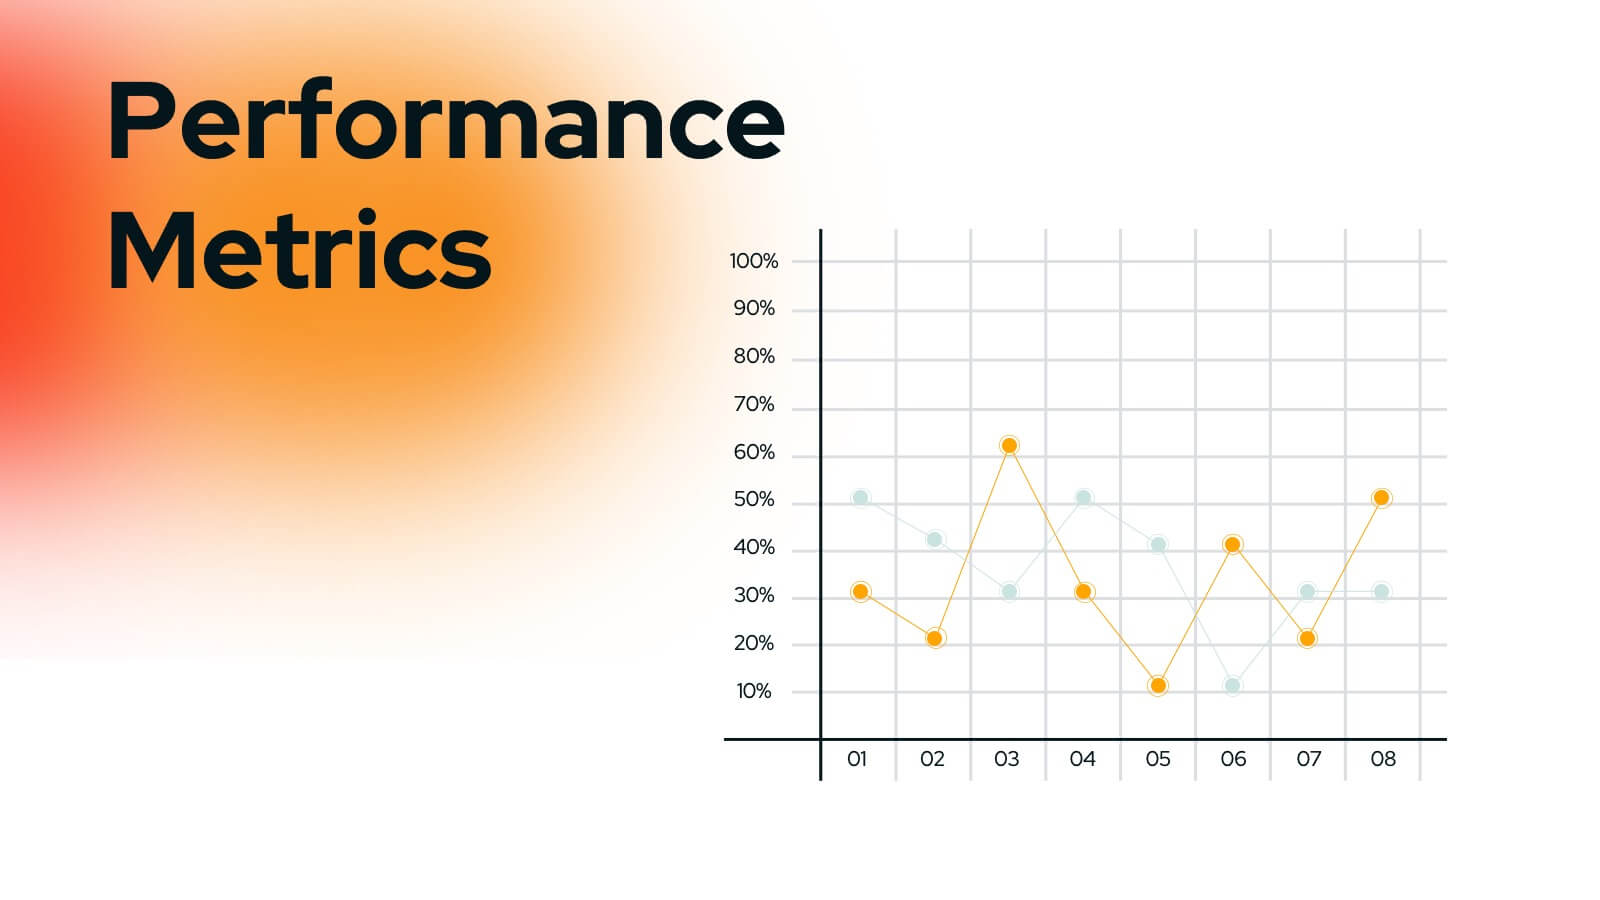
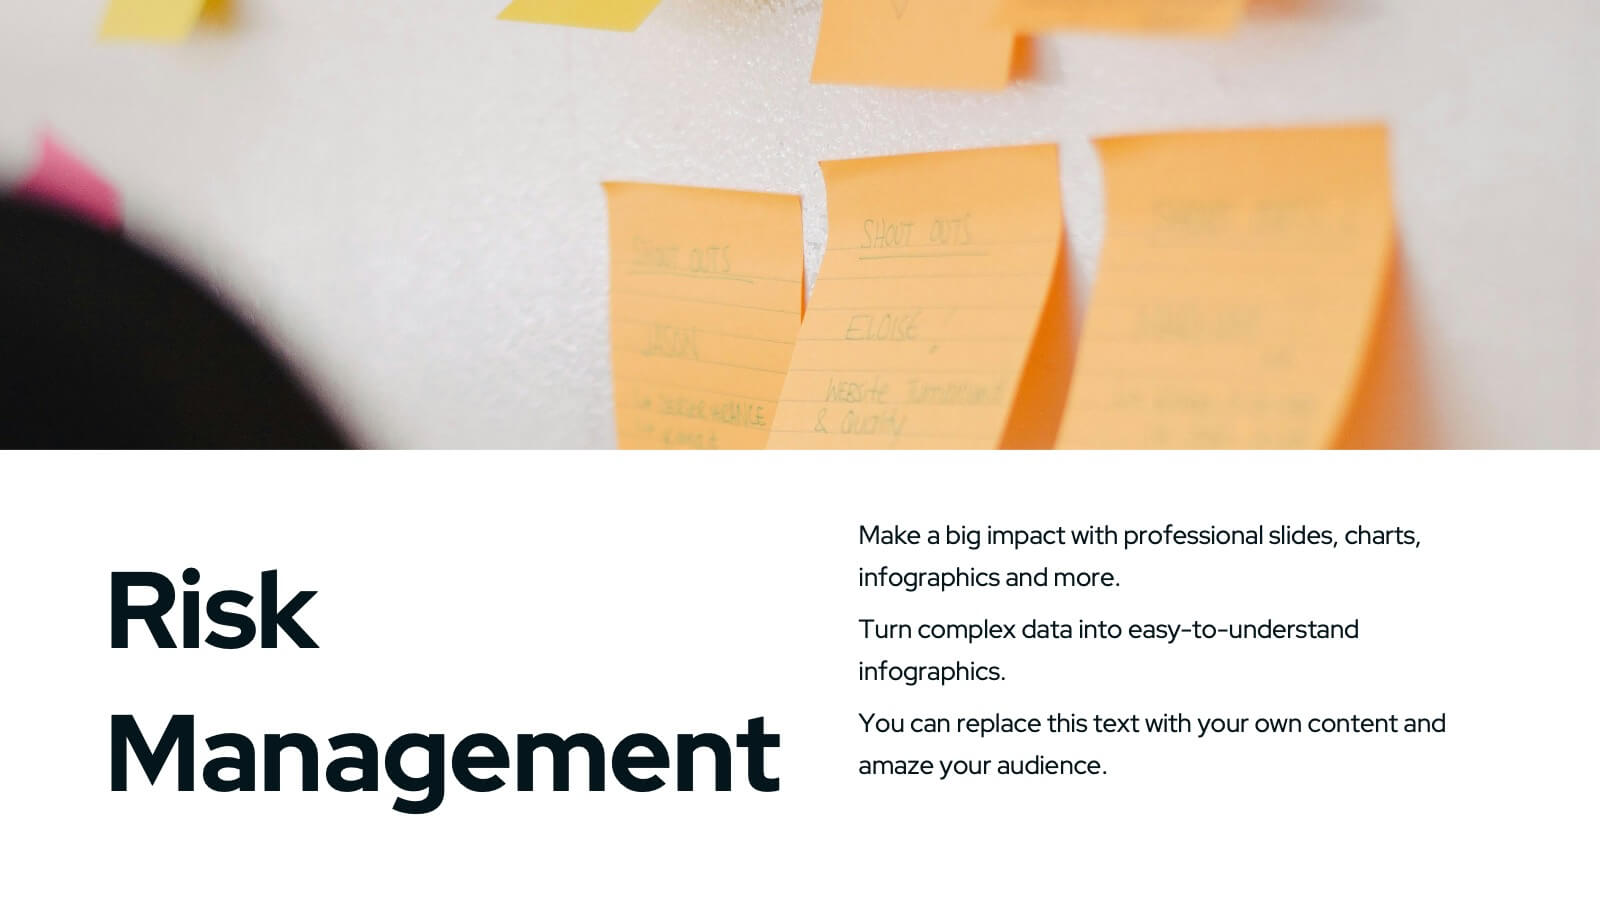
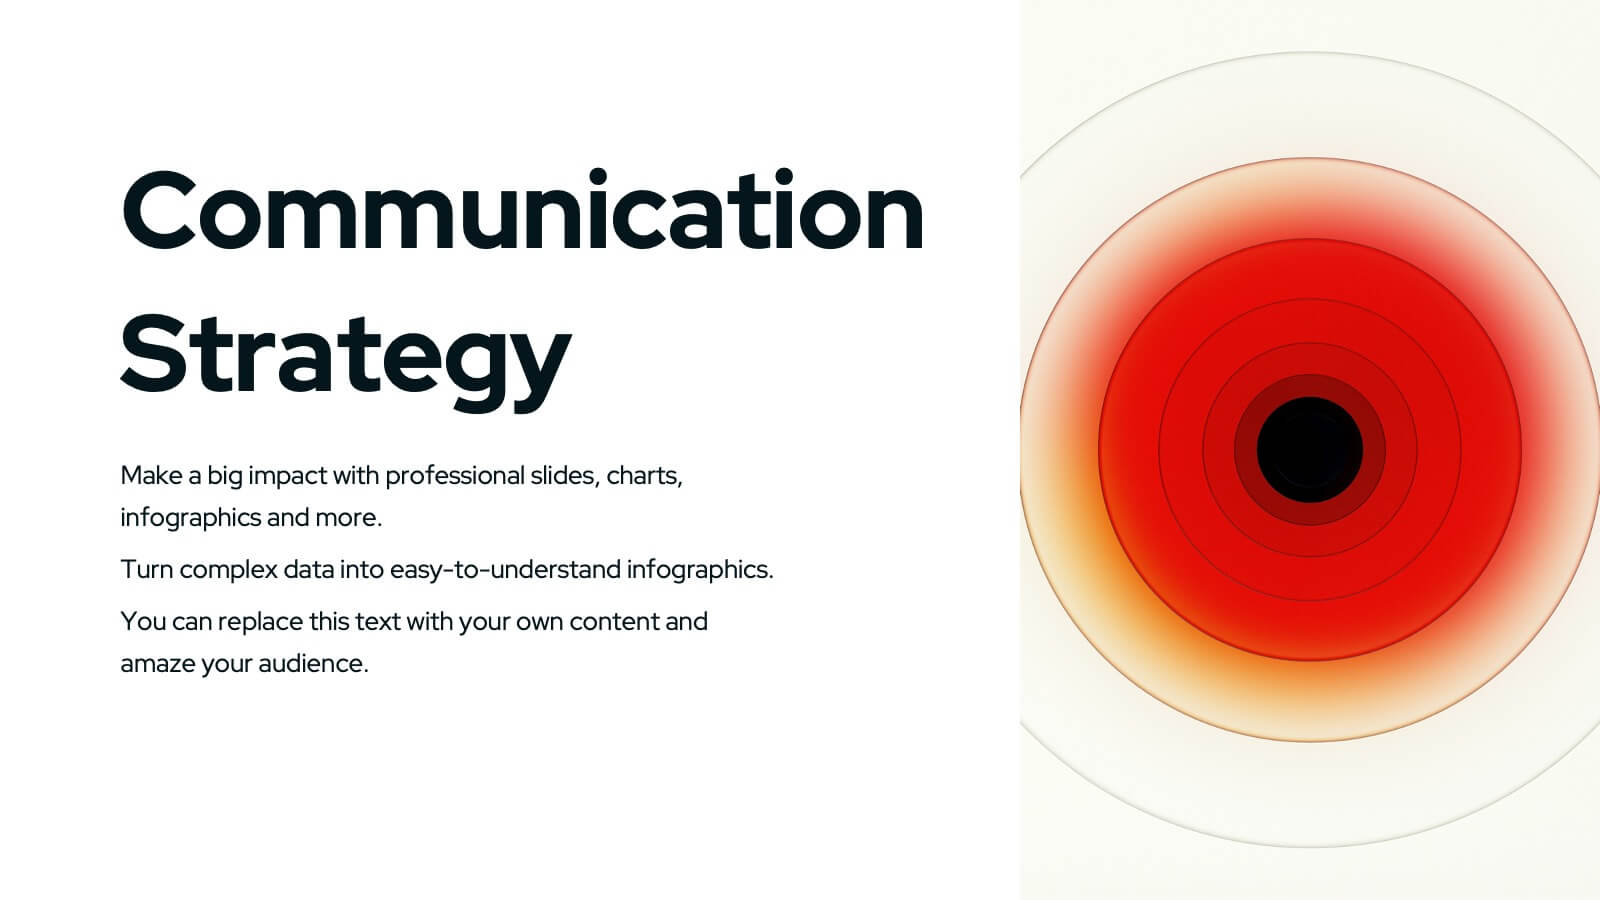
Unleash the power of your marketing strategy with this bold and dynamic presentation template! Perfect for covering everything from landscape analysis and target audience identification to performance metrics and risk management. This template helps guide your audience through key challenges, SWOT analysis, and strategic initiatives with clarity and impact. Compatible with PowerPoint, Keynote, and Google Slides for effortless and engaging presentations.


8 diapositivas
TAM SAM SOM Market Analysis Presentation
Define Your Market Potential Clearly with this TAM SAM SOM Market Analysis Presentation template. Designed to break down Total Addressable Market (TAM), Serviceable Available Market (SAM), and Serviceable Obtainable Market (SOM), this structured layout helps startups, investors, and business analysts showcase market opportunities and growth potential. Fully customizable and compatible with PowerPoint, Keynote, and Google Slides, this template is perfect for fundraising pitches, strategic planning, and competitive analysis.


6 diapositivas
Business Model Canvas Resources Infographic
Embark on a journey through the essential concept of the Business Model Canvas (BMC)! This infographic serves as your gateway to understanding how this versatile tool can revolutionize your business strategy. From identifying key elements to optimizing your business model, we reveal the secrets that make the BMC an invaluable resource. Discover how the BMC can guide you in crafting a sustainable and adaptable business strategy. Learn to align your resources, activities, and customer focus to achieve competitive advantage. Explore real-world examples of successful businesses that have leveraged the BMC to innovate and grow. With this engaging infographic, compatible with PowerPoint, Keynote, and Google Slides, sharing your understanding of the Business Model Canvas is effortless. Empower yourself with the knowledge to revolutionize your business approach. Dive into the world of the BMC and embark on a journey of strategic exploration and innovation.


10 diapositivas
Project Lifecycle Planning Overview Presentation
Guide your team through every project stage with the Project Lifecycle Planning Overview Presentation. Featuring a four-phase circular flow layout, this template helps visualize key milestones—from initiation to completion. Ideal for project managers, consultants, and strategic teams. Fully customizable and compatible with PowerPoint, Keynote, Google Slides, and Canva.


4 diapositivas
Insurance Services Overview Presentation
Present your offerings with clarity using this Insurance Services Overview slide. Ideal for explaining coverage tiers, policy types, or service options. The clean umbrella graphic adds a strong visual metaphor for protection. Fully customizable and compatible with PowerPoint, Keynote, and Google Slides for use across any insurance or finance presentation.


4 diapositivas
Classroom Learning Presentation
Break down learning objectives or teaching concepts with this Classroom Learning Presentation. Featuring a visual of a presenter pointing to a board, the layout includes three content areas labeled A, B, and C—perfect for organizing lesson points or training steps. Ideal for educators, trainers, and instructional designers. Fully customizable and compatible with PowerPoint, Keynote, and Google Slides.


7 diapositivas
Executive Summary Plan Infographic Presentation
An Executive Summary Infographic is a visual representation of the key points and highlights of a longer report or document. Use this creative template as a way to present complex information in a simplified and visually appealing way, allowing busy executives and decision-makers to quickly understand the main findings and recommendations. This template includes a mix of charts, graphs, and other visual elements, along with text. This template's purpose is to help busy executives and decision-makers understand the main points of a report, without having to read through the entire document.


7 diapositivas
Puzzle Communication Infographic
Piece together the art of effective communication with our puzzle communication infographic. Set on a sleek white foundation, complemented by the enigma of purple, the zest of orange, and the passion of red, this template ingeniously utilizes puzzle pieces to symbolize interconnected communication elements. Enhanced with inventive infographics, representative icons, and adjustable image placeholders, it offers a comprehensive exploration of communication dynamics. Exquisitely crafted for Powerpoint, Keynote, or Google Slides. An indispensable tool for communication specialists, team leads, trainers, or anyone keen on enhancing interpersonal exchanges.


22 diapositivas
Helioshift Advertising Agency Proposal Presentation
Win clients and showcase your agency’s strengths with a compelling proposal! This presentation highlights sections like case studies, services, team structure, and market trends, ensuring a clear strategy to impress potential partners. Designed for both internal planning and client presentations, it’s fully compatible with PowerPoint, Keynote, and Google Slides.


4 diapositivas
Buyer Persona Research and Profile Map Presentation
Make your audience feel like they already know your ideal customer. This creative template helps you visually map out key buyer persona data, such as demographics, goals, behavior, and pain points. Perfect for marketing strategy and customer research presentations. Fully compatible with PowerPoint, Keynote, and Google Slides for seamless editing.


20 diapositivas
Wonderis Design Proposal Presentation
Deliver an impeccable pitch with this minimalistic and professional design proposal template. Crafted for designers, agencies, and creative professionals, this presentation allows you to seamlessly showcase your expertise, methodology, and deliverables. Walk your audience through a polished narrative that includes a project summary, proposed solutions, objectives, methodology, and timeline. Highlight your expertise with dedicated slides for team introductions, budget breakdowns, and pricing structures. Ensure confidence with risk mitigation strategies, references, and clear next steps to solidify trust in your approach. This template is fully editable and works flawlessly with PowerPoint, Google Slides, and Keynote, providing the flexibility you need to tailor your proposal to specific client needs. Perfect for client pitches, project proposals, and business presentations that need a sophisticated and concise design.


5 diapositivas
Business Executive Summary Report Presentation
Simplify your executive reporting with this 'Business Executive Summary Report' template, designed to present critical insights at a glance. This template streamlines complex data into digestible parts, ensuring clarity and impact in every slide. Perfect for executives and managers using PowerPoint, Keynote, and Google Slides.


6 diapositivas
Creative Interior Design Portfolio Showcase Presentation
Showcase your creativity with the Creative Design Portfolio Showcase presentation. This template is perfect for graphic designers, architects, and creative professionals looking to display their work in a visually compelling format. Featuring modern layouts, high-quality image placeholders, and structured text sections, it allows for easy customization to highlight key insights. Fully compatible with PowerPoint, Keynote, and Google Slides.


6 diapositivas
Geometric Distribution Infographic
The geometric distribution is a probability distribution that models the number of trials needed for a specific event to occur for the first time in a sequence of independent and identically distributed Bernoulli trials. This Infographic template is a visual representation of the geometric distribution, which is a probability distribution that models the number of Bernoulli trials required for a success to occur. This is can be used in scenarios where you're interested in the number of trials needed for a specific event to occur. This template can help explain the geometric distribution concept, formula, and application in a clear and visually appealing manner.