


Características


¿Tienes alguna pregunta?
Recomendar


3 diapositivas
Linear Business Process Flow Presentation
Give your workflow a smooth, streamlined story with a layout that makes every step feel clear and intentional. This presentation outlines processes in a clean, linear format ideal for planning, operations, or strategy mapping. Fully compatible with PowerPoint, Keynote, and Google Slides.


5 diapositivas
Easy Asian Recipes Infographics
Asian cuisine is incredibly diverse and offers a wide range of delicious and flavorful recipes from various countries and regions. These vertical infographics are designed in a user-friendly design that showcase a collection of simple and delicious Asian recipes. These are perfect for home cooks, food bloggers, and anyone interested in exploring the flavors of Asian cuisine. These infographics include beautifully designed recipes for a variety of popular Asian dishes, such as ramen, teriyaki chicken, and more. Each recipe provides a list of ingredients needed and step-by-step instructions to guide users through the cooking process.


20 diapositivas
Ignisiel Sales Performance Report Presentation
Present your sales performance insights with a bold and professional edge using this dynamic presentation template. Designed to highlight every critical aspect of your sales achievements, it features slides for company introductions, service overviews, and target market analysis. Dive deeper into your success with sections on sales objectives, competitive analysis, and an in-depth performance metrics breakdown. Showcase your team’s efforts with slides for team introductions and build trust through customer testimonials. Financials are made clear with slides for pricing strategies and enticing promotions and discounts. Wrap up your presentation with actionable slides for future opportunities and an organized feedback section to engage stakeholders effectively. Fully customizable and compatible with PowerPoint, Google Slides, and Keynote, this template ensures your message is delivered with clarity and style. Perfect for businesses aiming to make a bold impression.


12 diapositivas
Employee Roles and Professional Profiles
Break down team structure and highlight individual strengths with this modern hub-and-spoke layout—perfect for showcasing employee roles, departments, or professional profiles. Whether you're onboarding, presenting org charts, or outlining responsibilities, this slide keeps it all clear and cohesive. Fully compatible with PowerPoint, Keynote, and Google Slides.


10 diapositivas
4 Stages of Strategic Execution Process Presentation
Clarify your strategy with the 4 Stages of Strategic Execution Process Presentation. This visually layered circle layout walks your audience through each key stage of execution—ideal for planning, operations, and team alignment. Each step is color-coded and fully editable, ensuring your message stays focused. Compatible with PowerPoint, Keynote, Google Slides, and Canva.


6 diapositivas
School Goals and Administration Presentation
Visualize key academic priorities with this notebook-style layout, perfect for school administrators and teachers. Featuring colorful pushpin markers and a two-page spread, this template is great for outlining goals, responsibilities, or class guidelines. Fully editable in PowerPoint, Keynote, and Google Slides for customized, classroom-ready presentations.


7 diapositivas
Butterfly Visualization Layout Presentation
Bring balance and clarity to your data storytelling with a sleek, symmetrical design that connects ideas seamlessly. This presentation is ideal for visualizing comparisons, workflows, or interconnected topics in a clean and engaging format. Fully customizable and compatible with PowerPoint, Keynote, and Google Slides.


5 diapositivas
RAPID Decision-Making Model
Take the guesswork out of group decisions with this bold and clear template. It’s designed around the RAPID framework—Recommend, Agree, Perform, Input, Decide—to help teams define roles and make faster, more accountable choices. Perfect for leadership, strategy, and project planning sessions. Fully compatible with PowerPoint, Keynote, and Google Slides.


5 diapositivas
Product and Service Benefits Slide
Highlight your value offerings with this clean, 4-column benefits layout. Each box provides space for an icon, title, and concise description—ideal for comparing features, services, or product advantages. Fully editable in PowerPoint, Keynote, and Google Slides to match your brand style.


5 diapositivas
Pet Care Infographics
Pet care refers to the practices and actions taken to ensure the well-being, health, and happiness of pets. These vertical infographic templates are perfect for providing essential information and tips for pet owners to ensure the well-being and proper care of their furry companions. This infographic is designed to present key aspects of pet care in a concise and engaging manner, making it a valuable resource for pet owners, veterinarians, pet stores, or any organization related to pet care. Compatible with Powerpoint, Keynote, and Google Slides. Use the text boxes and graphs to promote responsible pet ownership and provide valuable information about pet care.


5 diapositivas
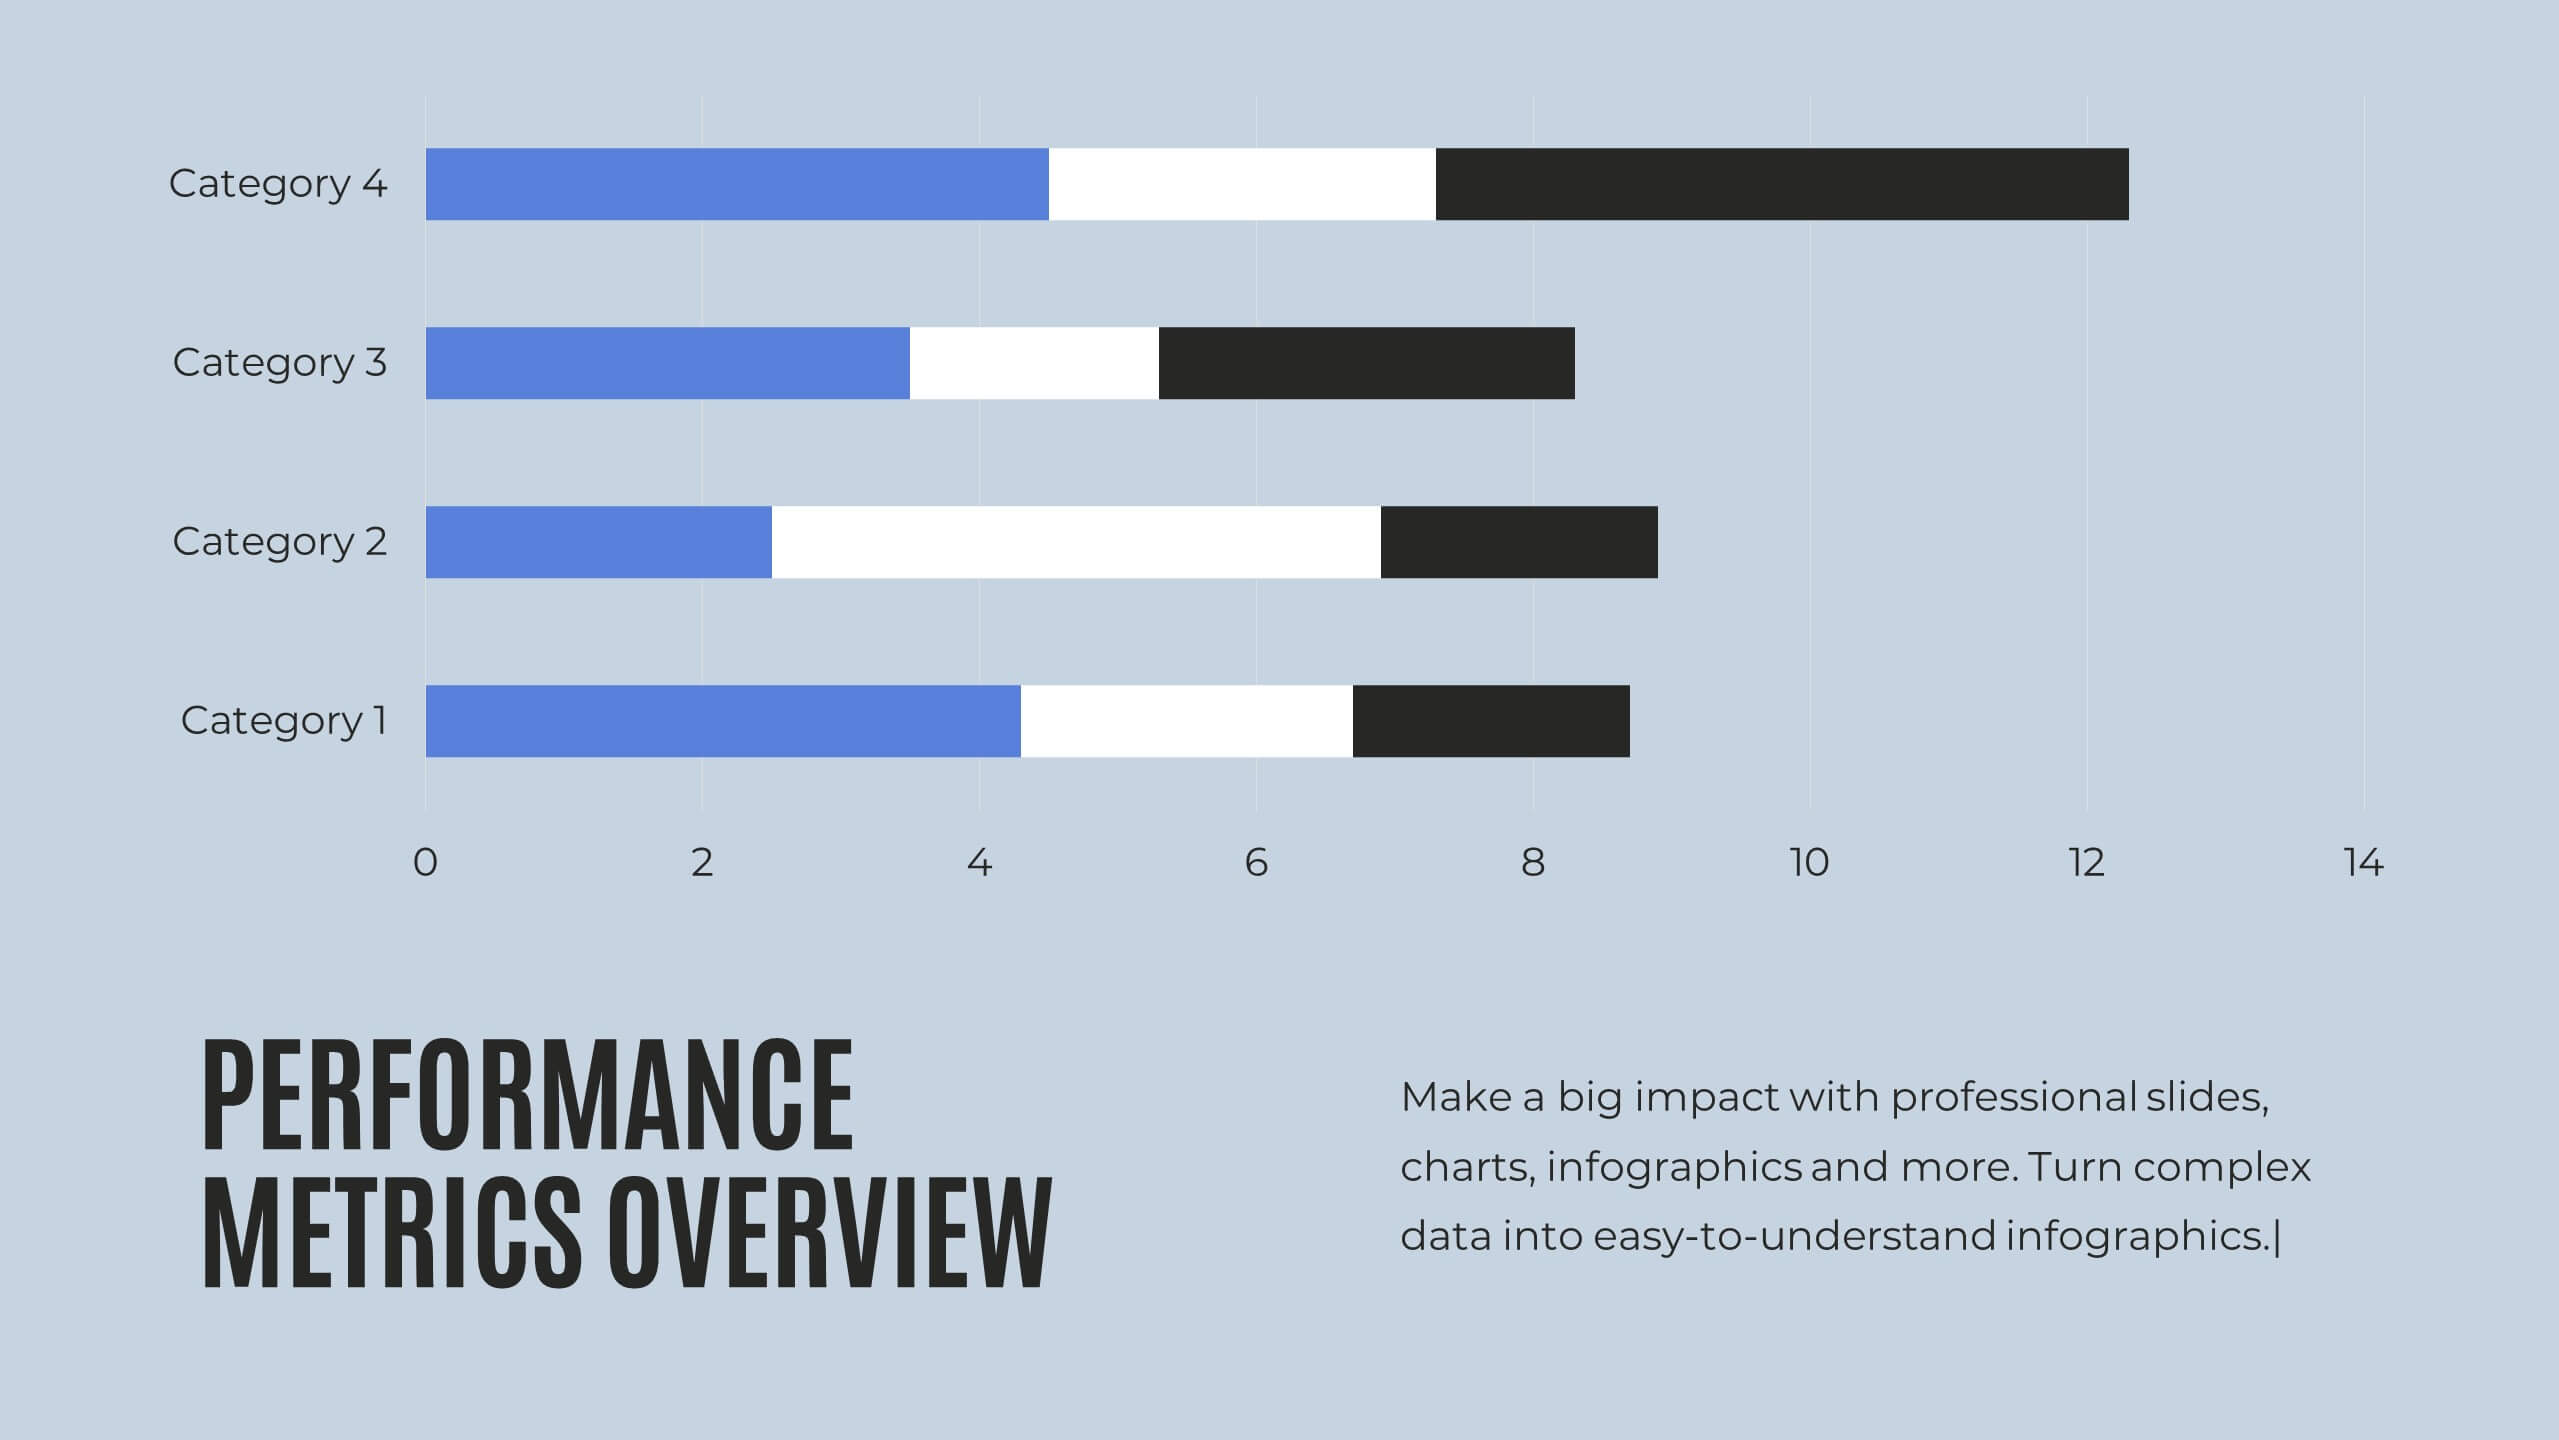
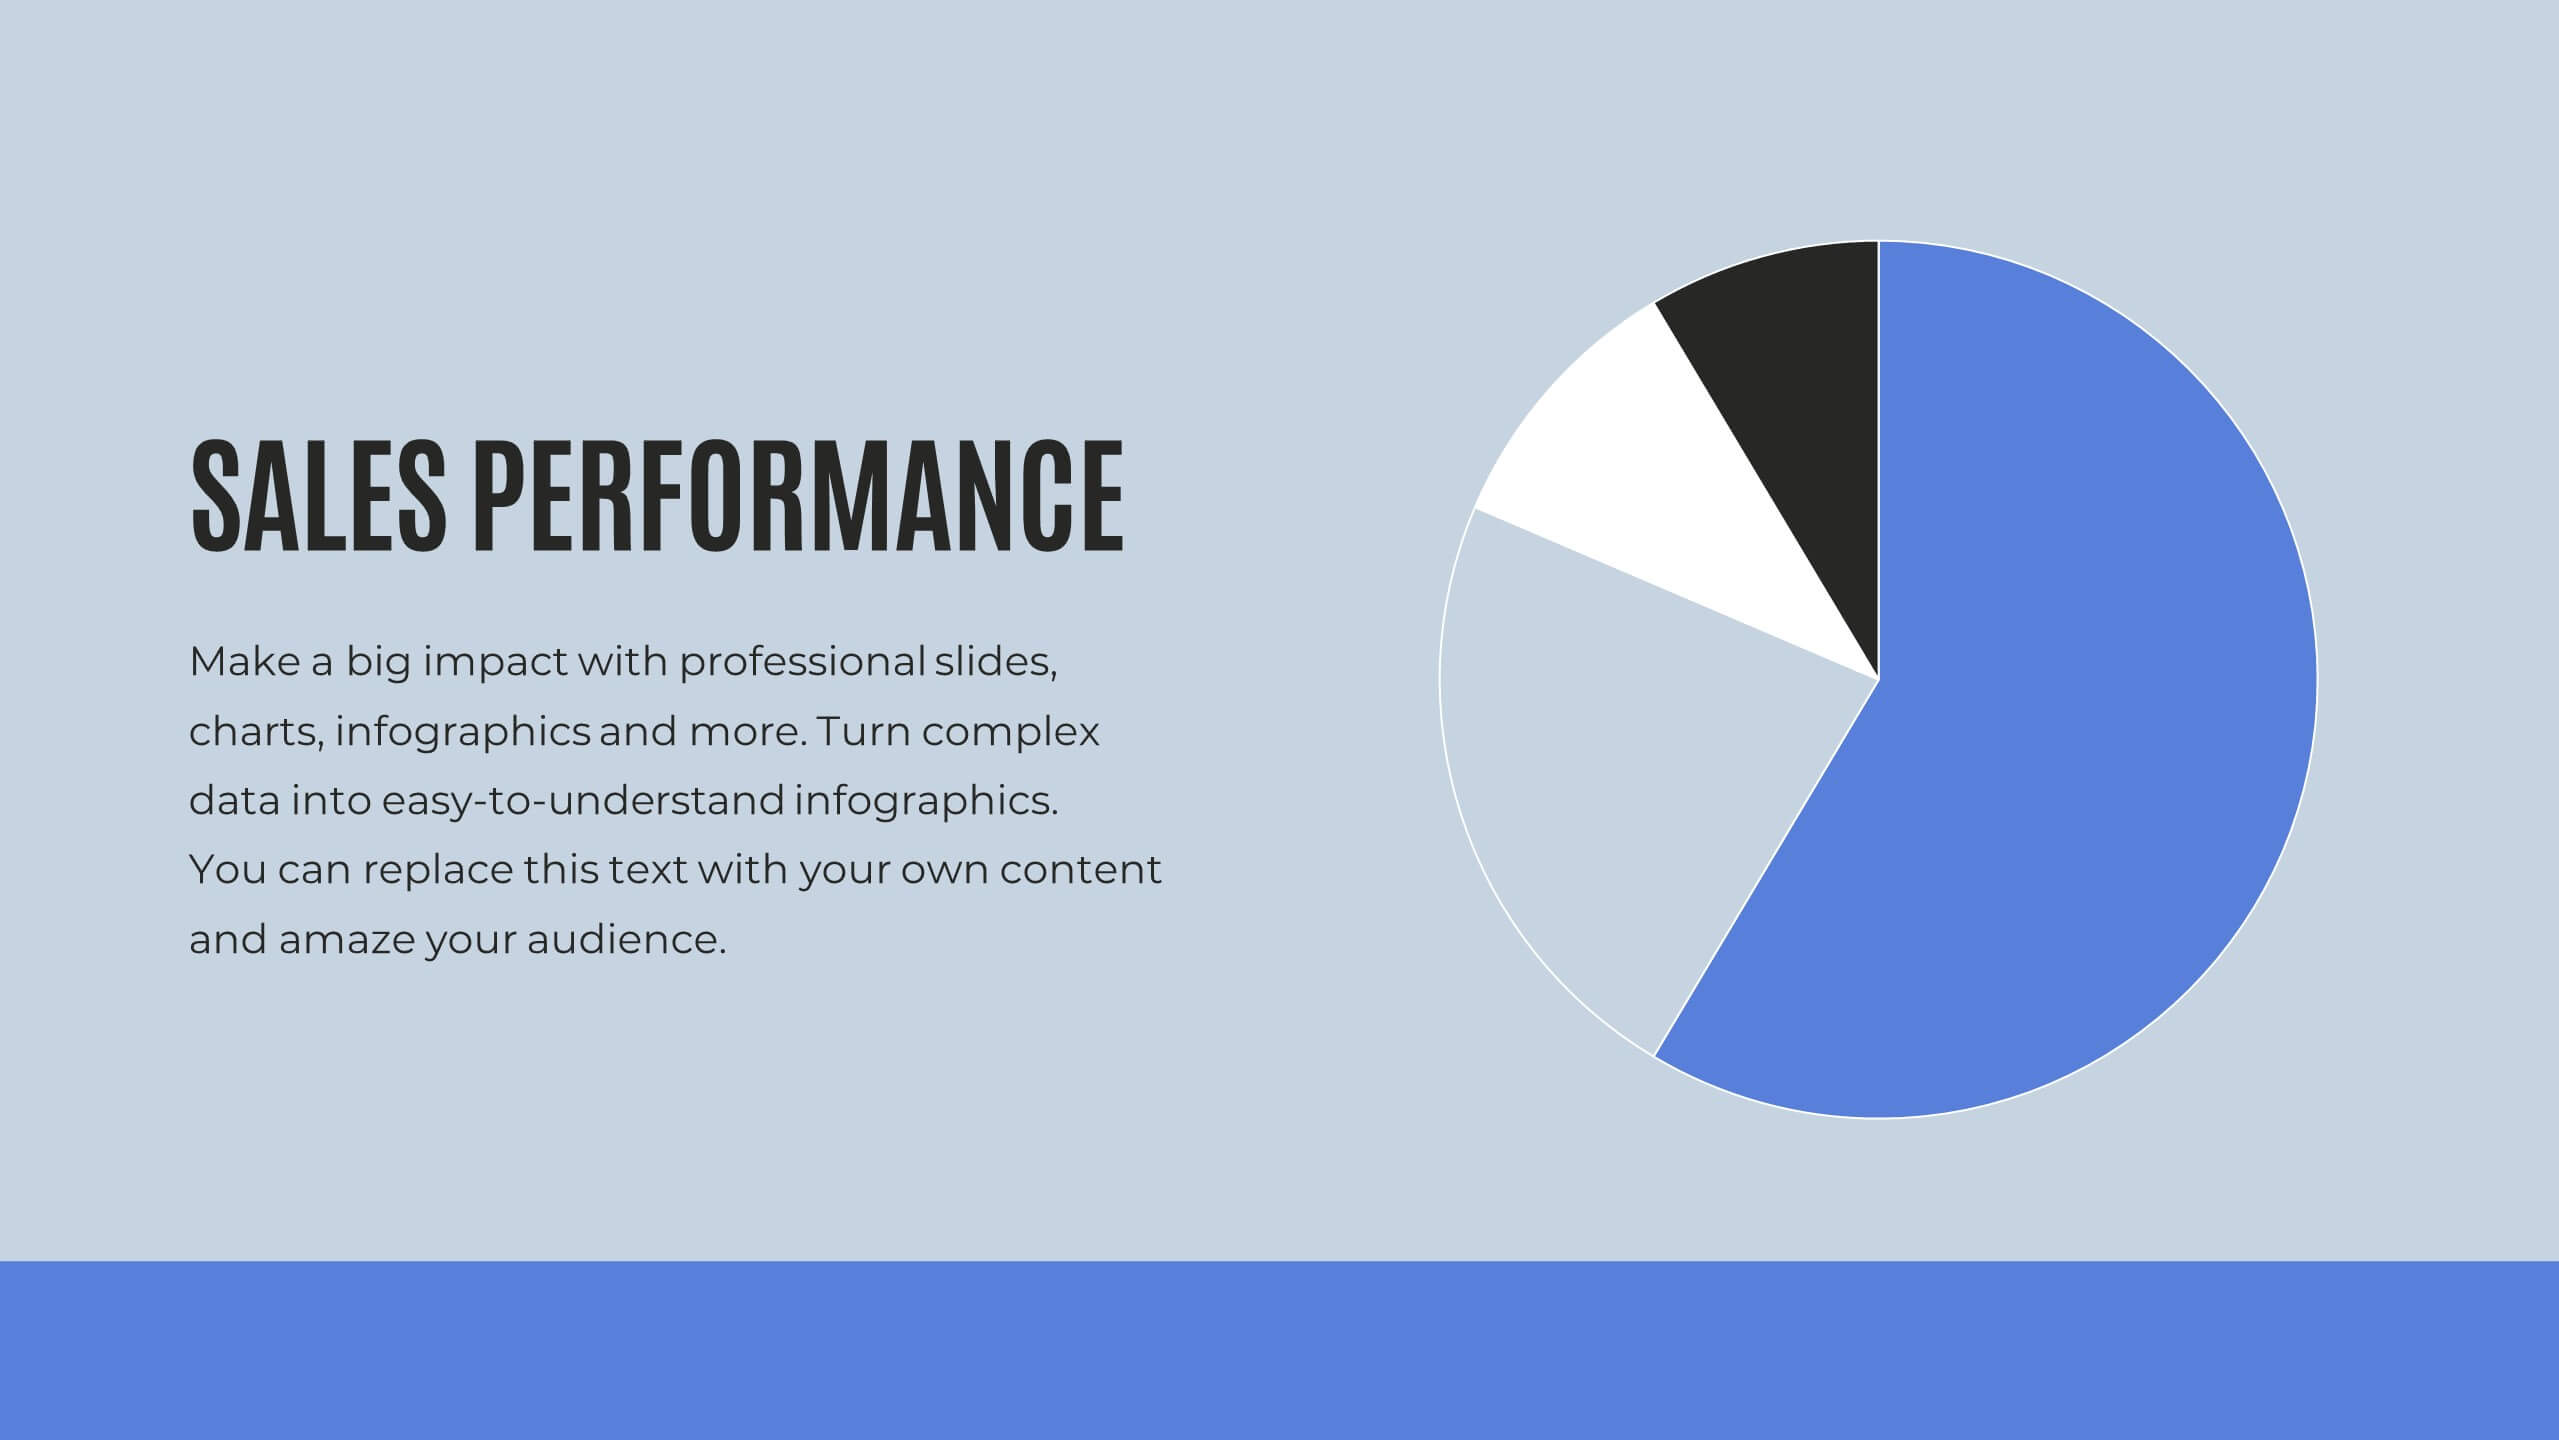
Infographic Business Charts Presentation
Bring your data to life with a bold, visual storytelling layout designed to make insights instantly clear and impossible to ignore. This presentation highlights key metrics using clean, modern business charts that simplify comparisons and trends for any audience. Fully compatible with PowerPoint, Keynote, and Google Slides.


5 diapositivas
Fishbone Diagram for Root Cause Analysis Presentation
Identify and Solve Business Problems with Precision using this Fishbone Diagram for Root Cause Analysis presentation template. Designed to visually map out potential causes, this template enhances problem-solving, decision-making, and process improvement. Featuring a clear fishbone structure, customizable icons, and text placeholders, this template is perfect for business analysts, strategists, and operations teams. Fully editable and compatible with PowerPoint, Keynote, and Google Slides, ensuring a seamless and professional presentation experience.


23 diapositivas
Stormrider Business Plan Presentation
This Business Presentation Template is designed to help you deliver structured and professional content for conferences, meetings, and corporate events. Featuring key sections such as objectives, speaker introductions, panel discussions, and networking breaks, it ensures a smooth and engaging experience. Fully customizable and compatible with PowerPoint, Keynote, and Google Slides.


5 diapositivas
Behavioral Psychology Insights Presentation
Dive deep into the human mind with our 'Behavioral Psychology Insights' presentation template. Perfect for educators and professionals, this template offers a structured way to present complex psychological concepts visually. Ideal for delivering engaging presentations on human behavior, it is compatible with PowerPoint, Keynote, and Google Slides.


21 diapositivas
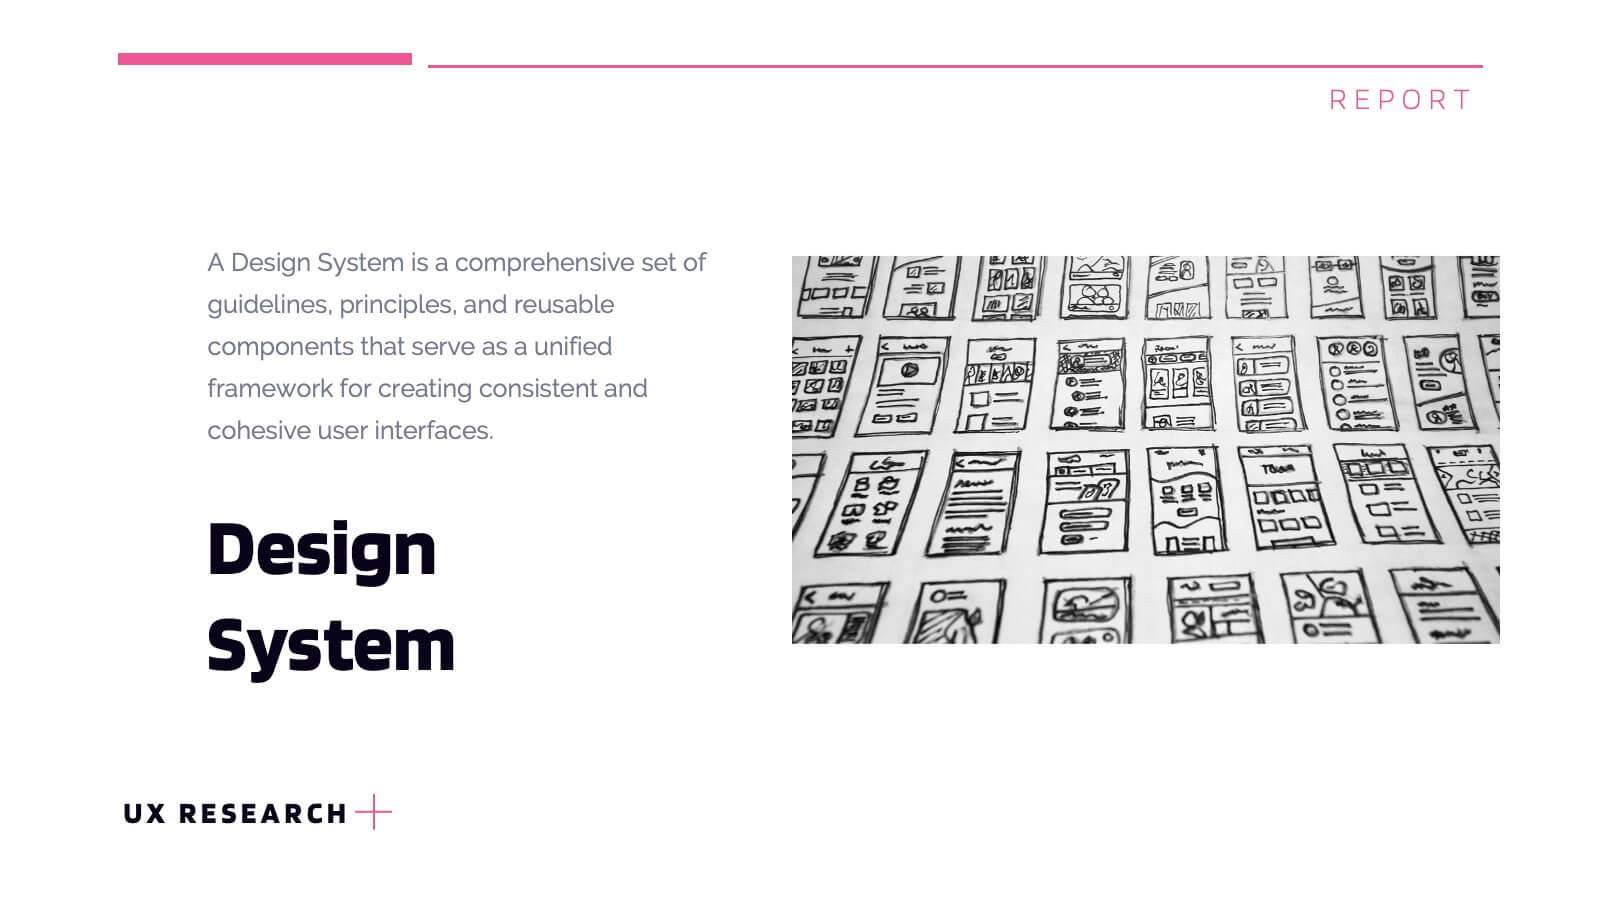
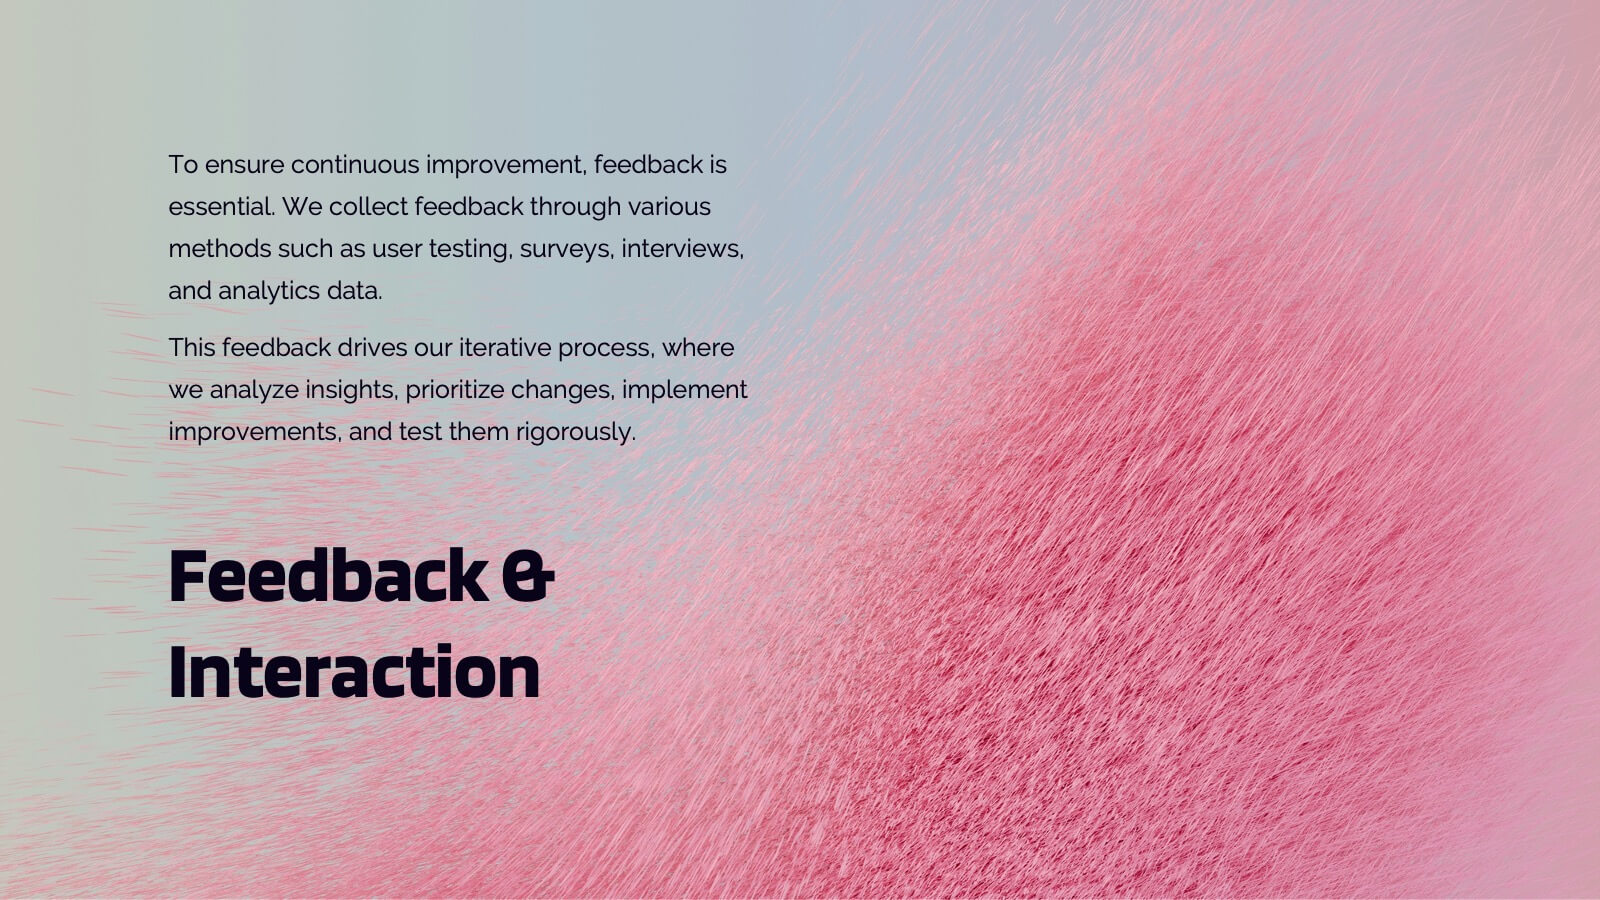
Lumascend UX Research Report Presentation
Present your UX research findings with clarity using this engaging and organized template! Covering key areas like user personas, wireframes, testing, and interaction design, it ensures all aspects of your design process are communicated effectively. Perfect for UX teams, stakeholders, or client presentations, this template works seamlessly with PowerPoint, Keynote, and Google Slides.


5 diapositivas
Climate Change Impacts Infographics
Climate Change refers to long-term shifts in temperature, precipitation patterns, wind patterns, and other aspects of the Earth's climate system. These infographic templates are perfect to educate and raise awareness about the impacts of climate change on our planet. These templates are suitable for environmental organizations, educators, or anyone seeking to convey the urgency and significance of addressing climate change. The compelling visuals, data-driven content, and clear messaging, in these templates aims to educate and inspire individuals to contribute to global efforts to address climate change and protect our planet's future.


21 diapositivas
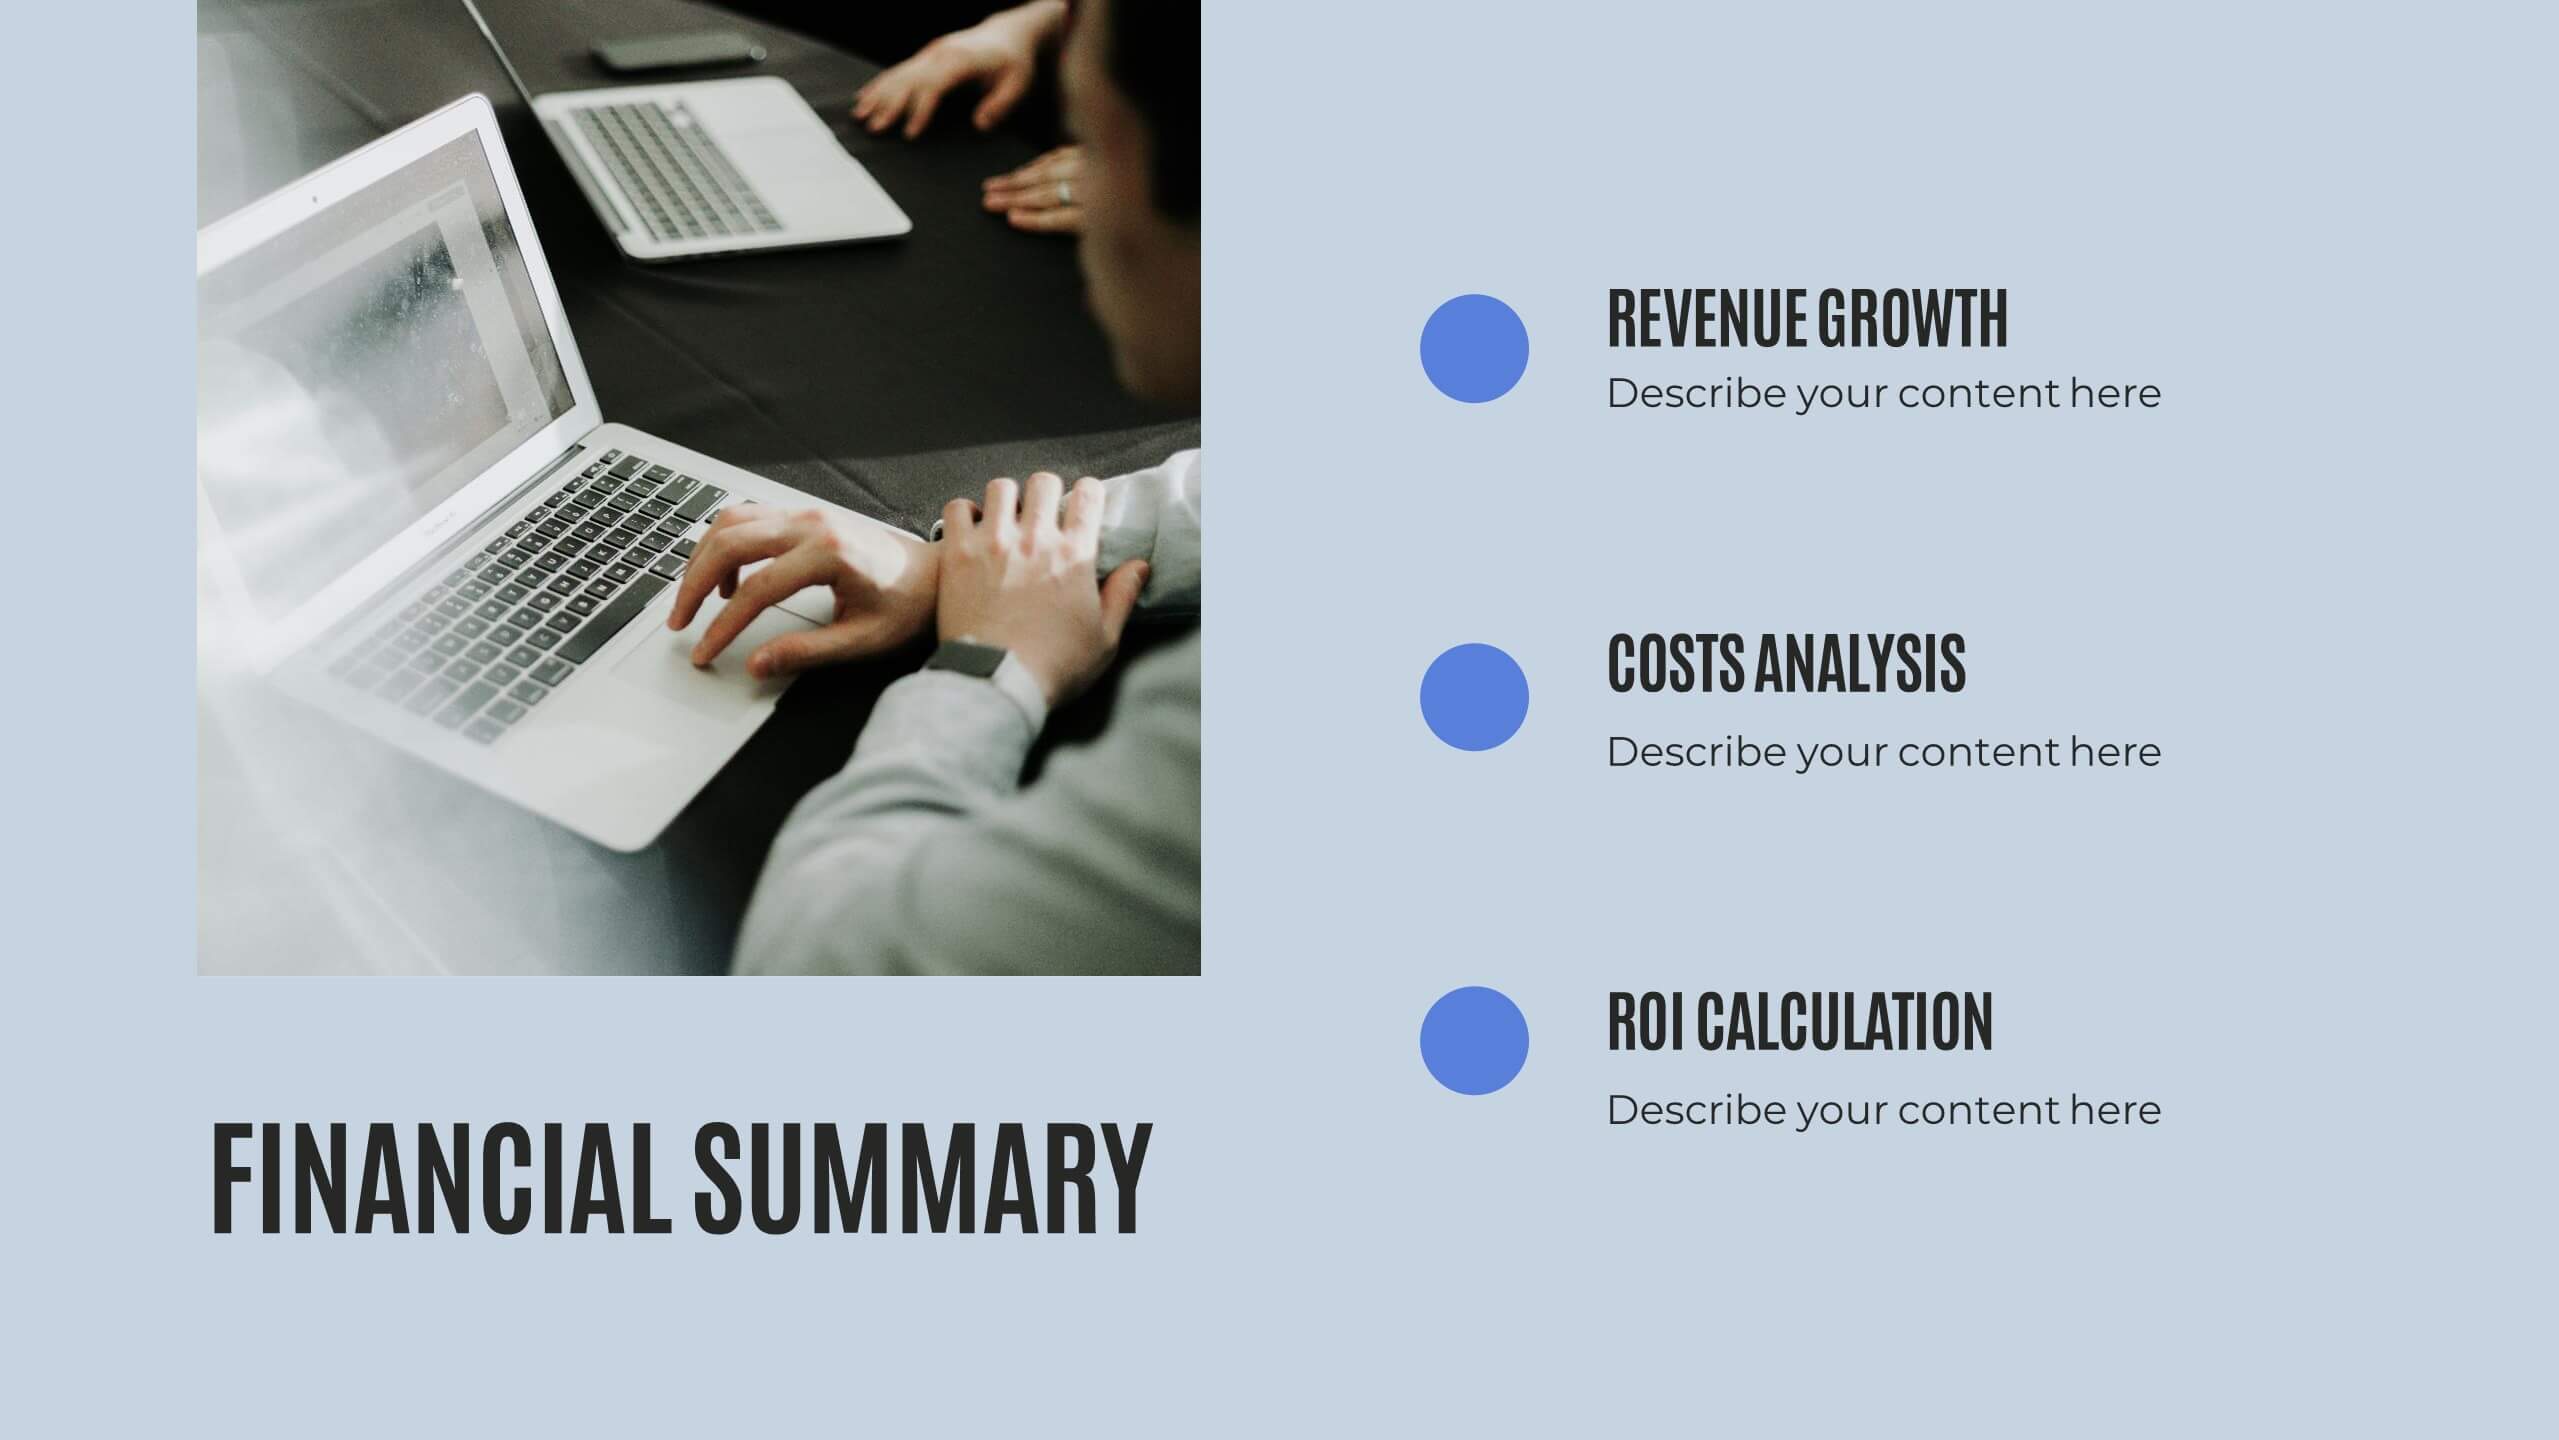
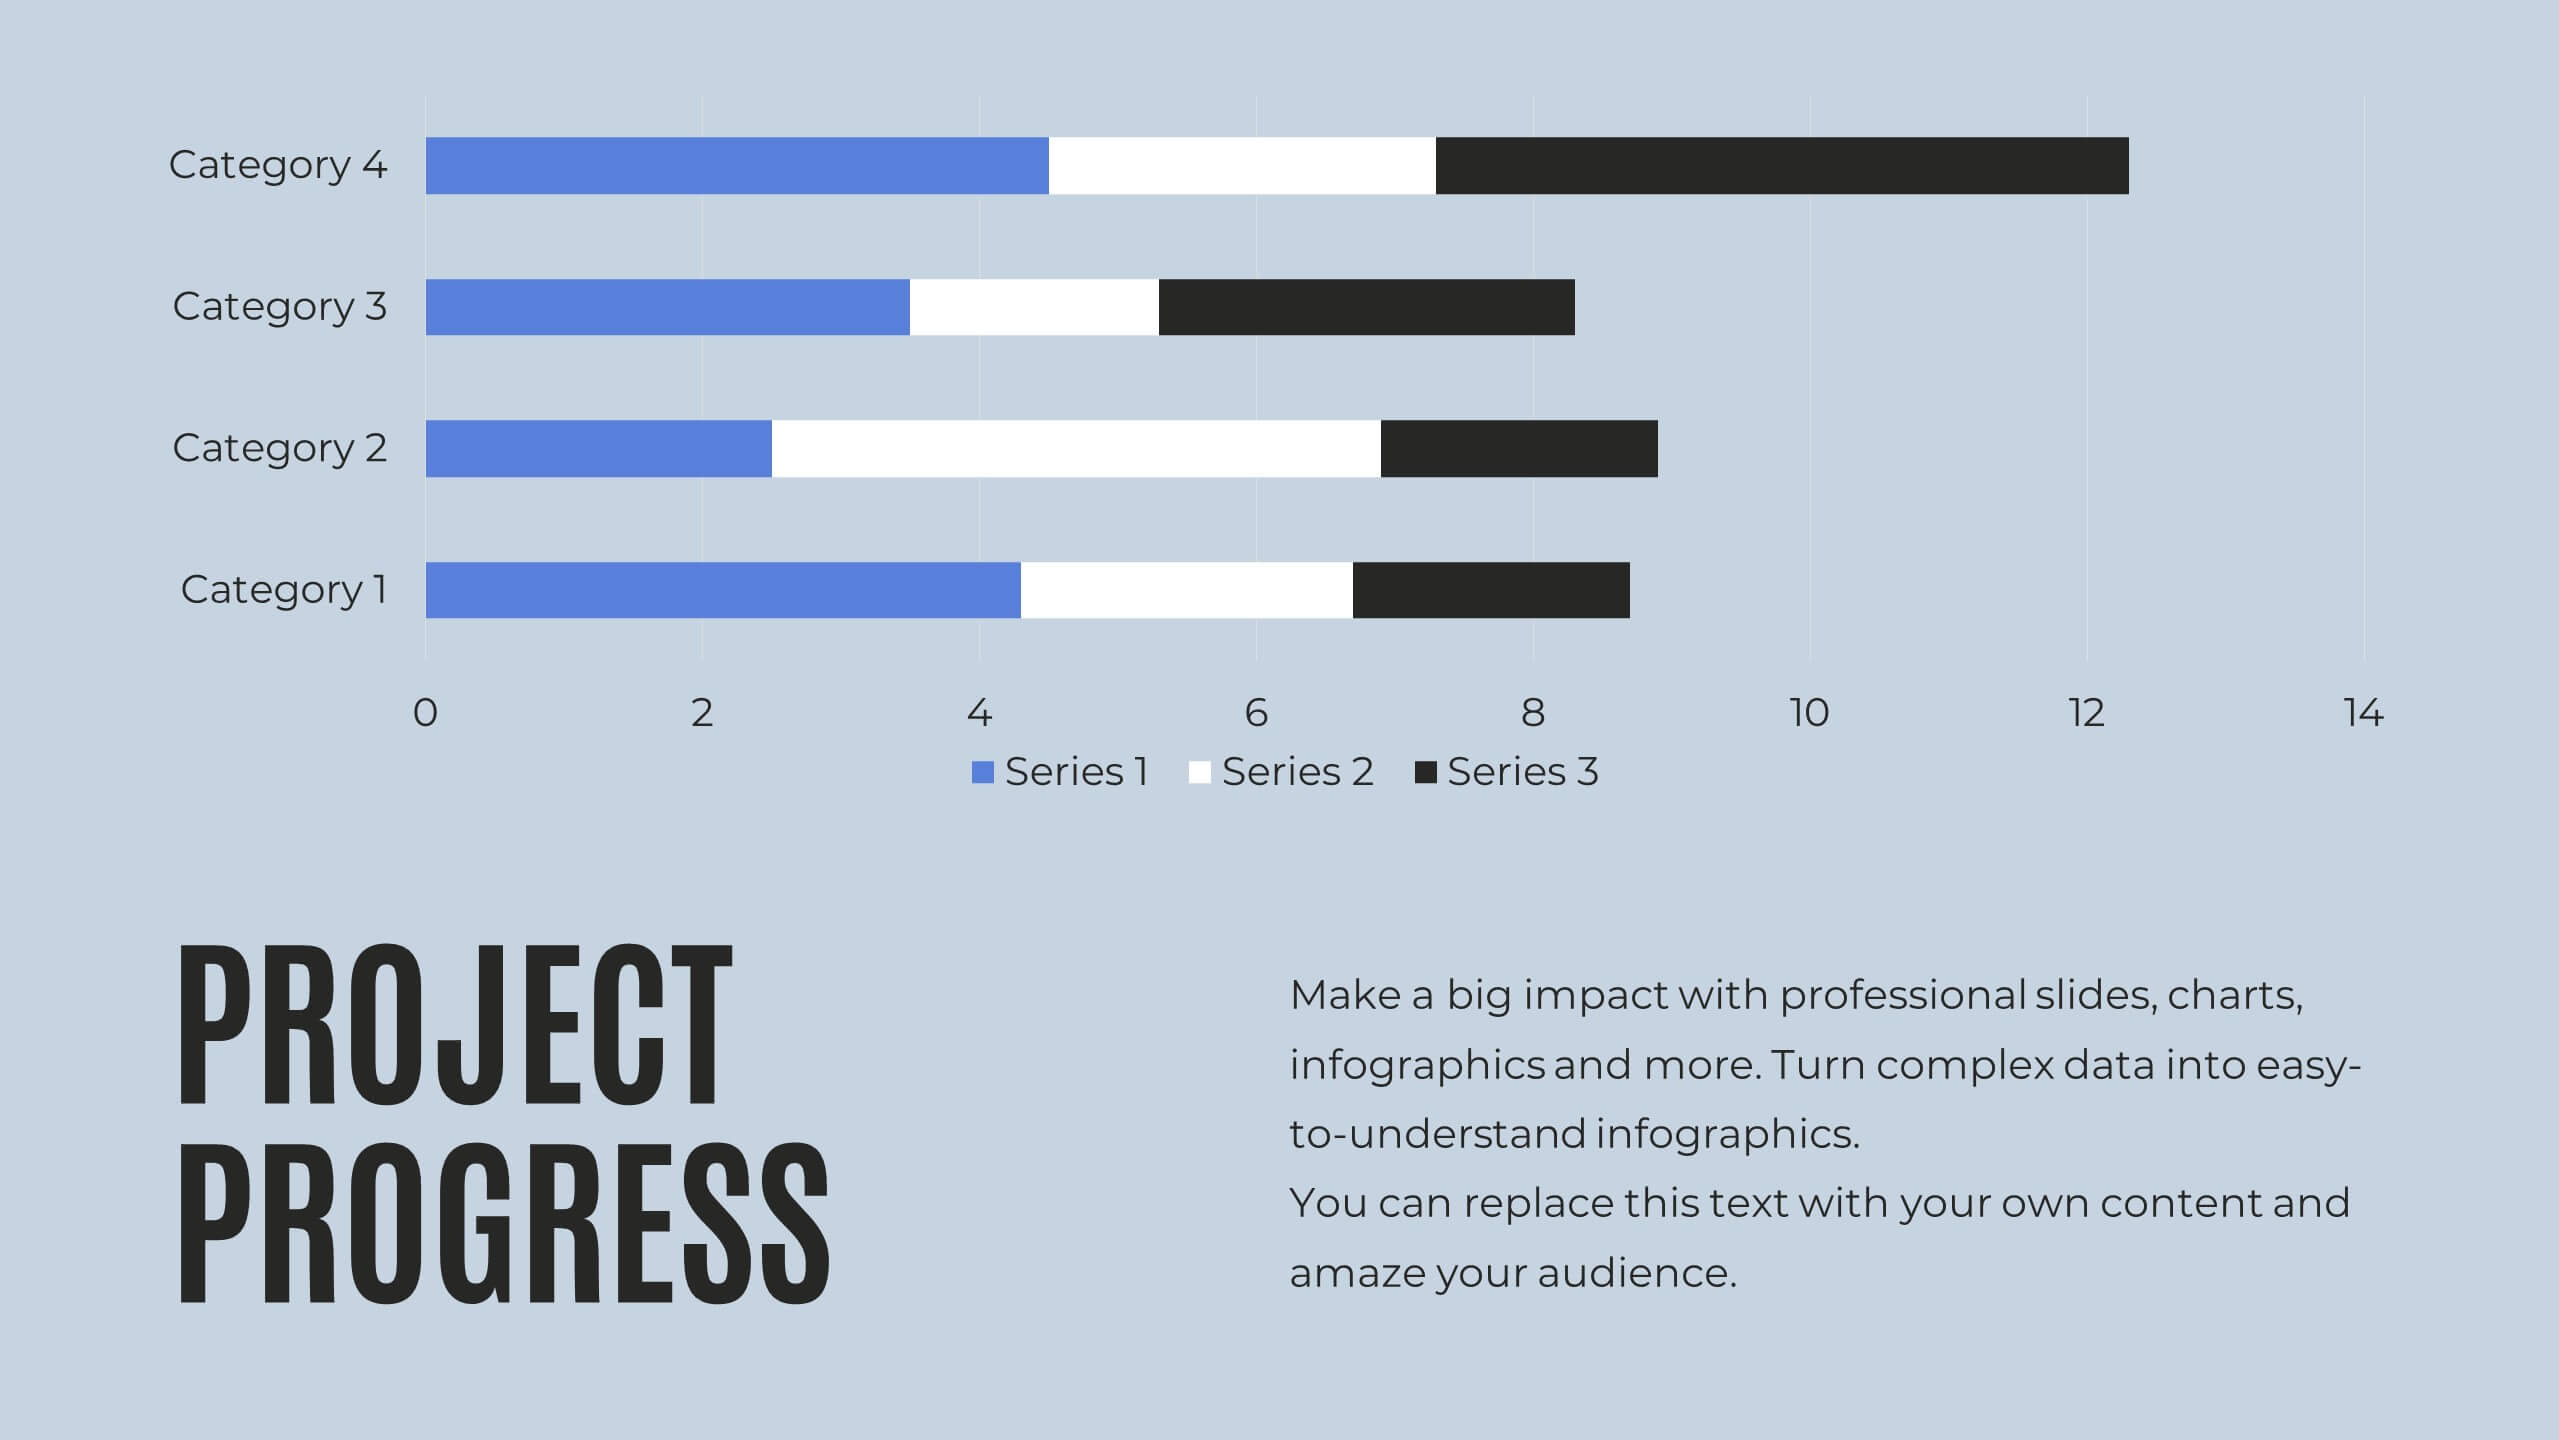
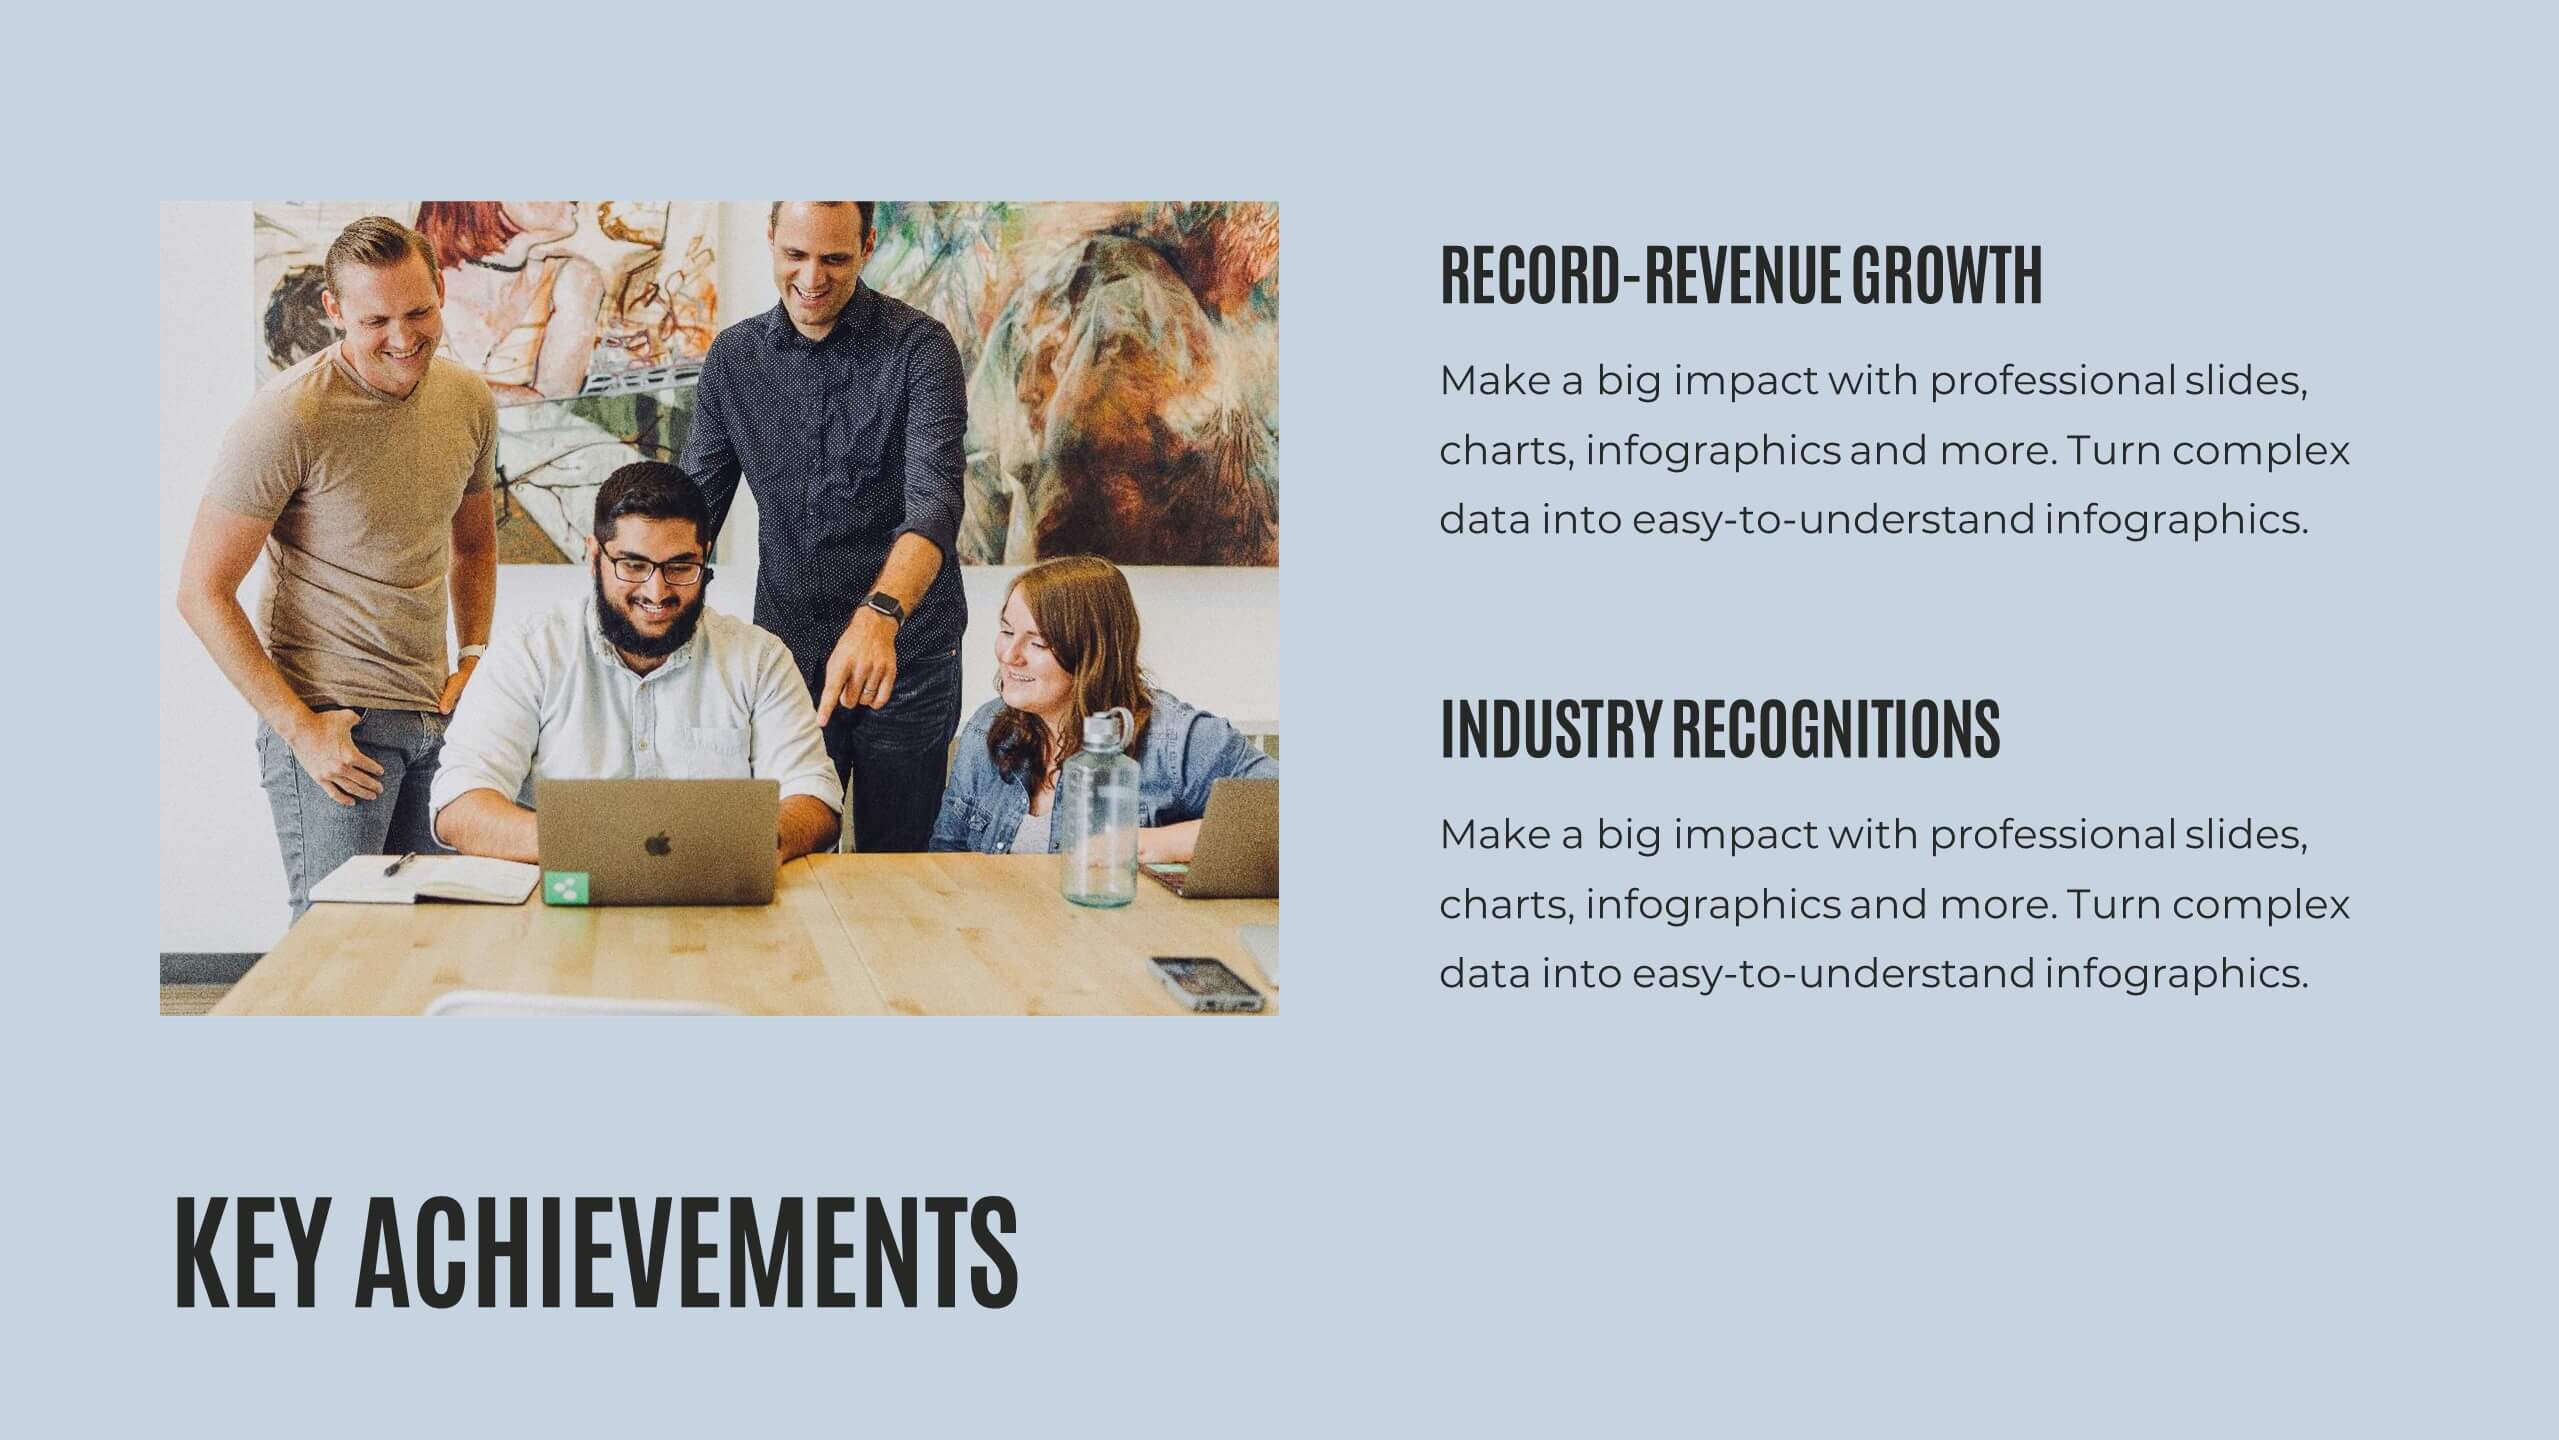
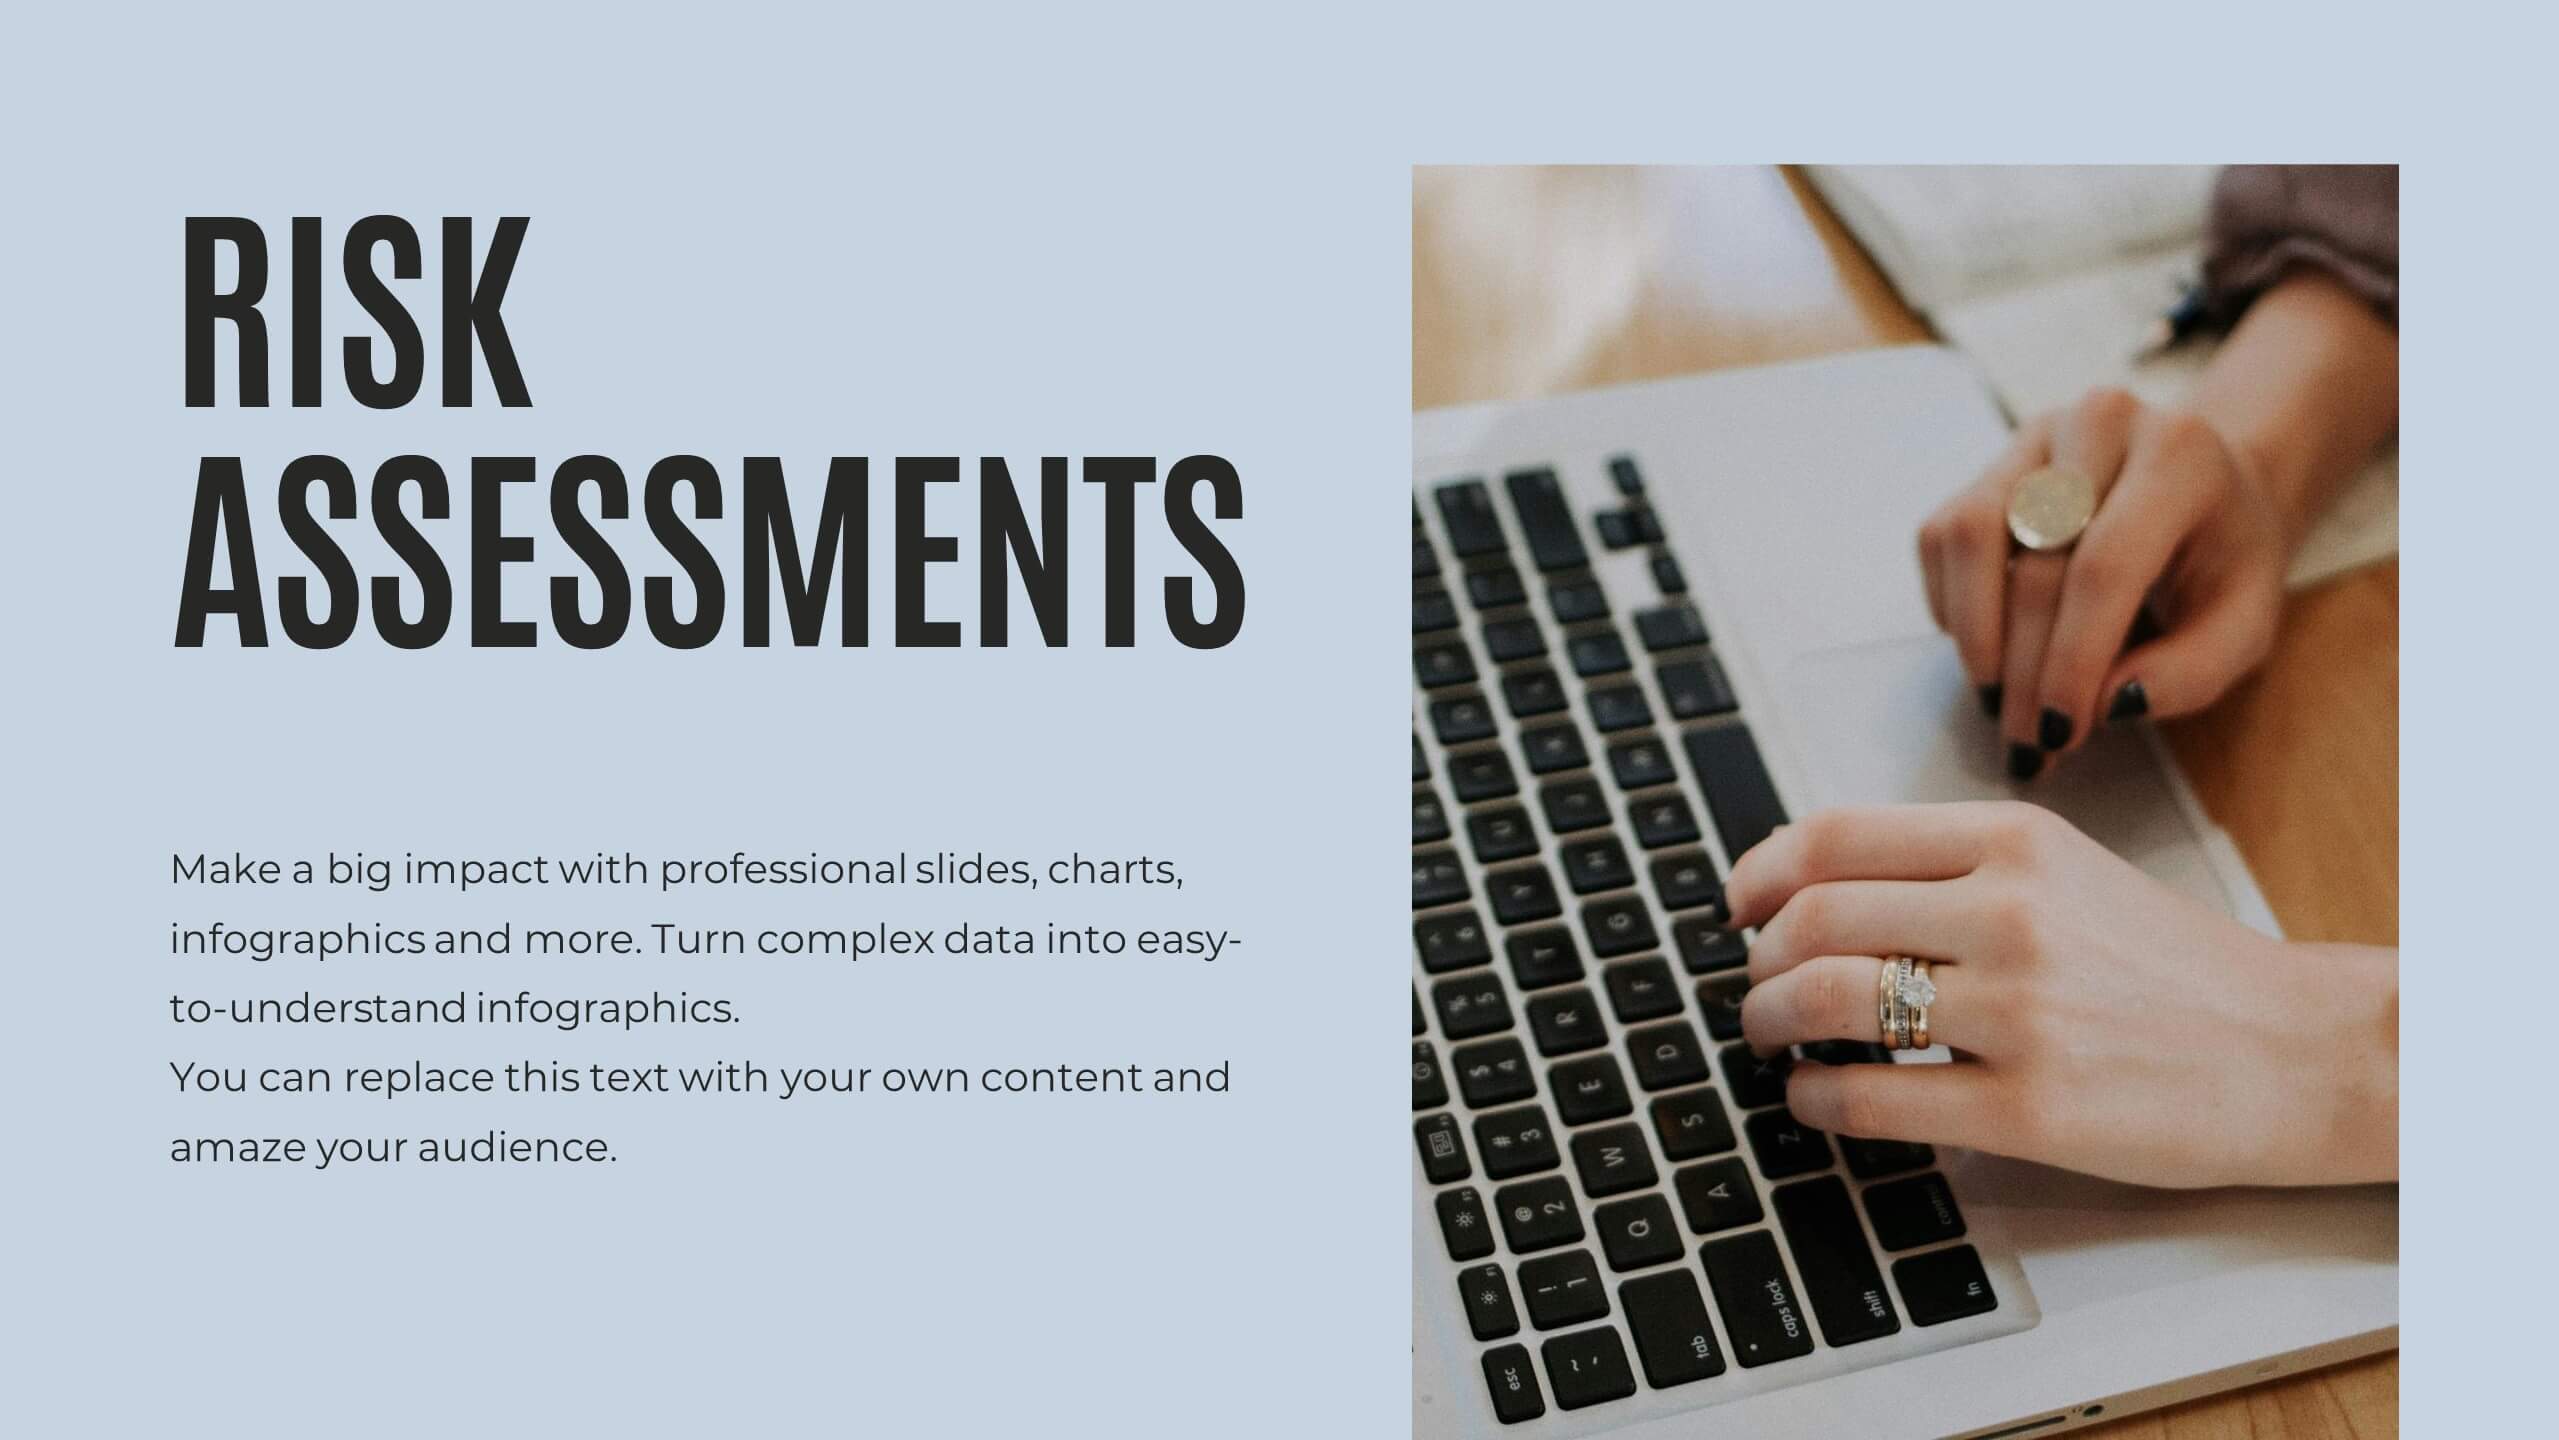
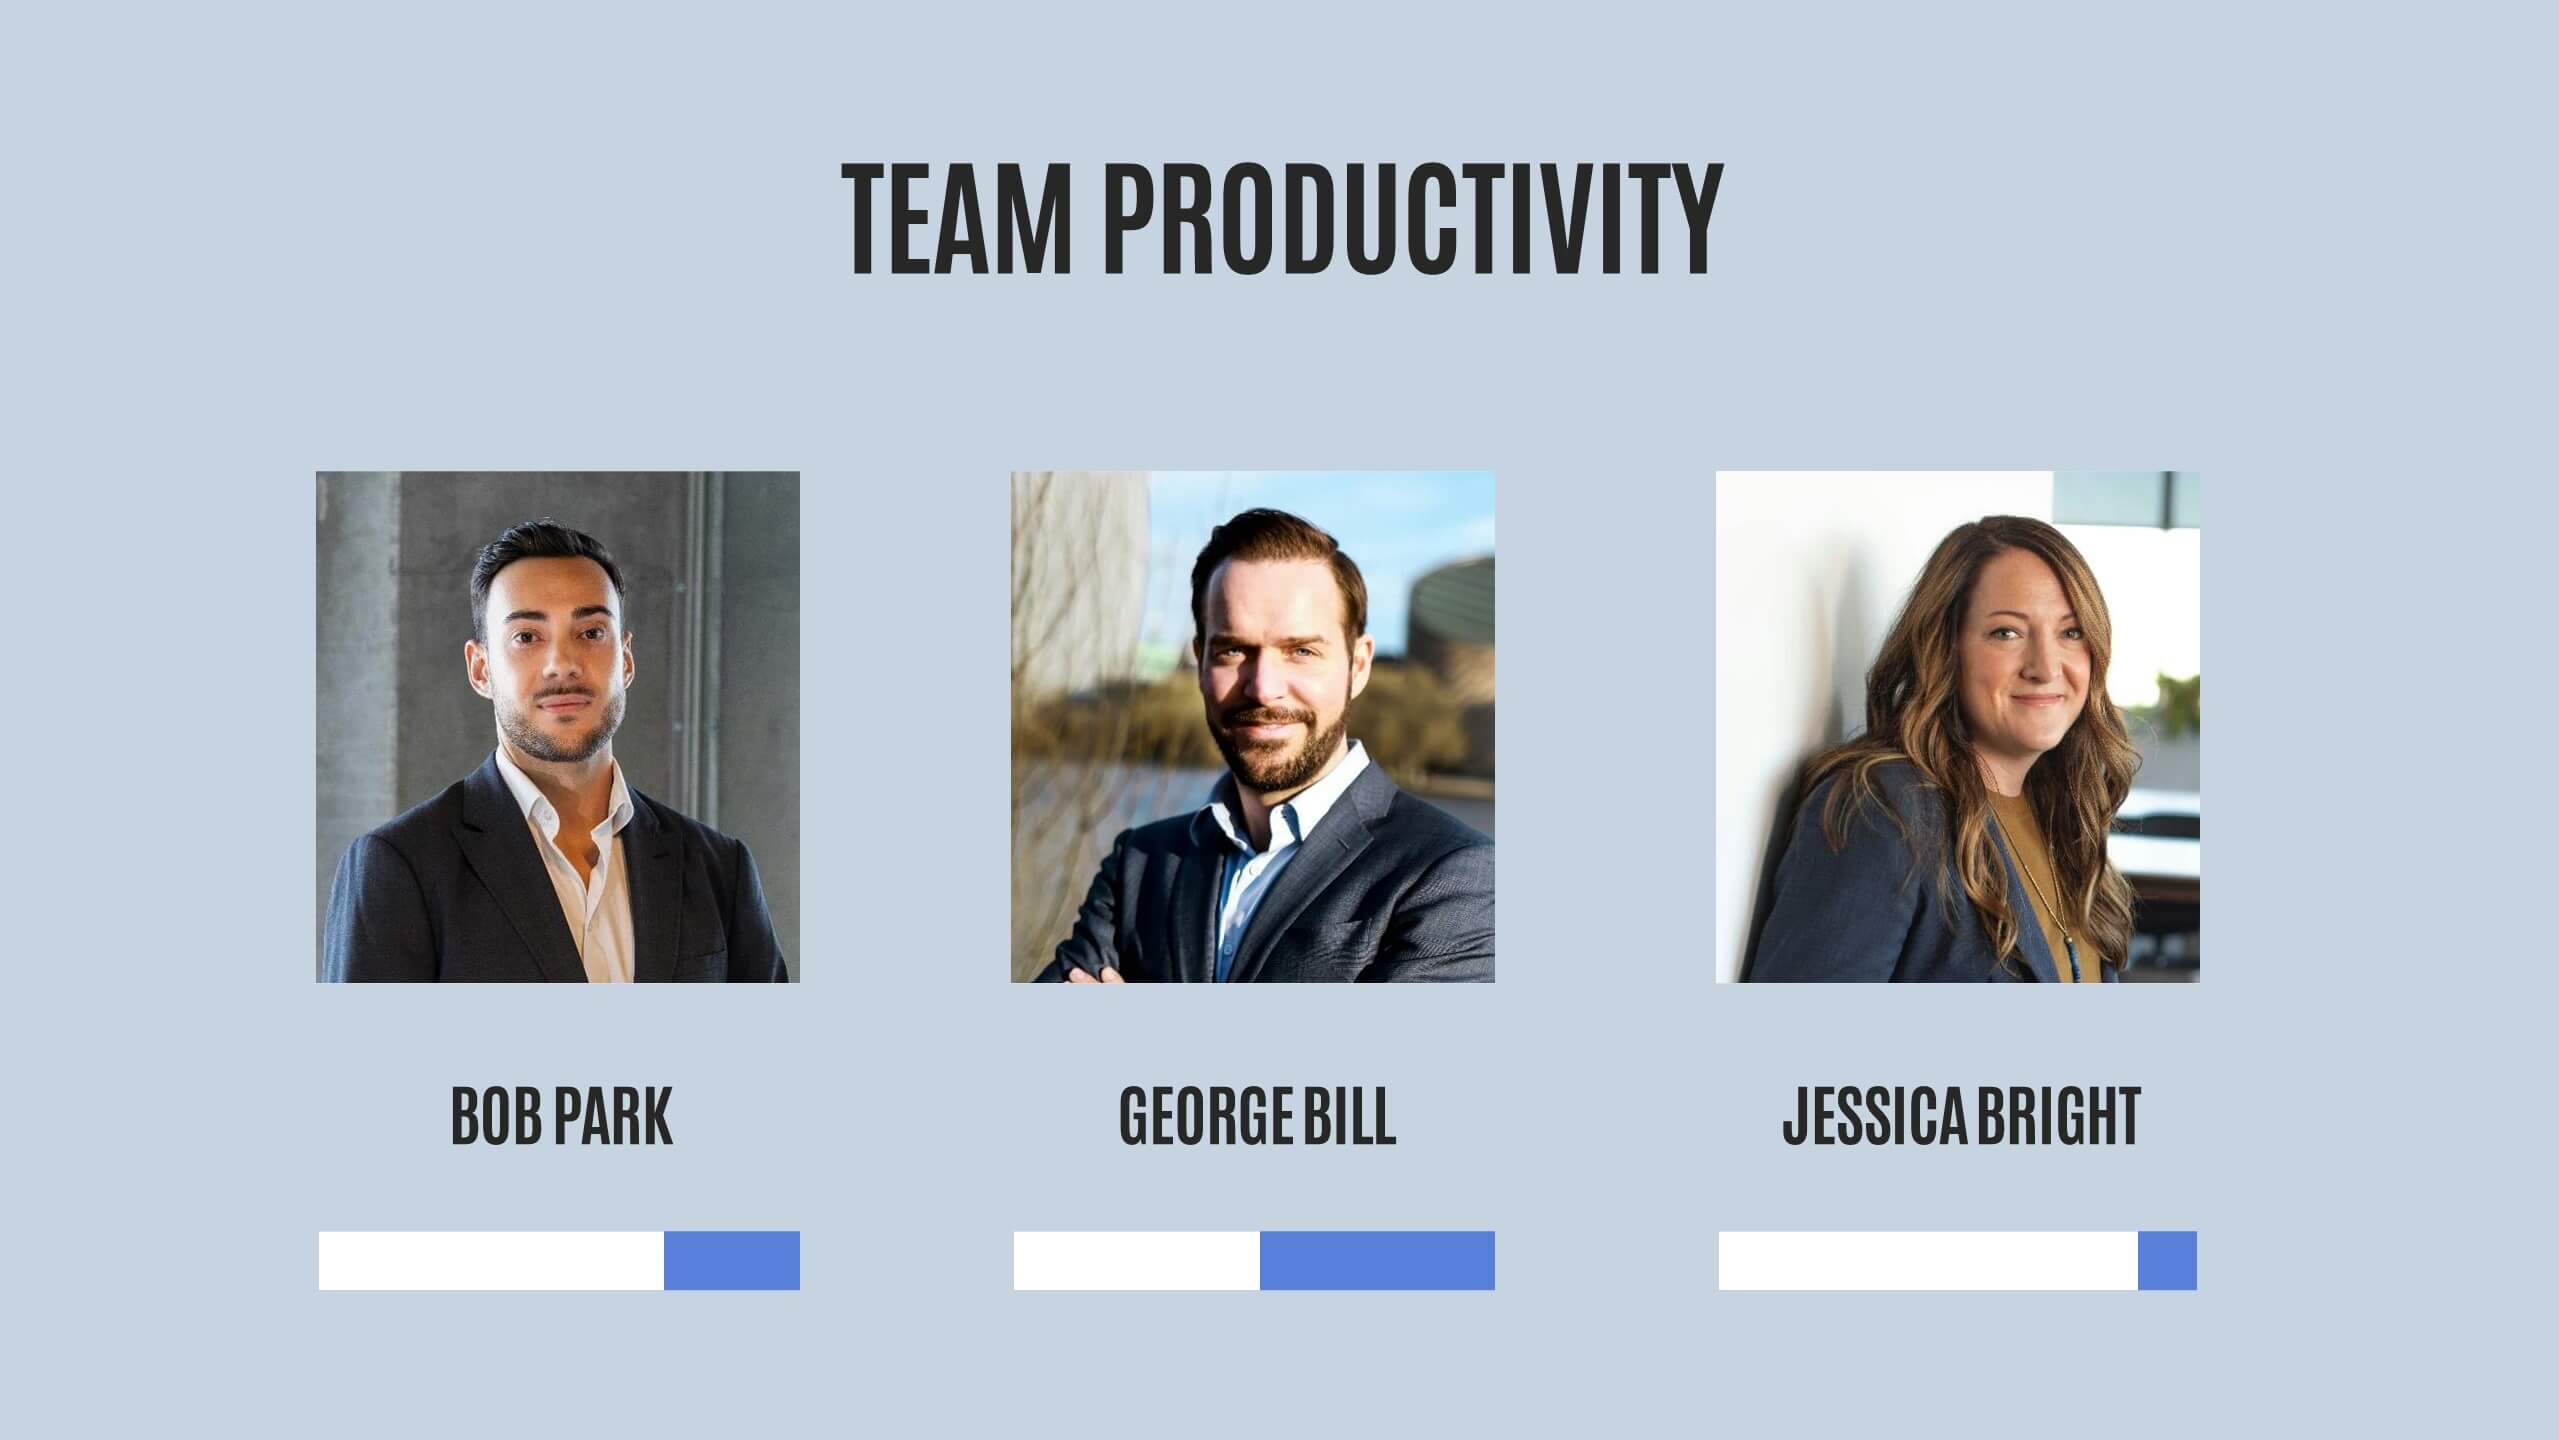
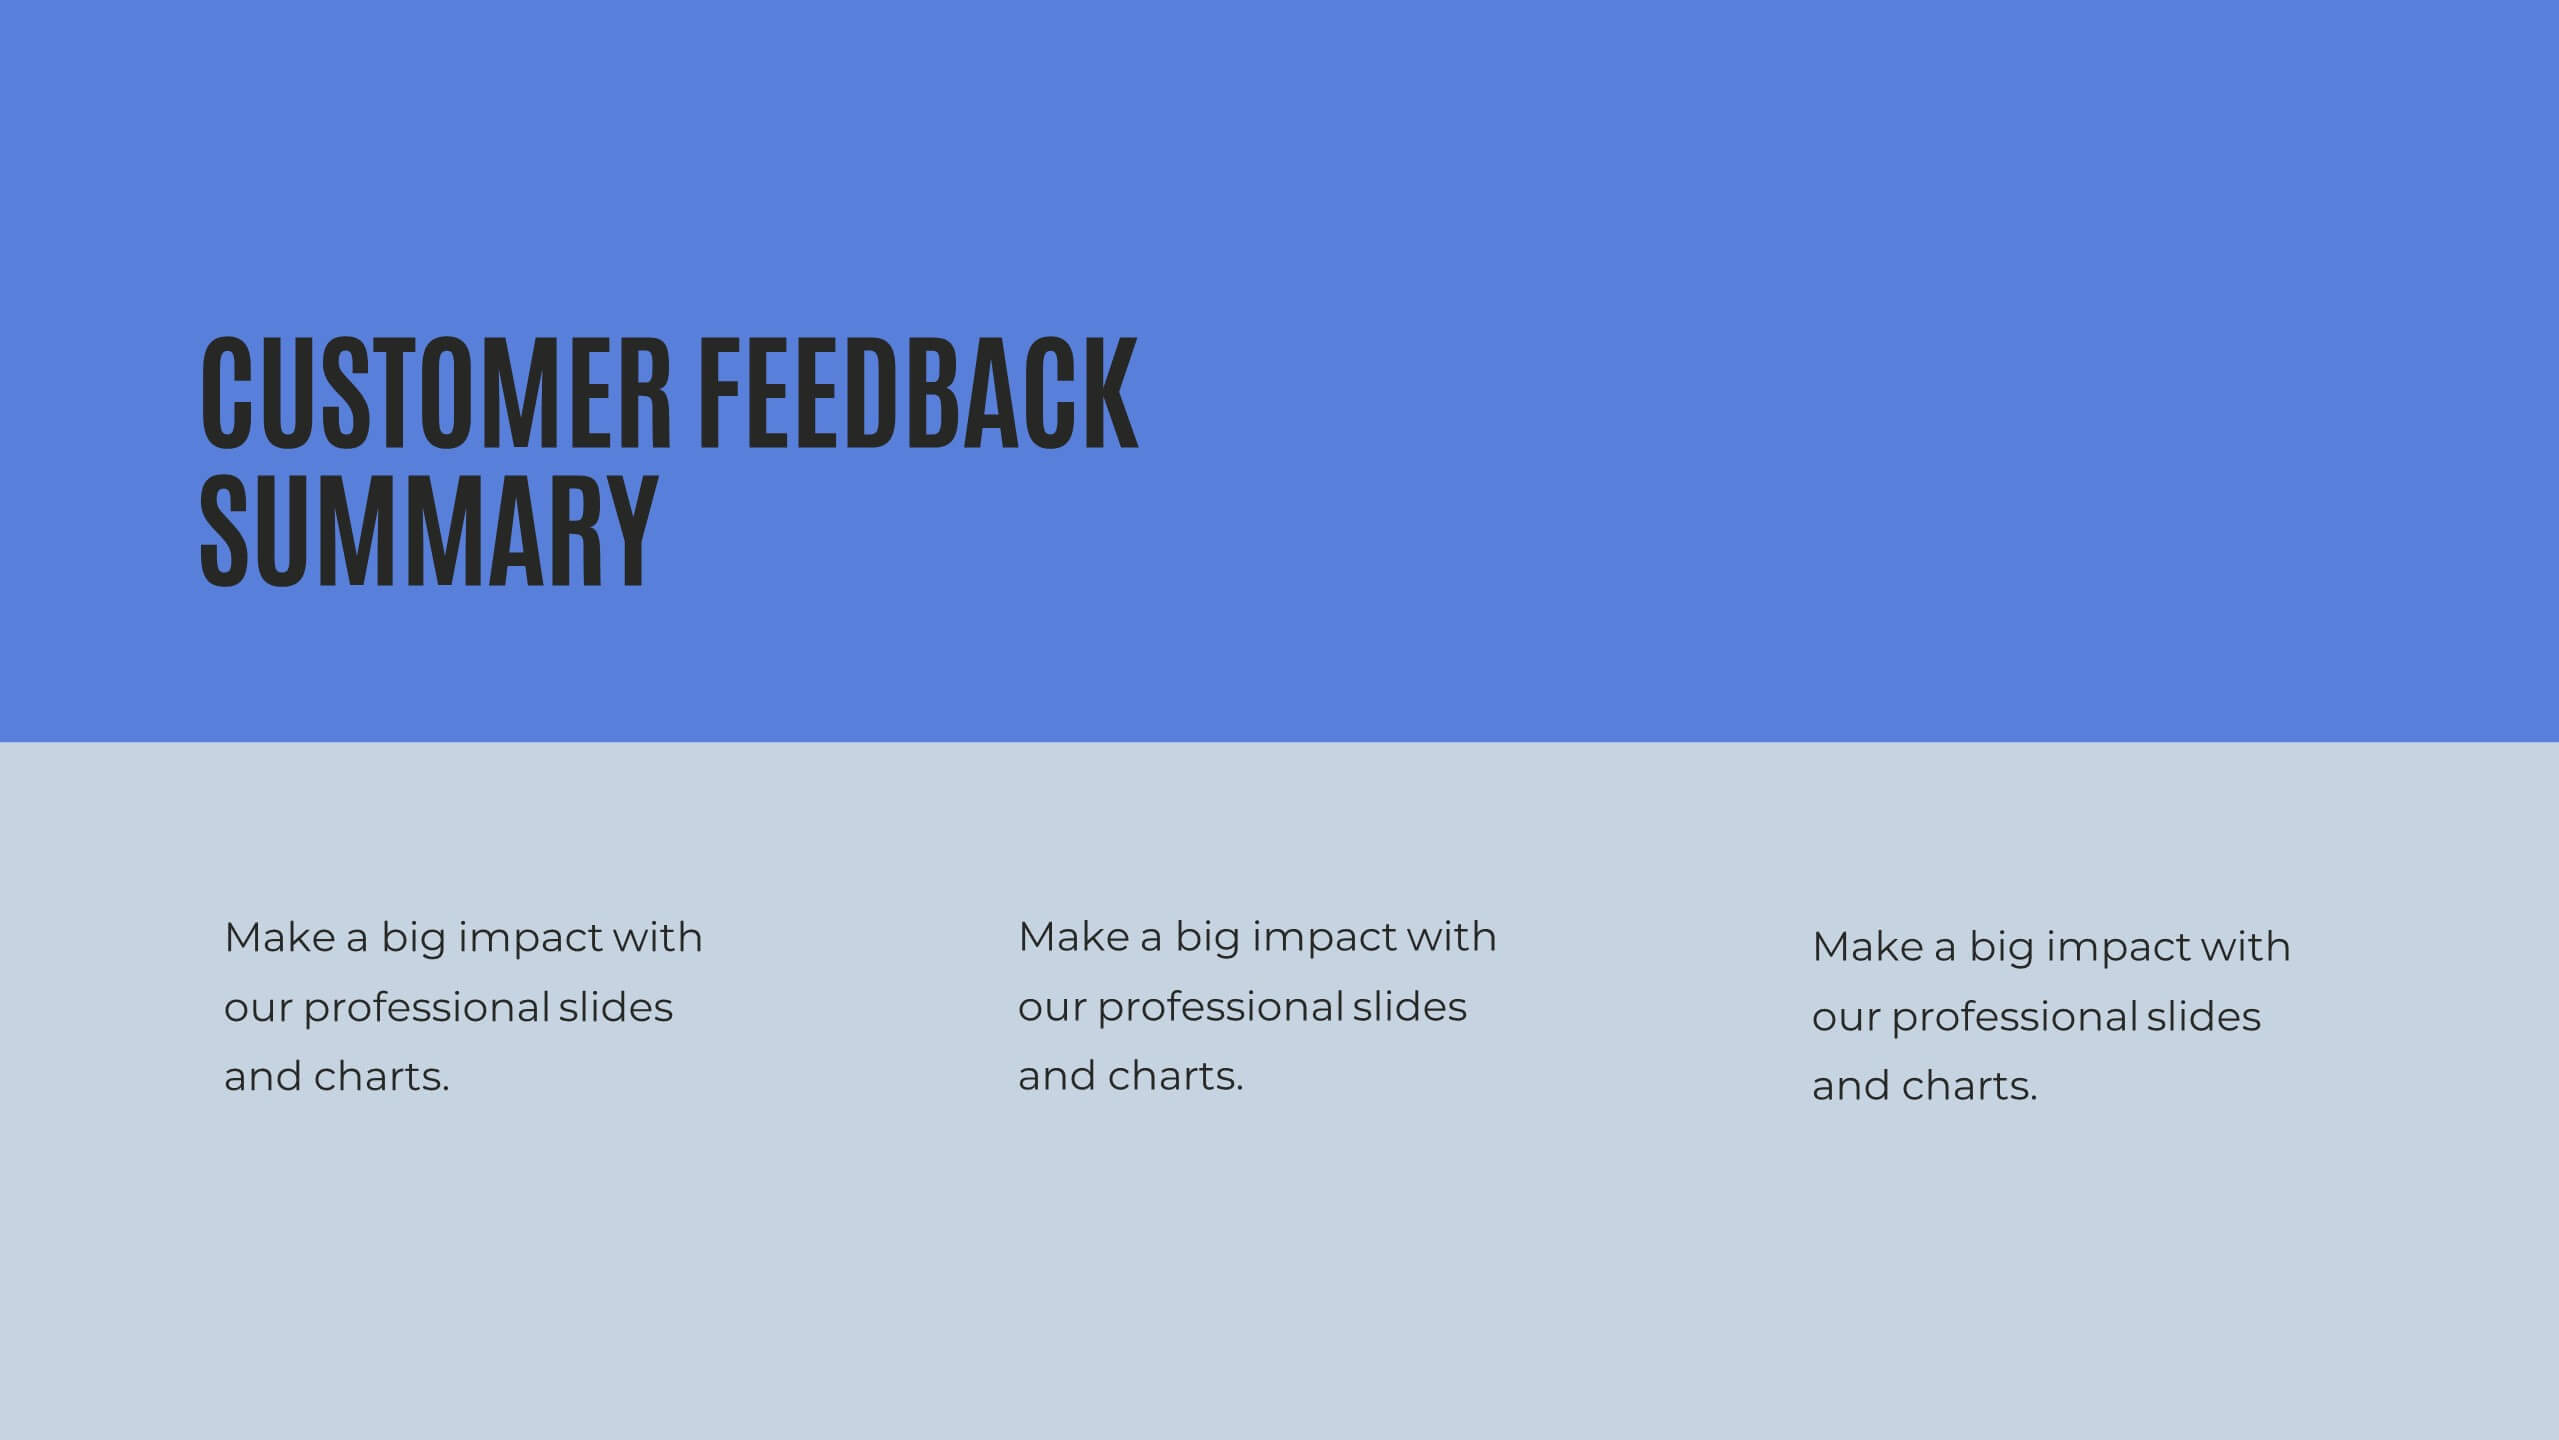
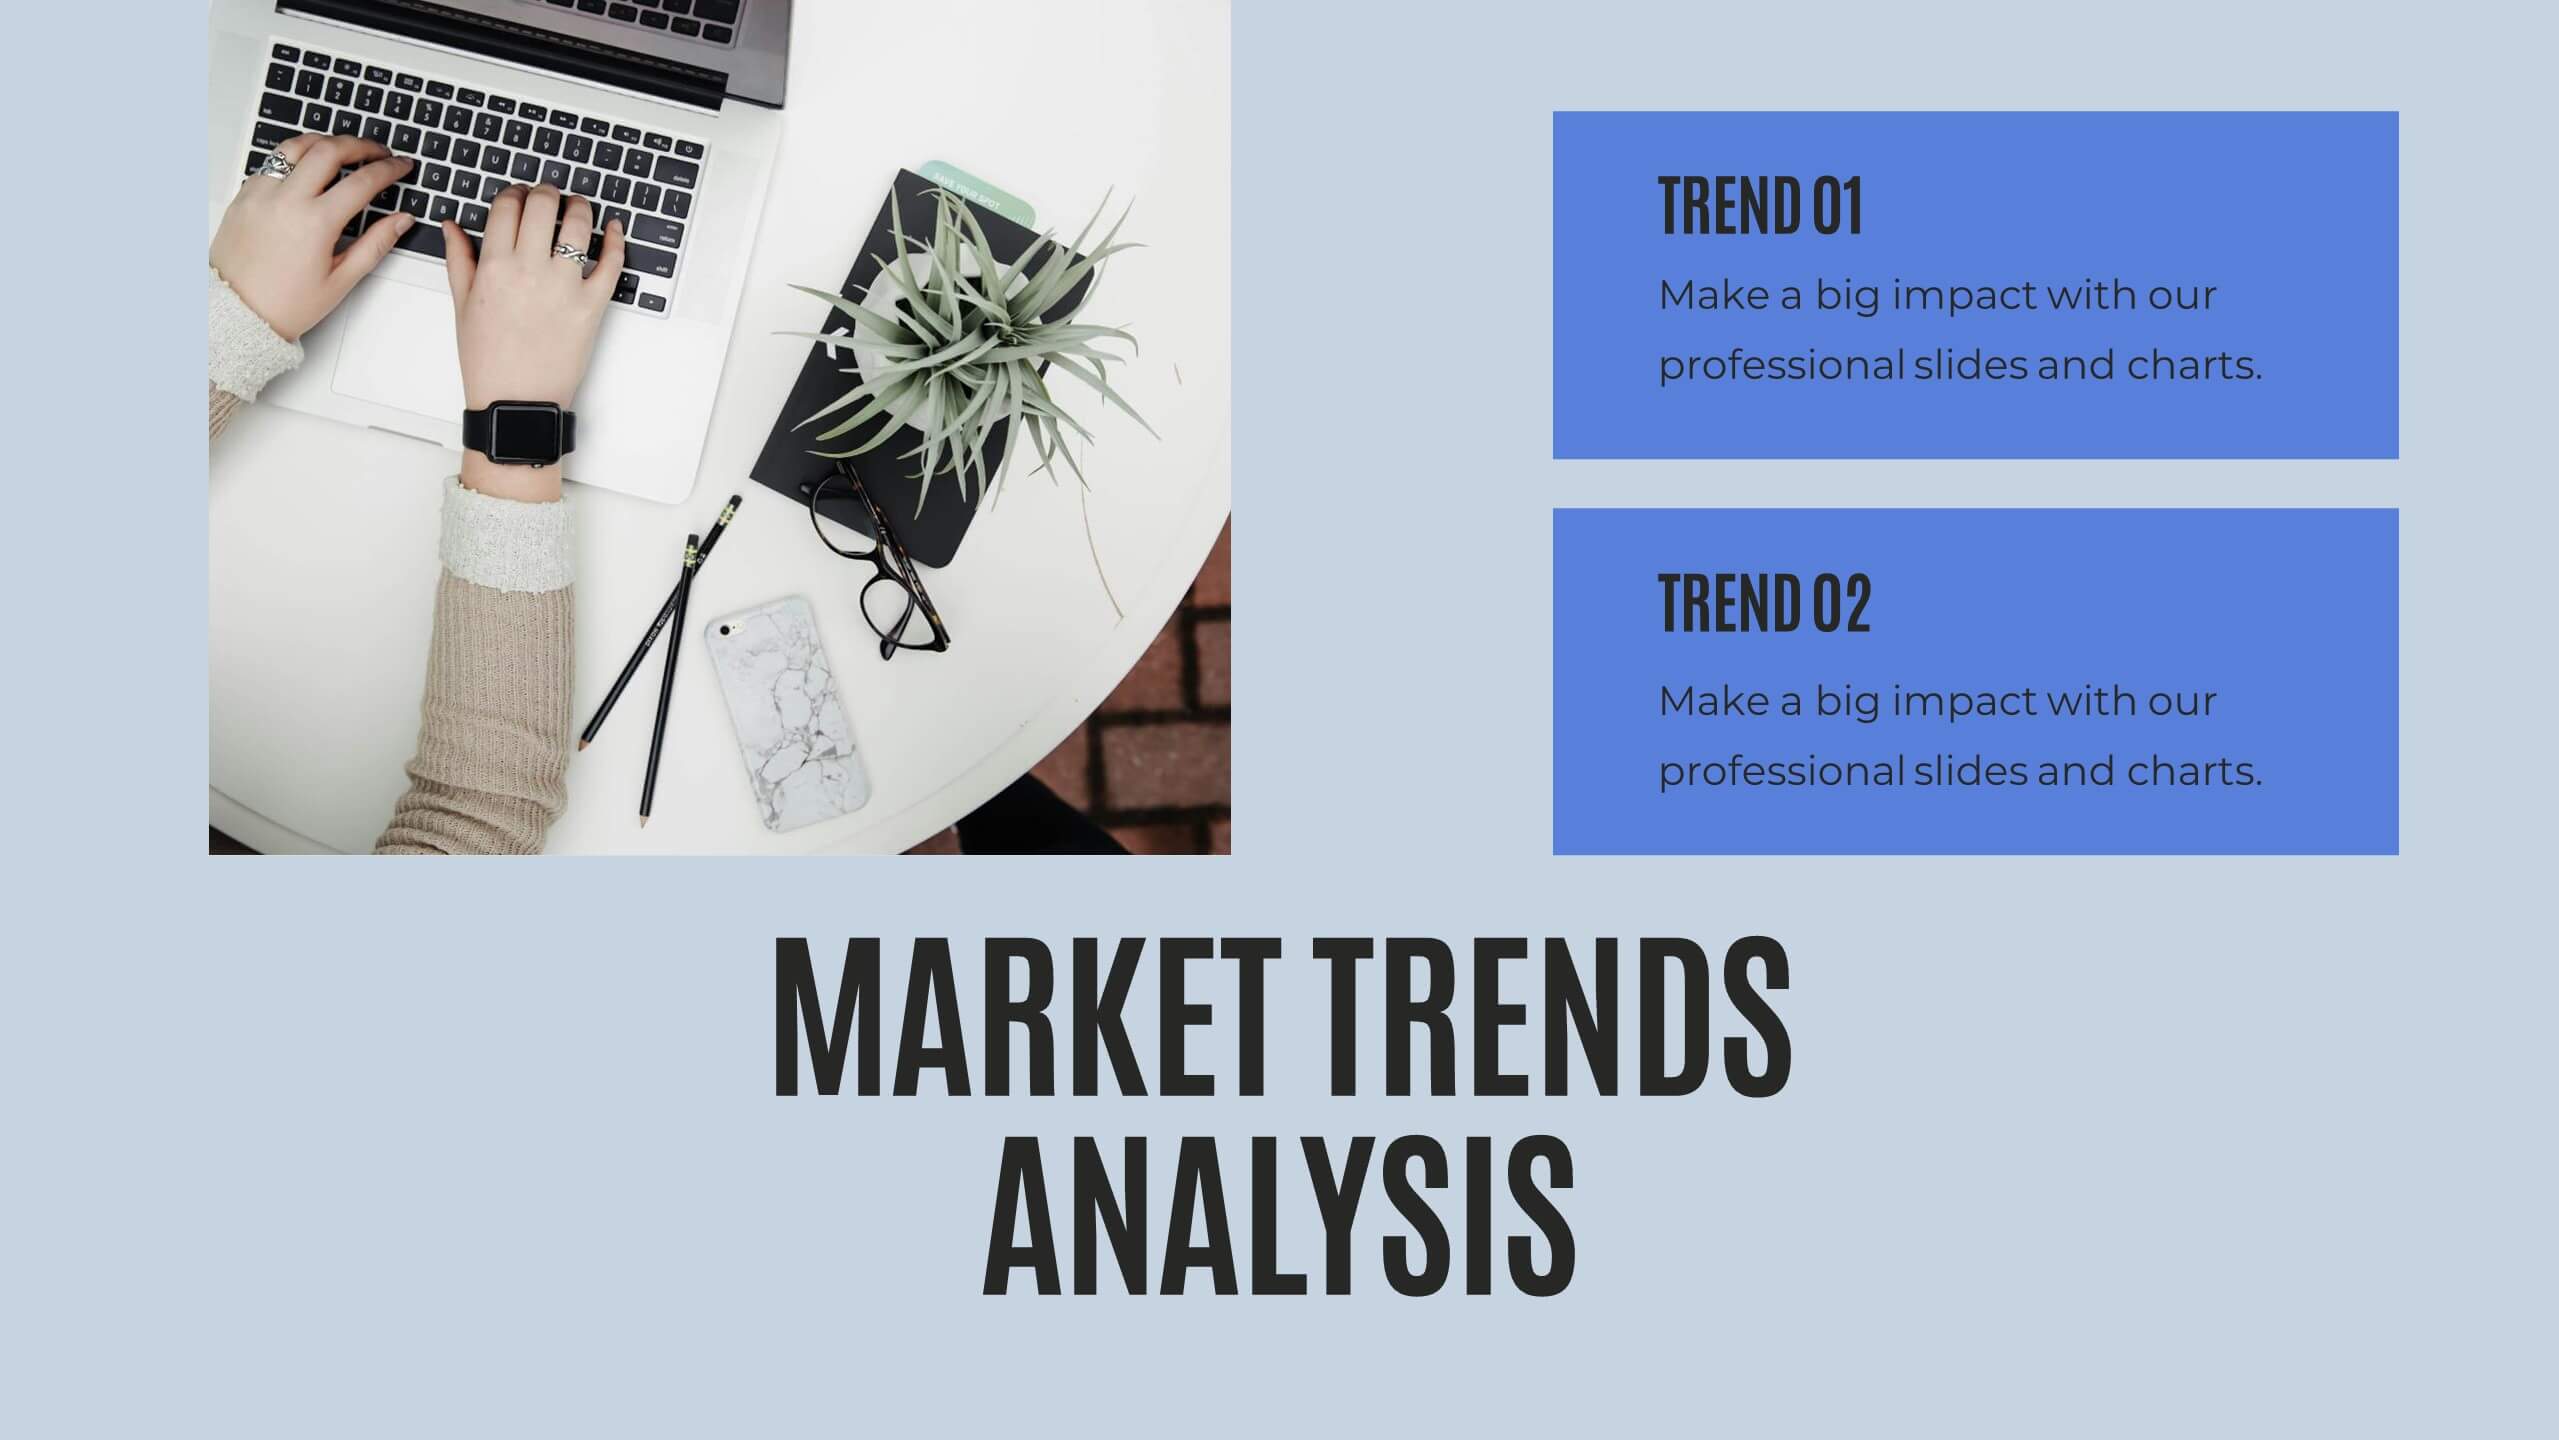
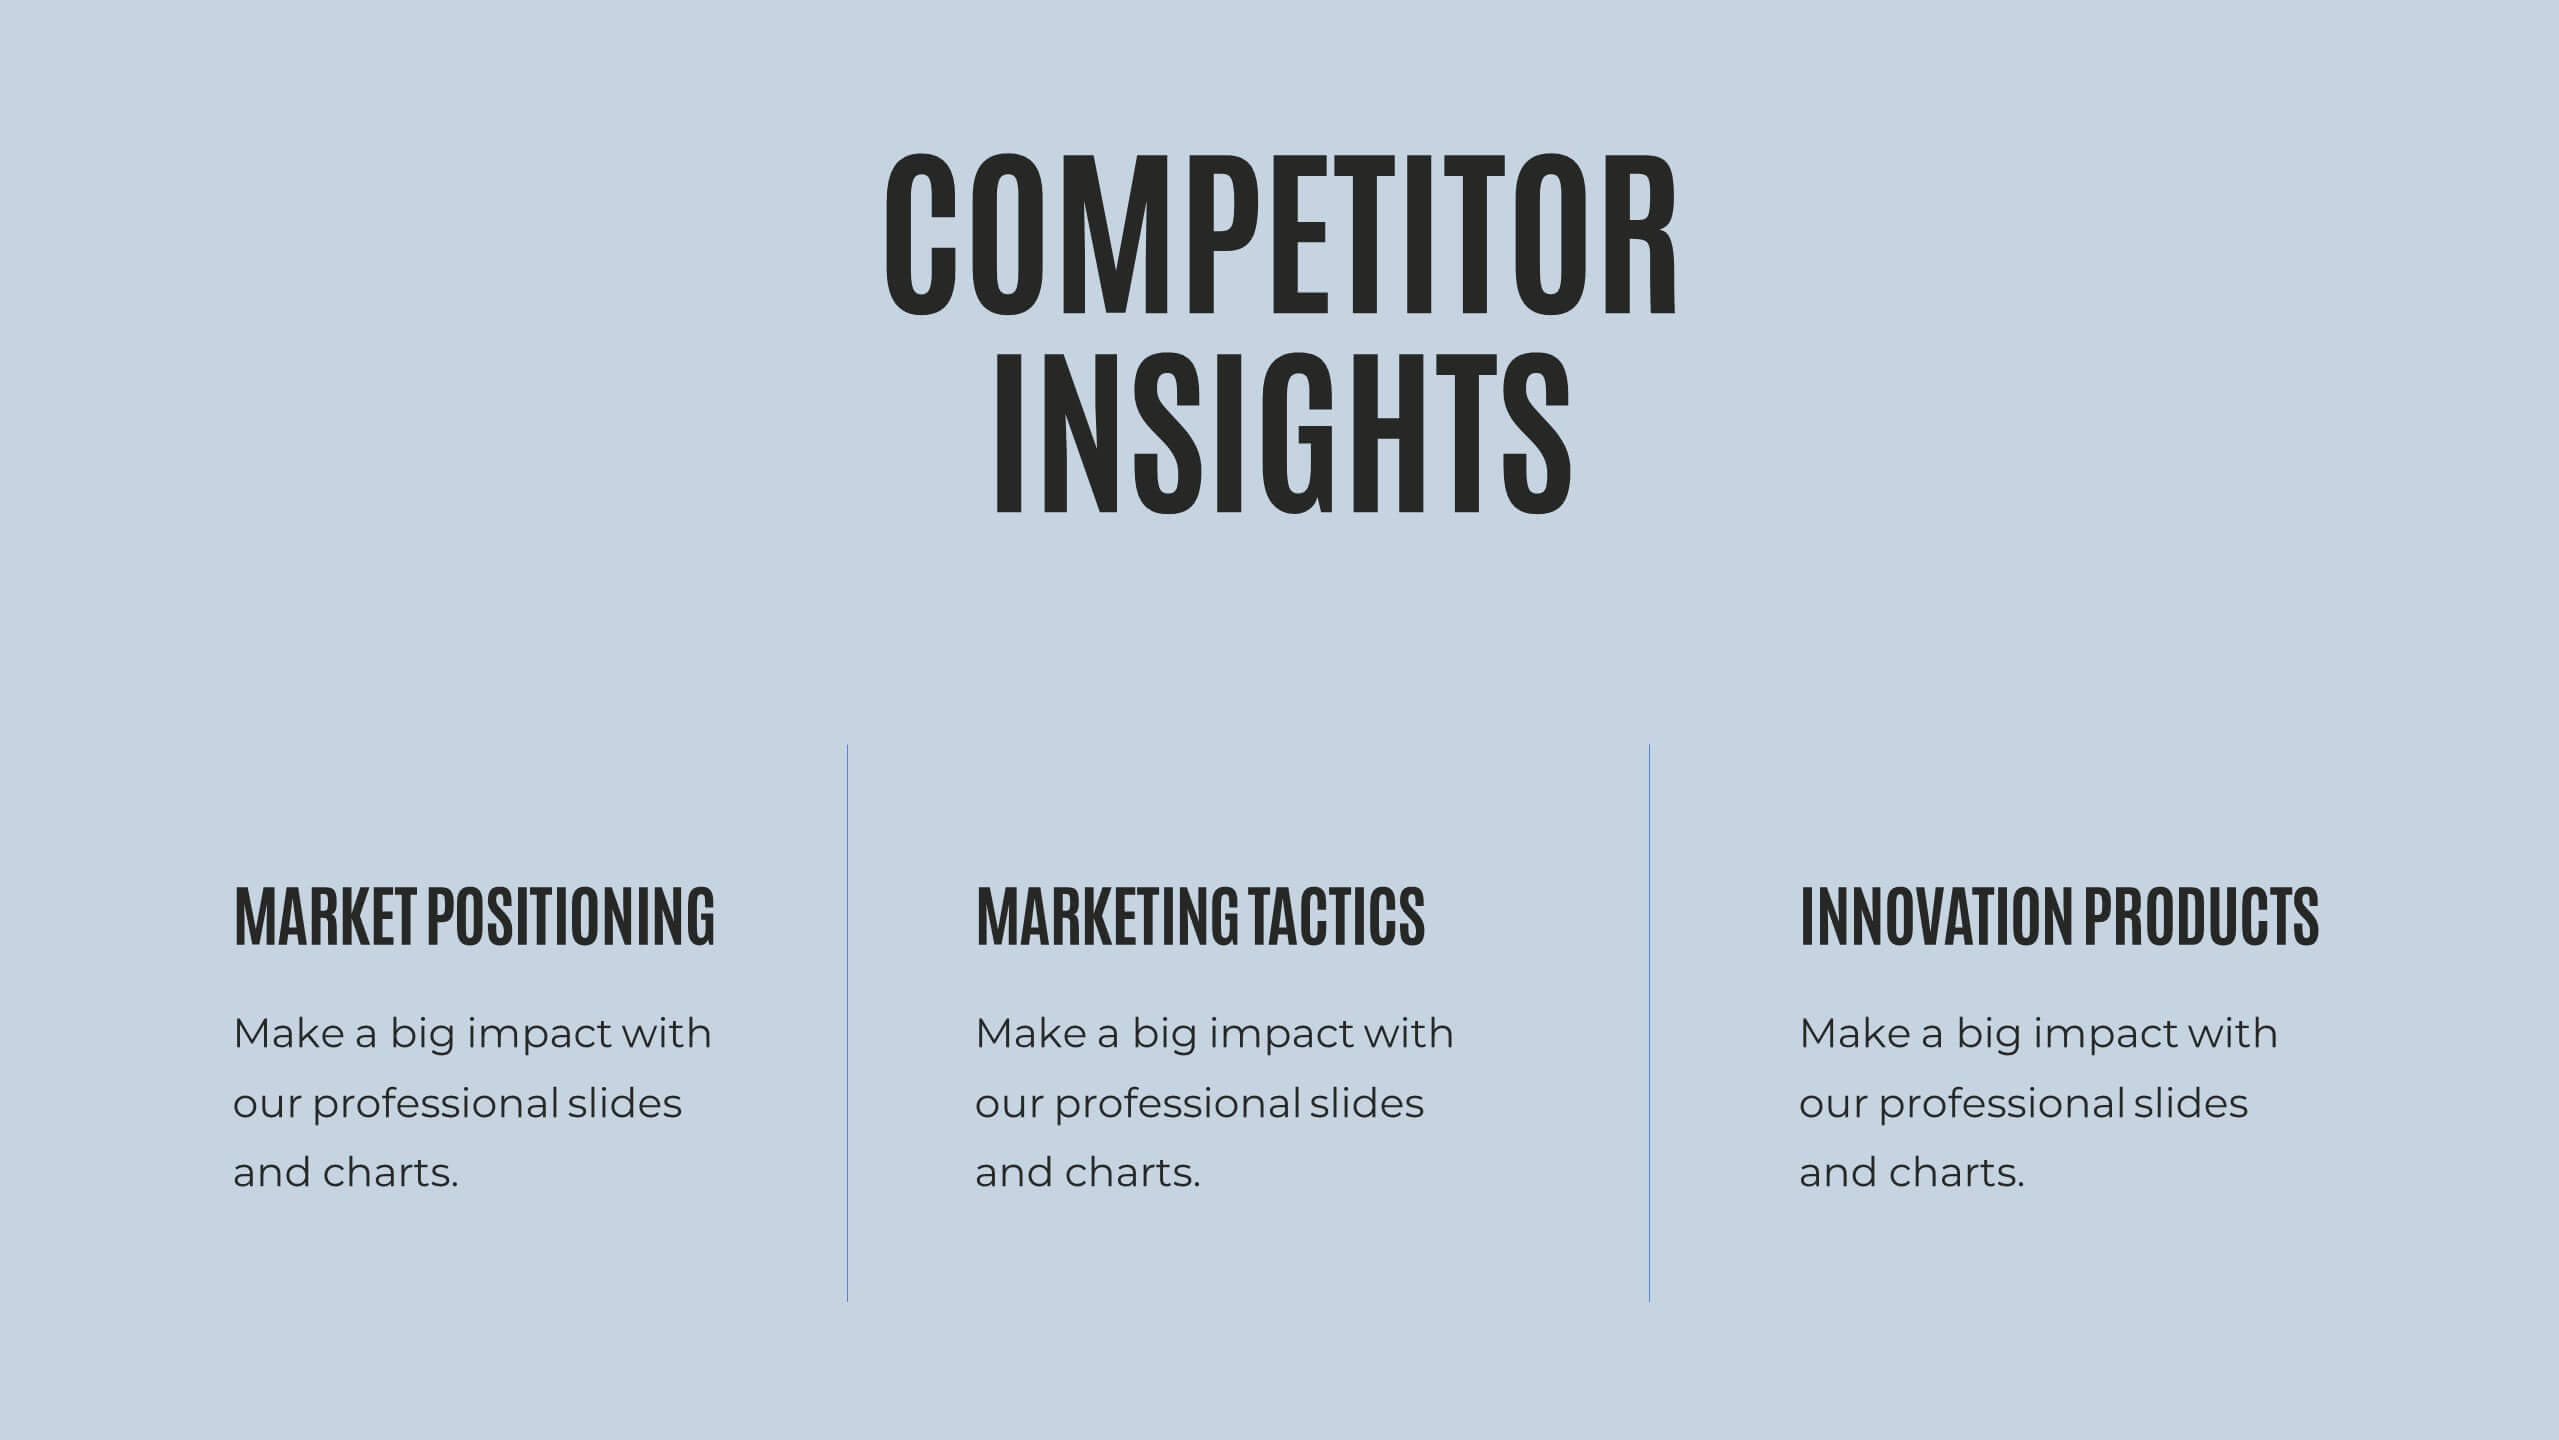
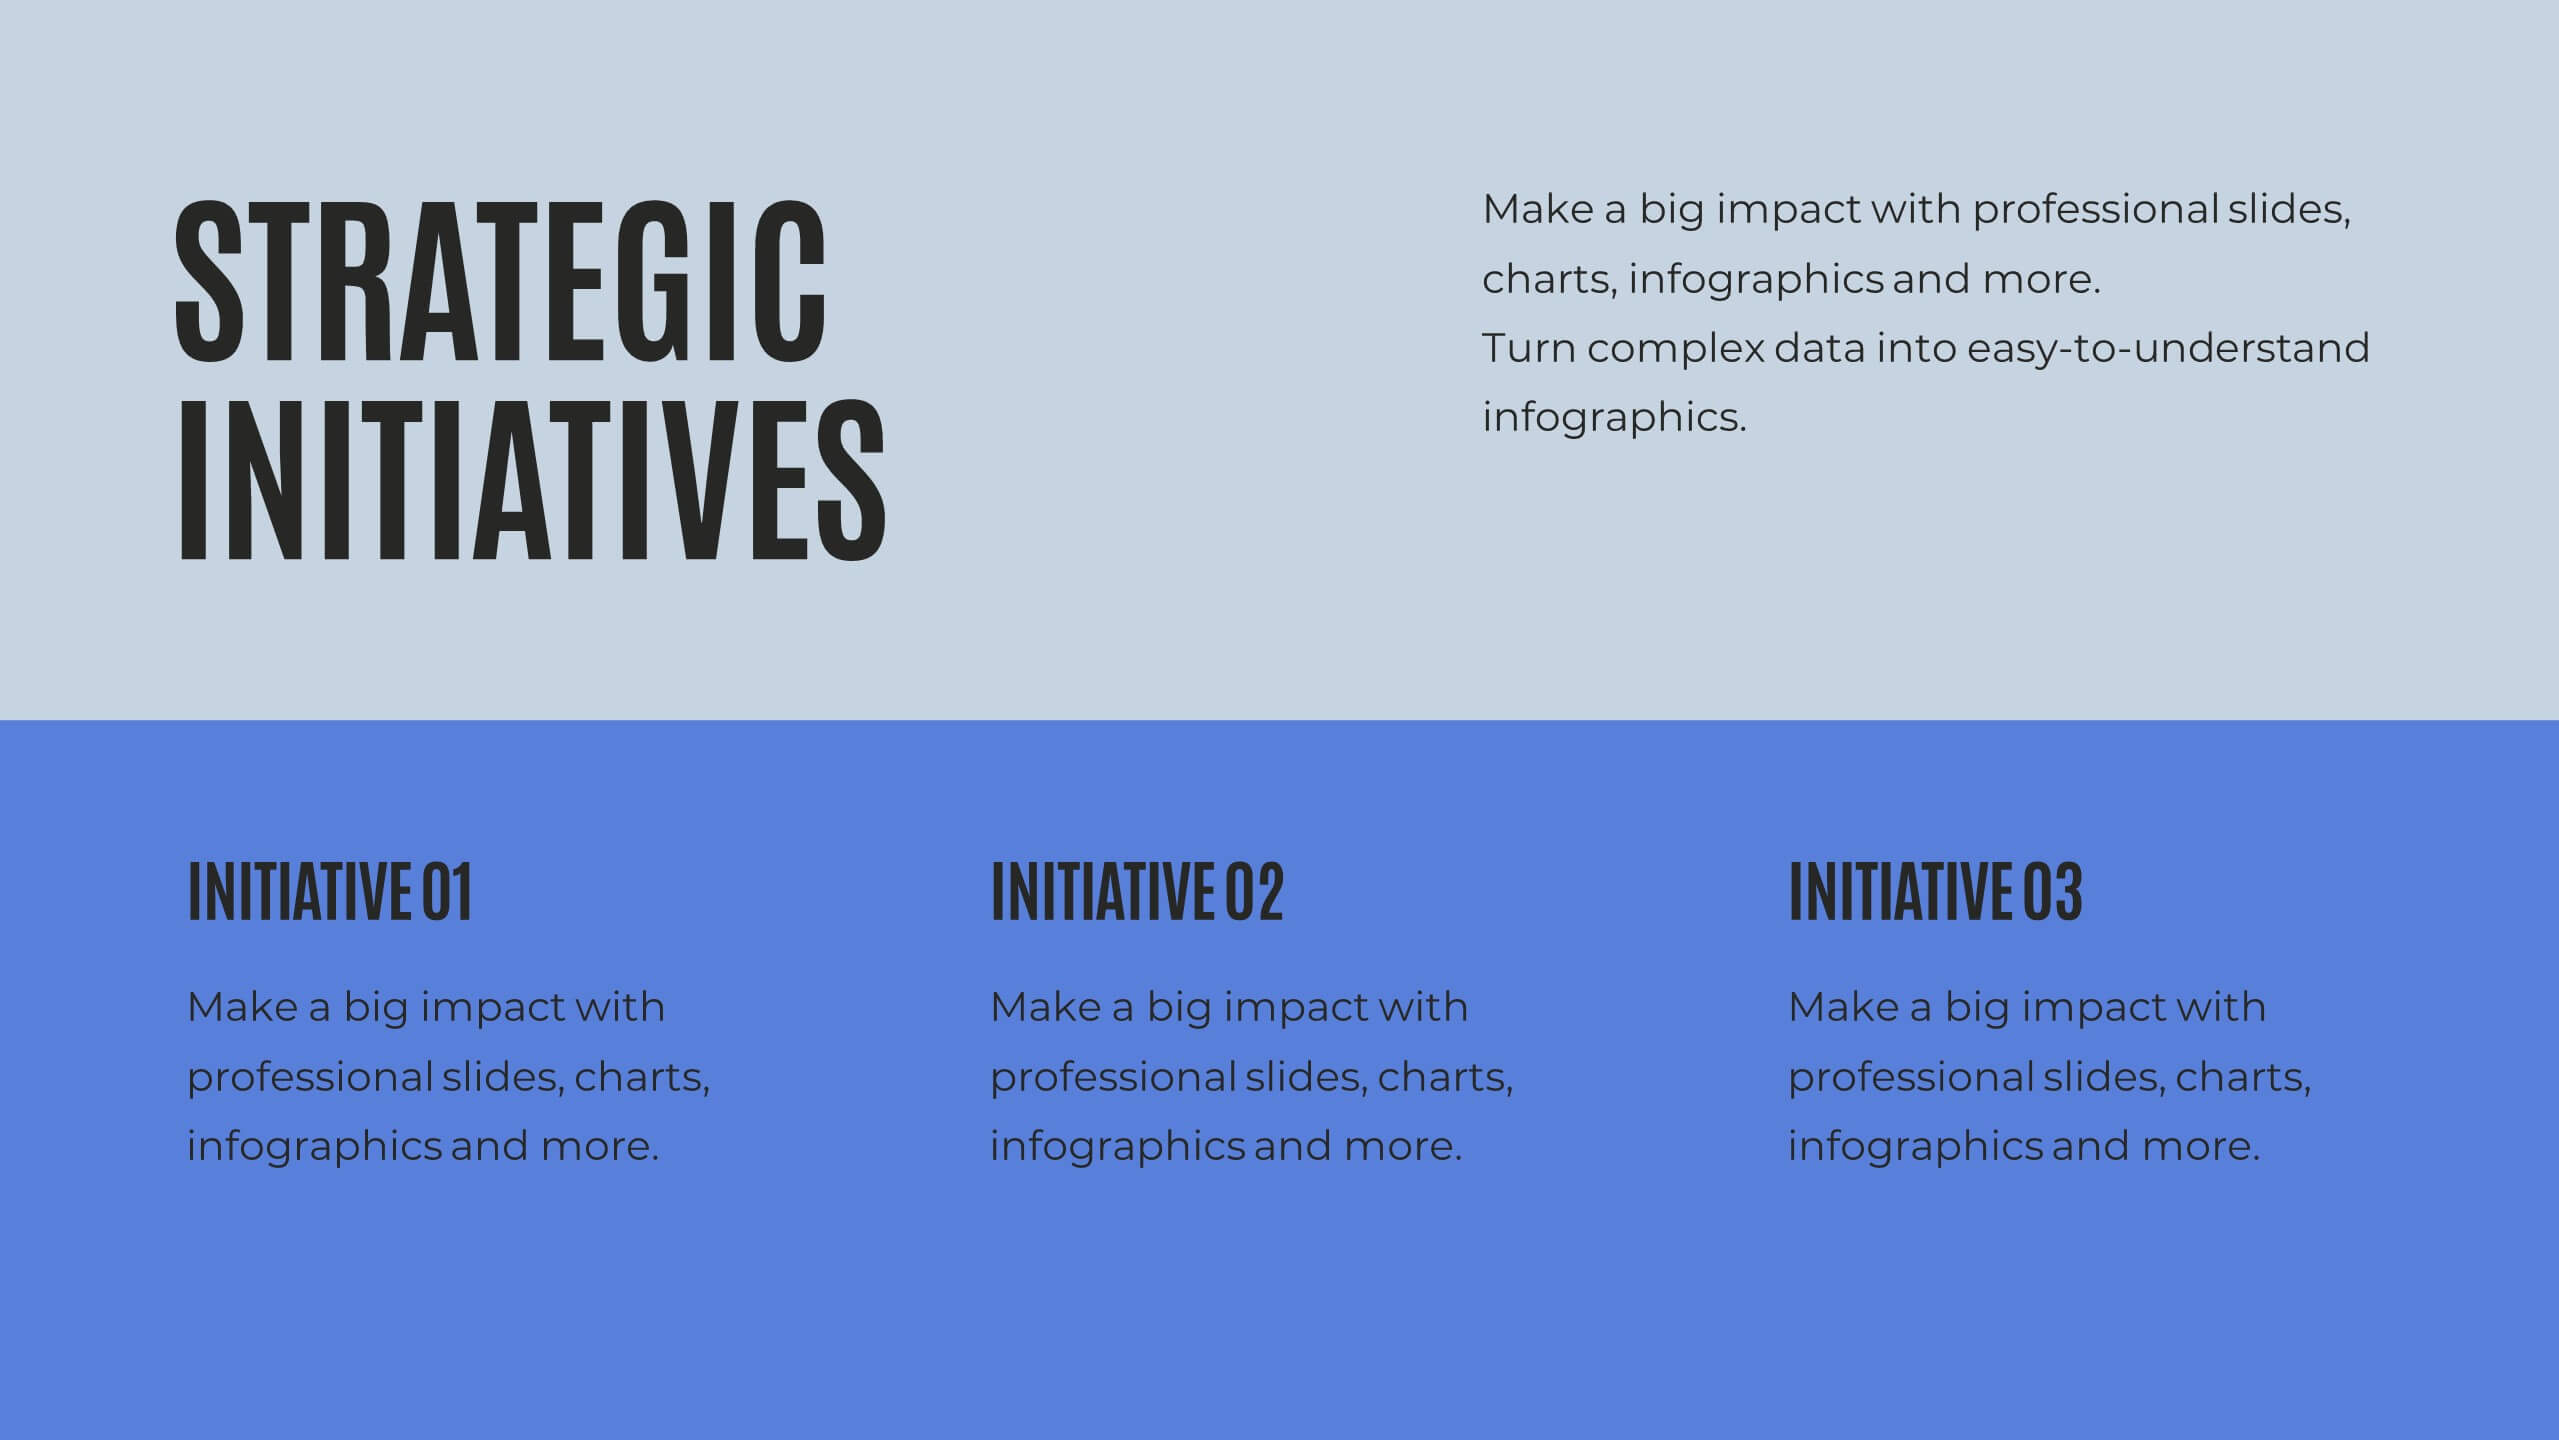
Quill Research Findings Report Presentation
Illuminate your findings with this comprehensive research report template! Perfect for presenting key highlights, performance metrics, and financial summaries, it features professional slides for project progress, risk assessments, and market trends analysis. Engage your audience with clear visuals and detailed content. Compatible with PowerPoint, Keynote, and Google Slides for seamless presentations on any platform.