


Características


¿Tienes alguna pregunta?
Recomendar


5 diapositivas
Creative Alphabet Display Template
Make your message memorable with the Creative Alphabet Display Template Presentation. This slide uses bold, interlocking letter shapes to showcase four key ideas in a linear, eye-catching format—perfect for step-by-step processes, value breakdowns, or themed concepts. Fully editable in PowerPoint, Keynote, and Google Slides.


23 diapositivas
Nymph Startup Pitch Deck Presentation
This startup pitch deck template covers all the essentials for presenting a business. It includes slides for mission and vision, business model, market analysis, value proposition, and financial overview. Easily customizable for any startup industry, this modern design makes presenting your ideas a breeze. Compatible with PowerPoint, Keynote, and Google Slides.


8 diapositivas
Business Challenge and Issue Definition Presentation
Break down complex problems with clarity using this Business Challenge and Issue Definition presentation. Designed to highlight key issues step by step, this layout helps your audience follow your reasoning with ease. Ideal for internal reviews or strategy alignment, it’s fully editable in Canva, PowerPoint, and Google Slides.


5 diapositivas
Problem-Solving and Challenge Resolution Presentation
Solve problems efficiently with a structured approach using this Problem-Solving and Challenge Resolution template. Featuring a unique visual of connecting solutions like a plug and socket, this slide helps break down problems, present solutions, and demonstrate effective decision-making strategies. Ideal for brainstorming sessions, business strategy meetings, and risk management discussions, this template is fully customizable and compatible with PowerPoint, Keynote, and Google Slides.


10 diapositivas
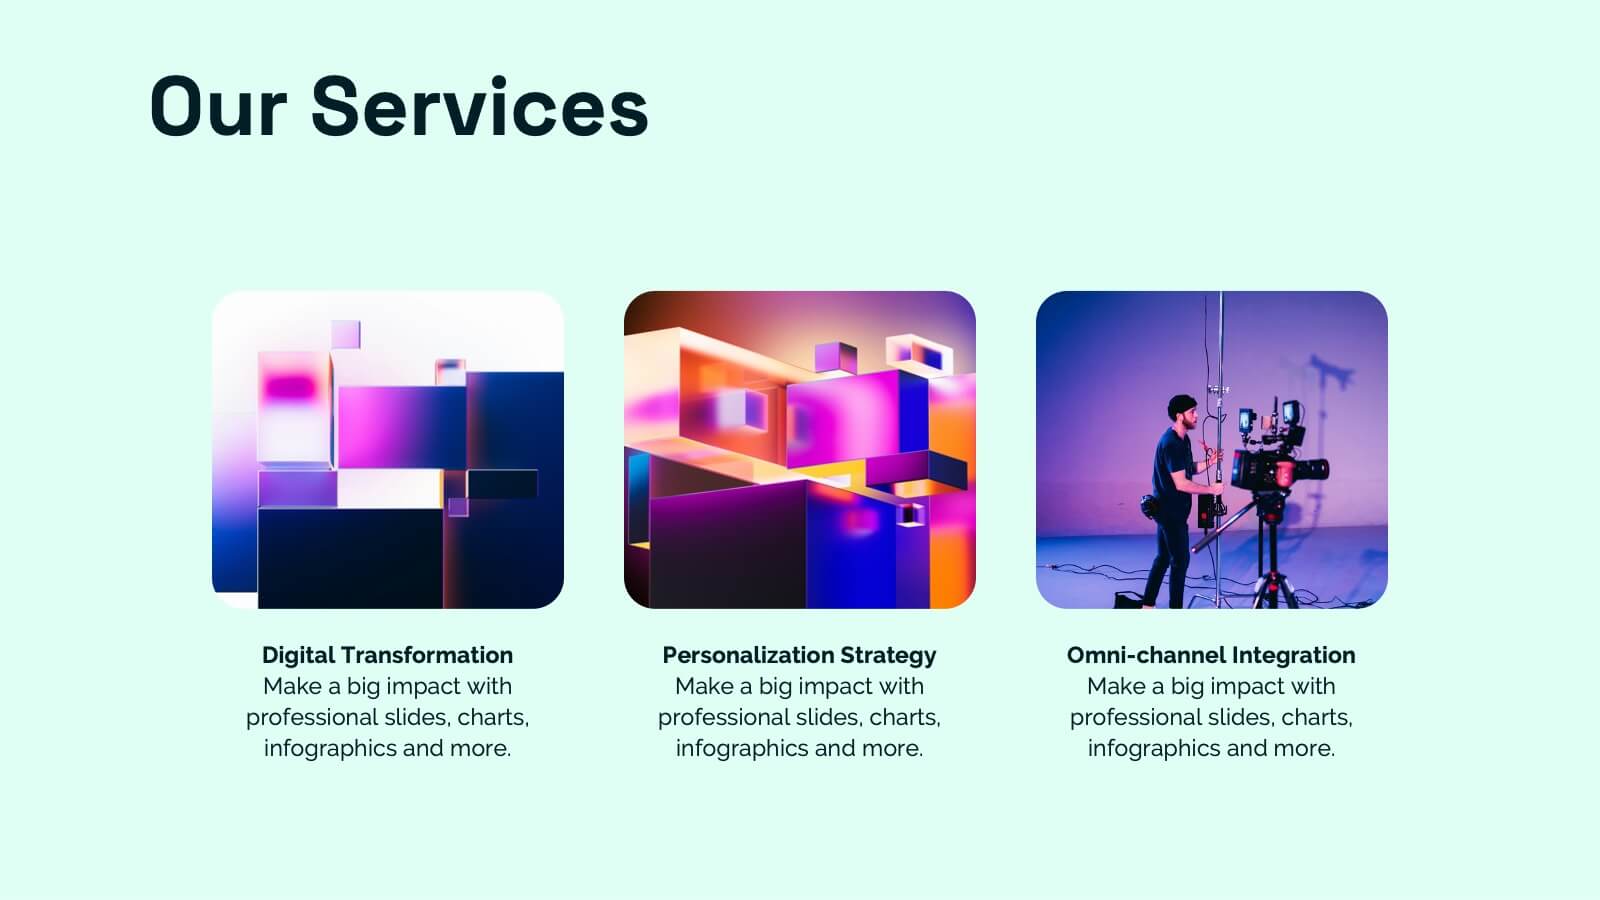
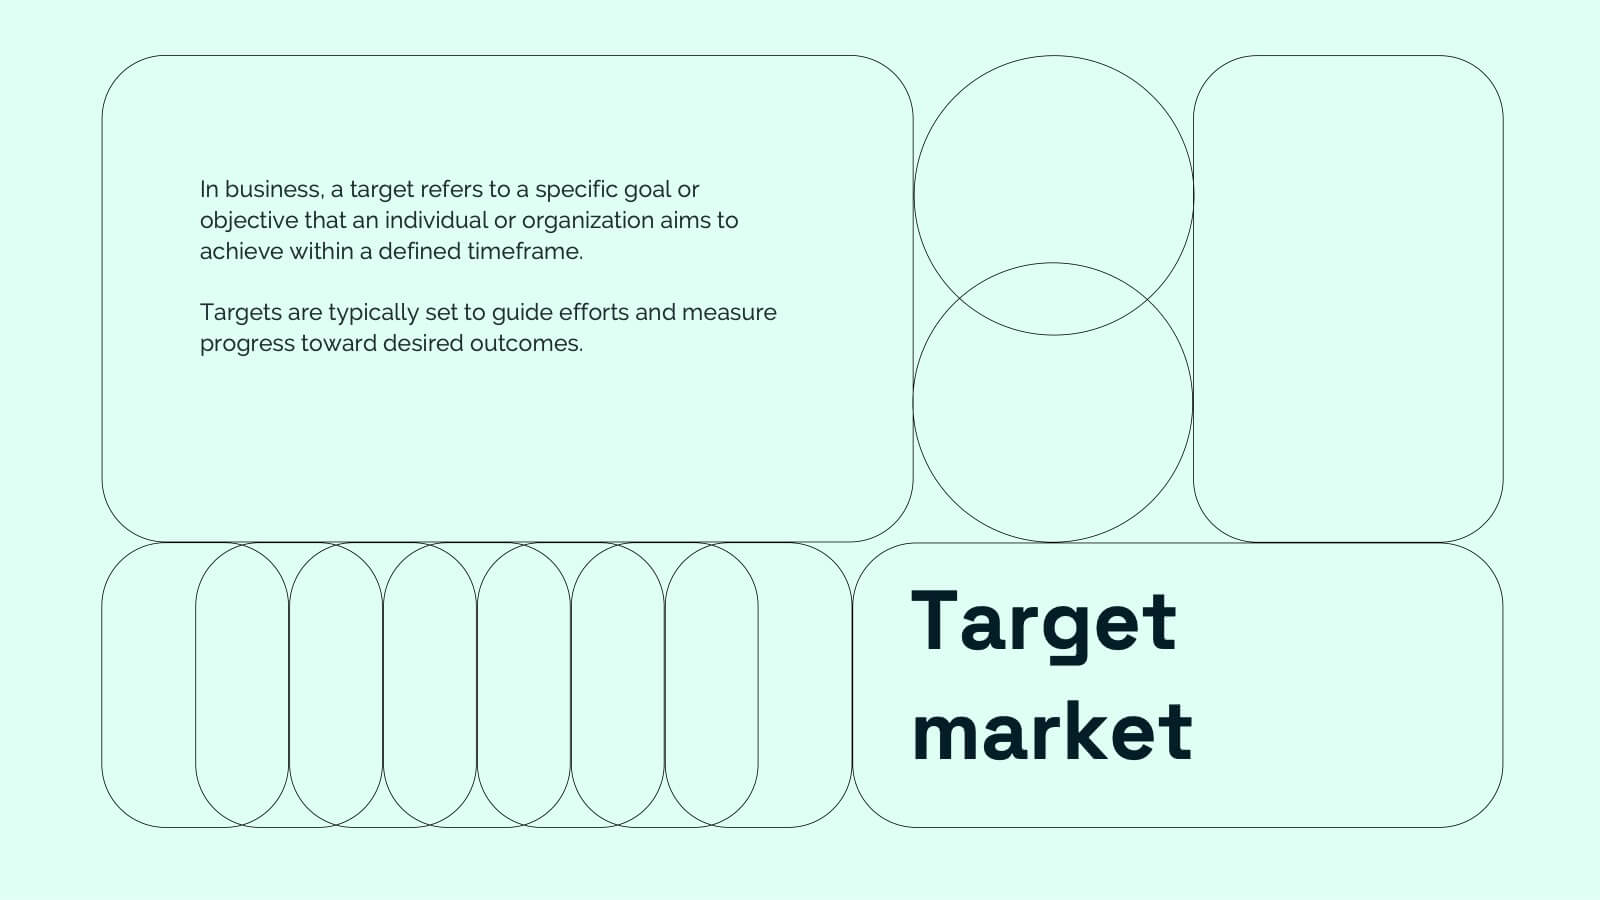
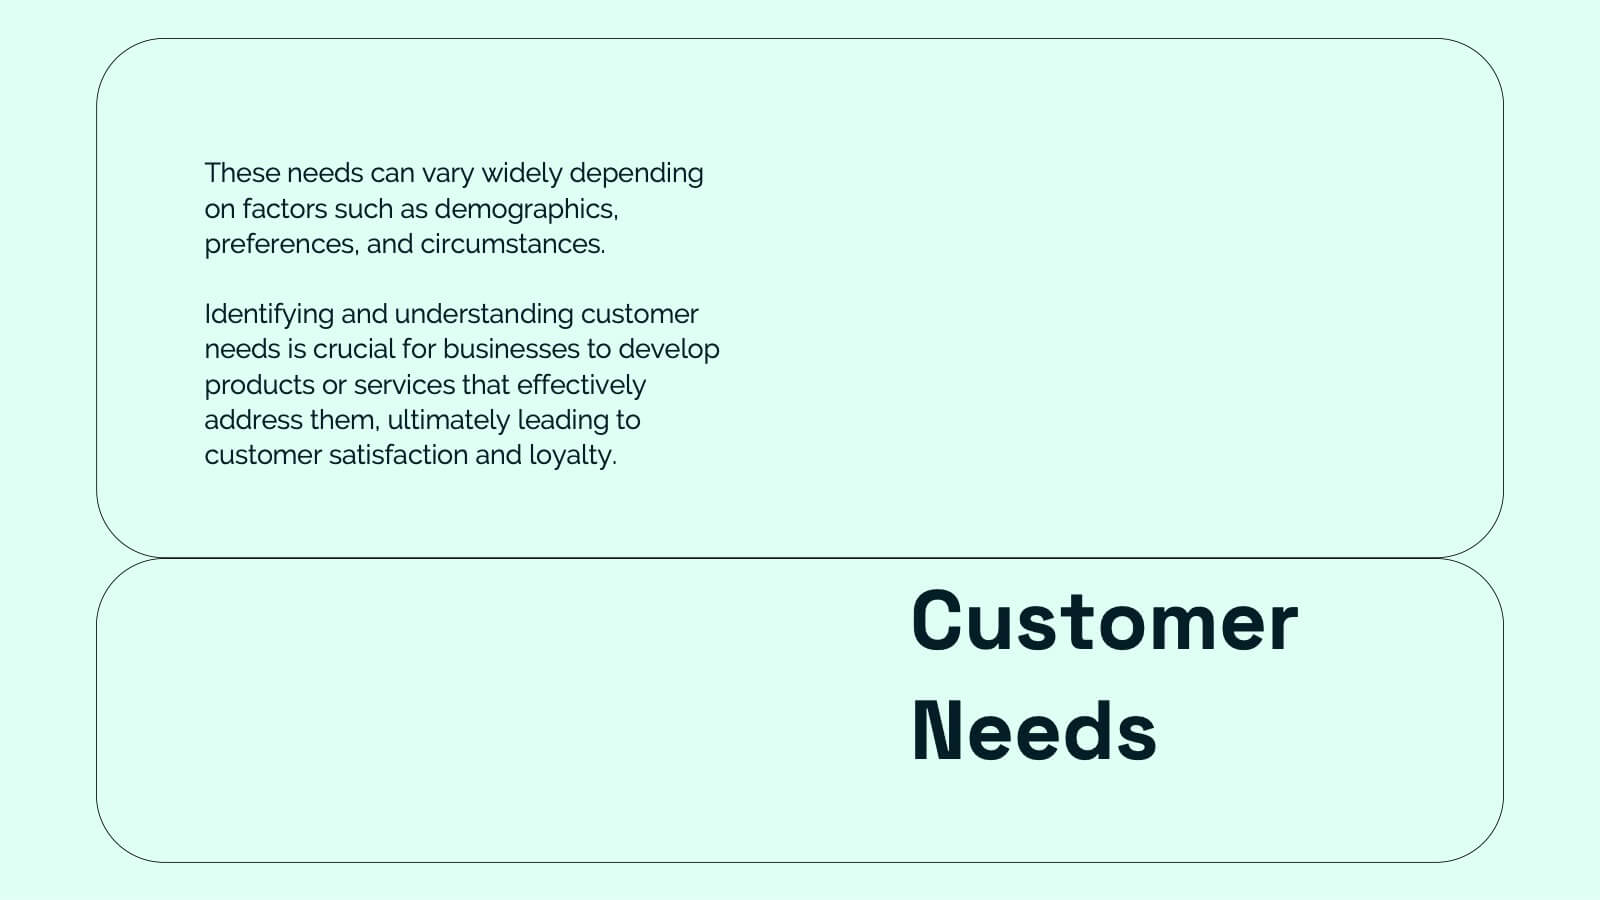
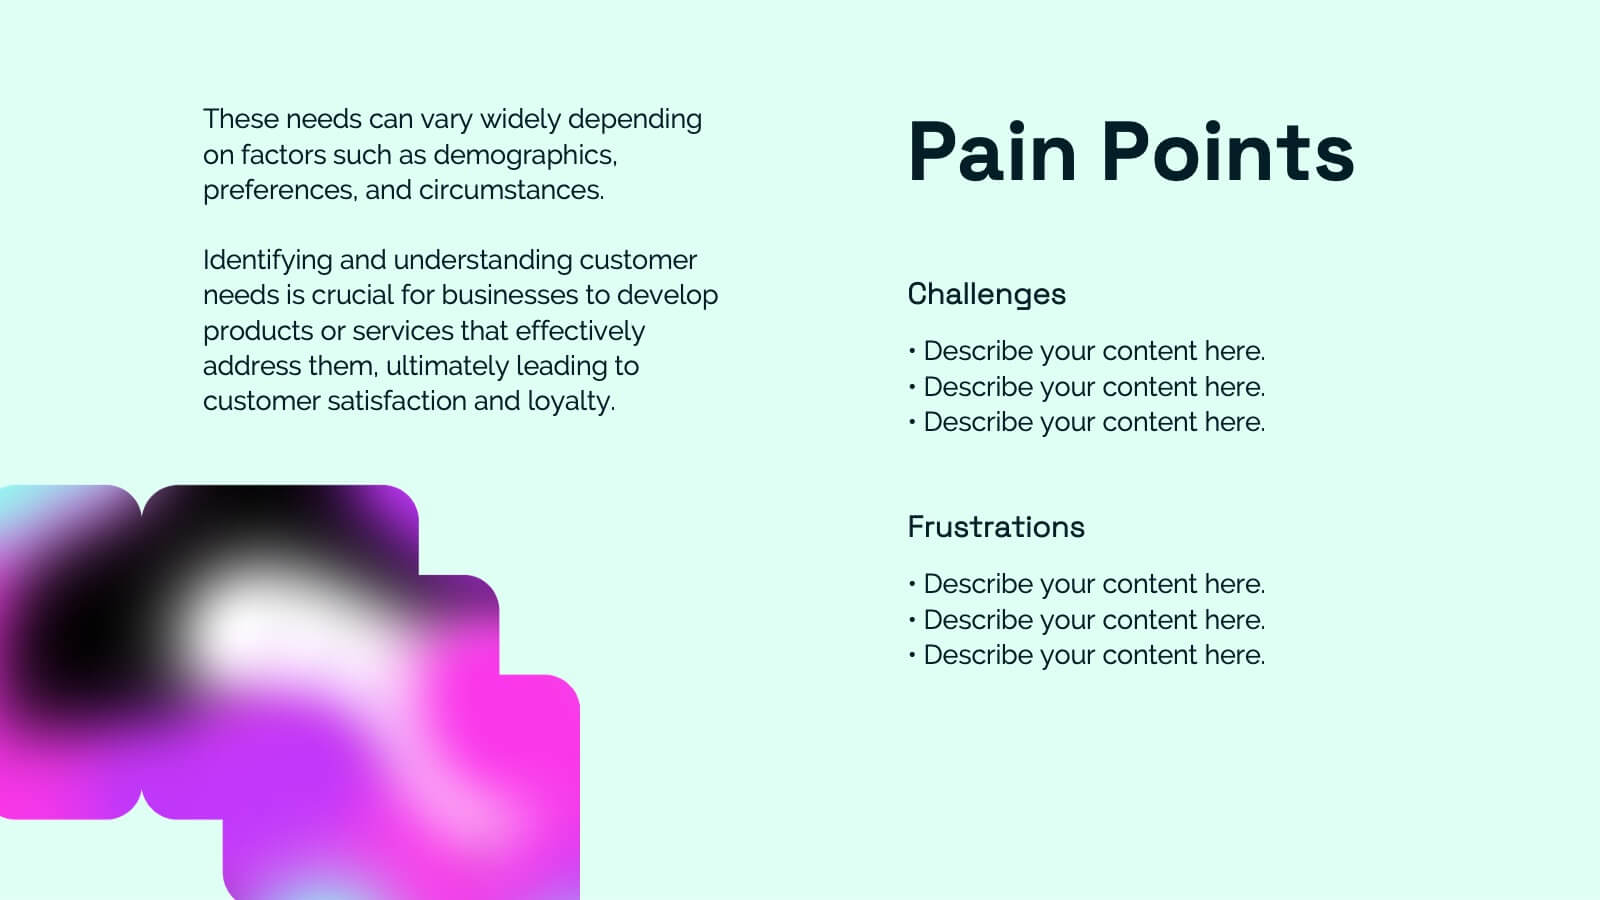
Digital Transformation Strategy Presentation
The "Digital Transformation Strategy Presentation" template is designed to clearly showcase the stages of digital transformation initiatives. It features a visually appealing layout with concentric circles or varying targets that focus on key elements of transformation strategy. This format is ideal for emphasizing the progression from planning to execution and monitoring of digital strategies. Each section is distinctly colored and provides a space for succinctly labeled titles and detailed descriptions, making it perfect for presenting strategic initiatives, technology implementation, or progress metrics in corporate settings. The template ensures that complex strategies are communicated in an understandable and visually engaging manner.


6 diapositivas
Investment Property Infographics
Step into the world of real estate with enthusiasm! This infographic opens doors to a wealth of opportunities. From the allure of rental income to the tax advantages that can boost your financial gains, we unveil the secrets that make investment properties a wise choice. Becoming a successful investor requires knowing the terrain. Dive into the nuances of property location, type, and market conditions. Gain insights into financing options, from traditional mortgages to innovative strategies. Uncover the art of property valuation, where location, condition, and appreciation potential hold the keys to your success. With this engaging infographic compatible with PowerPoint, Keynote, and Google Slides, sharing your real estate wisdom has never been easier. Empower yourself with the knowledge to unlock the potential of investment properties and set sail on a journey towards financial freedom.


4 diapositivas
Scrum & Agile Sprint Presentation
Bring movement and clarity to your workflow with a dynamic loop-and-sprint visual that makes progress feel intuitive and easy to track. This presentation helps you outline iterations, refine tasks, and communicate team priorities with confidence. Fully editable and compatible with PowerPoint, Keynote, and Google Slides.


5 diapositivas
Client Success Story Presentation
Celebrate achievements and highlight results with a vibrant, storytelling layout that turns client wins into memorable visuals. Perfect for showcasing success milestones, project outcomes, and impact metrics, this presentation helps build trust and credibility. Fully compatible with PowerPoint, Keynote, and Google Slides for easy editing and smooth professional delivery.


2 diapositivas
Modern Title Slide for Presentation
Make a strong first impression with this Modern Title Slide design. Its bold typography, dual-tone layout, and customizable accent icons create a clean, contemporary aesthetic. Perfect for professional and creative presentations alike. Editable in PowerPoint, Keynote, and Google Slides.


24 diapositivas
Blazewind User Experience Proposal Presentation
This UX Strategy Plan Presentation Template is a comprehensive and visually engaging solution for presenting user experience design strategies. Covering key elements such as research, wireframing, prototyping, user testing, and design principles, it ensures a structured approach to showcasing your UX process. Ideal for UX/UI designers, agencies, and businesses looking to communicate their design strategies effectively. Fully compatible with PowerPoint, Keynote, and Google Slides for seamless customization.


4 diapositivas
Financial Table Layout Presentation
Bring your numbers to life with a clear, colorful layout that makes financial details easy to compare at a glance. This presentation helps you organize pricing tiers, budget insights, or account summaries with clean structure and smooth readability. Fully compatible with PowerPoint, Keynote, and Google Slides.


4 diapositivas
HR Management Strategy Presentation
An engaging, structured design that turns complex planning into a clear, visual story. This presentation guides audiences through essential strategic steps, helping teams understand goals, processes, and people-centered initiatives with ease. Clean icons and modern layouts keep every point focused and professional. Fully compatible with PowerPoint, Keynote, and Google Slides.


5 diapositivas
Interactive Data Analysis Report Presentation
Turn complex data connections into an engaging visual story with this sleek, modern layout. Ideal for presenting analytical findings, performance insights, or interconnected systems, it helps simplify information while keeping it visually dynamic. Fully editable and compatible with PowerPoint, Keynote, and Google Slides for easy customization and professional results.


23 diapositivas
Delphi Investor Pitch Presentation
The Delphi Pitch Deck offers a warm and inviting design, ideal for conveying complex business concepts in a clear and engaging manner. The deck features a cohesive layout that covers all the essential components of a successful pitch, including company overview, problem statement, solution, market opportunity, and target audience. With a focus on optimizing supply chain efficiency, the template is perfect for startups and businesses looking to showcase their unique selling proposition and innovative strategies. The deck also includes detailed sections on business model canvas, revenue model, competitive landscape, and financial projections, ensuring your audience receives a comprehensive understanding of your business. The soft color palette enhances readability while maintaining a professional tone, making it suitable for various industries. Fully compatible with PowerPoint, Keynote, and Google Slides, the Delphi Pitch Deck is the perfect tool for delivering a memorable and persuasive presentation.


6 diapositivas
Credit Card Features Overview Presentation
Bring your audience into the world of smart spending with a clean, visual layout that explains key credit card features in a simple, engaging way. This presentation helps you break down benefits, terms, and essential details with clarity and confidence. Fully editable and compatible with PowerPoint, Keynote, and Google Slides.


5 diapositivas
5-Step Business Optimization Plan Presentation
Showcase your improvement roadmap using this 5-step building block diagram. Perfect for illustrating sequential development, each step is styled like interlocking bricks to convey progress and structure. Fully editable in PowerPoint, Keynote, and Google Slides—ideal for strategic planning, process optimization, and business growth presentations needing a clear step-by-step layout.


6 diapositivas
Funnel Stages Infographic
In marketing and sales, the term "funnel stages" refers to the different stages or steps that a potential customer goes through in their journey from initial awareness of a product or service to making a purchase decision. These infographics visualize and help you understand the customer's progression through these stages. They aim to help businesses and professionals understand the customer journey and optimize their strategies for each stage of the funnel. Whether used in sales presentations, marketing workshops, or educational materials, this template helps businesses build successful sale funnels and maximize their revenue potential.