


Características


¿Tienes alguna pregunta?
Recomendar


7 diapositivas
Root Cause Analysis Infographic Presentation Template
Root cause analysis is a method of problem solving that identifies the cause of an issue and tries to prevent similar issues from happening again. Root cause analysis can be used in any industry, including IT, manufacturing, telecommunications, industrial process control, accident analysis and healthcare to eliminate misunderstandings. This template is perfect if you need an essential problem-solving method. This root cause analysis template includes a helpful timeline to keep track of items that cross through each stage in the process, and a diagram of all the possible causes.
21 diapositivas
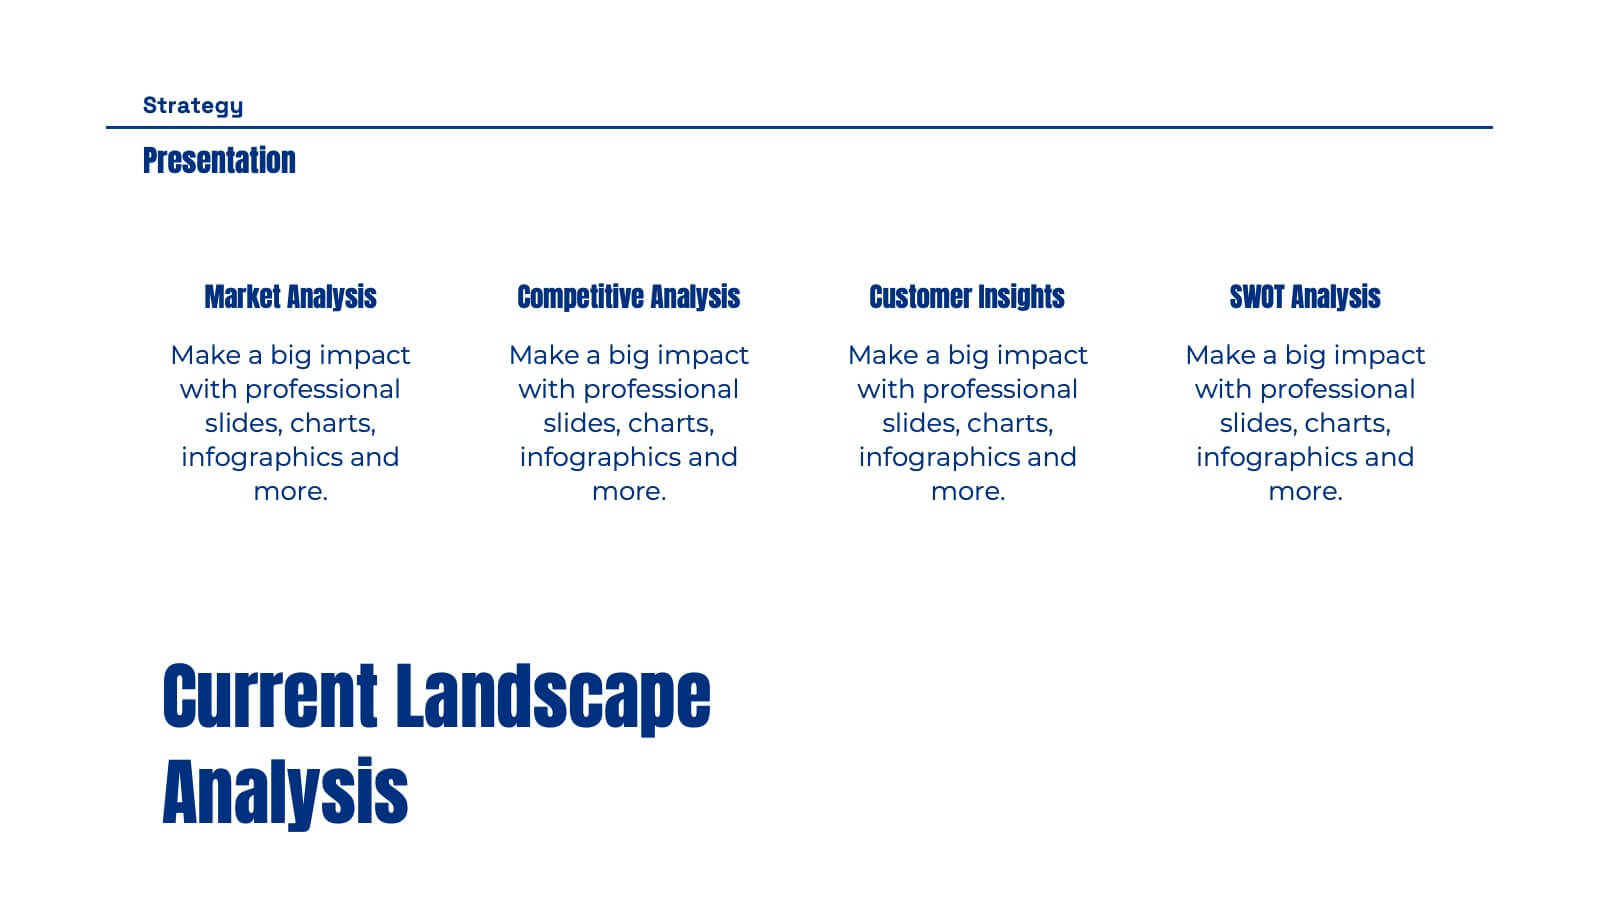
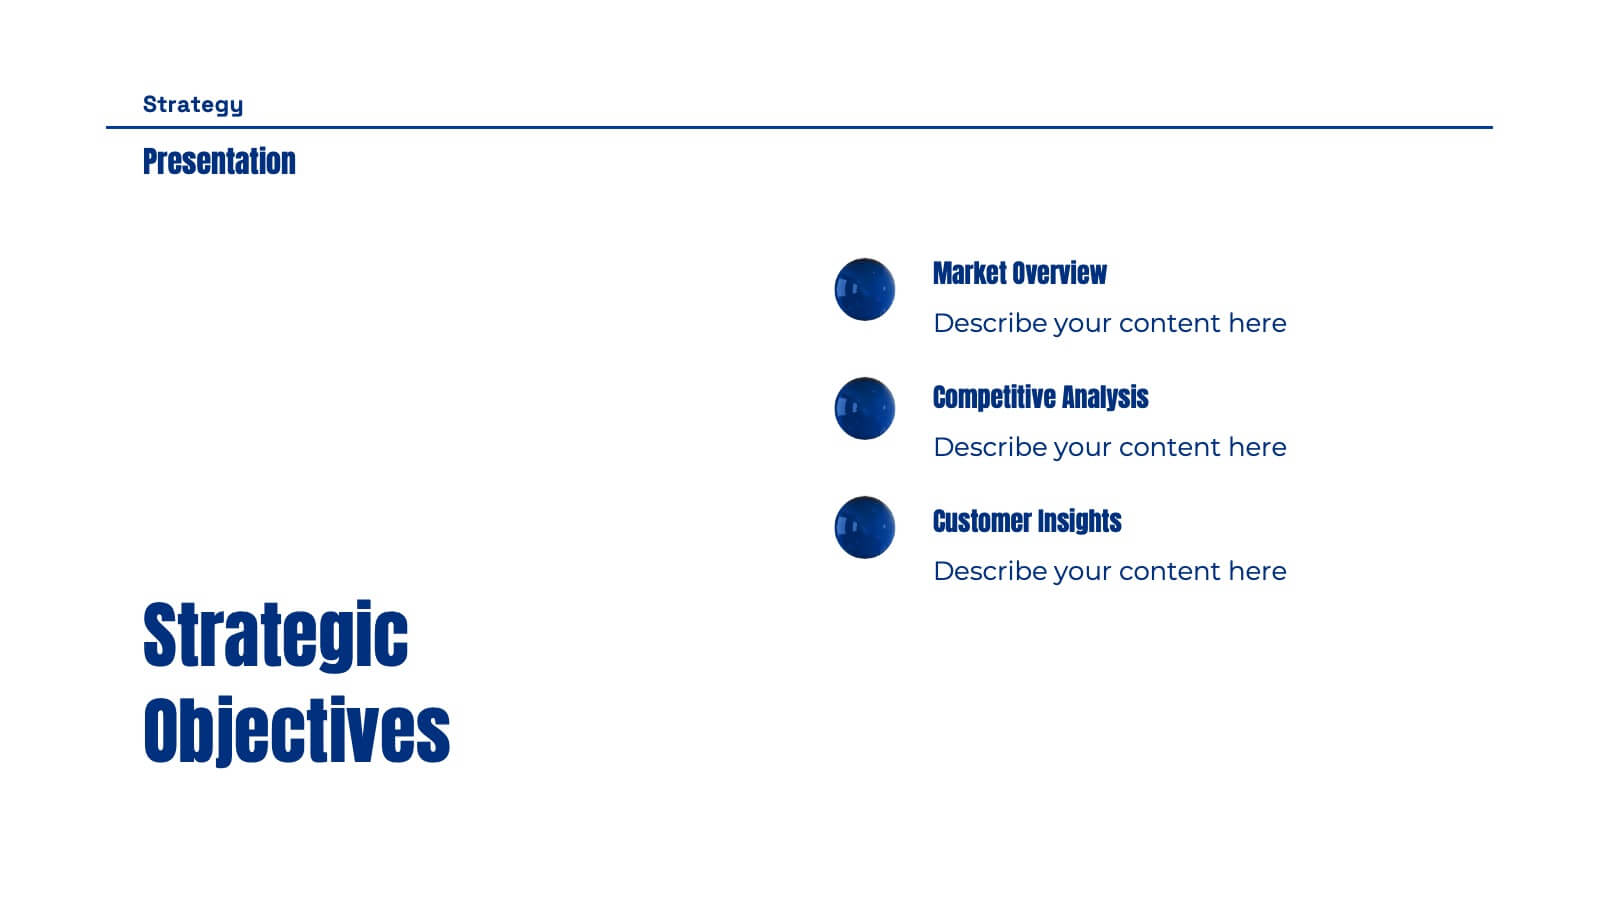
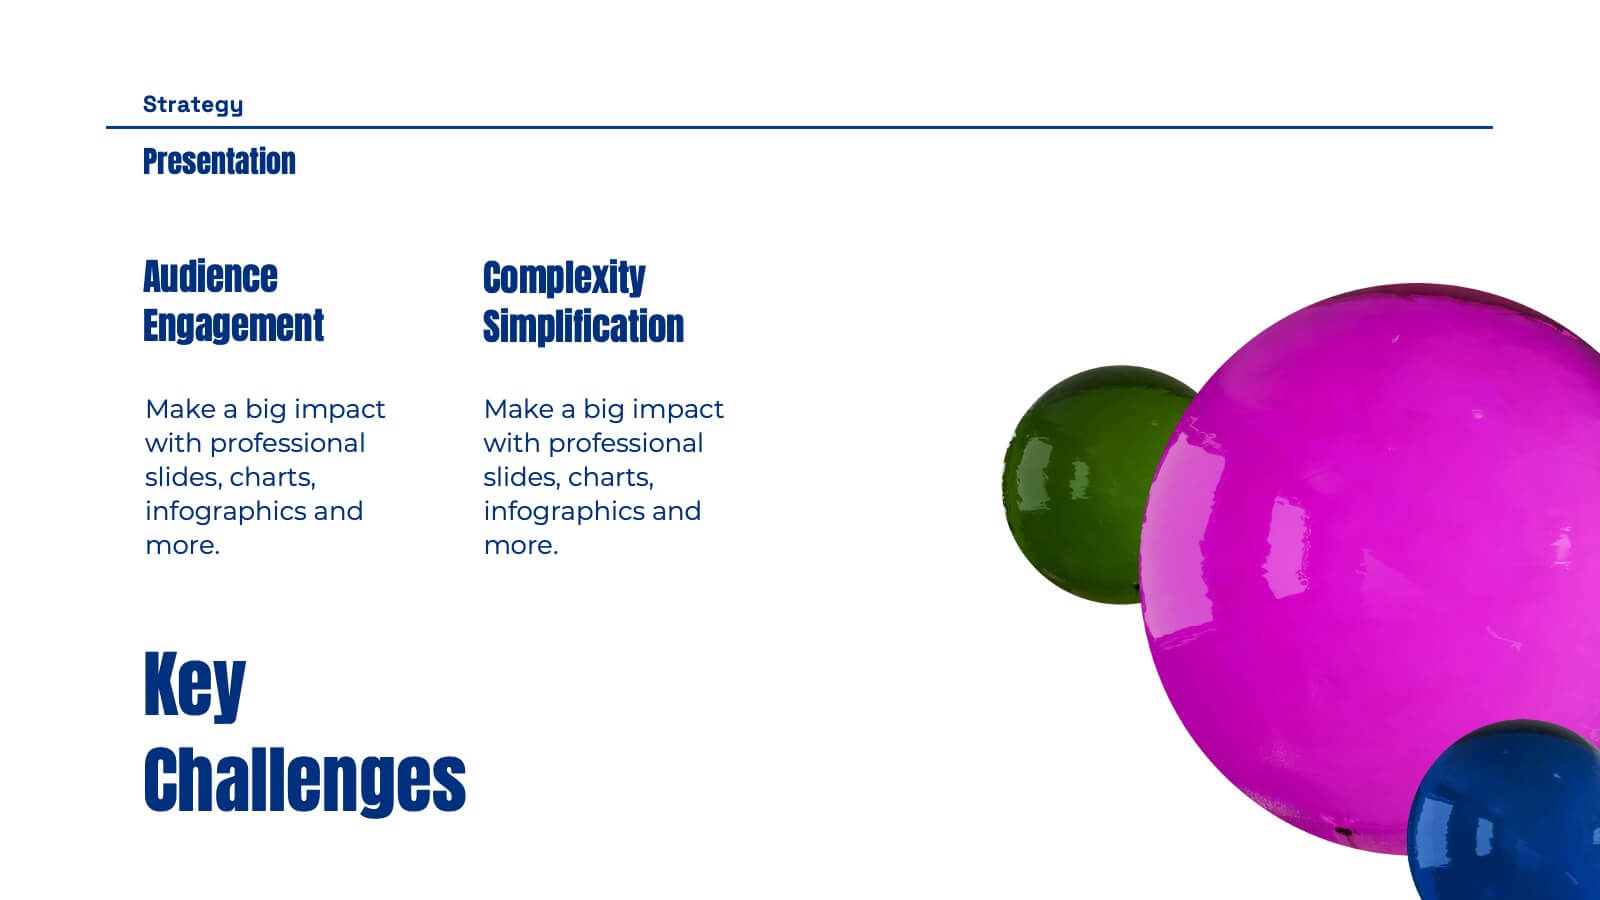
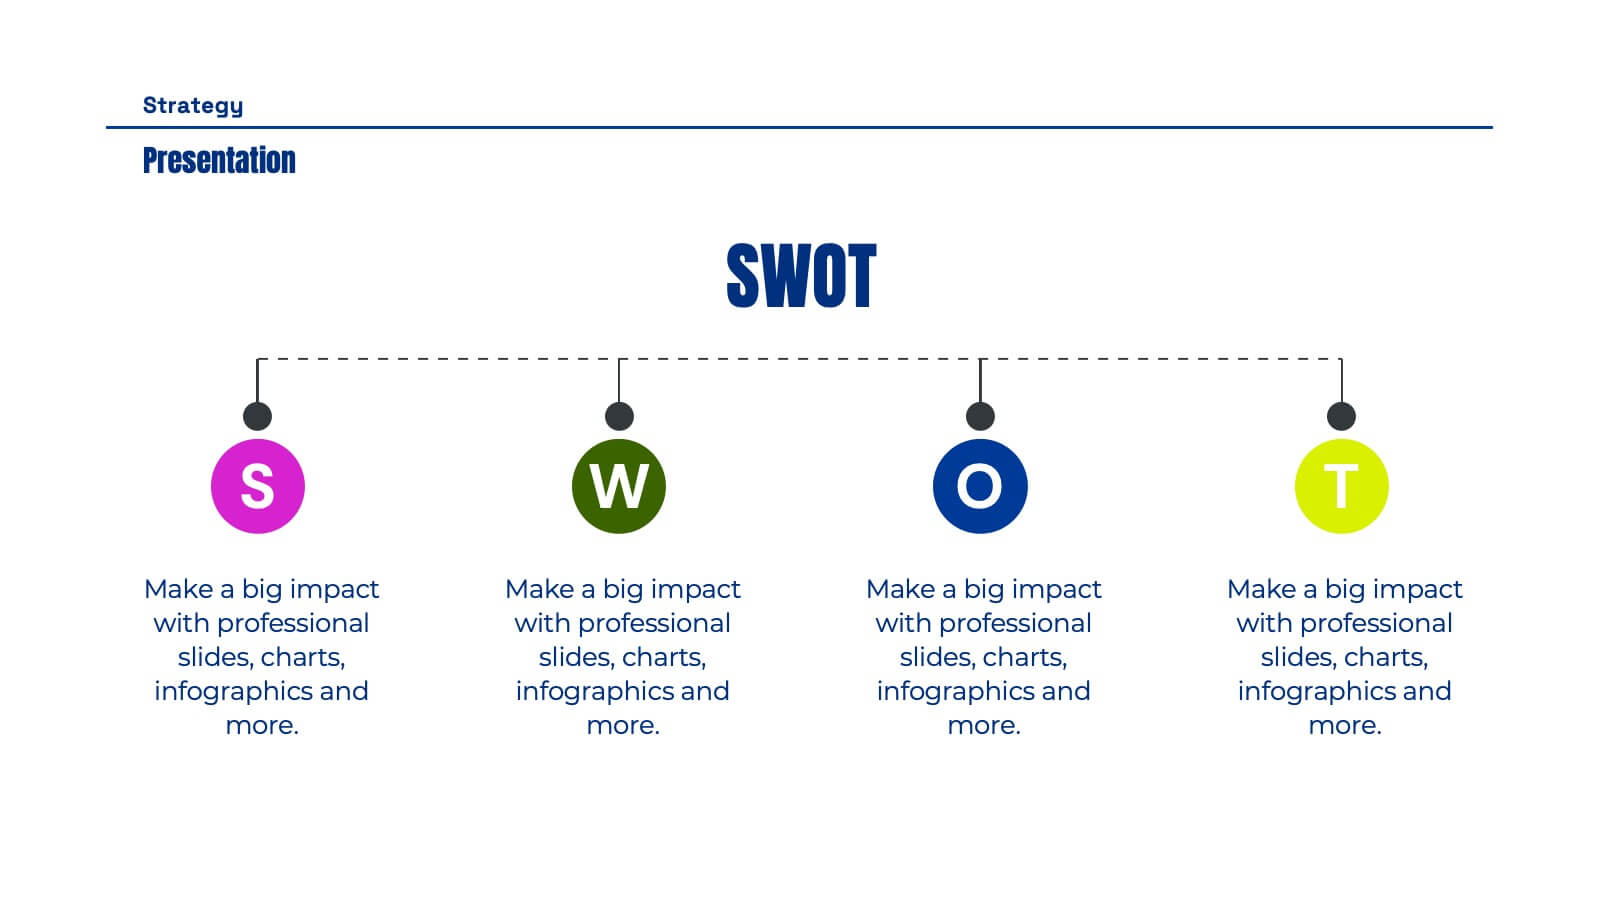
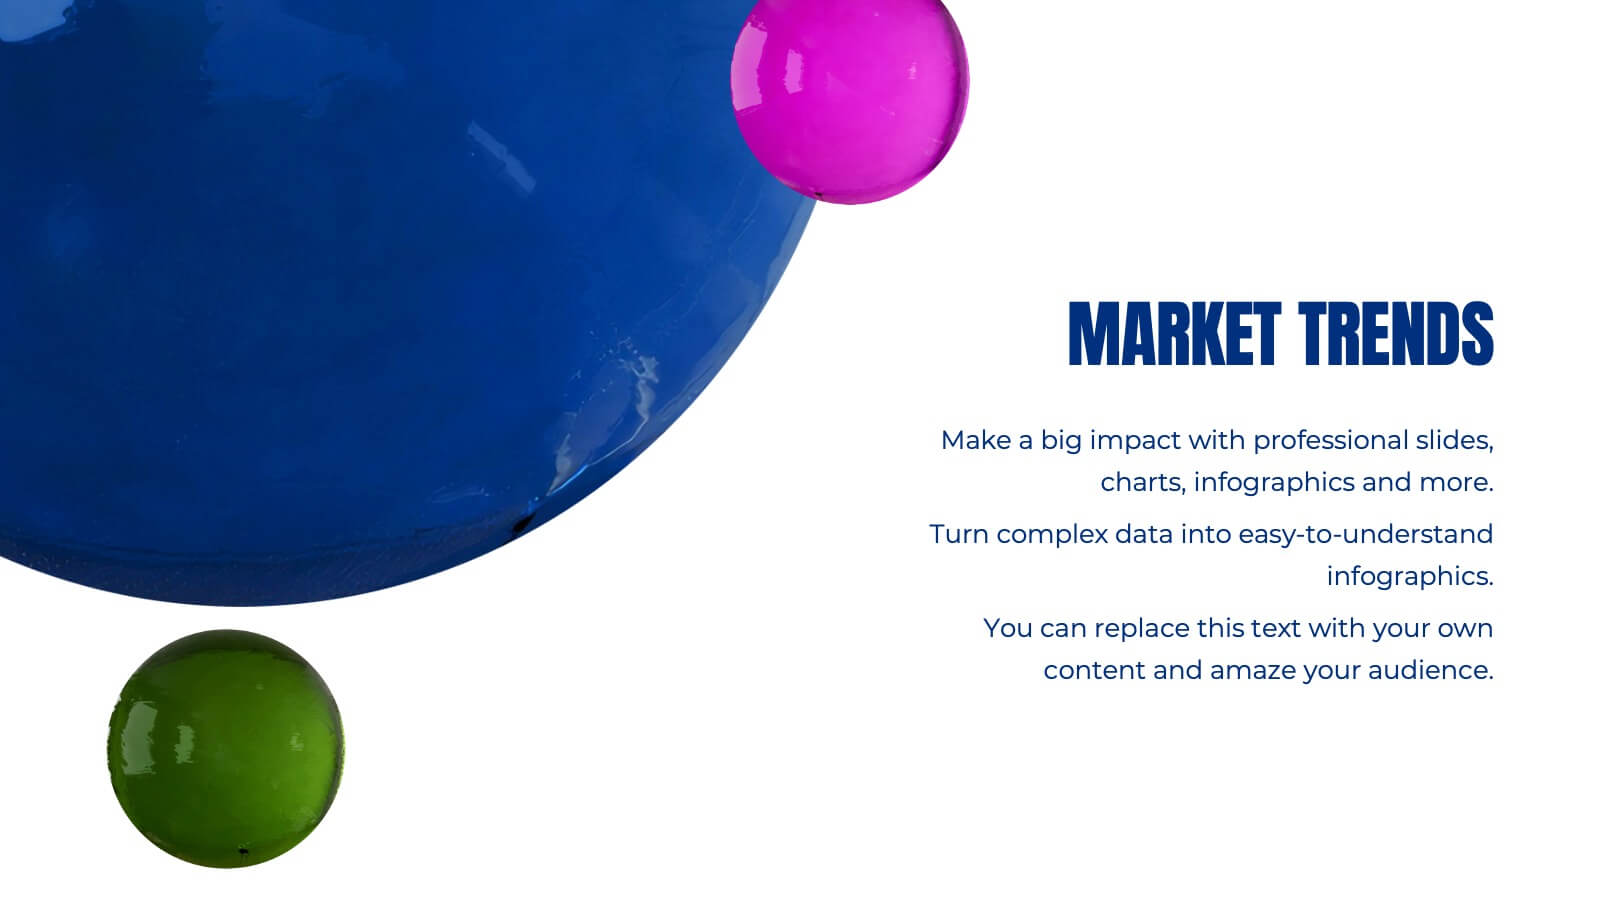
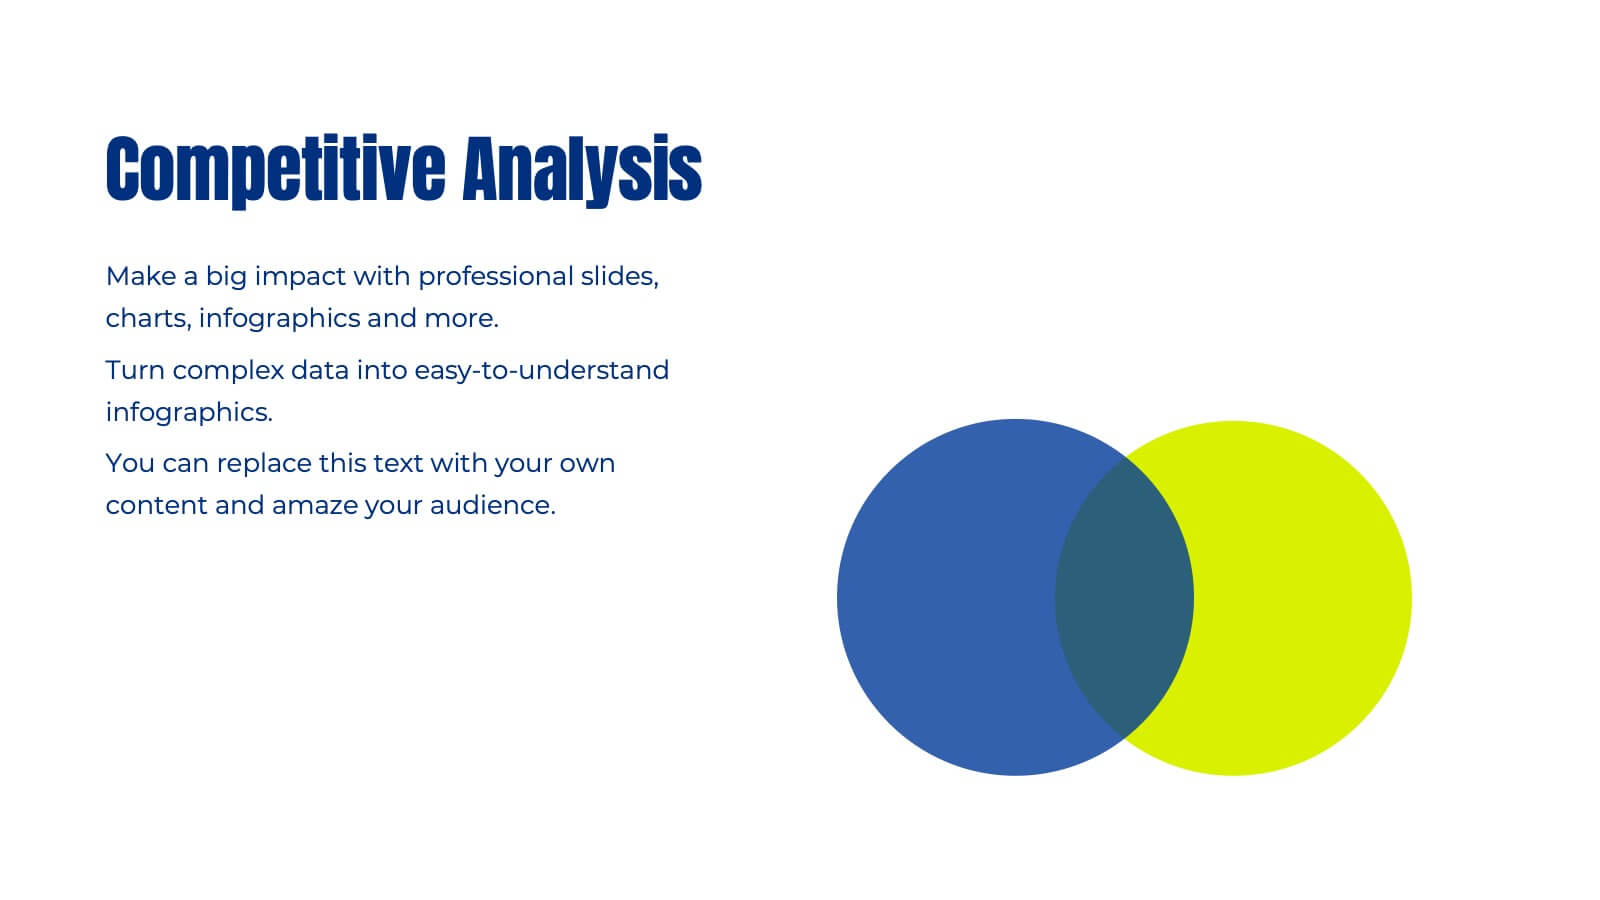
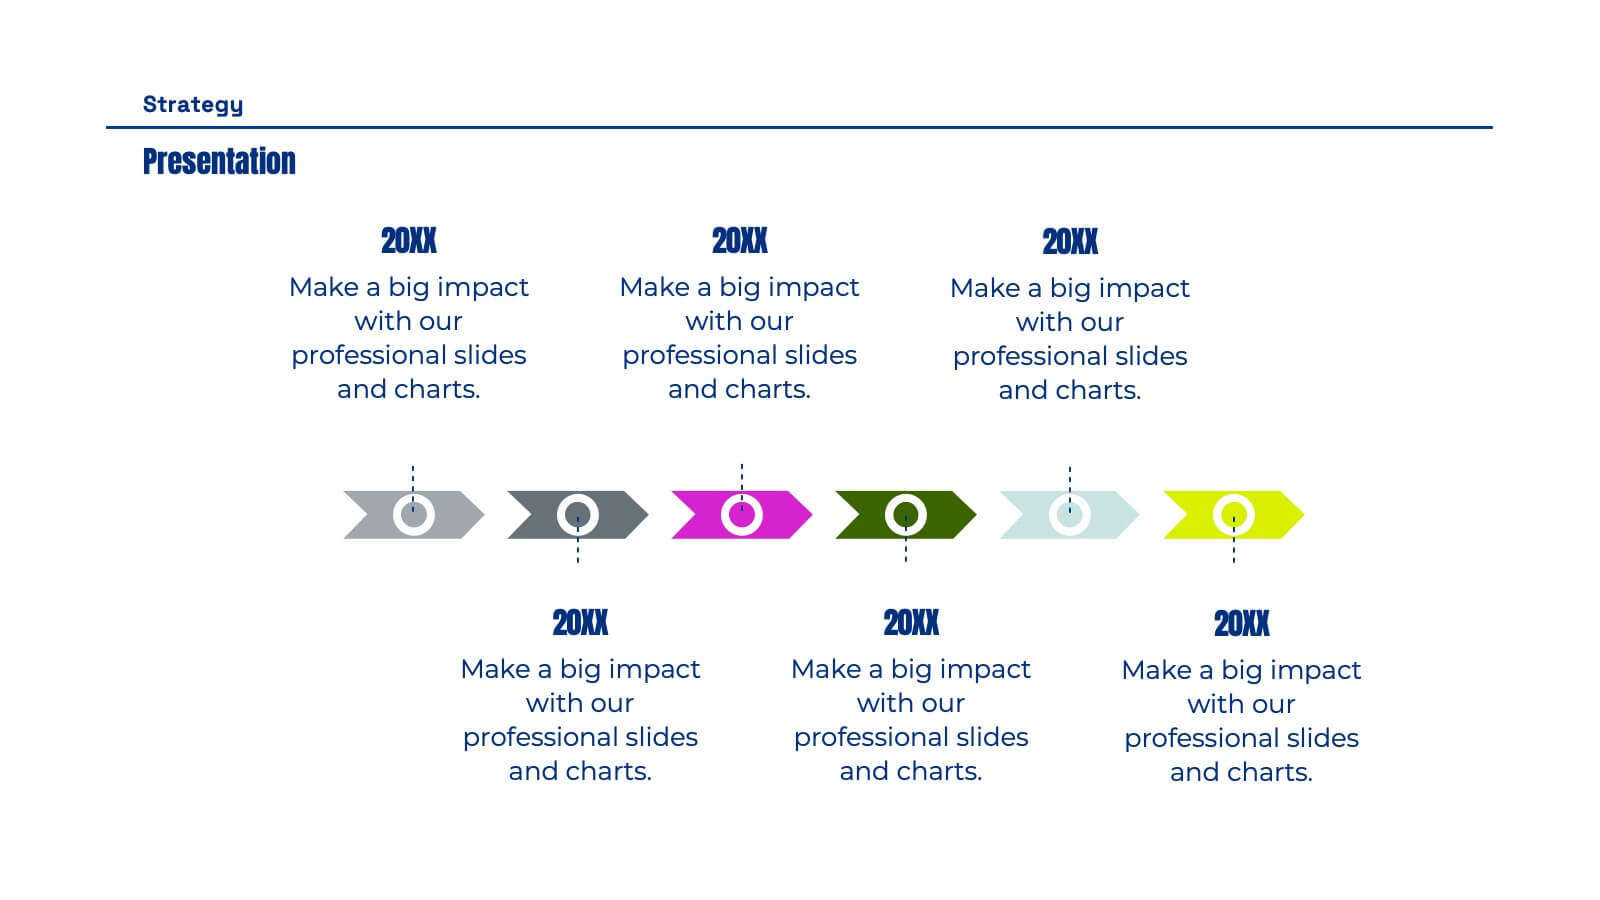
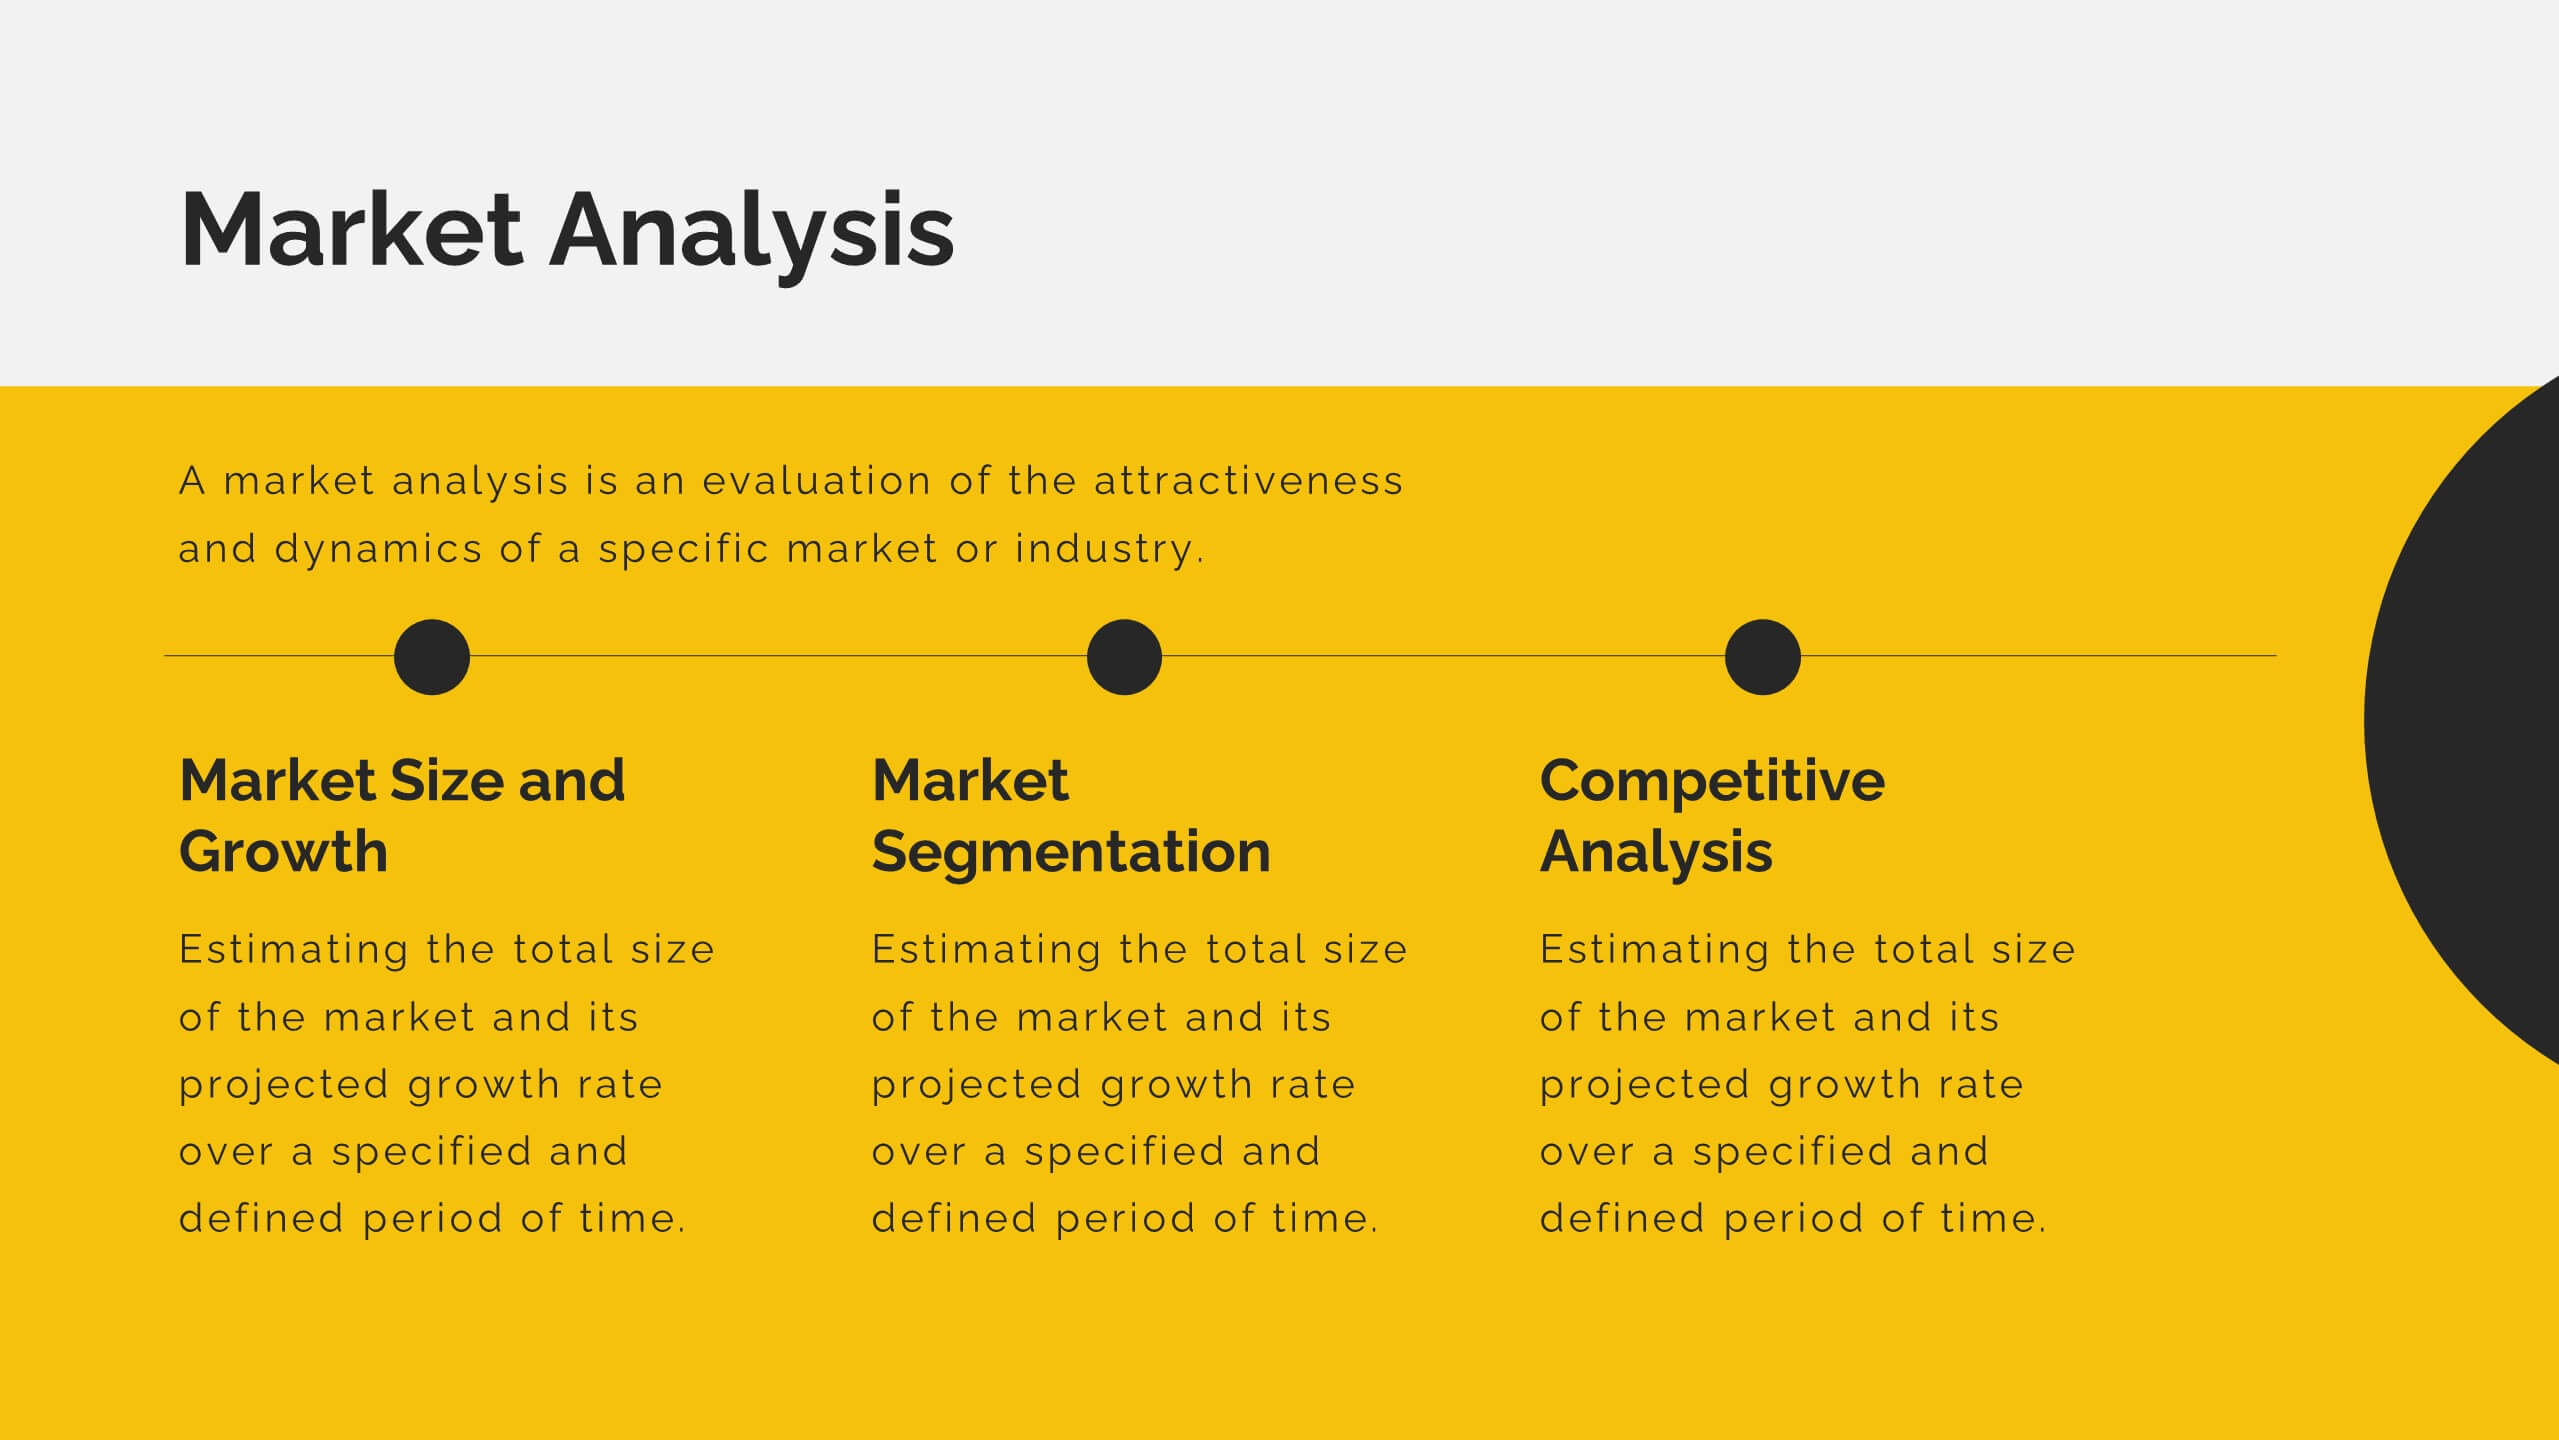
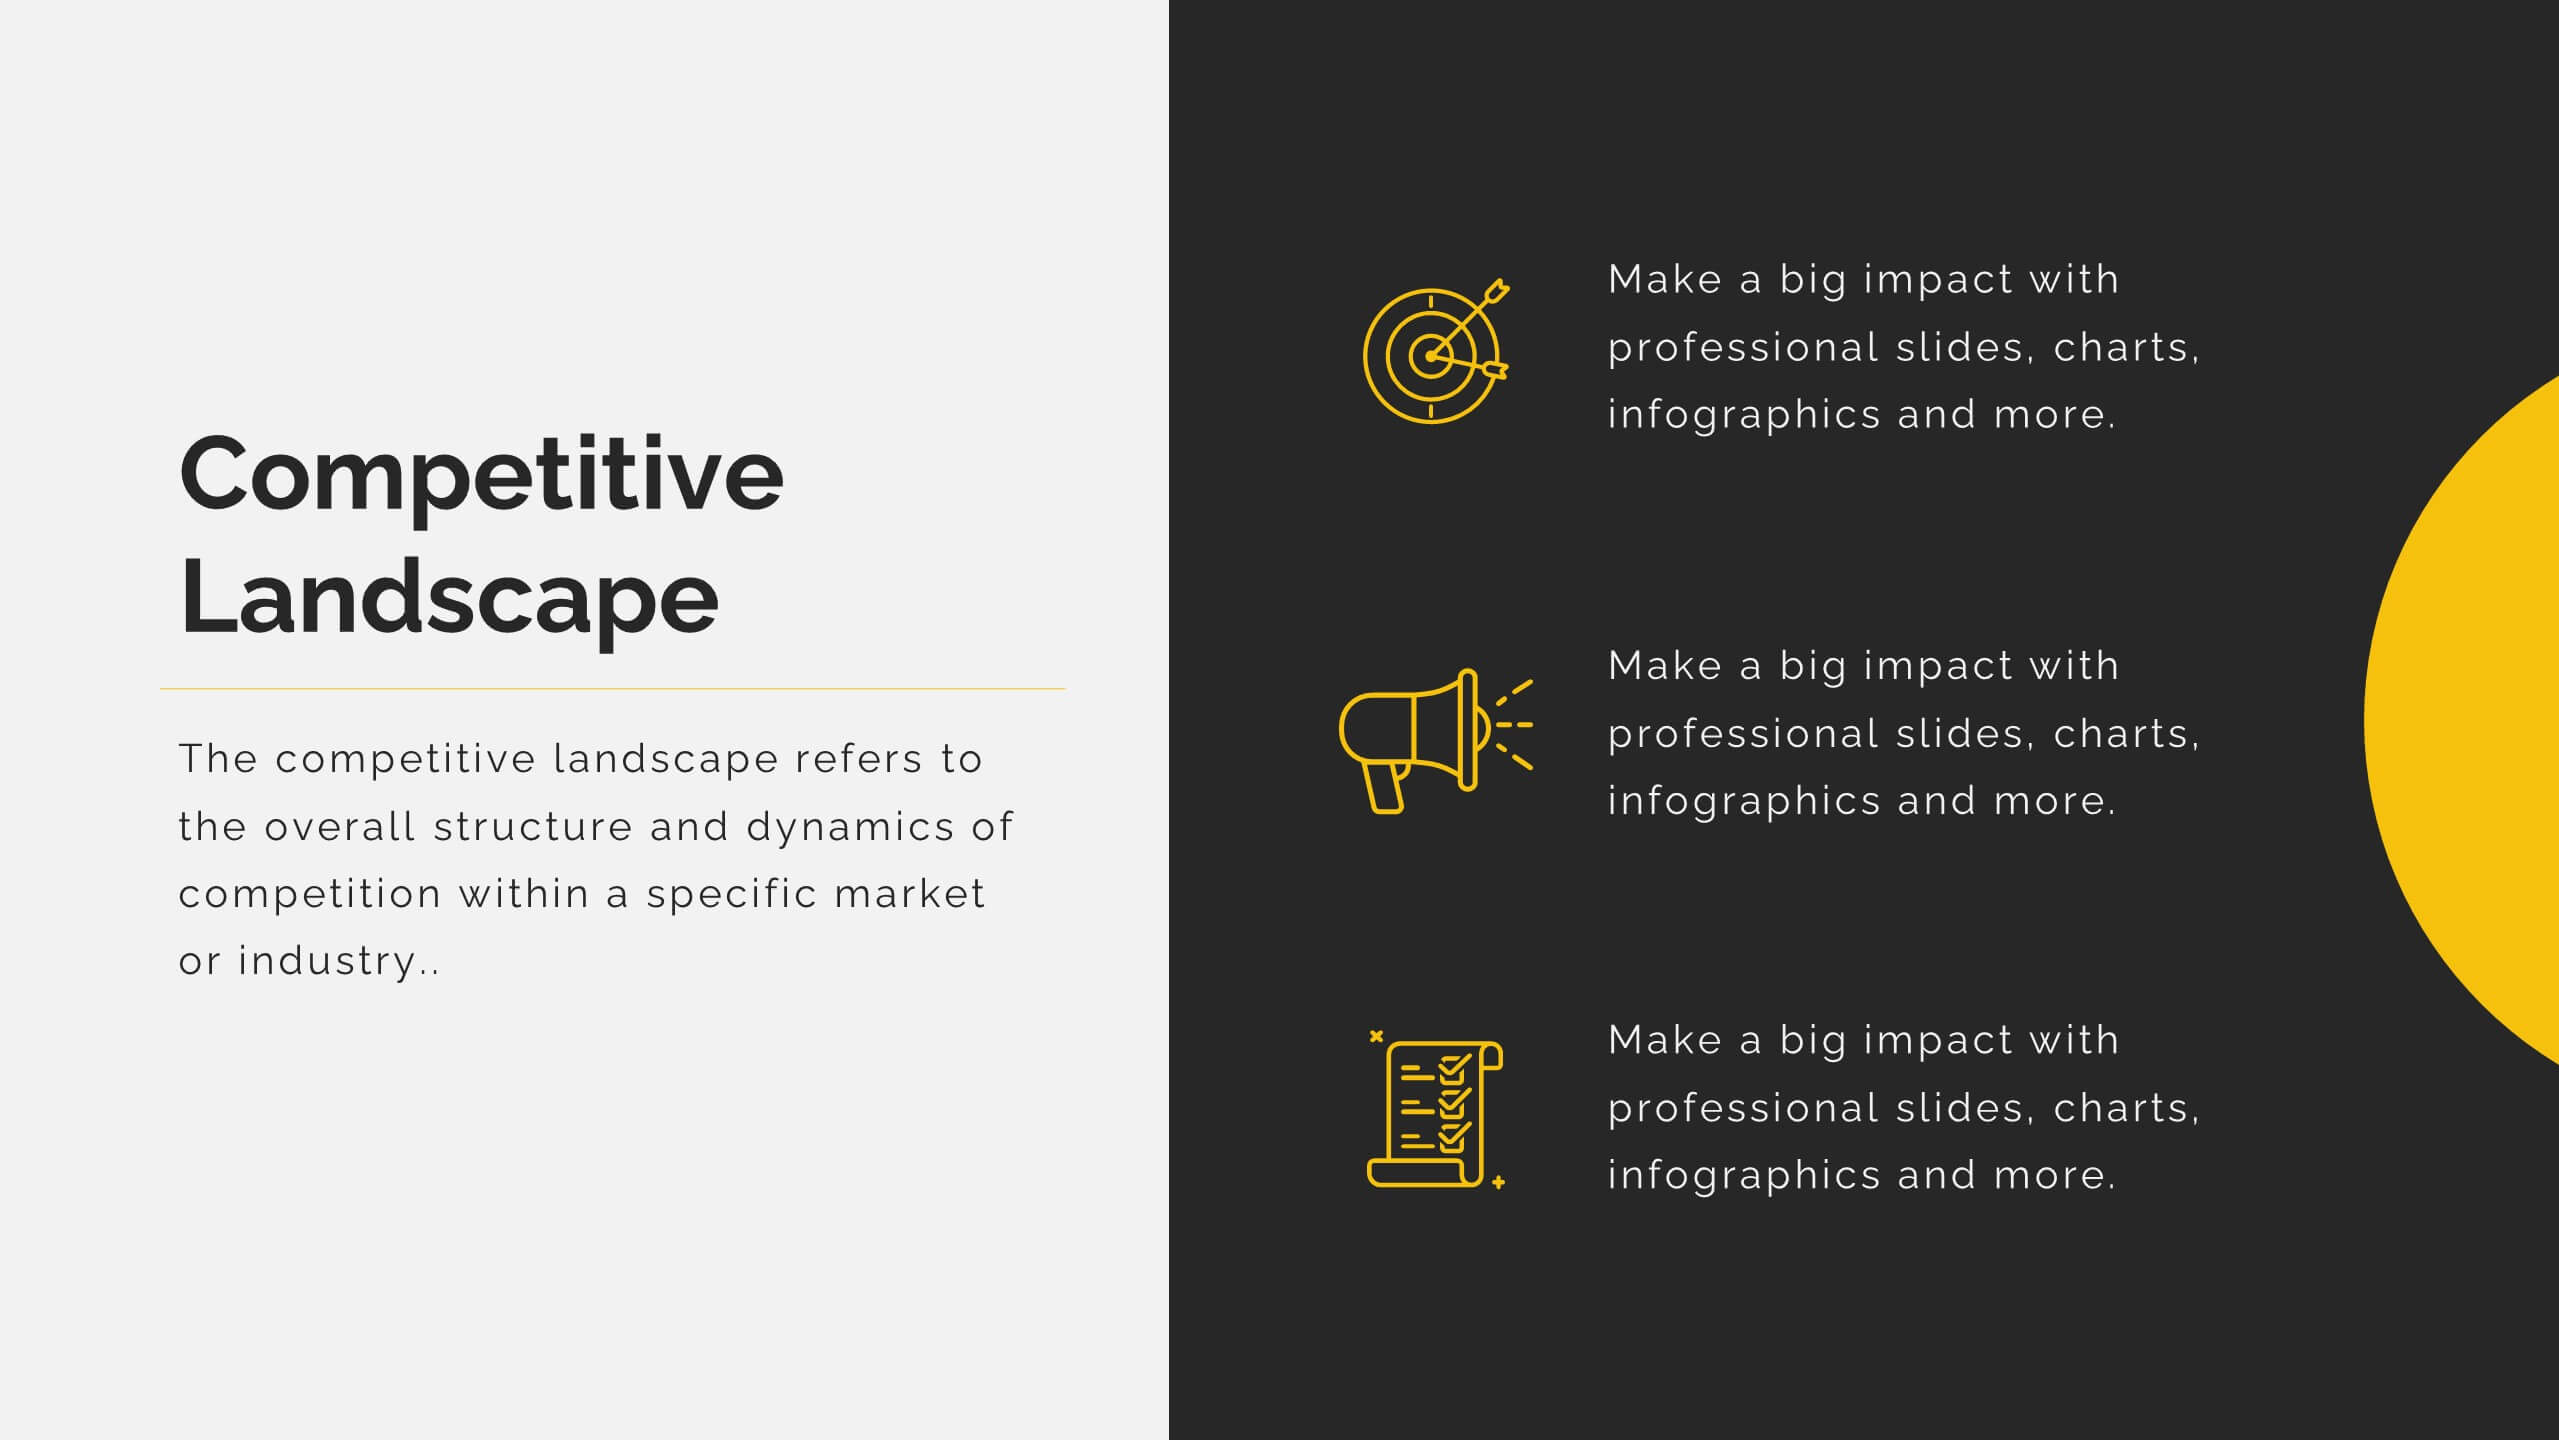
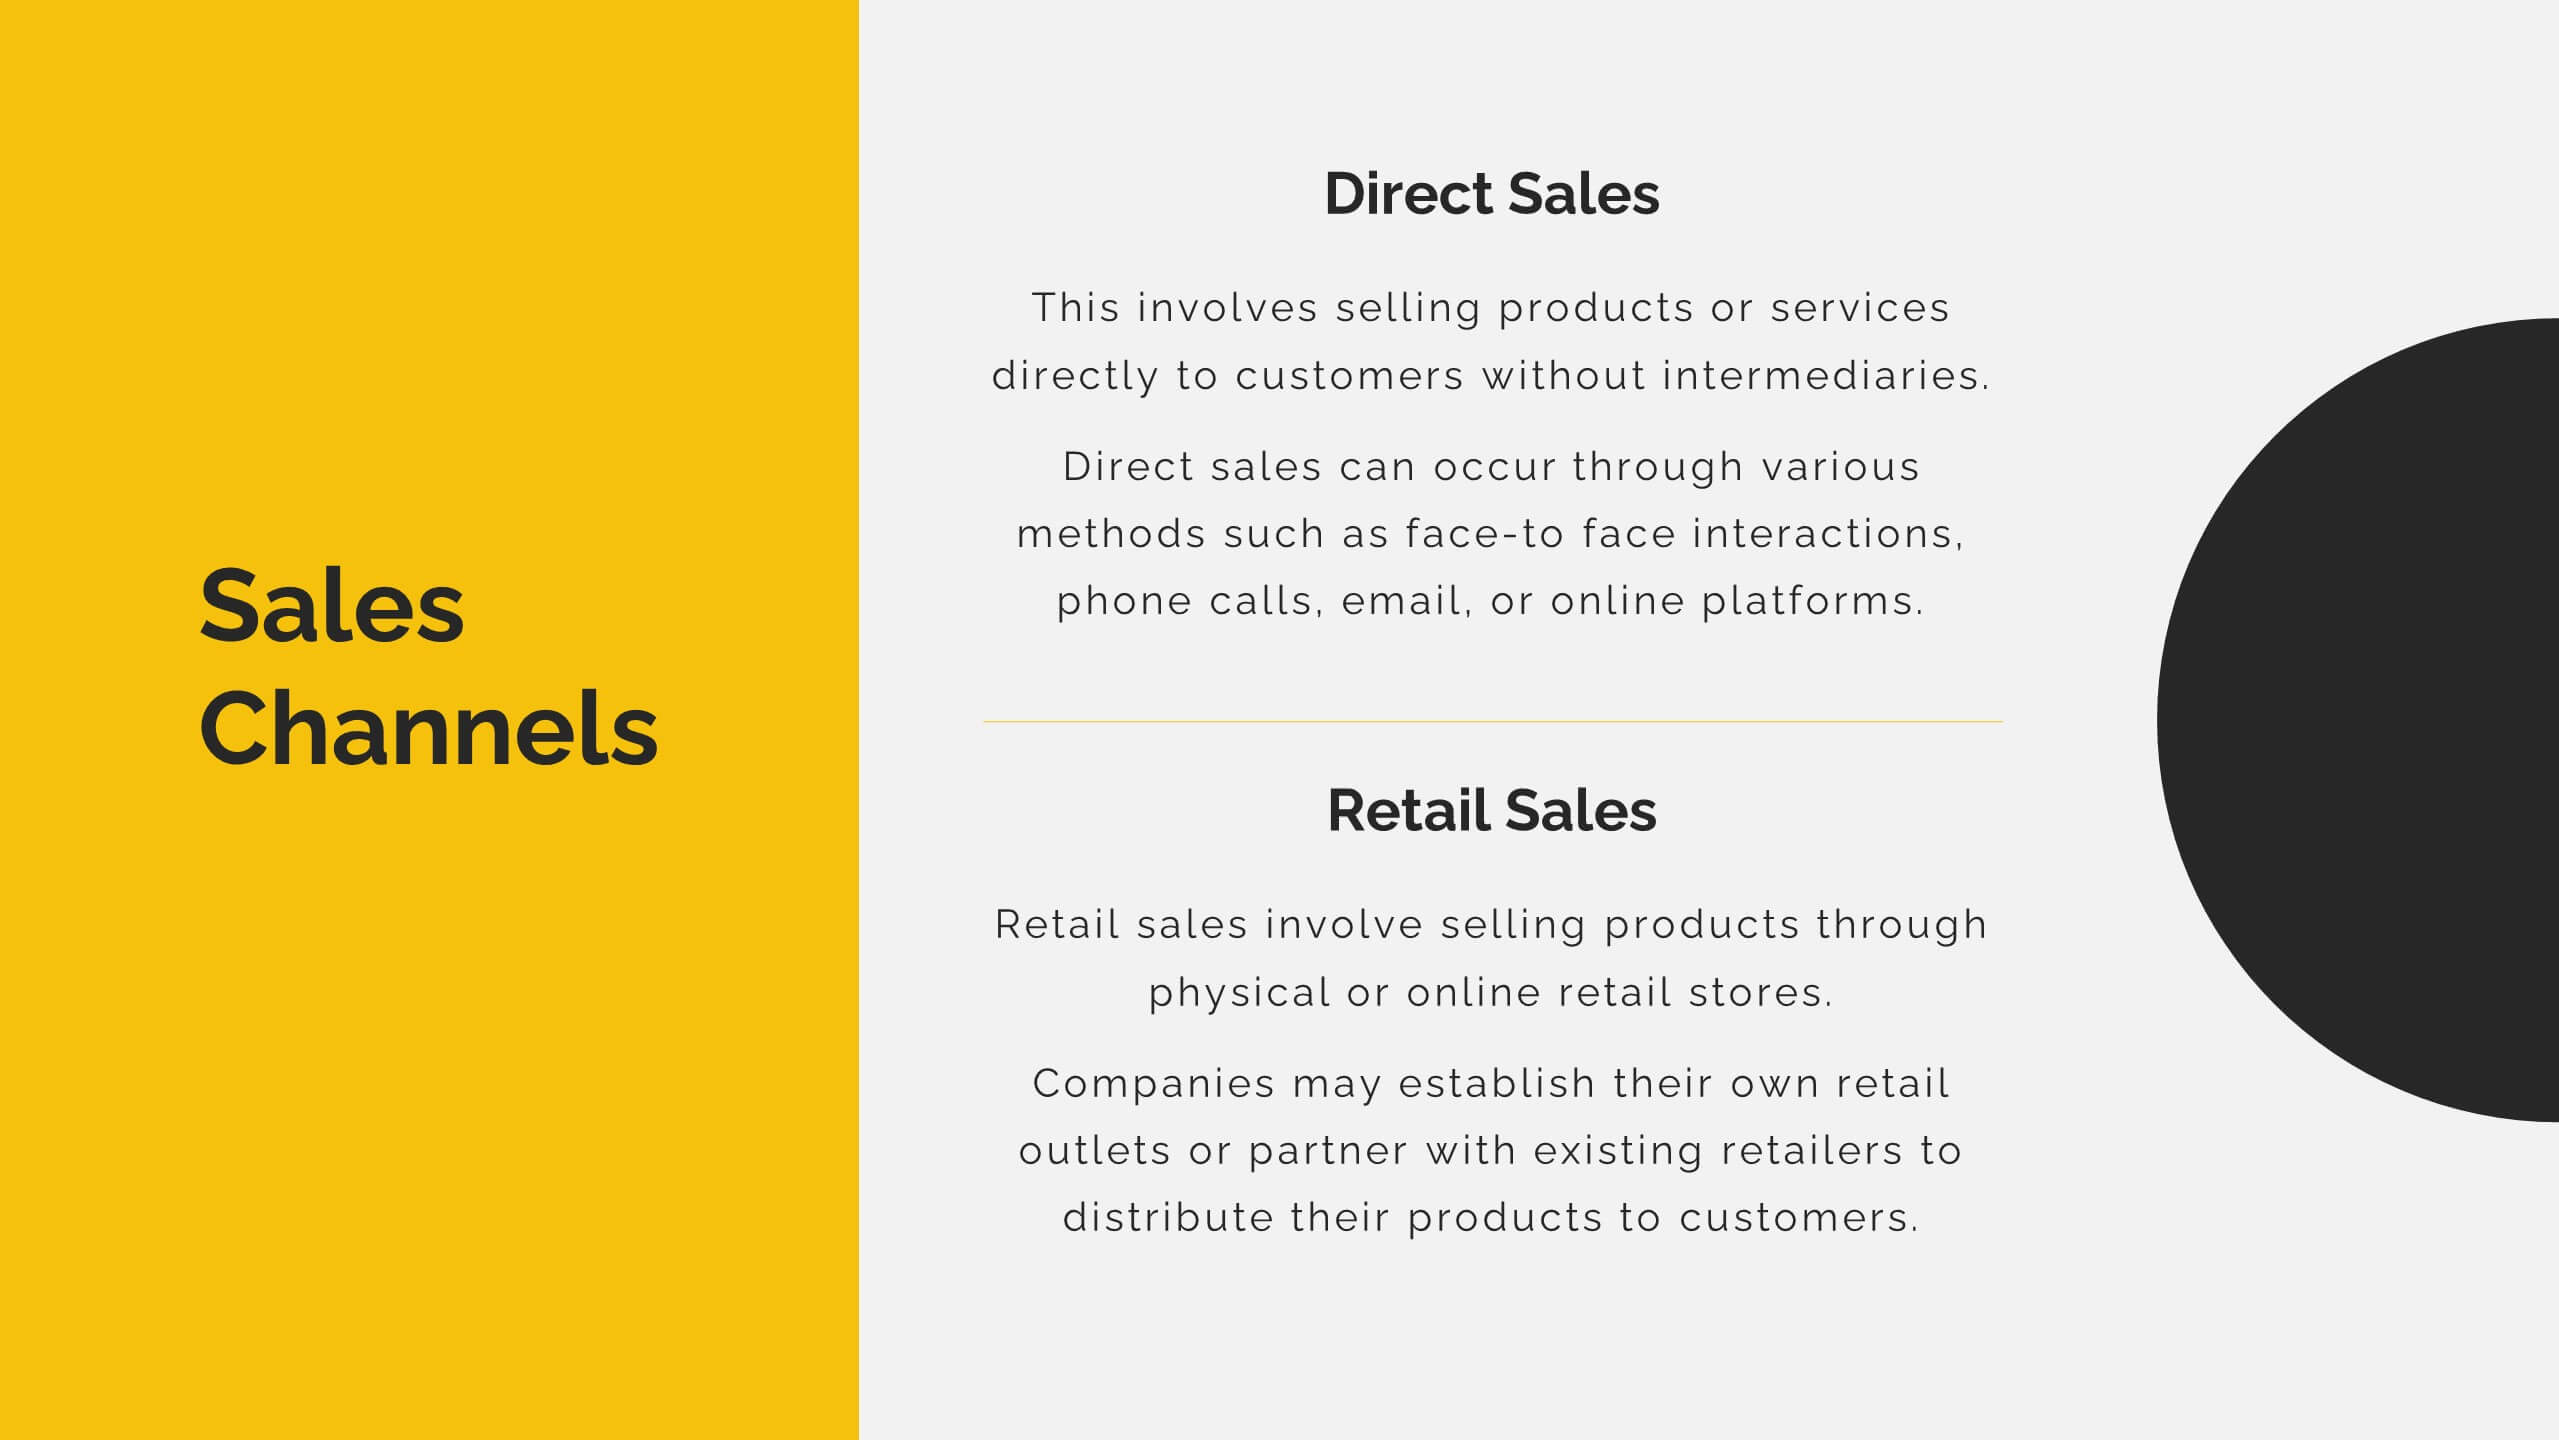
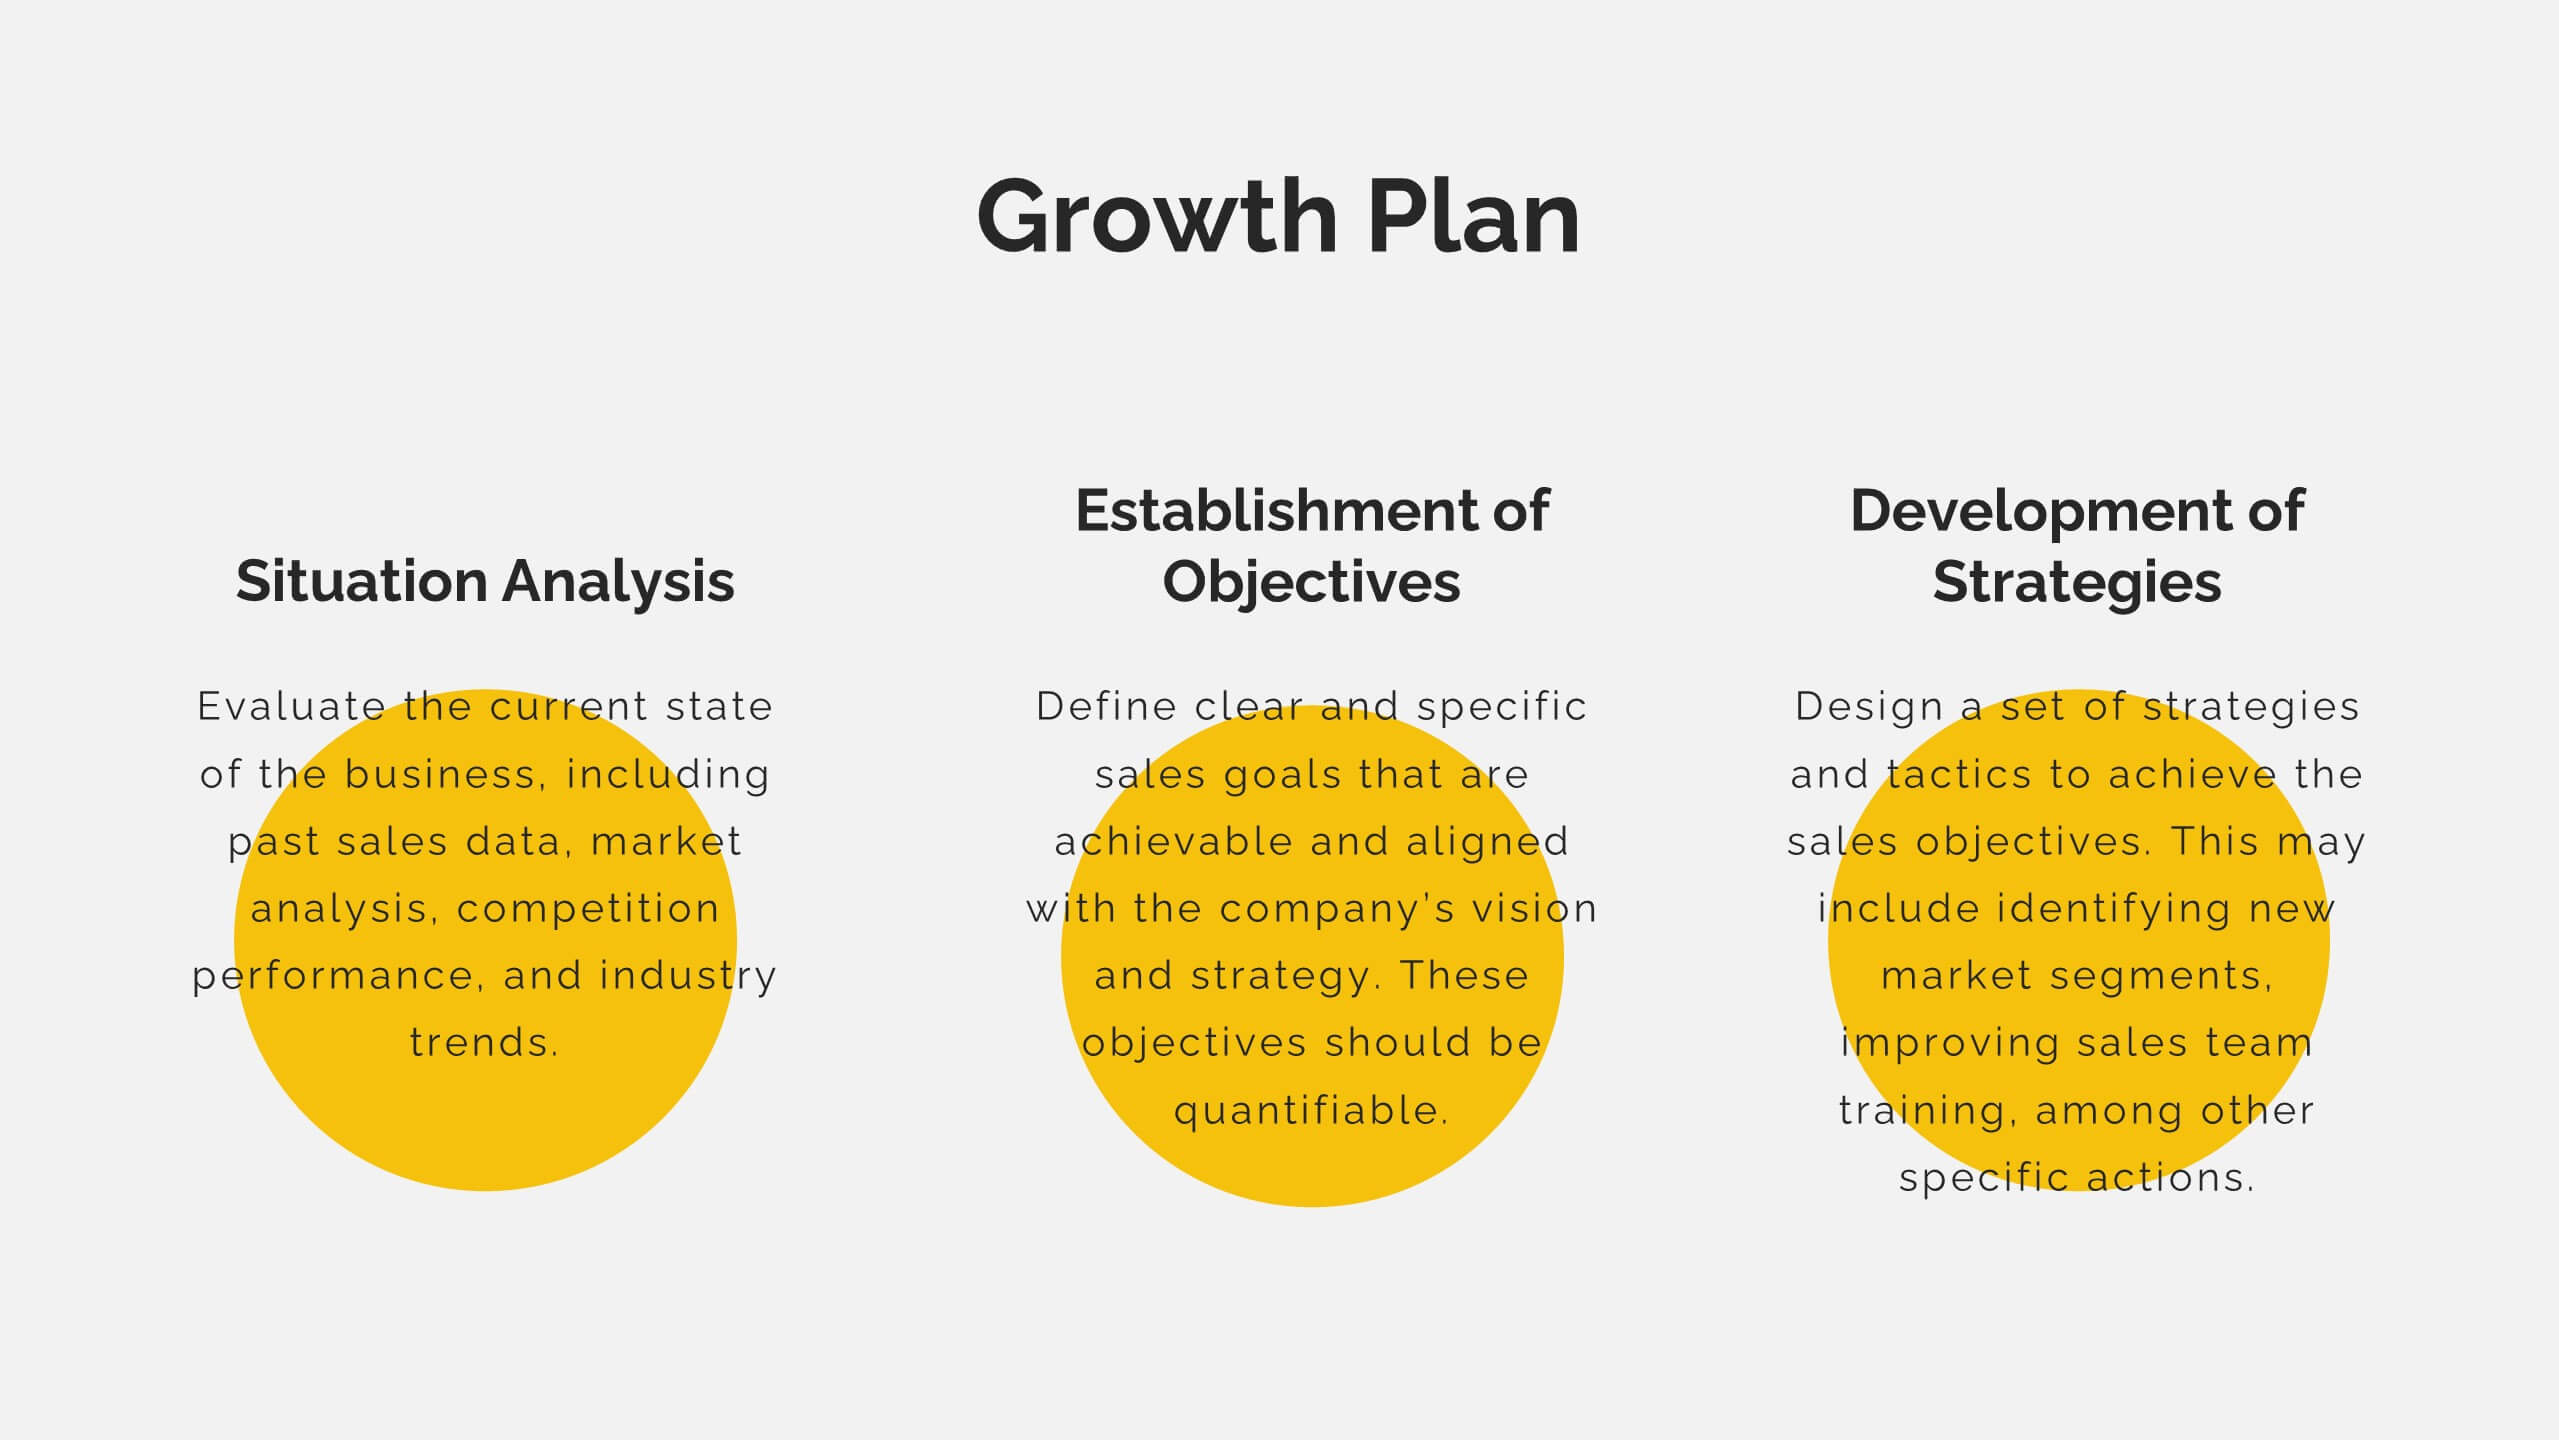
Ops Business Strategy Presentation
Set your strategy in motion with this dynamic, visually striking presentation template! Perfect for conveying key business insights like competitive analysis, market trends, and strategic objectives, it helps organize your plan for success. Each slide focuses on clarity and effectiveness, making it ideal for impactful presentations. Compatible with PowerPoint, Keynote, and Google Slides for effortless use across platforms.


7 diapositivas
Skills Gap Analysis Infographic Presentation Template
A skills gap analysis is a process that identifies organizational skill gaps and develops a plan to fill them. Employers use this process when they are trying to gauge their current skill sets, identify future needs and understand the best ways to meet those needs. This is an important part of your organization's recruiting strategy. Use this customizable template to gather your own insights into the skills gap in your organization. With this template you can analyze the current state of your company and team, identify areas for improvement, and create a roadmap for growing your team.


5 diapositivas
Pandemic Preventive Measures Infographics
Pandemic Preventive Measures refer to a set of actions taken to prevent the spread of infectious diseases. These vertical infographics are focused on informing the audience about the preventive measures that can be taken during a pandemic. They contains various customizable elements such as icons, charts, and diagrams that can be easily edited to suit your needs. The design is clean and easy to follow, making it an effective tool for communicating important information. Educate your audience on the essential pandemic preventive measures, and provide them with the necessary information to stay safe and healthy!


7 diapositivas
Mind Map Infographic Presentation Template
A mind map is a diagram that allows you to visualize how related ideas and concepts are connected to one another. It is especially good for brainstorming, planning and organizing. A mind map allows you to organize information in a way that shows your thinking process and gives you the opportunity for deeper understanding. This template will help others understand how you think about a particular subject or topic. Use this template to "brainstorm" a topic, and create an interesting mind map. You can also use it to share your ideas with others, or to visually organize your thoughts.


6 diapositivas
Global Transportation & Logistics Infographics
The "Global Transportation and Logistics" infographic template, suitable for PowerPoint, Keynote, and Google Slides, is an invaluable tool for professionals in the logistics, shipping, and supply chain industries. This comprehensive template is designed to effectively communicate the complexities and scope of global transportation and logistics. This template features key elements such as global shipping routes, logistics management, and supply chain operations. Its detailed and informative design is perfect for presentations that need to illustrate the intricacies of global logistics, from transportation networks to logistical challenges. This is especially useful for strategic planning, educational purposes, or corporate presentations in the logistics sector. The color scheme of the template reflects global connectivity and efficiency, incorporating shades of blue, green, and earth tones. This professional and visually appealing design not only enhances the clarity of the information but also adds a global perspective to your presentation. Whether used for training, client meetings, or industry conferences, this template ensures your insights into global transportation and logistics are presented with precision and professionalism.


2 diapositivas
Startup Company Illustrations
Ignite your startup spirit with our startup company illustrations pack! These are an exhilarating collection of visuals designed to infuse your presentations with the electrifying energy of new beginnings and innovation. Fully compatible with Powerpoint, Keynote, and Google Slides. Get ready to turbocharge your designs with the infectious excitement of startup culture. Infuse your designs with the boundless possibilities of the startup universe—download our startup company illustrations pack today!


5 diapositivas
Employee Training Needs Skills Gap Presentation
Optimize Workforce Training with a Skills Gap Analysis! The Employee Training Needs Skills Gap template helps HR teams, trainers, and managers visualize skill gaps, assess employee competencies, and align training programs with business goals. Featuring an interactive dot matrix layout, this template enables clear comparisons across skill areas, ensuring targeted and efficient upskilling strategies. Fully customizable in PowerPoint, Keynote, and Google Slides, it streamlines workforce development planning for maximum impact and growth.


6 diapositivas
Core Focus Areas in Strategic Wheel Model Presentation
Showcase your business's key focus areas using this five-part strategic wheel layout. Each segment is paired with corresponding labels and editable text fields for streamlined messaging. Ideal for strategy, operations, or team planning. Fully customizable and compatible with PowerPoint, Keynote, and Google Slides to suit any brand style.


22 diapositivas
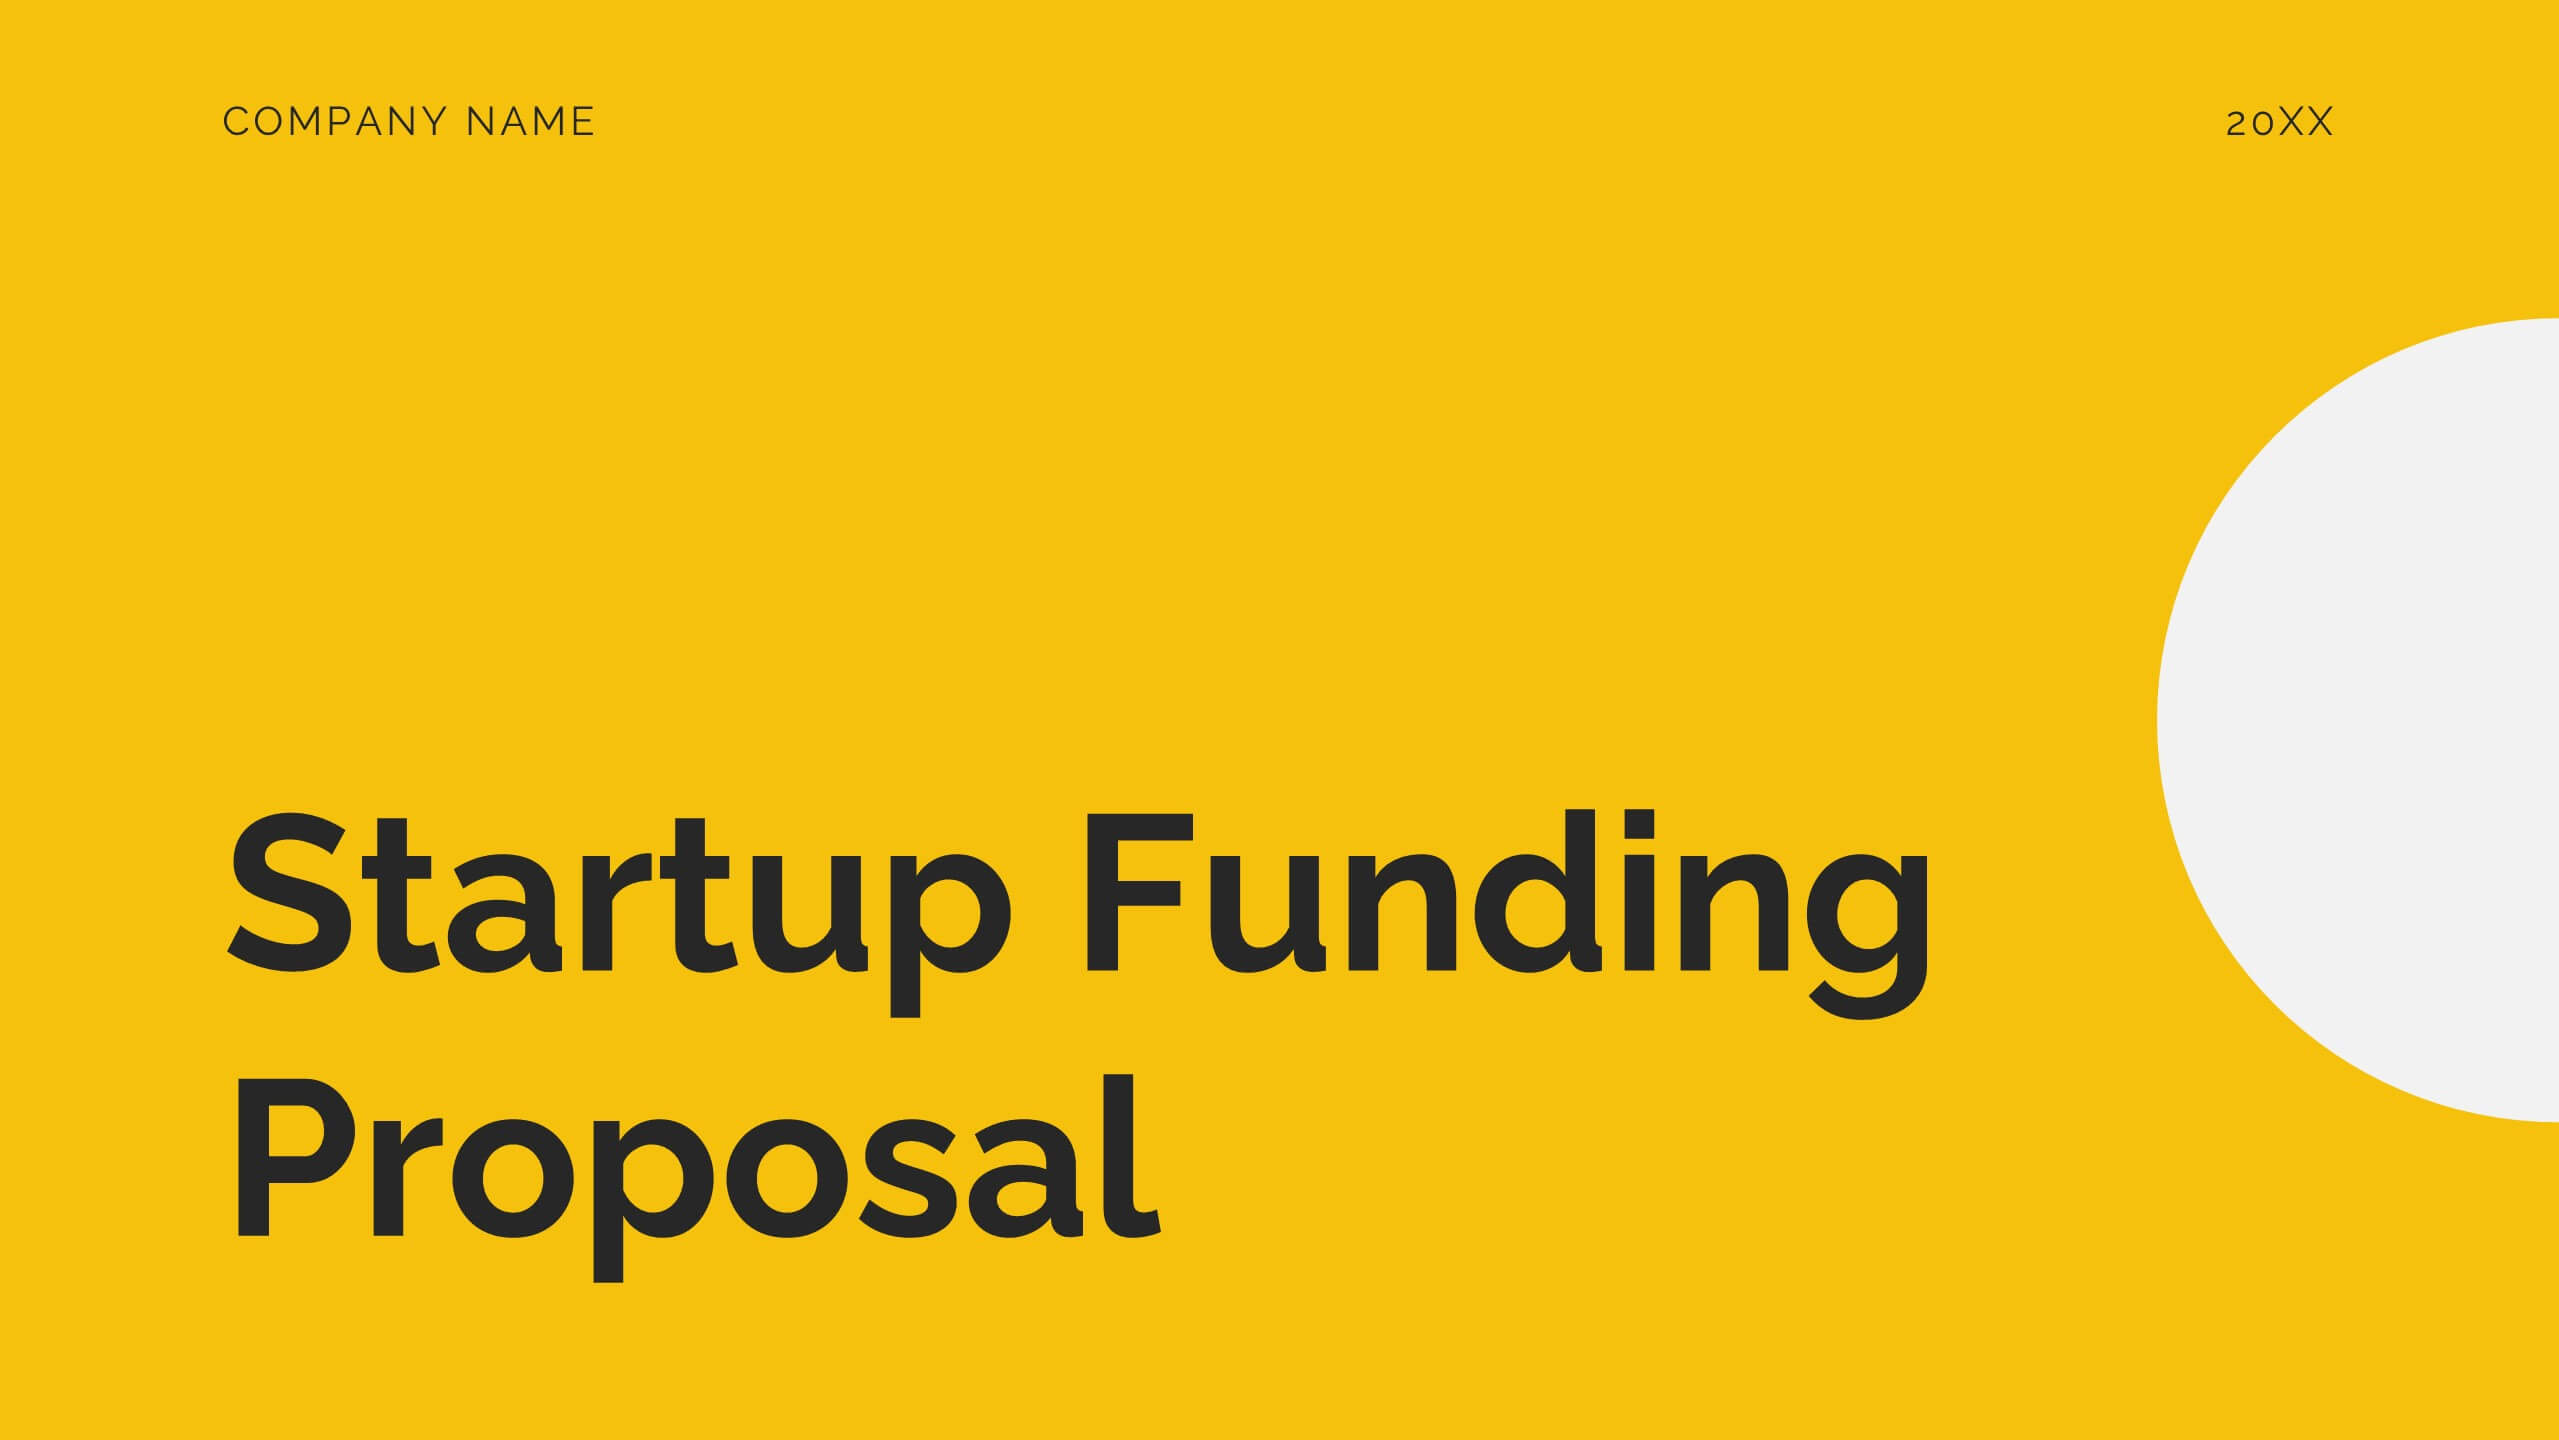
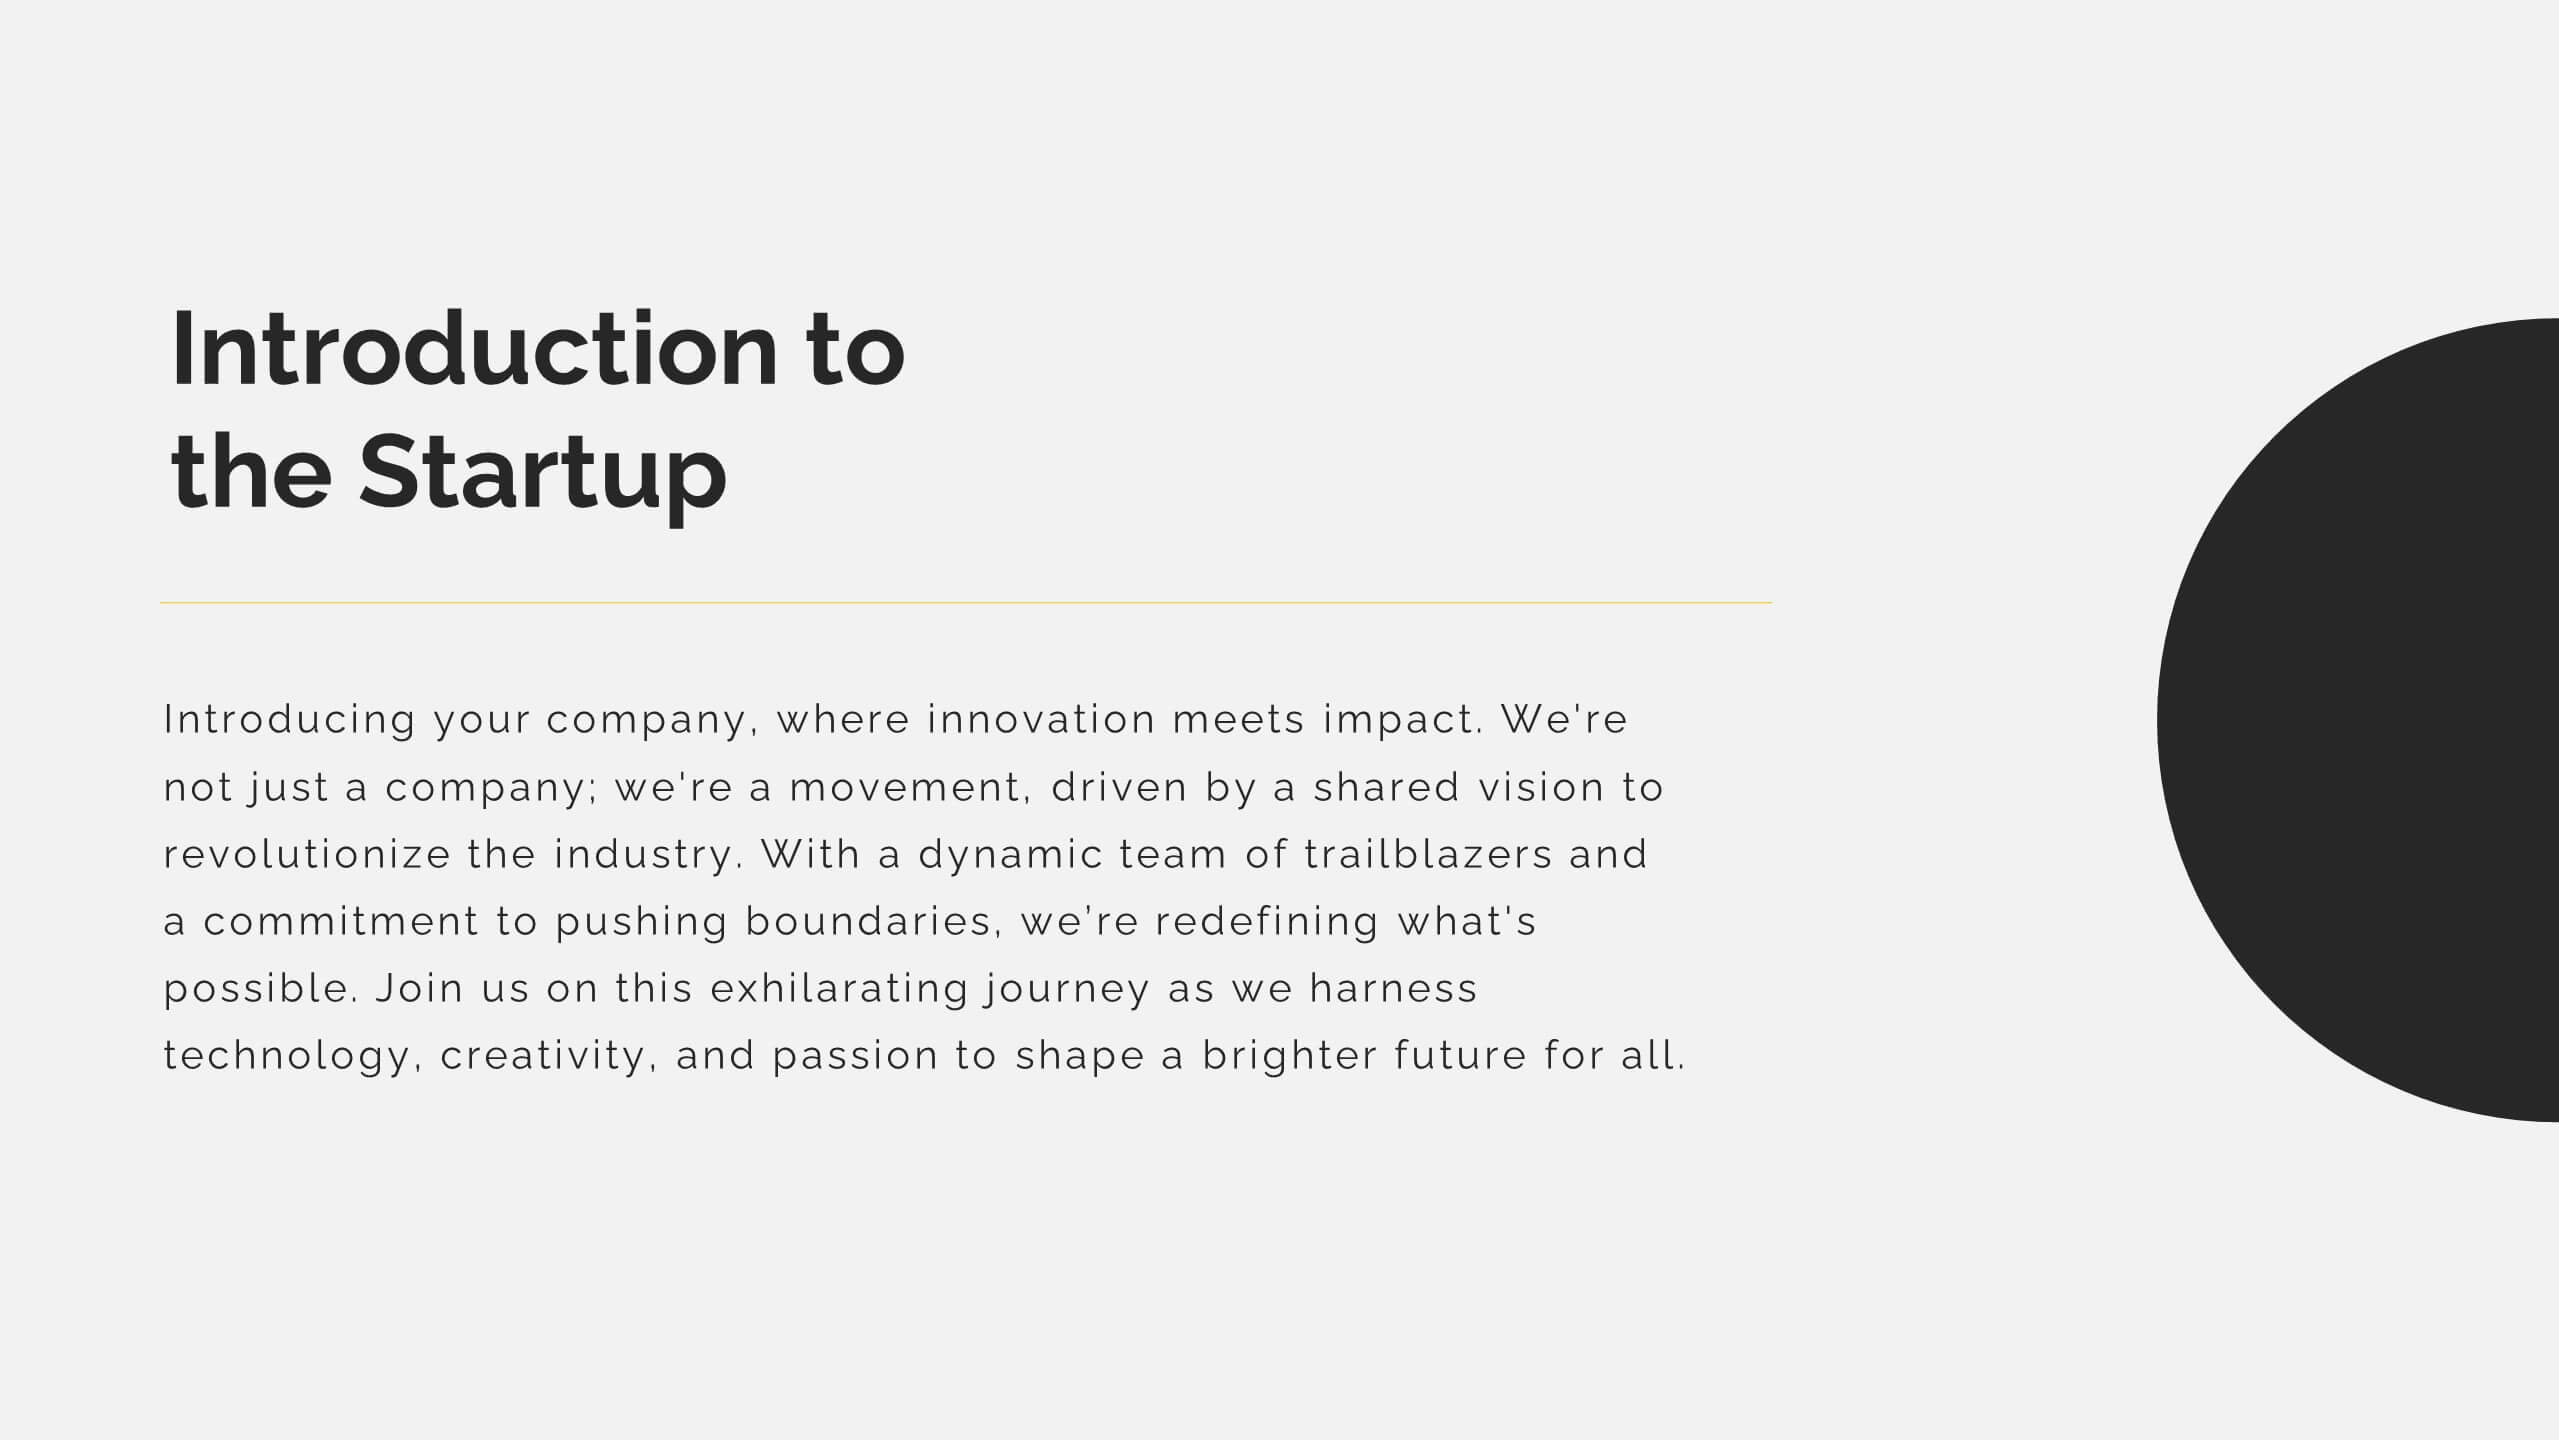
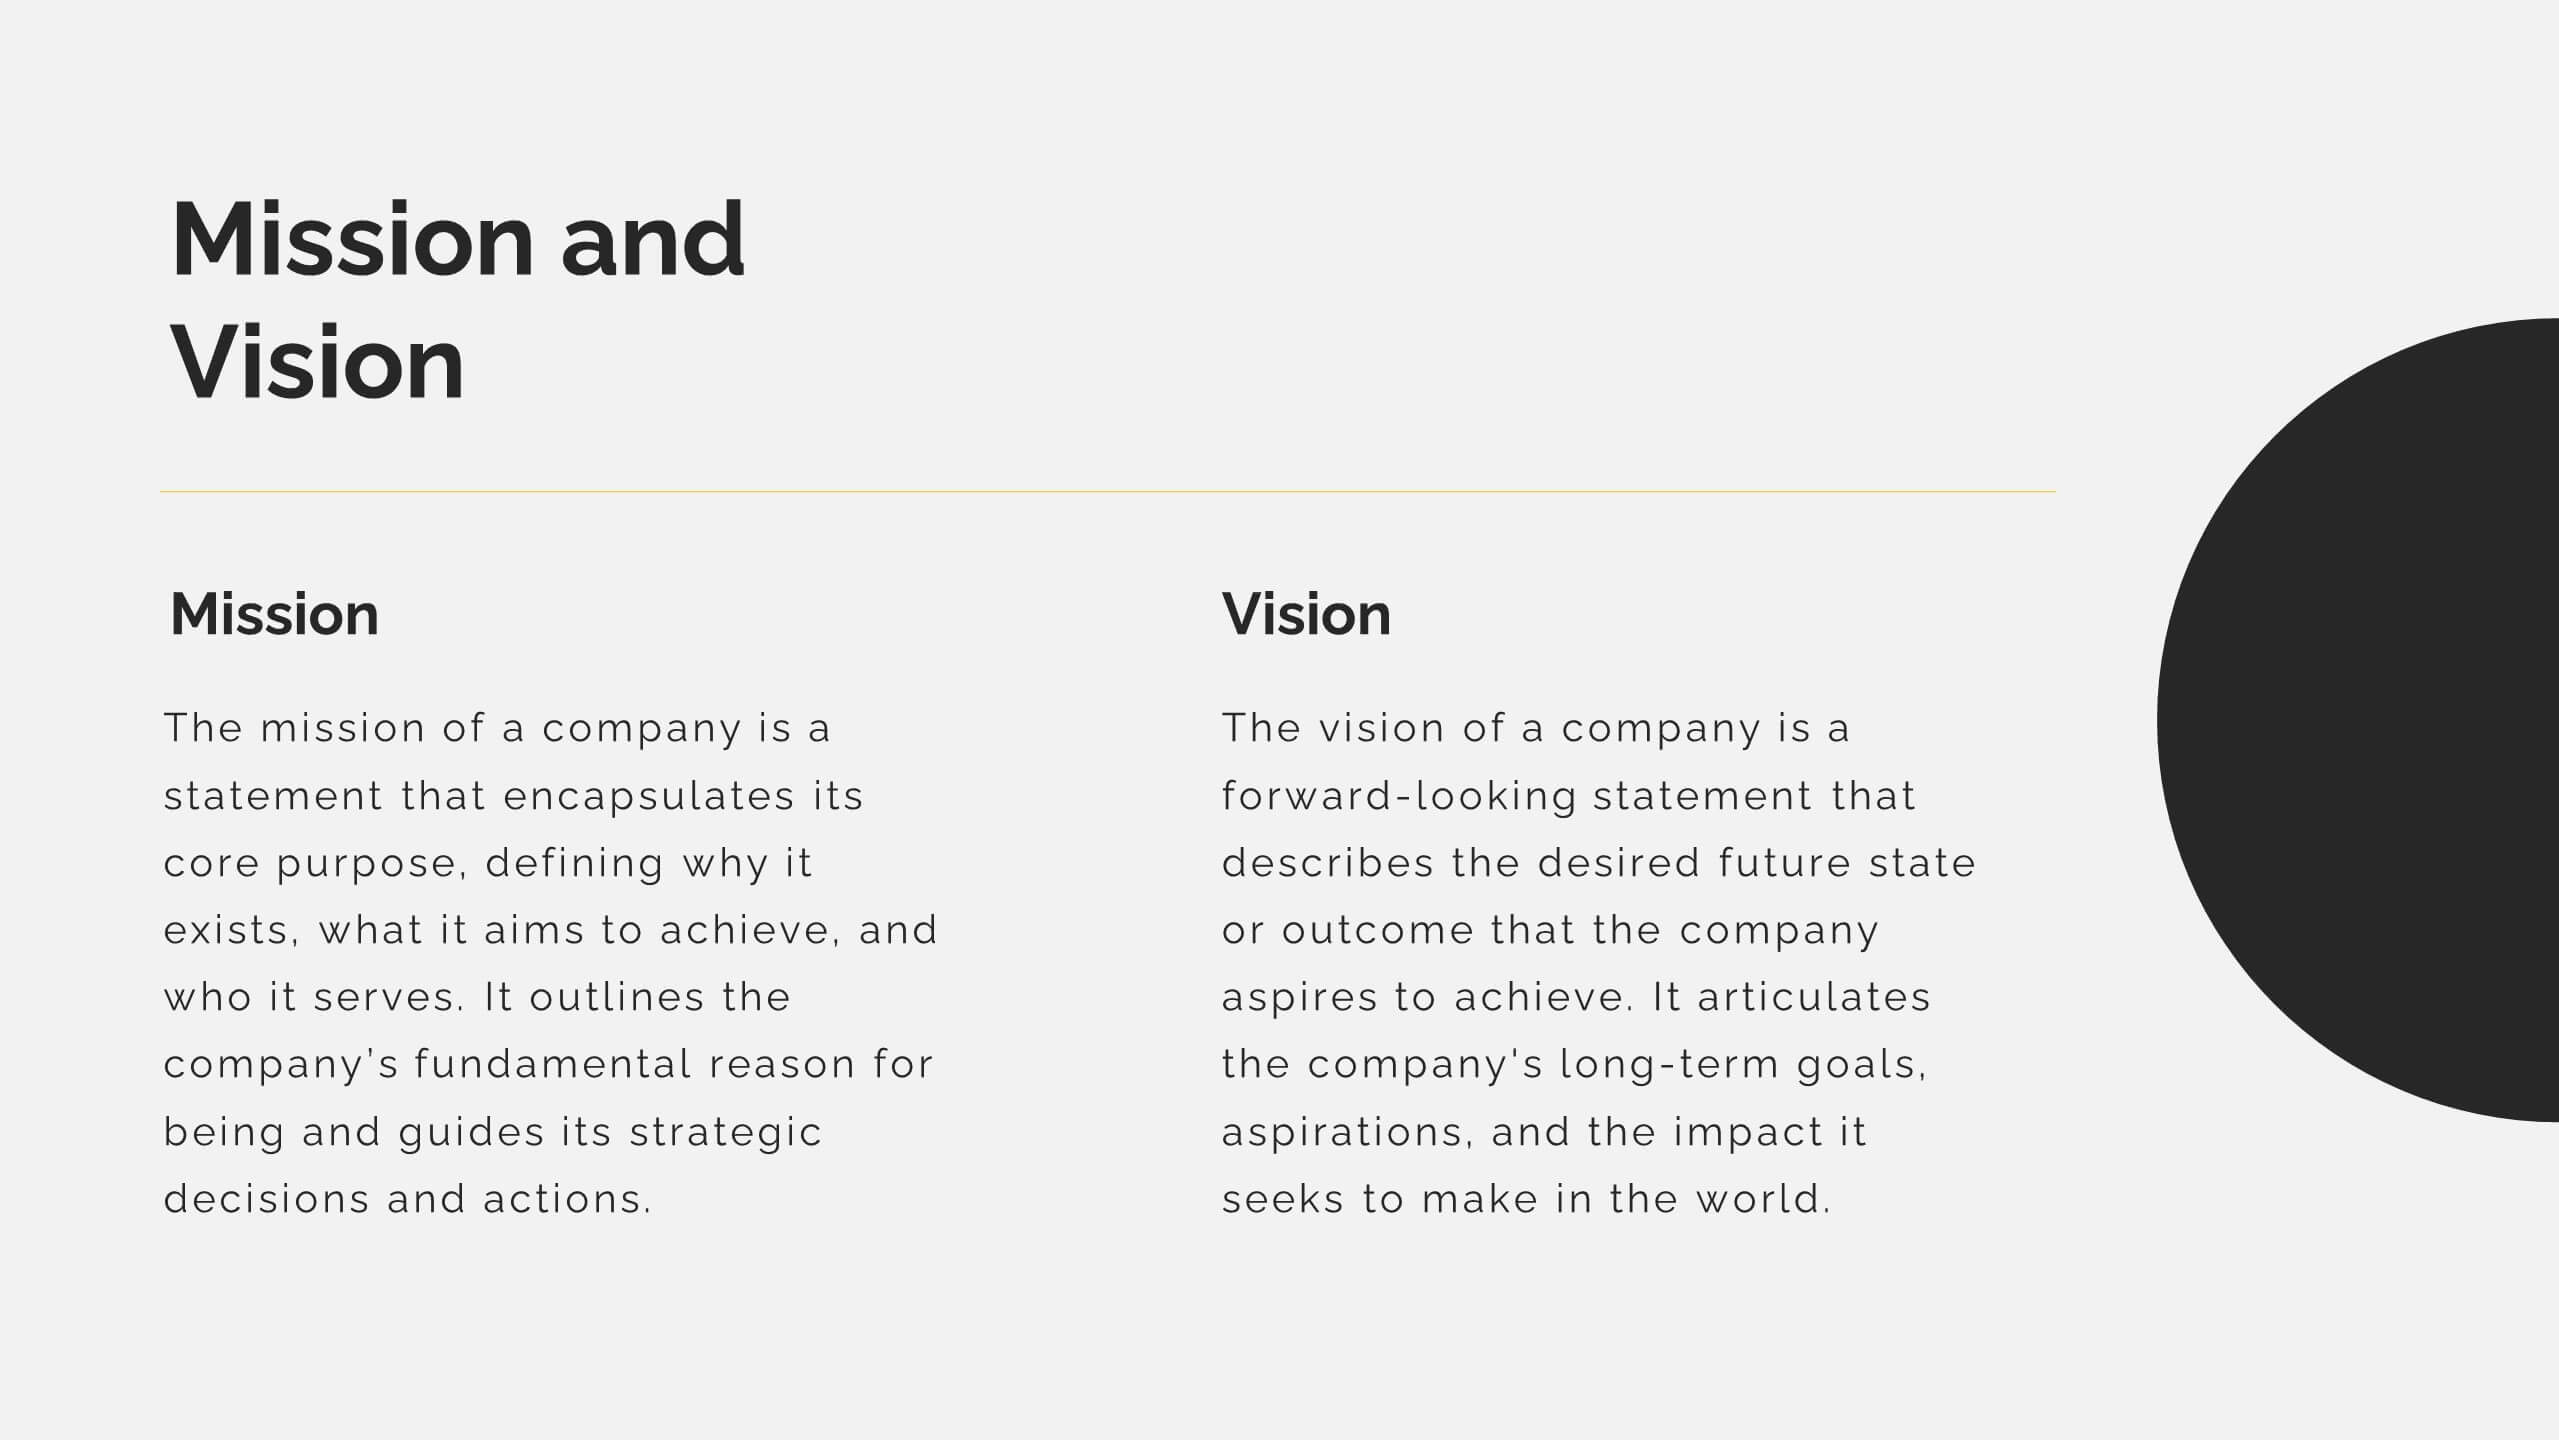
Mirage Startup Funding Proposal Presentation
Secure funding with this dynamic startup proposal template! Perfect for presenting your mission, vision, business model, and market analysis. Ideal for entrepreneurs aiming to impress investors and stakeholders. Compatible with PowerPoint, Keynote, and Google Slides, this template ensures your proposal is clear, professional, and compelling. Achieve your startup goals today!


5 diapositivas
Insurance Specialities Infographics
Insurance Specialties refer to specific areas of the insurance industry that require specialized knowledge, expertise, and training. These Infographic templates are visually appealing and informative presentation tools that can be used by insurance companies, brokers, or agents to showcase their unique services and specialties. This template includes a range of customizable graphics, charts, and icons that can be edited to match your brand. With this template, you can clearly and effectively communicate the various types of insurance you offer, such as life, health, property, or liability insurance.


5 diapositivas
Sport Illustrated Infographics
Sport Illustrated Infographics is a bold, colorful, and modern presentation


29 diapositivas
Shadowglow Brand Guidelines Proposal Presentation
Present a cohesive brand vision with this professional template, designed for crafting detailed and visually compelling brand guidelines. Highlight essential components like brand vision and mission, brand values, and identity elements, including color palettes, typography, and imagery. This template seamlessly incorporates customer personas, tone and voice guidelines, and brand touchpoints to define the essence of your brand's communication. Utilize slides for website, social media, and packaging strategies to establish consistency across all platforms. Customizable and compatible with PowerPoint, Google Slides, and Keynote, this design ensures clarity and professionalism, making it ideal for agencies or teams presenting comprehensive brand proposals.


12 diapositivas
Business Issue Root Cause Identification Presentation
Pinpoint Business Challenges with Precision using this Business Issue Root Cause Identification presentation template. Designed to uncover underlying problems efficiently, this template features structured visuals, hierarchical frameworks, and clear labeling to facilitate root cause analysis. Whether you're a business strategist, operations manager, or consultant, this template helps identify, analyze, and resolve critical business issues. Fully customizable and compatible with PowerPoint, Keynote, and Google Slides, ensuring a seamless and professional presentation experience.


21 diapositivas
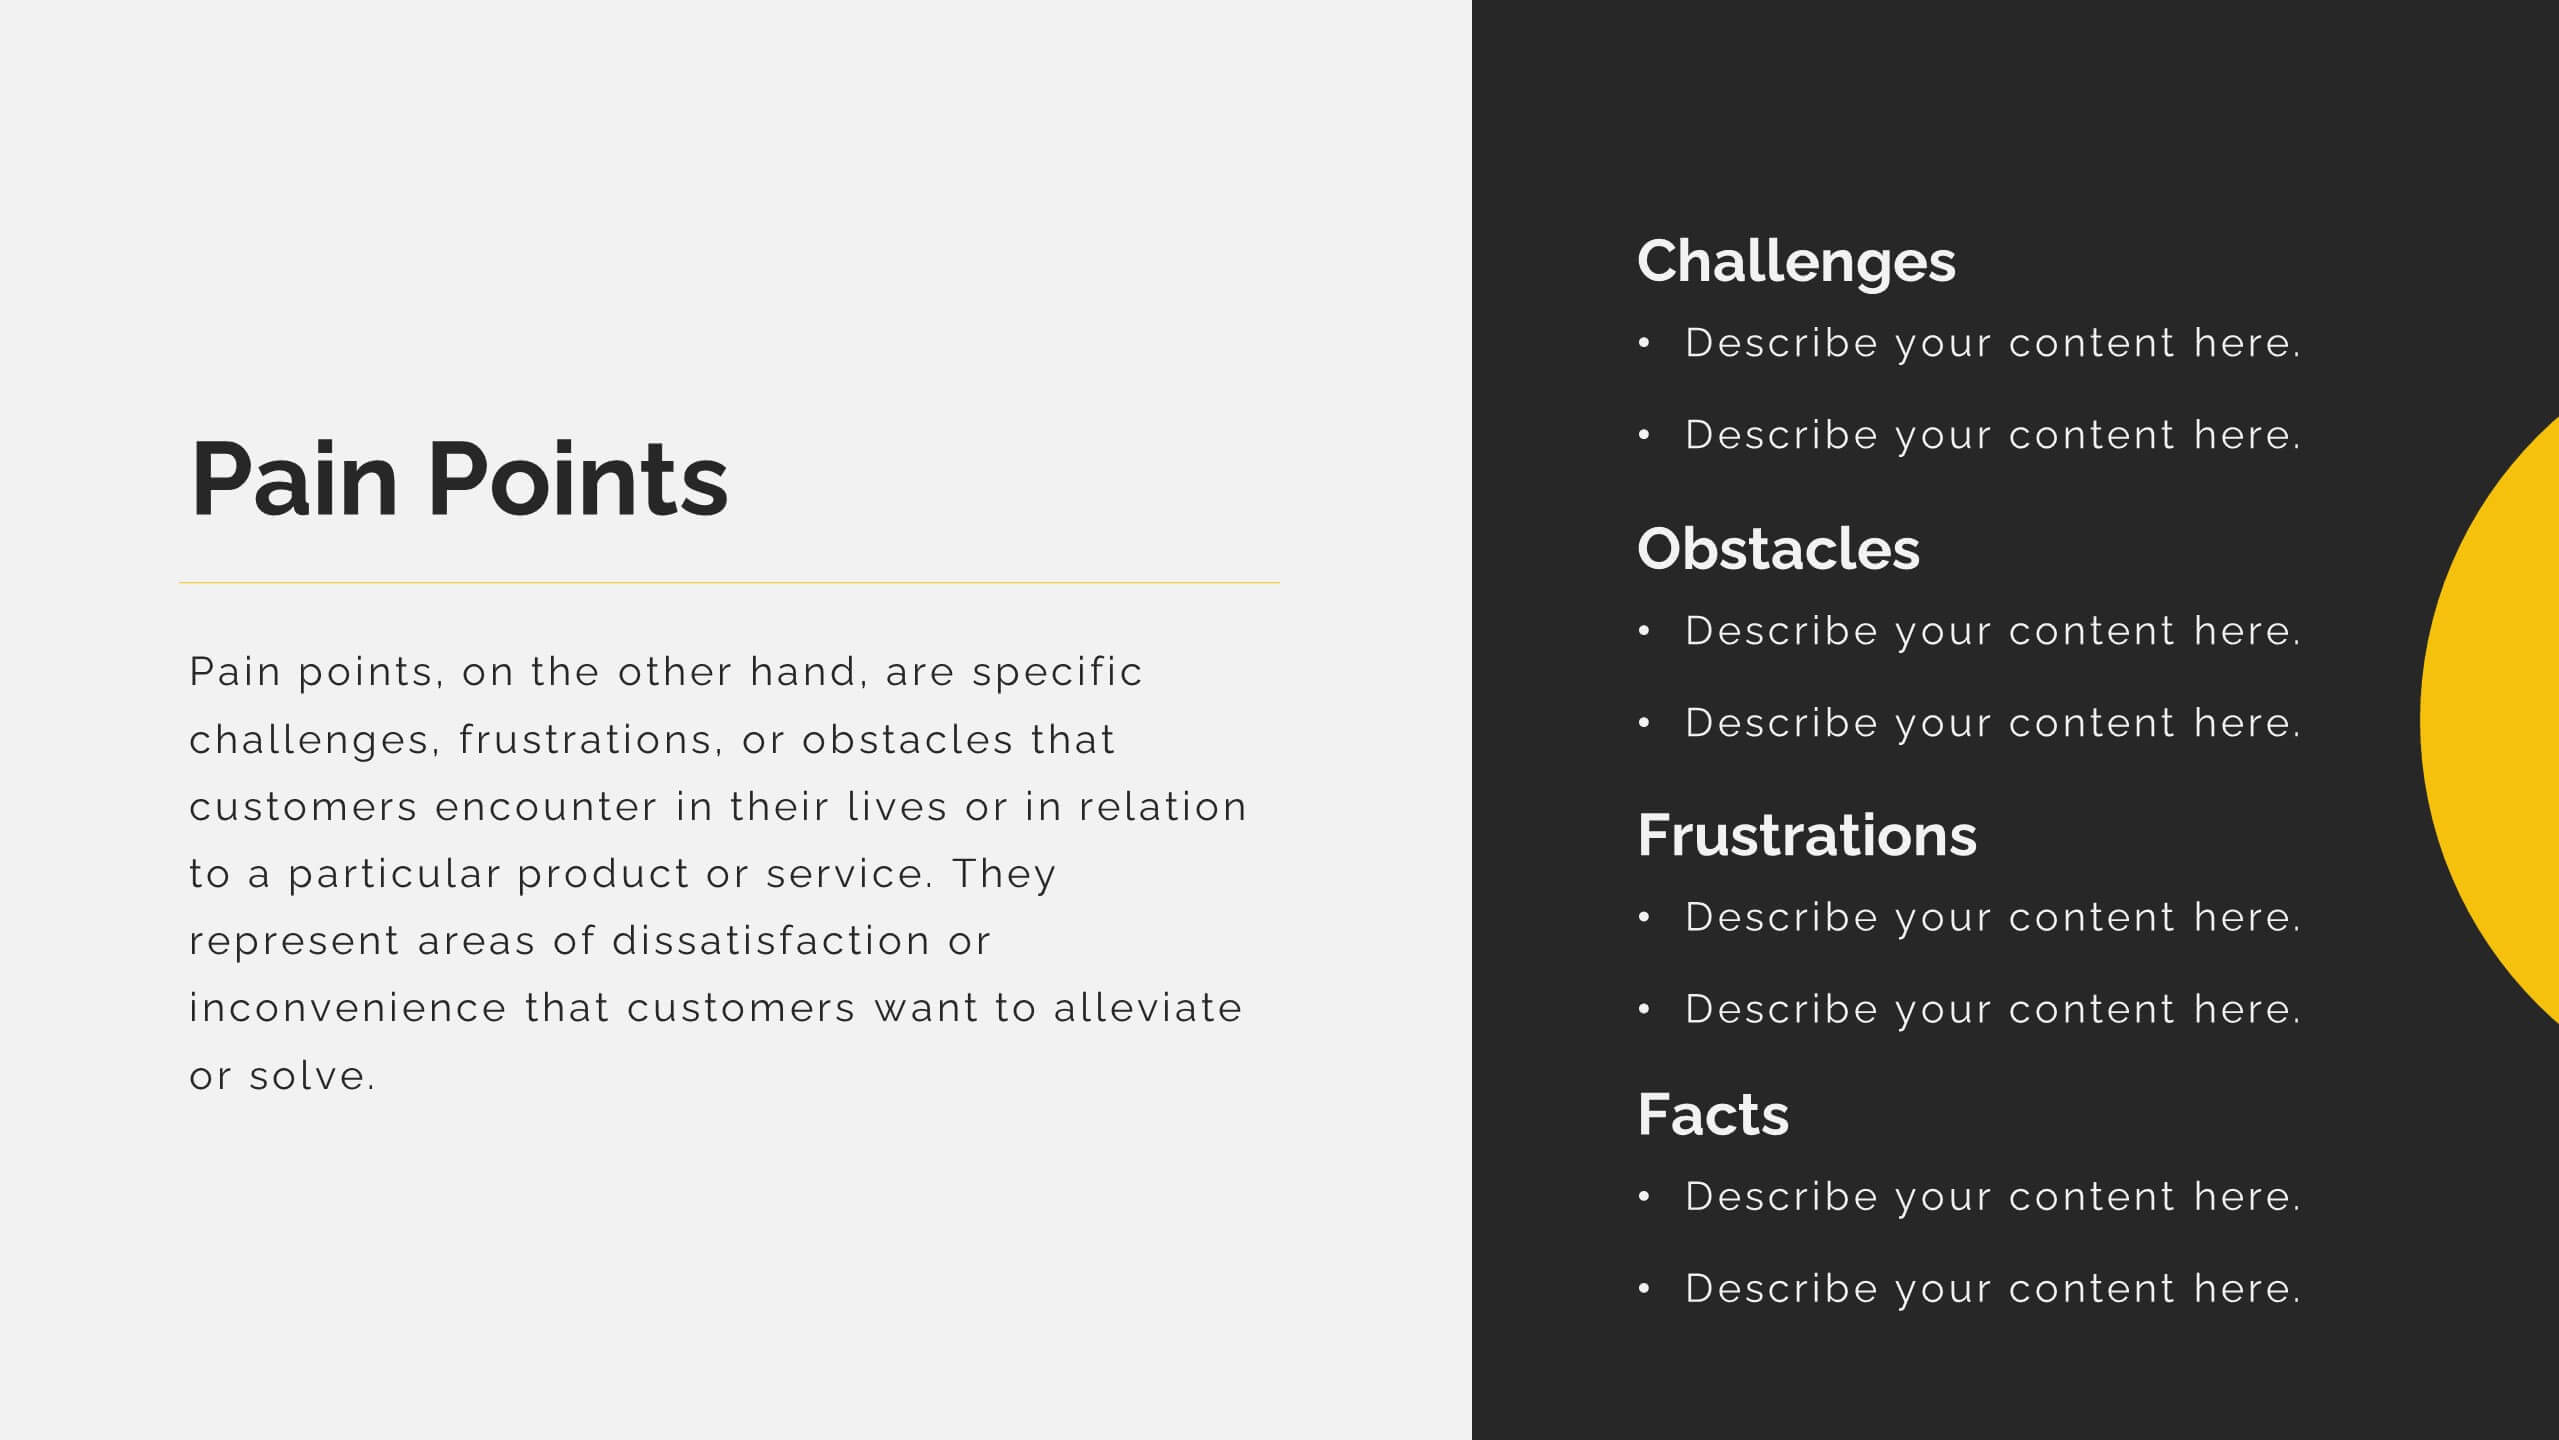
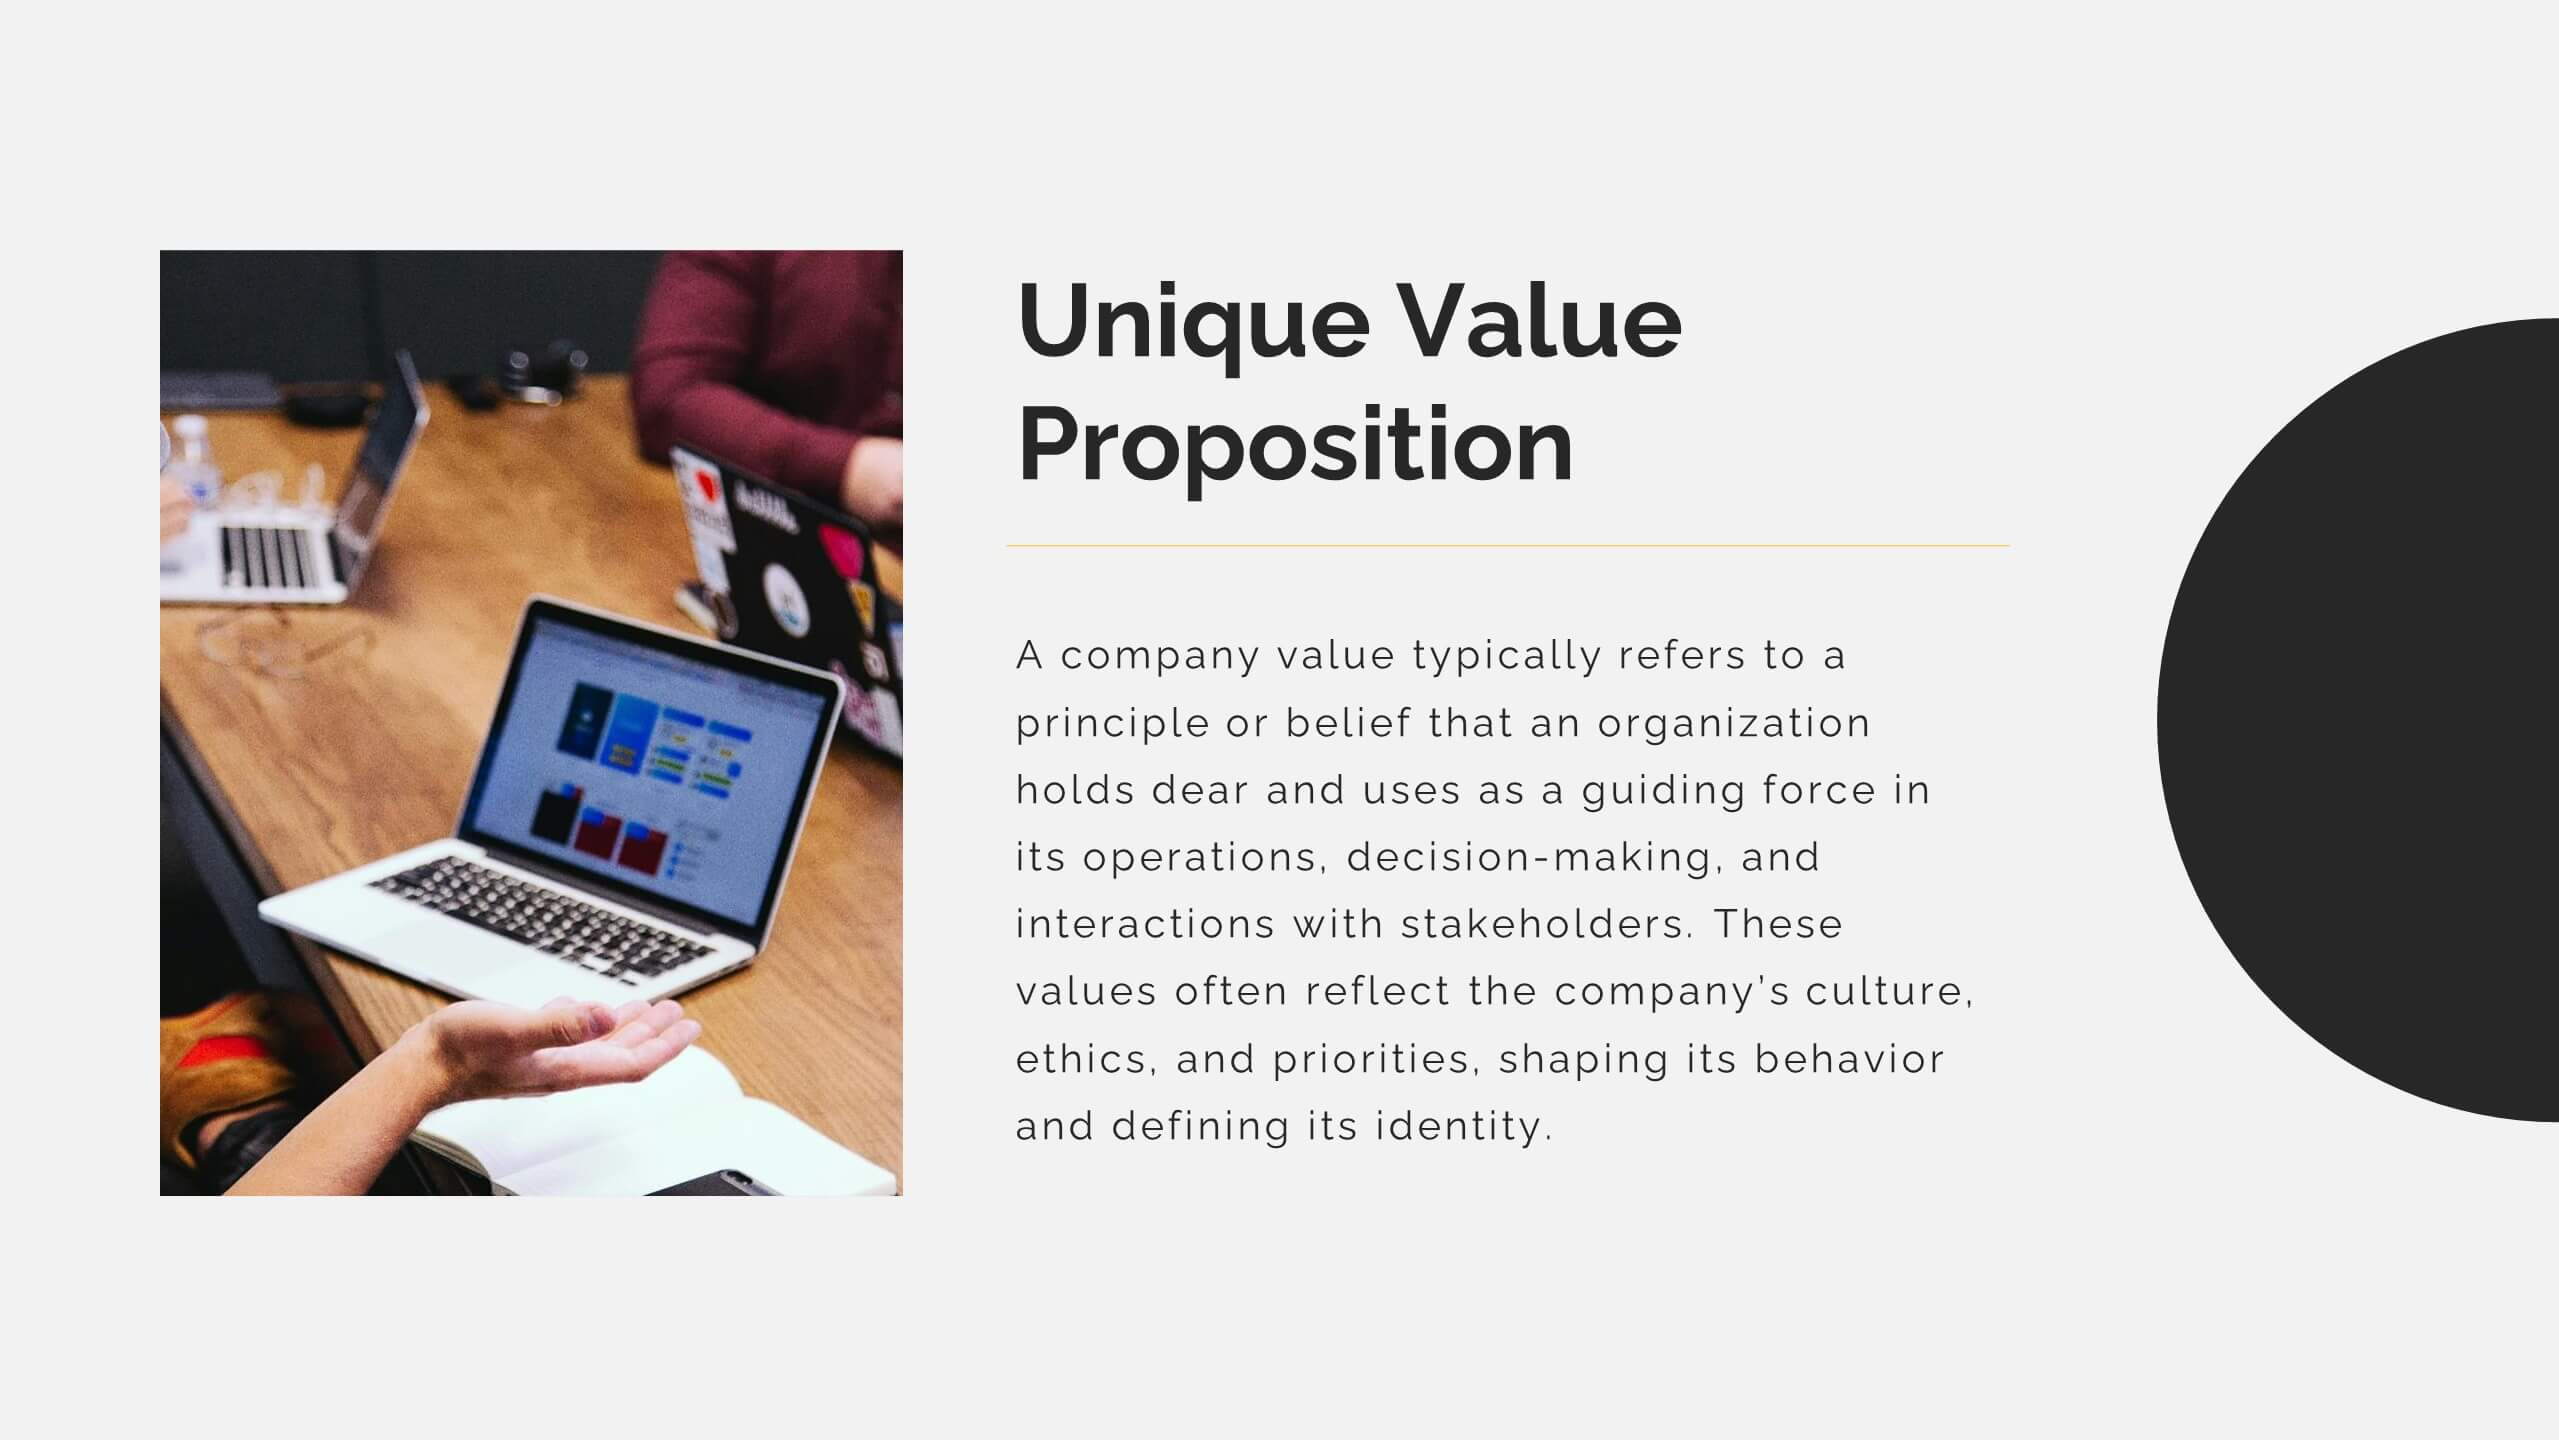
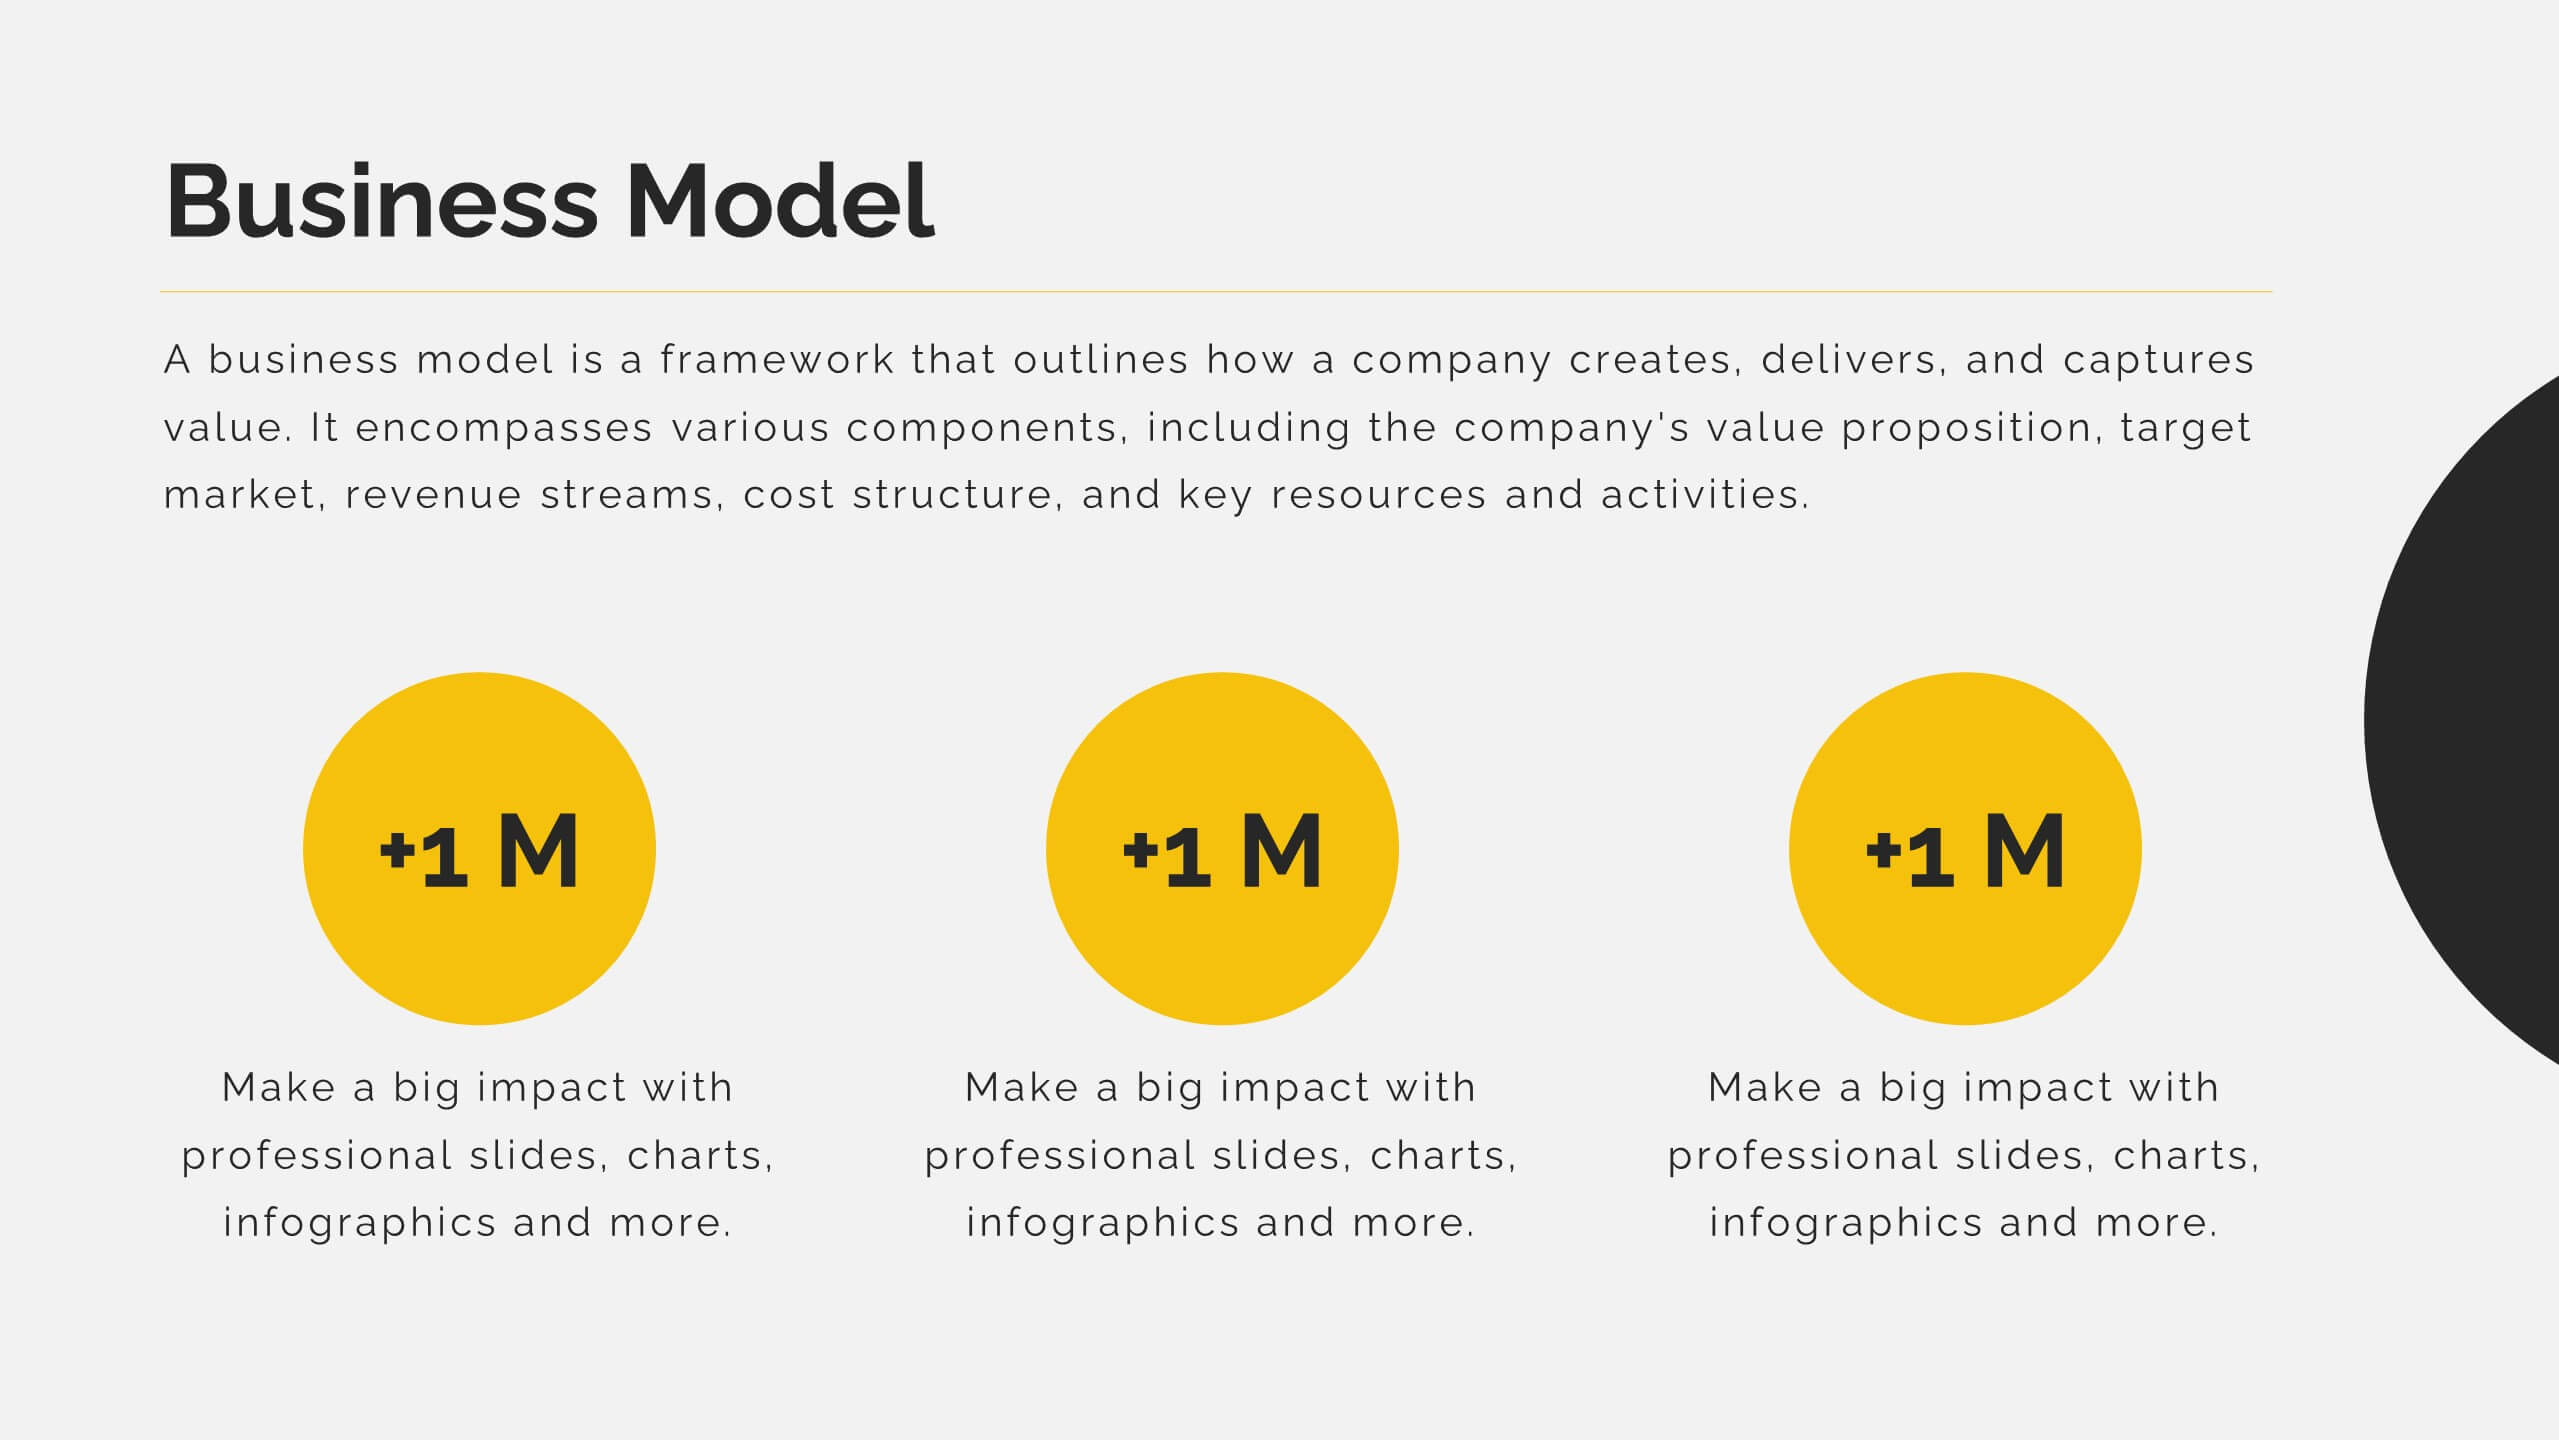
Zephyrkin Product Roadmap Presentation
Outline your product’s journey with this roadmap template, covering essential elements like target market, customer pain points, competitive analysis, and marketing strategy. Showcase your product's features, unique value proposition, and development process. Ideal for PowerPoint, Keynote, and Google Slides, this template supports professional product presentations.


4 diapositivas
Impact of 5G on Business and Innovation Presentation
Illustrate how next-gen connectivity is transforming industries with this sleek 5G innovation infographic. Featuring a 3D smartphone and signal waves, this slide presents four gradient-colored segments ideal for showcasing business use cases, digital transformation, and market impact. Ideal for tech startups, consultants, and enterprise innovation teams. Easily editable in PowerPoint, Keynote, and Google Slides.


5 diapositivas
Customer Conversion with AIDA Framework
Present your sales strategy effectively with the Customer Conversion with AIDA Framework Presentation. This template breaks down the four key stages—Attention, Interest, Desire, and Action—into a clear and visually engaging funnel design. Perfect for marketing professionals, sales teams, and business strategists. Fully editable in PowerPoint, Keynote, and Google Slides.