


Características


¿Tienes alguna pregunta?
Recomendar


5 diapositivas
US State-by-State Sales Breakdown Presentation
Visualize regional performance with the US State-by-State Sales Breakdown Presentation. This slide uses a clean U.S. map layout to highlight state-specific sales metrics alongside color-coded legends and icons. Ideal for showcasing key market insights, regional trends, or territory growth. Fully editable in Canva, PowerPoint, and Google Slides.


12 diapositivas
Simple Gantt Chart Template Presentation
Track your project progress at a glance with this Simple Gantt Chart Template. Featuring color-coded circles for weekly task planning across two timelines, it’s perfect for visual project tracking. Easily customizable for PowerPoint, Keynote, or Google Slides. Ideal for quick updates, team syncs, and keeping your workflow organized.


6 diapositivas
TAM SAM SOM for Target Reach Forecasting Presentation
Break down your market reach with clarity using the TAM SAM SOM for Target Reach Forecasting Presentation. This sleek, layered circle diagram is ideal for illustrating your total addressable market, serviceable market, and obtainable market. Customize easily in PowerPoint, Keynote, or Google Slides to align with your brand and business strategy.
8 diapositivas
OKR Strategy Tracker Presentation
Bring your goals to life with a dynamic, structured layout that tracks objectives, measures results, and keeps teams aligned from start to finish. Ideal for strategic planning, quarterly reviews, or business updates, this presentation makes performance tracking effortless. Compatible with PowerPoint, Keynote, and Google Slides for full customization.


15 diapositivas
Business Proposal Infographic
A business proposal is a formal document that outlines a specific business endeavor, project, or venture, and presents a persuasive argument for why the proposed approach or solution is viable and advantageous. This infographic template is a tool for the business world to communicate business ideas, pitch a product or service, secure funding or partnerships, or enter into a business agreement. Fully customizable and compatible with Powerpoint, Keynote, and Google Slides. Showcase your unique value proposition and unveil how it fuels your journey to success. Energize your business propositions and set the stage for success!


7 diapositivas
Modern Food Menu Presentation
Bring your ideas to the table with a clean and modern layout that turns any food-related content into an easy, visually appealing story. This presentation helps you showcase dishes, categories, or menu insights with clarity and style, making information simple to follow. Fully compatible with PowerPoint, Keynote, and Google Slides.


6 diapositivas
Geometric Shape Design Slides
Present your process or flow clearly using the Geometric Shape Design Slides Presentation. This layout uses connected circular icons to visually represent sequential steps, ideal for workflows, timelines, or strategic roadmaps. Each stage is color-coded and paired with editable titles and descriptions for clarity. Fully customizable in PowerPoint, Keynote, and Google Slides.


7 diapositivas
Big Data Analytic Infographics
Big Data are the large and complex data sets that are difficult to process and analyze using traditional data processing methods. This template will allow you to visualize key data points and insights in an appealing and easy to digest way. Your information is presented in a clear manner with a variety of graphs, to convey the fundamentals of big data analytics. Customize this infographic with your own data in the bullet points and graphics. Quickly edit text and colors for your next presentation. All the slide in this template are fully editable in Powerpoint, Keynote, and Google Slides.


7 diapositivas
Oceania Map Infographic Presentation Template
The Oceania Map is a geographical region comprising Australasia, Melanesia, Micronesia and Polynesia. The largest landmass of Oceania is Australia. Oceania's borders differ slightly from country to country, but its boundaries are mostly defined by the waters surrounding its many islands. This Oceania map template is the first step to creating an engaging and informative map. It features the entire continent, surrounding islands, and sub-regions. The white background makes it easy to fill out with your colorful content. This template is suitable for school projects or business presentations.


5 diapositivas
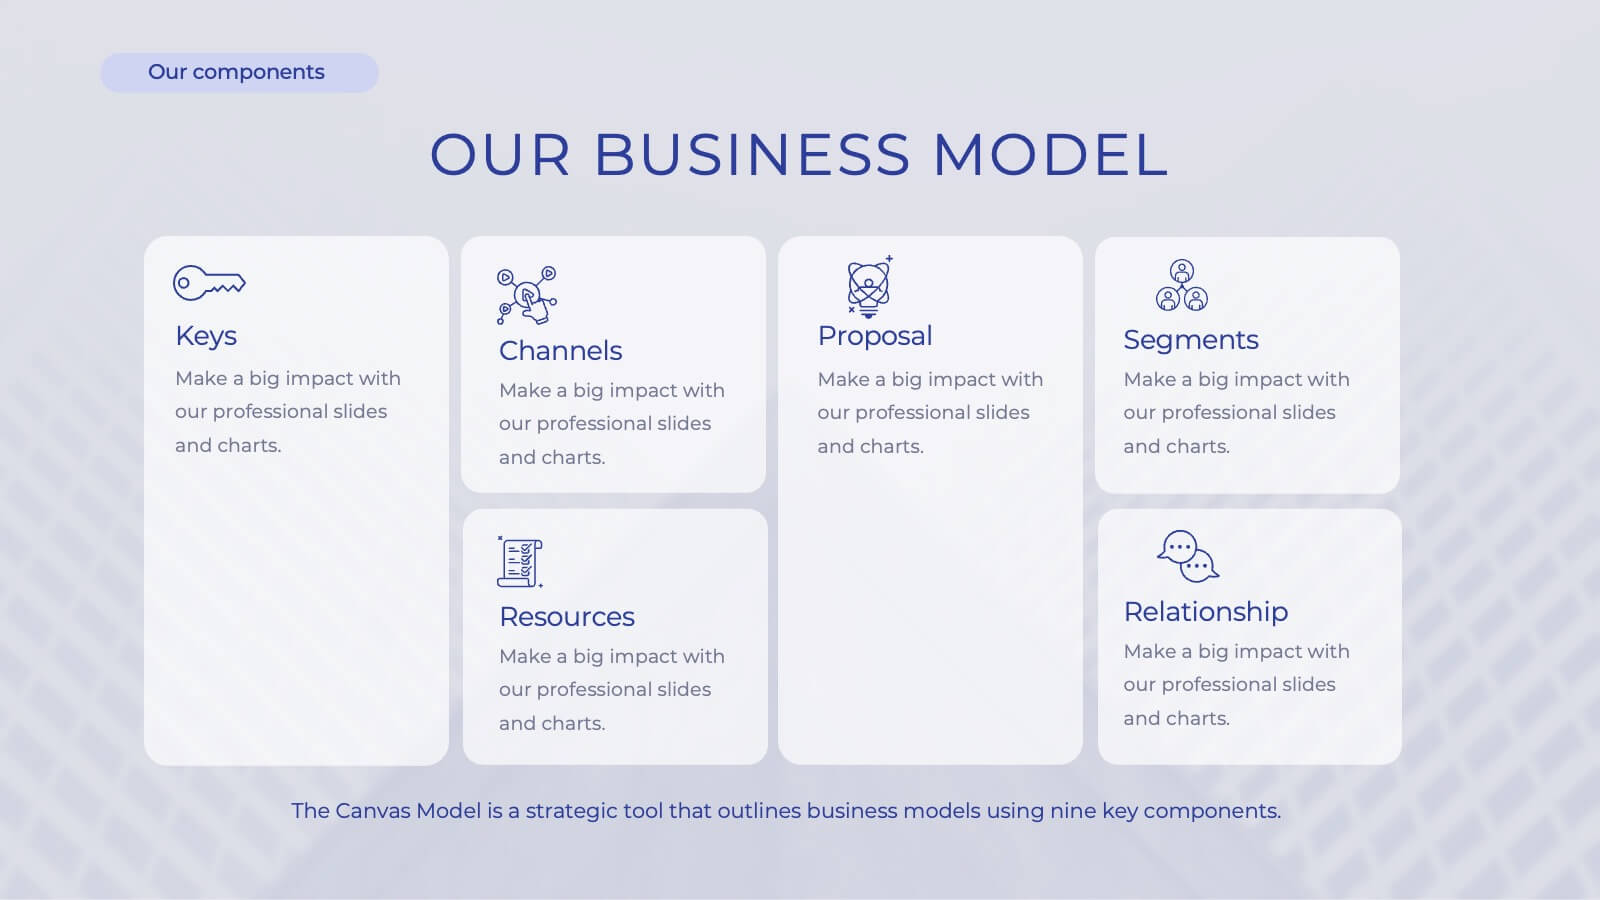
Business Model Canvas Overview Presentation
Streamline your business strategy with the Business Model Canvas Overview Presentation. Designed for entrepreneurs, startups, and strategists, this template visualizes key partners, activities, value propositions, customer segments, revenue streams, and more. Fully editable for PowerPoint, Keynote, and Google Slides, ensuring a structured and professional business plan presentation.


20 diapositivas
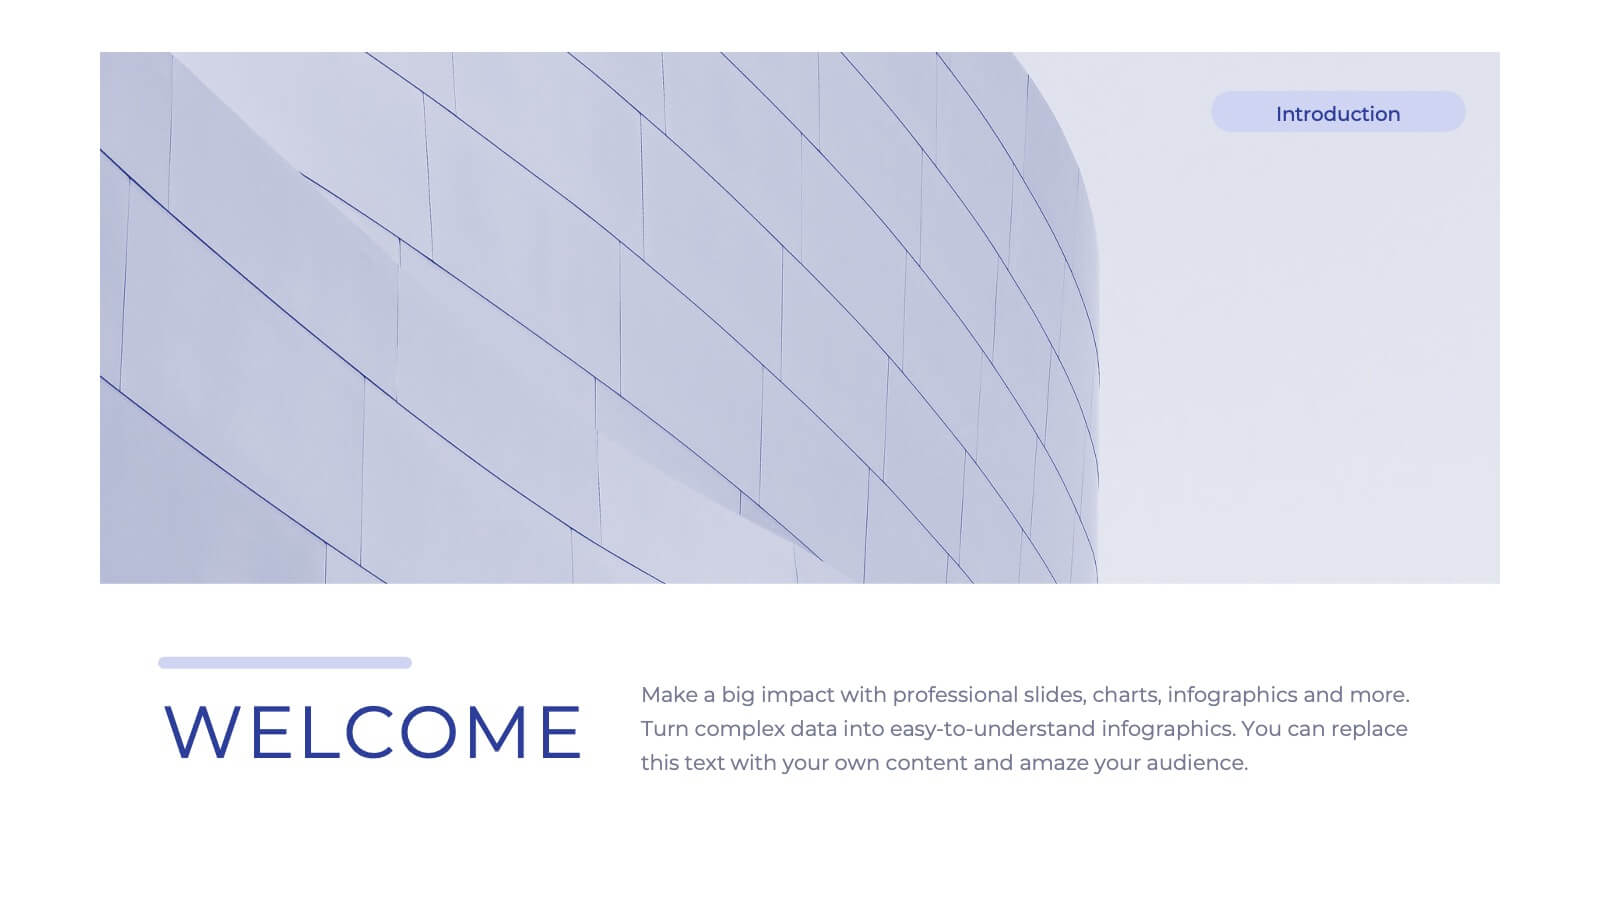
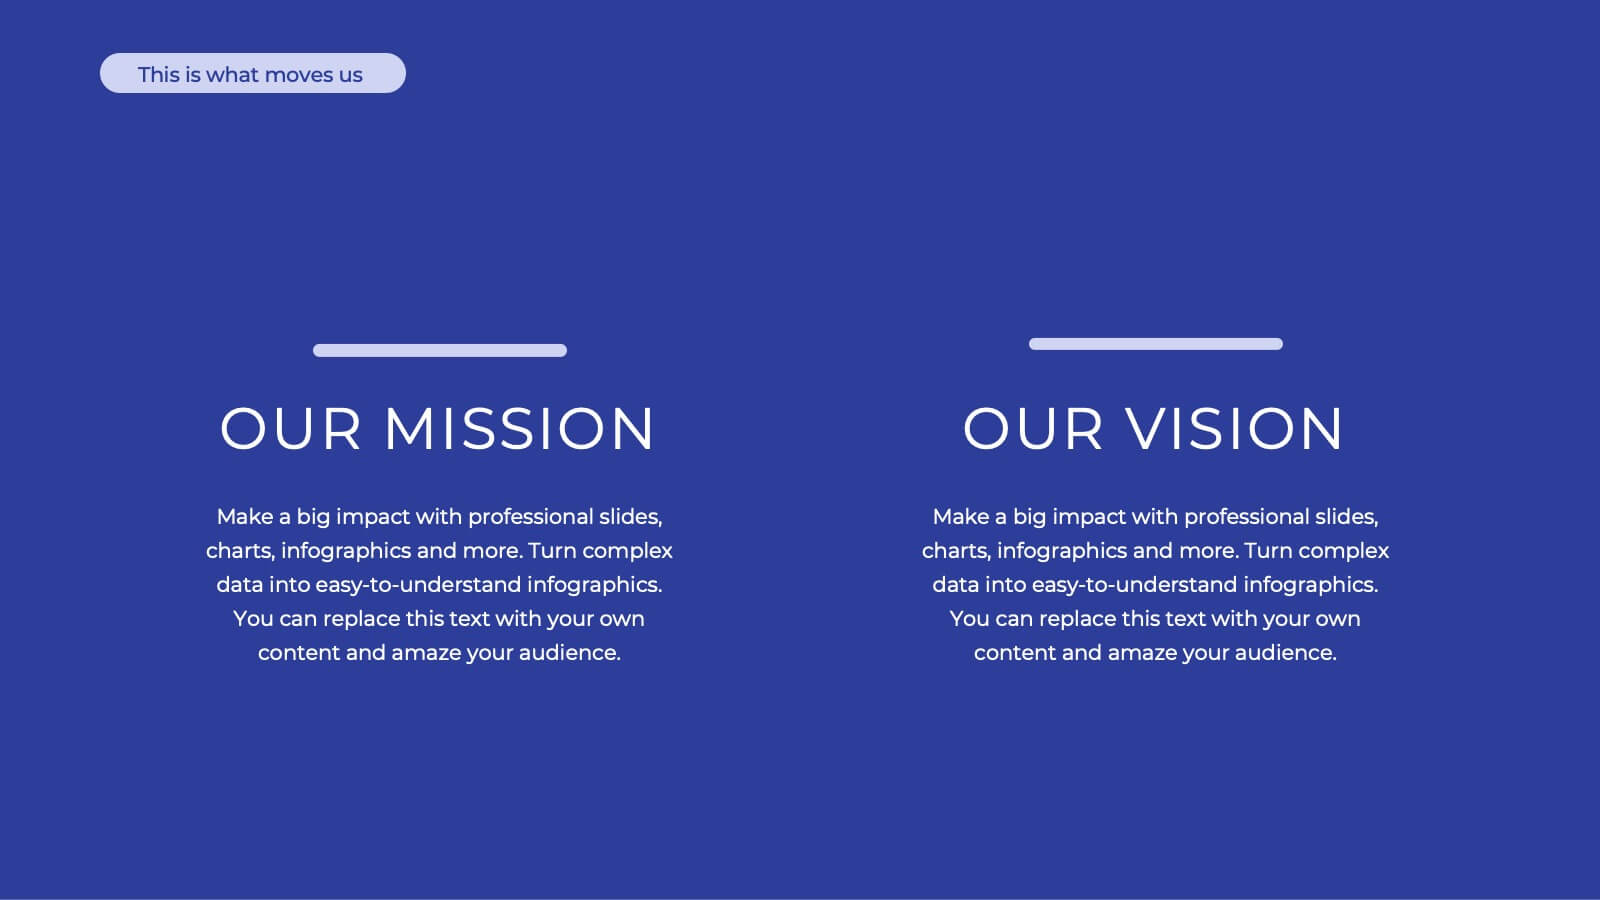
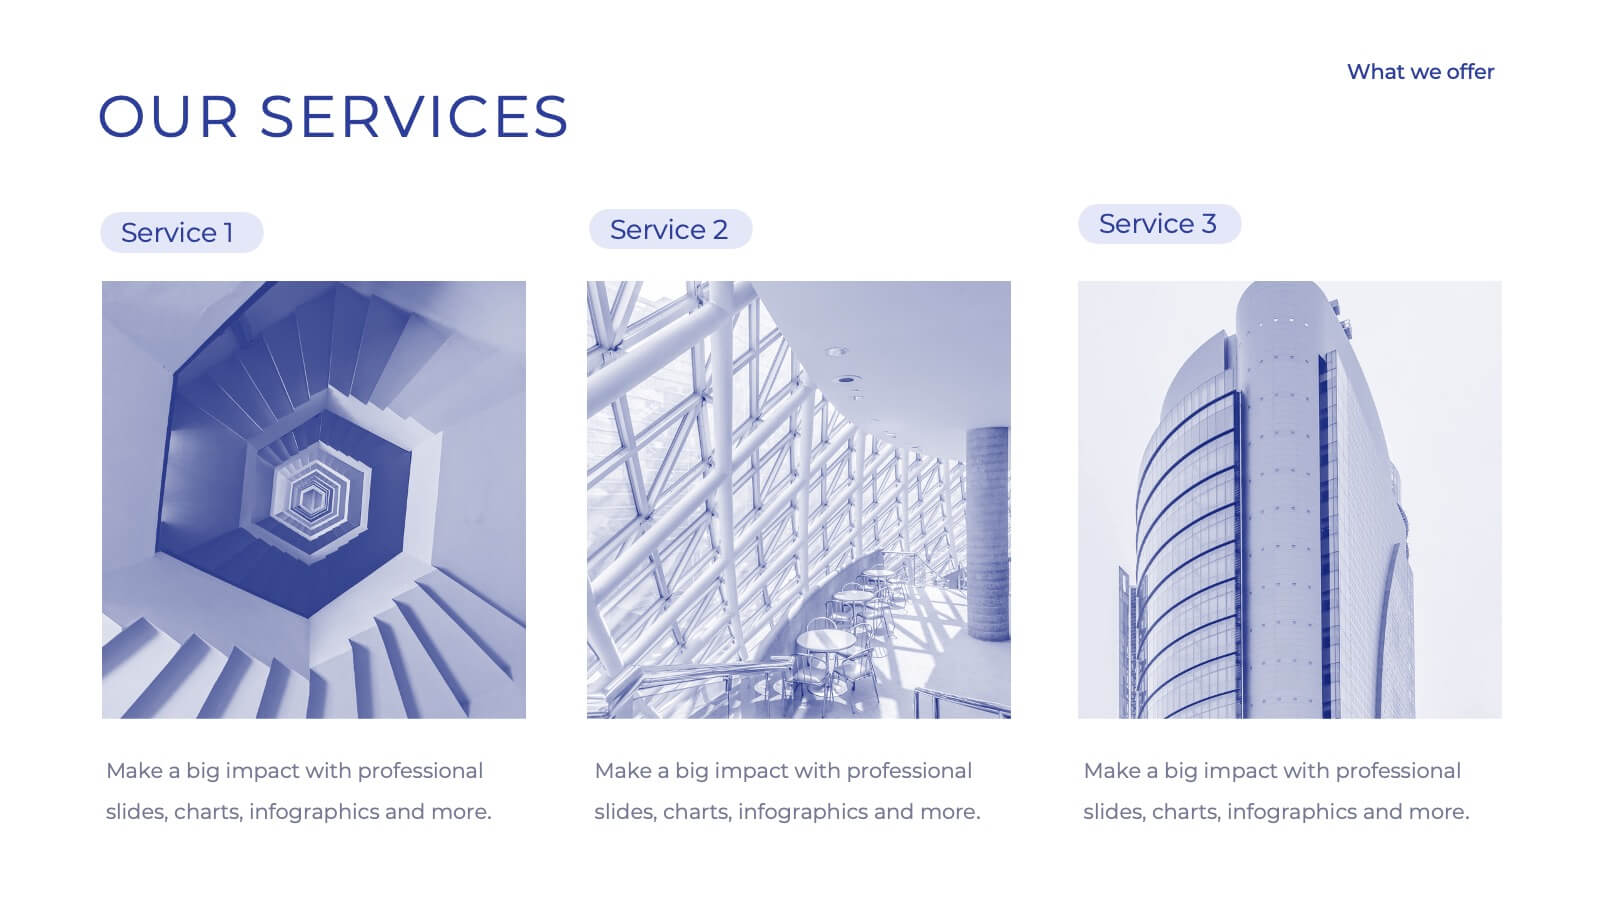
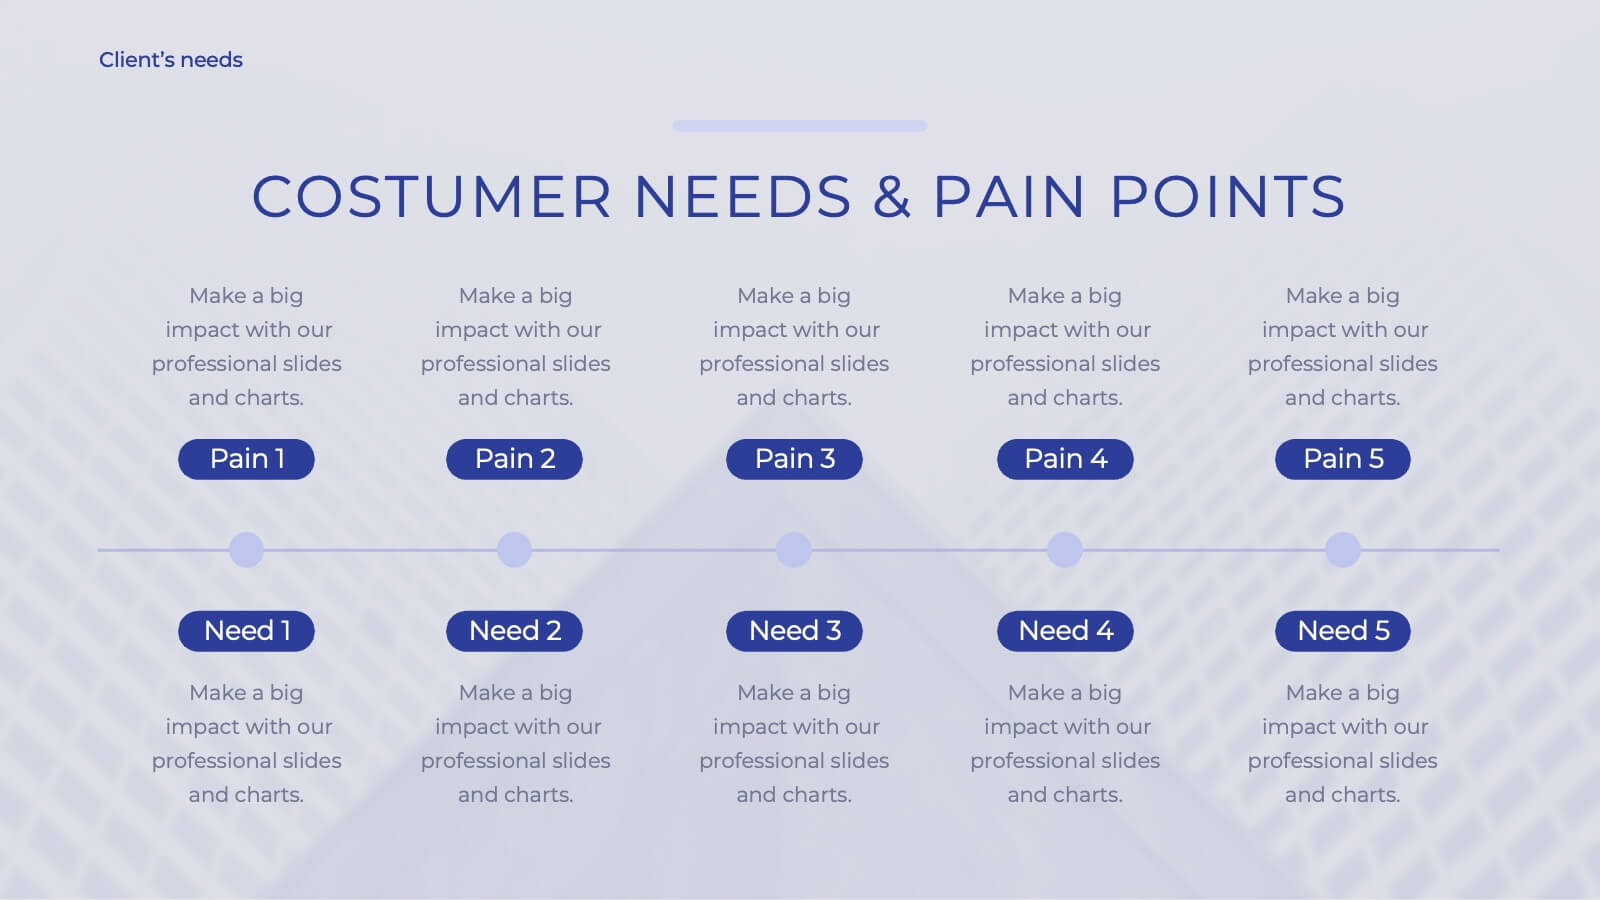
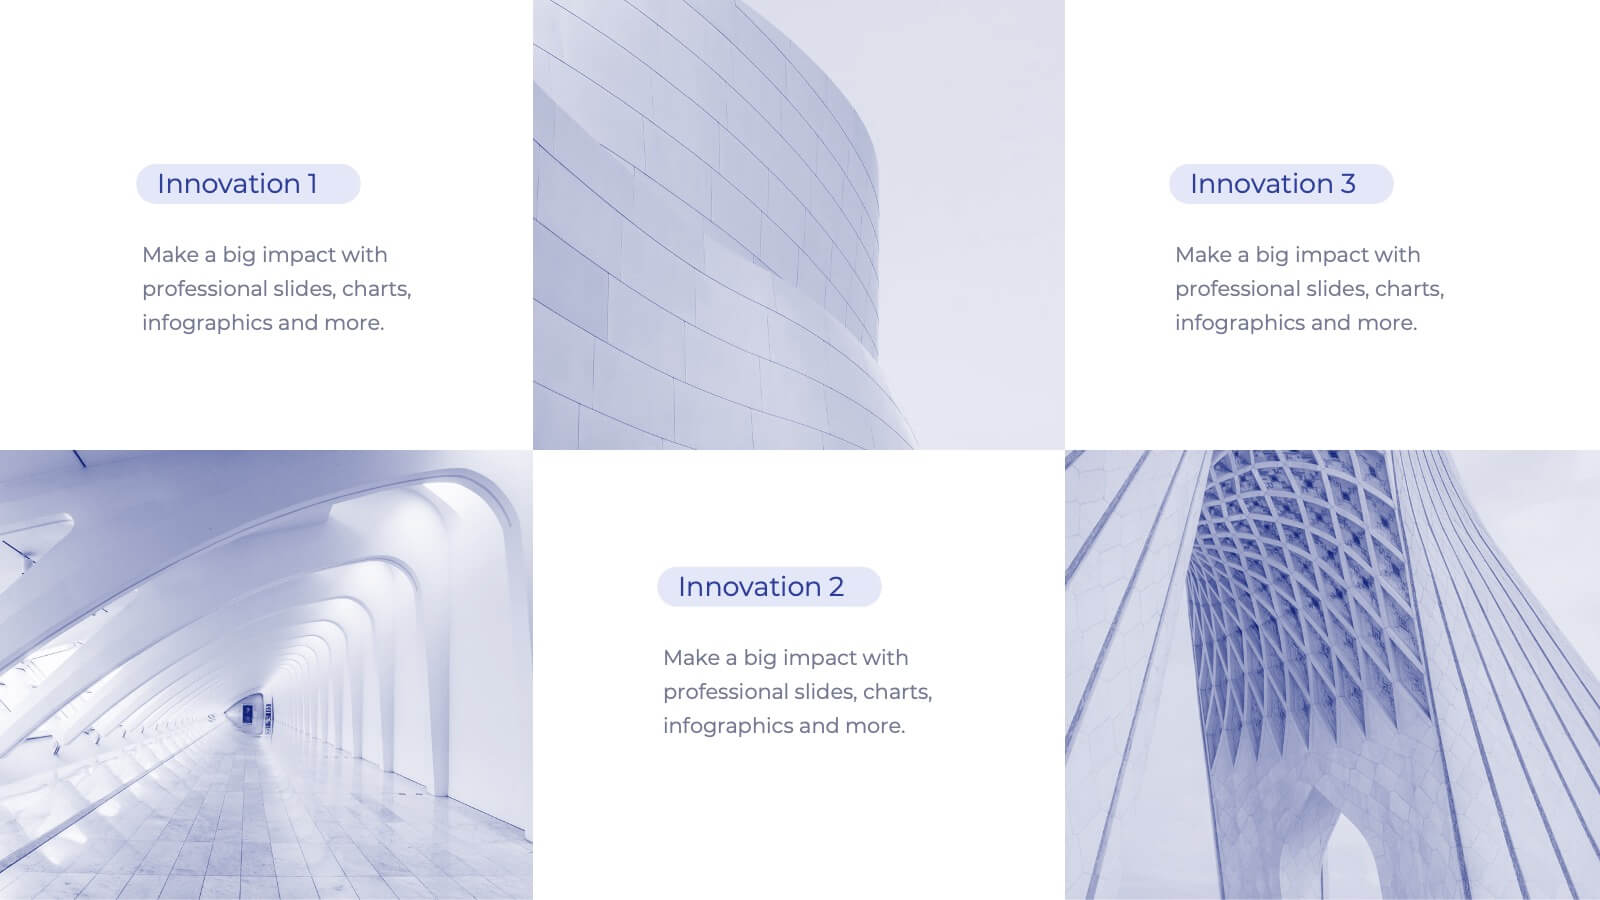
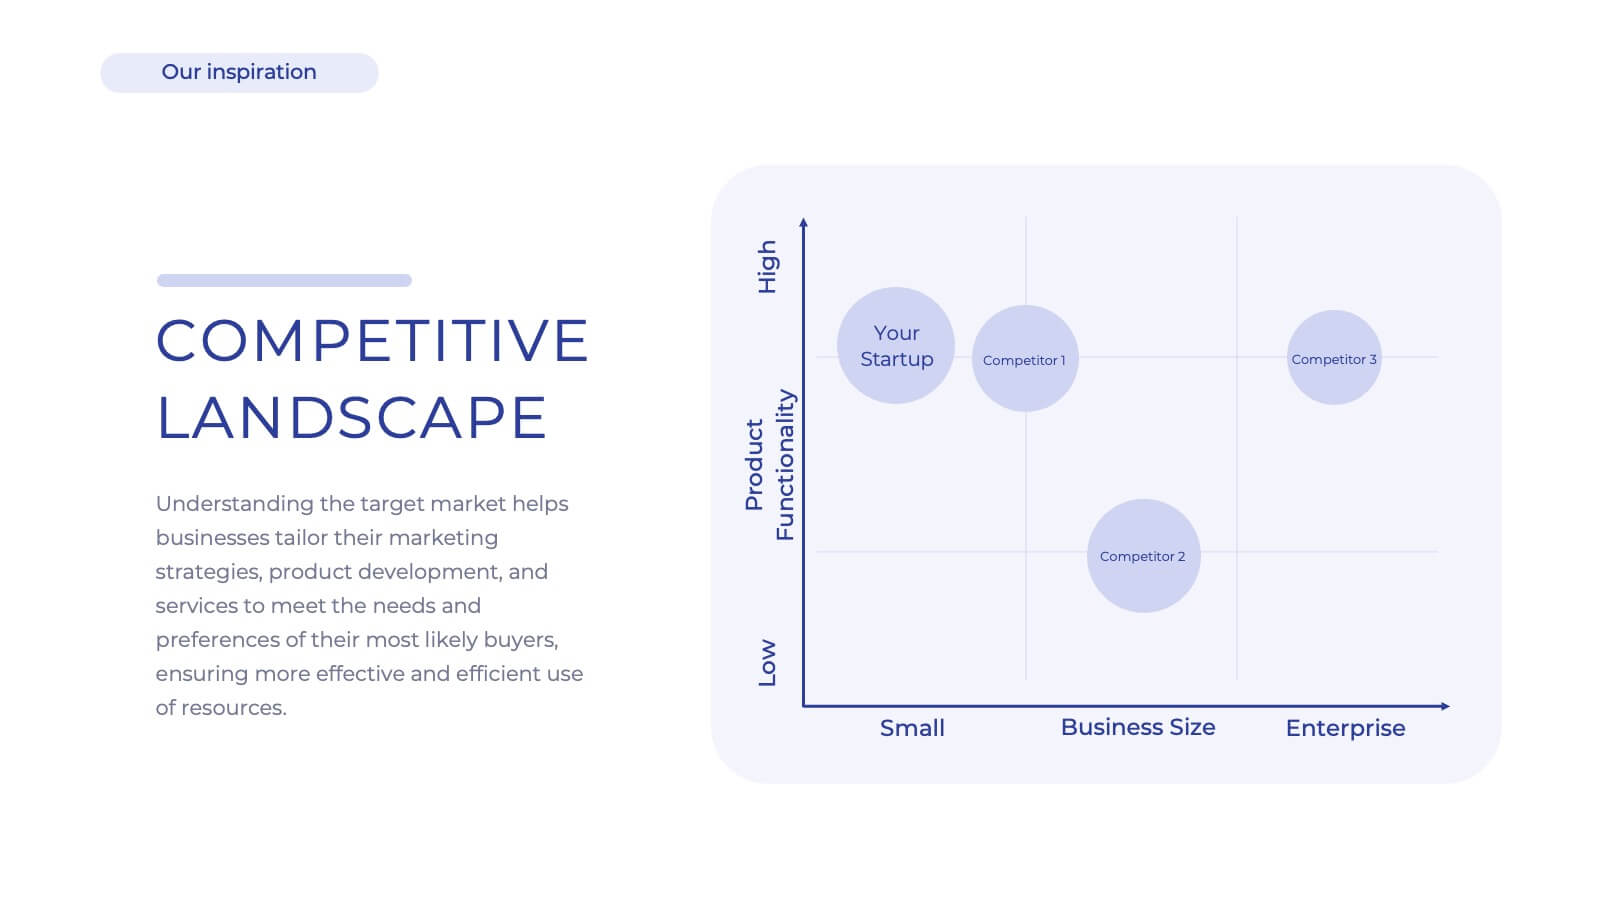
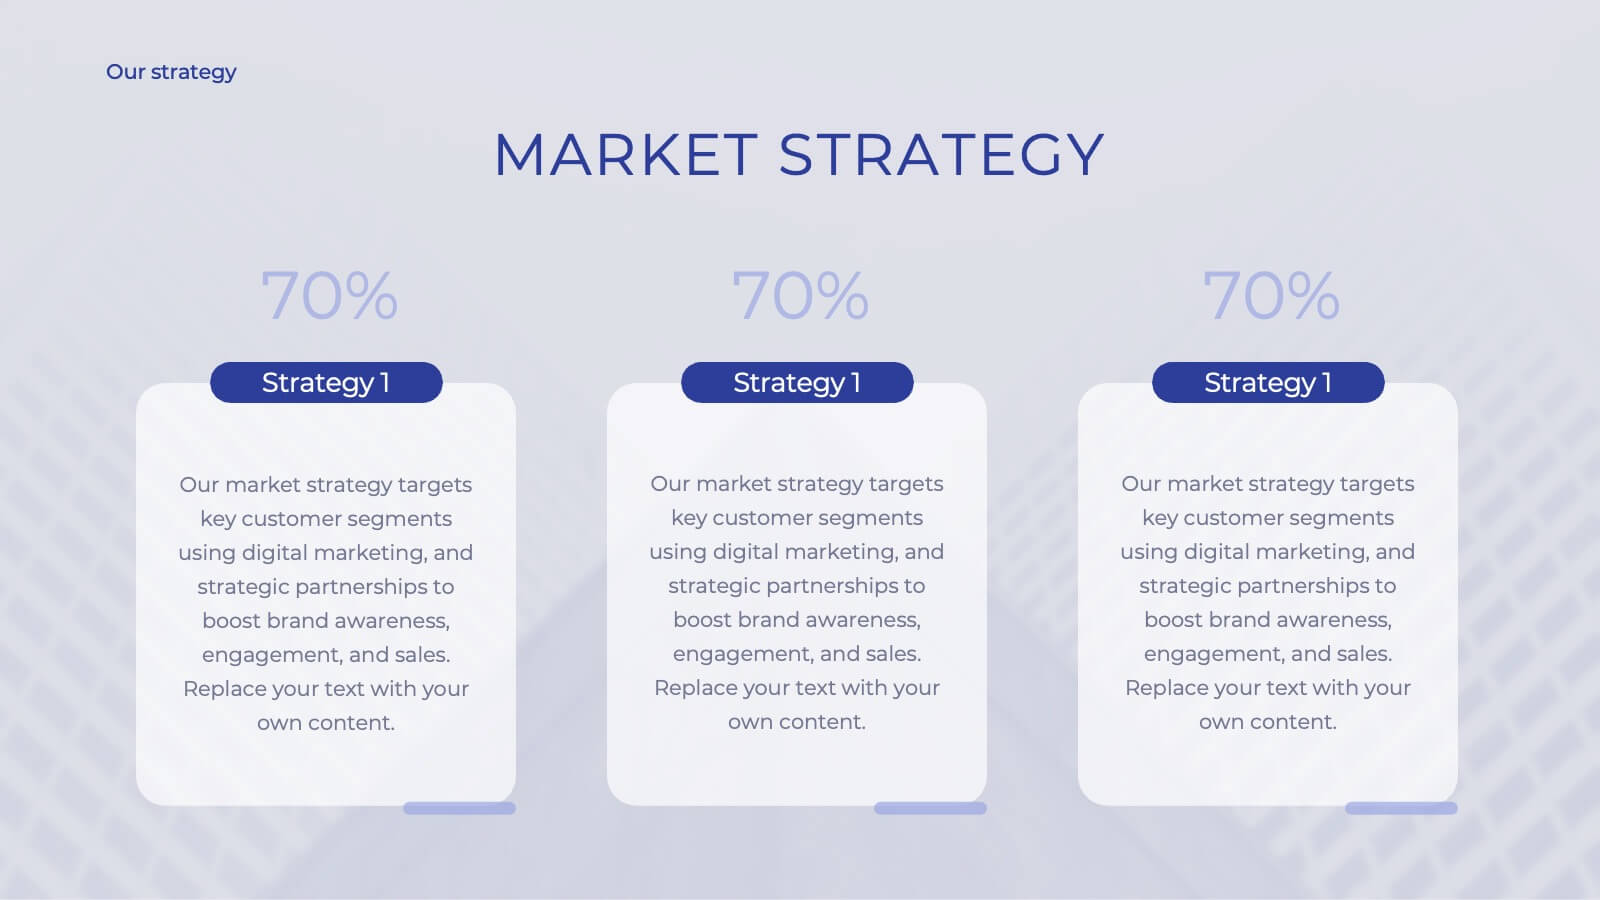
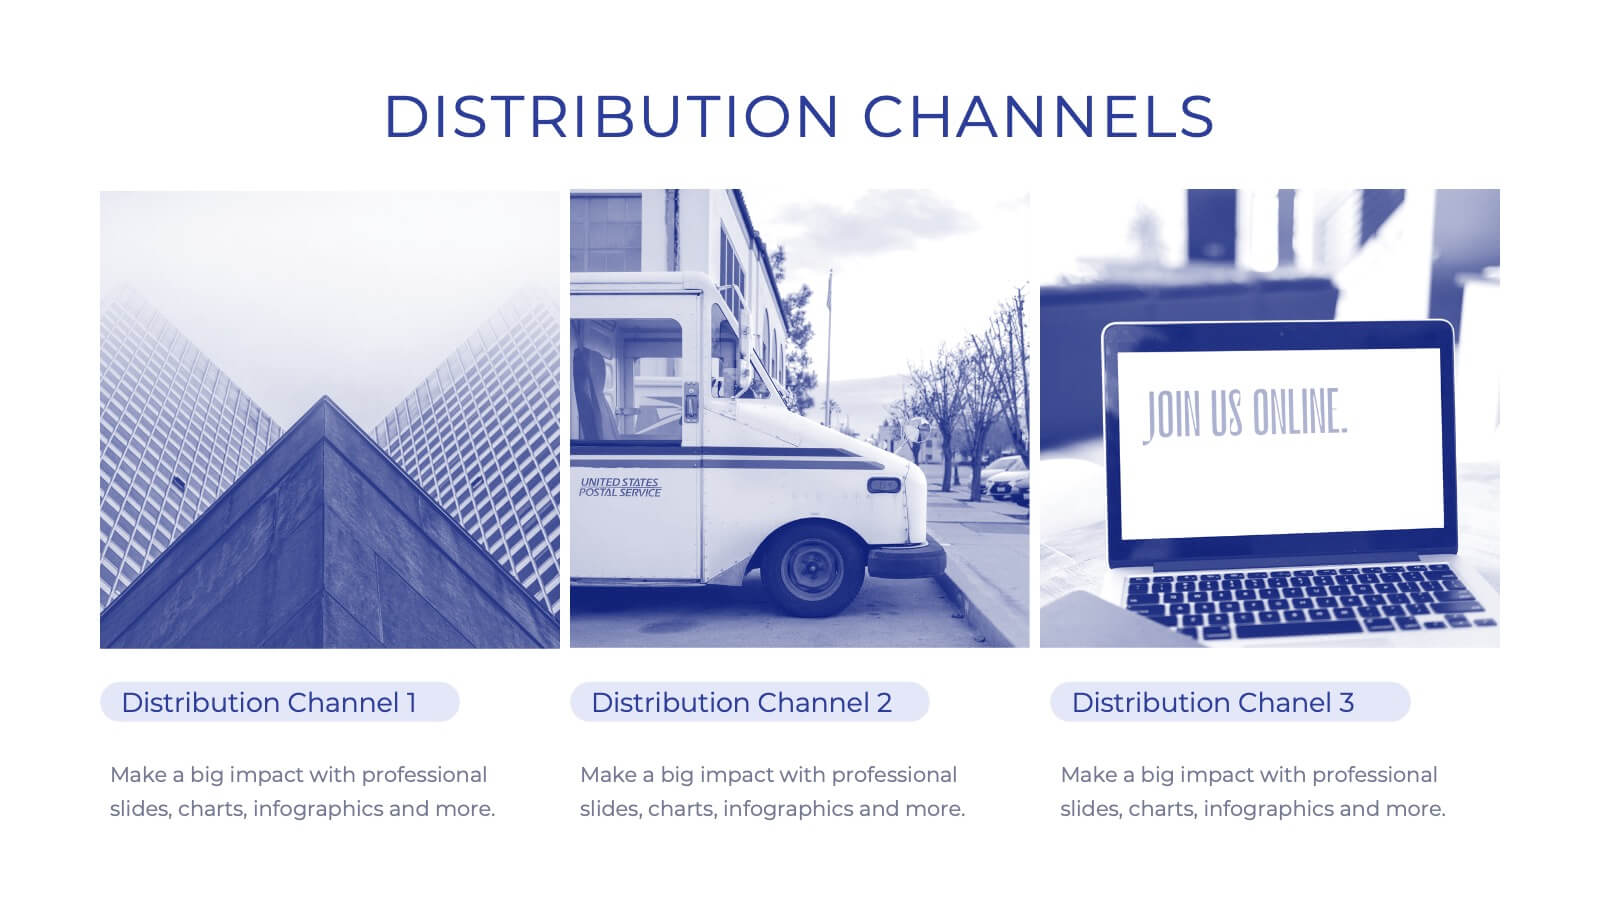
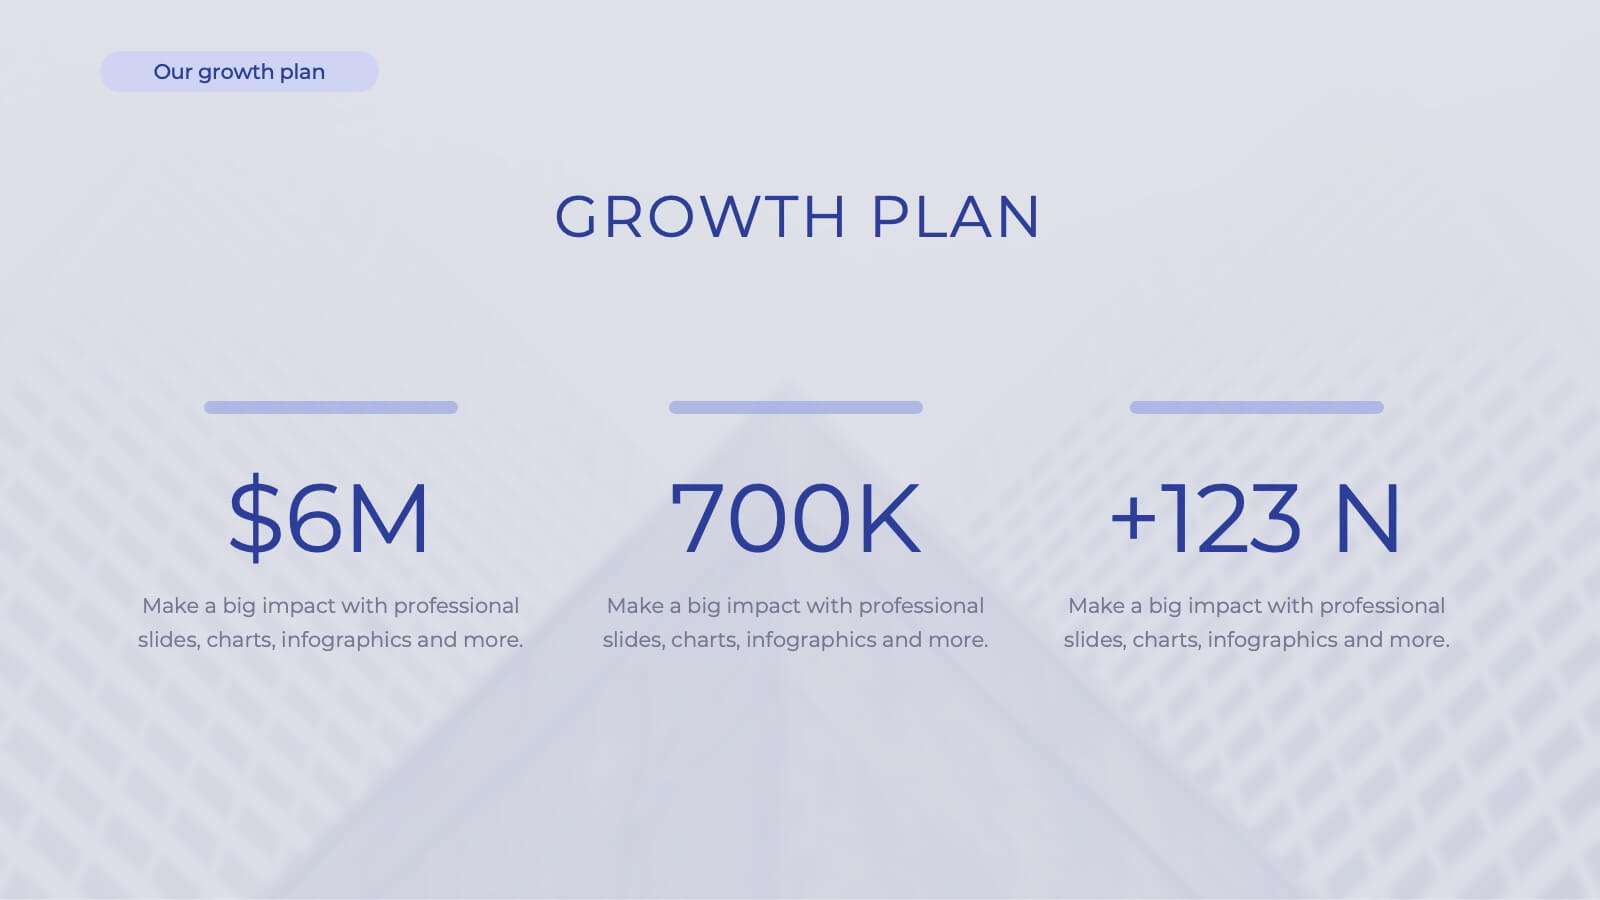
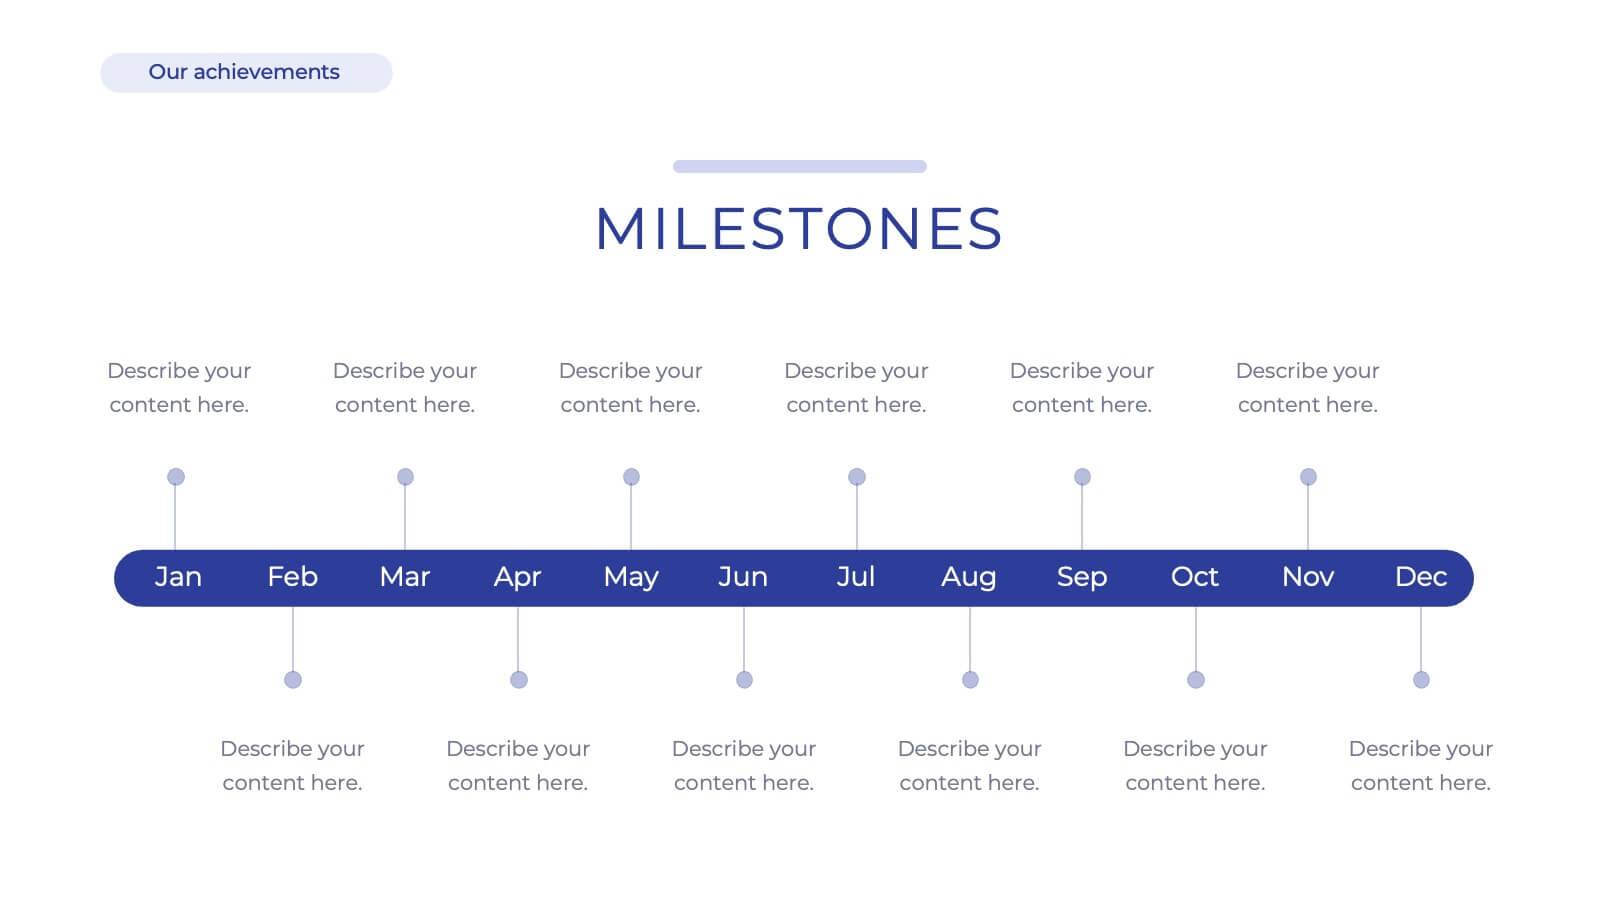
Iconic Startup Business Plan Presentation
Introducing our comprehensive corporate business plan template! Perfect for showcasing your company’s mission, vision, and services. Highlight your market strategy, competitive landscape, and growth plan in a professional design. Ideal for executives and entrepreneurs. Compatible with PowerPoint, Keynote, and Google Slides.


3 diapositivas
Service and Product Benefits Overview Presentation
Clearly contrast key features with the Service and Product Benefits Overview Presentation. This modern split-layout design helps you showcase differences between service offerings and tangible products in a clean, side-by-side format. Use it to highlight value propositions, customer benefits, or decision-making factors. Fully editable and compatible with PowerPoint, Keynote, and Google Slides.


2 diapositivas
Opening Company Profile Introduction Presentation
Make a bold first impression with the Opening Company Profile Introduction Presentation — a sleek, modern design perfect for business overviews, team intros, or brand missions. Featuring clean typography and a purple accent shape that adds personality without distraction, this layout is ideal for concise, professional messaging. Fully editable and compatible with Canva, PowerPoint, Google Slides, and Keynote.


7 diapositivas
Interpersonal Communication Infographic
Interpersonal communication is the process by which people exchange information, feelings, and meaning through verbal and non-verbal messages in various contexts. This vibrant infographic template is a visual exploration of the art of effective communication, revealing the key to building strong relationships both personally and professionally. Compatible with Powerpoint, Keynote, and Google Slides. Immerse yourself in the world of communication, where understanding and connection are paramount. This template will help you explore how technology has transformed communication, showcasing its advantages in the modern world.


6 diapositivas
Project Goals and Deliverables Presentation
Clearly define and present your project objectives with the Project Goals and Deliverables Presentation. This template offers a structured layout to highlight key goals, milestones, and deliverables, making it perfect for project managers, teams, and stakeholders. Fully customizable and compatible with PowerPoint, Keynote, and Google Slides.


7 diapositivas
Oceania Political Map Infographic
This Oceania Political Map infographic template is a multifaceted tool designed for detailed geographic presentations. Fully compatible with PowerPoint, Google Slides, and Keynote, it offers various map designs and data visualization options like pie charts, bar graphs, and icons. This template allows presenters to highlight key statistics such as population distribution, economic data, or social demographics of the region. It features a subtle color palette that differentiates each section without overwhelming the viewer, making it ideal for educators, policy makers, and business professionals who need to present complex data related to Oceania in a visually engaging format.


7 diapositivas
Creative Tables Of Content Infographic
A creative table of contents is a visually appealing and innovative way of presenting the structure and contents of a document, report, book, or any written work. Our infographic template is an aesthetically pleasing and insightful map to your content landscape. This infographic is not just a guide; it's a visually engaging journey through your ideas and topics, promising a delightful and organized user experience. Fully customizable and compatible with Powerpoint, Keynote, and Google Slides. This creative table of contents uses design elements, colors, typography, and graphics to make it engaging and eye-catching.