


Características


¿Tienes alguna pregunta?
Recomendar


5 diapositivas
Competitive Strategy with Five Forces Presentation
Effectively visualize Porter’s Five Forces with this dynamic funnel-style infographic. Ideal for breaking down buyer power, supplier power, competitive rivalry, threats of substitution, and new entrants in a clear, engaging format. Perfect for consultants, strategists, and educators. Fully editable in PowerPoint, Keynote, and Google Slides.


26 diapositivas
Kasra Presentation Template
Fitness is an important part of good health. It improves your quality of life and may keep you from getting sick by helping to strengthen your immune system, prevent heart disease and reduce the risk of diabetes and much more. The Kasra template will help you deliver your message with an impact. Whether you're selling your product, promoting an event, or creating a landing page, this template features the necessary components to capture your audience's attention. This provides you with a powerful platform to engage others, illustrate key messages and demonstrate deep insight into an issue.


5 diapositivas
Product Roadmap Presentation
The "Product Roadmap Infographic" template is ideal for presenting the strategic vision and progressive steps for product development. This template outlines the roadmap through a creative and visually engaging route-style layout, designed to highlight key milestones and stages in the product lifecycle, from conception to launch. Each point on the roadmap is clearly marked for specific goals or achievements, encouraging clarity and understanding among stakeholders about the direction and progress of the product. This layout is perfect for product managers and teams to communicate timelines, prioritize tasks, and align goals during presentations in corporate settings.


6 diapositivas
Demographic Transition Infographics
Embark on a journey through the fascinating concept of demographic transition! This infographic opens the door to understanding how societies evolve over time in terms of population growth and age structure. From the early stages of high birth and death rates to the advanced stages of low birth and death rates, we unveil the intricate phases of demographic transition that shape our world. Discover the profound impacts of demographic transition on societies and economies. Learn how changes in population structure affect labor markets, healthcare systems, and social welfare. Understand the opportunities for economic growth and development that can arise from a favorable demographic transition. With this engaging infographic, compatible with PowerPoint, Keynote, and Google Slides, sharing your understanding of demographic transition has never been more accessible. Empower yourself with the knowledge to comprehend and discuss this vital aspect of our world's development. Dive into the complexities of demographic transition and embark on a journey of exploration and enlightenment.


21 diapositivas
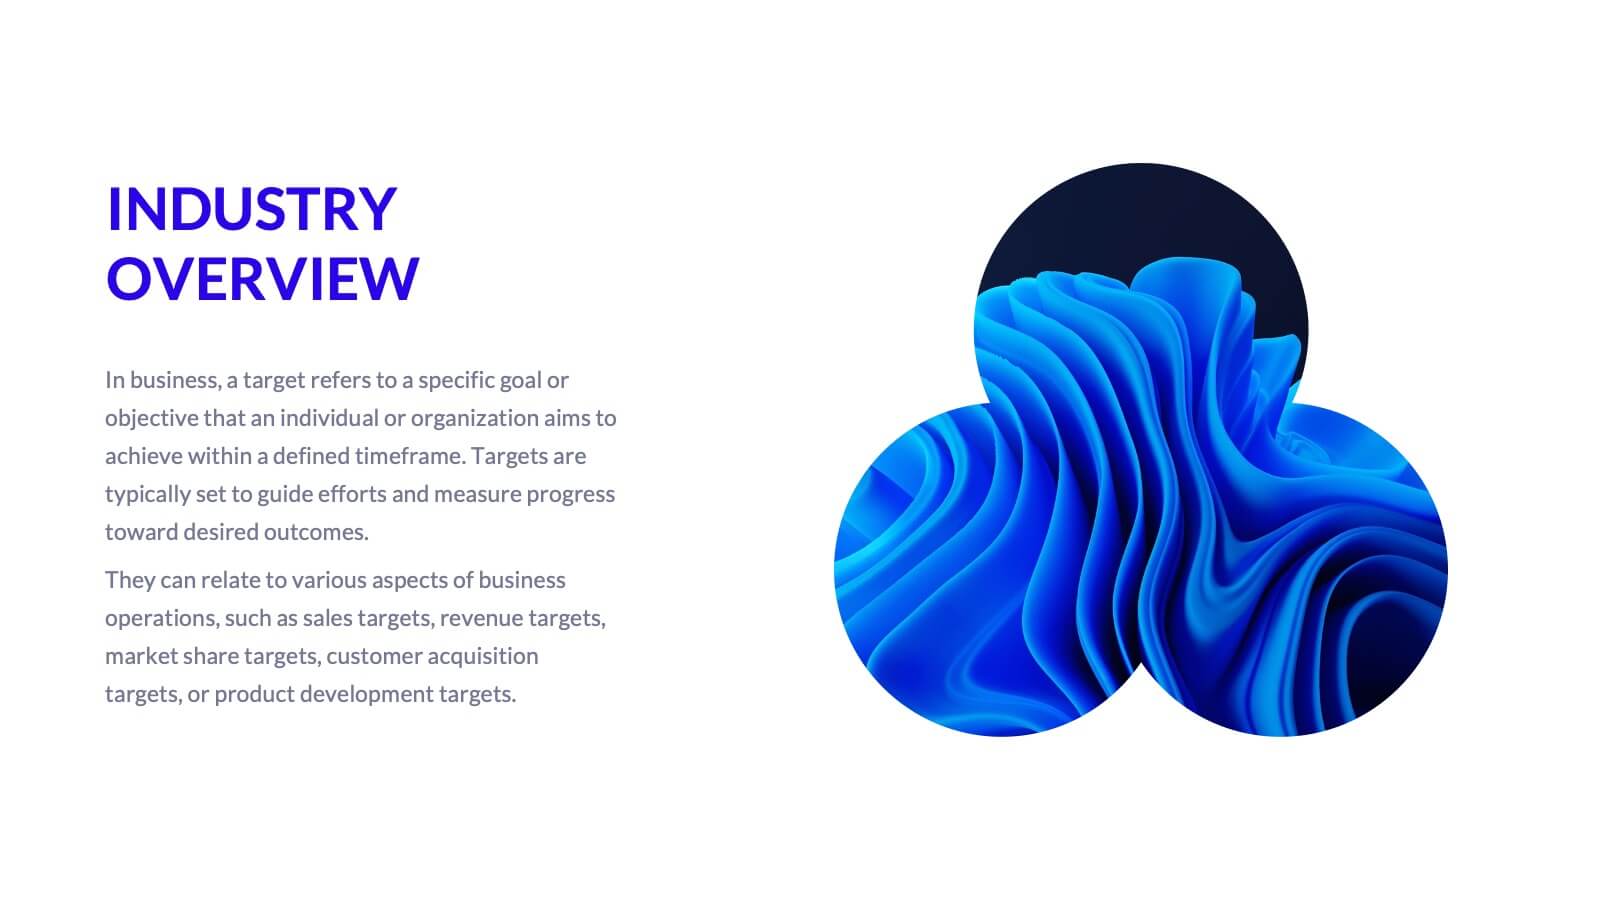
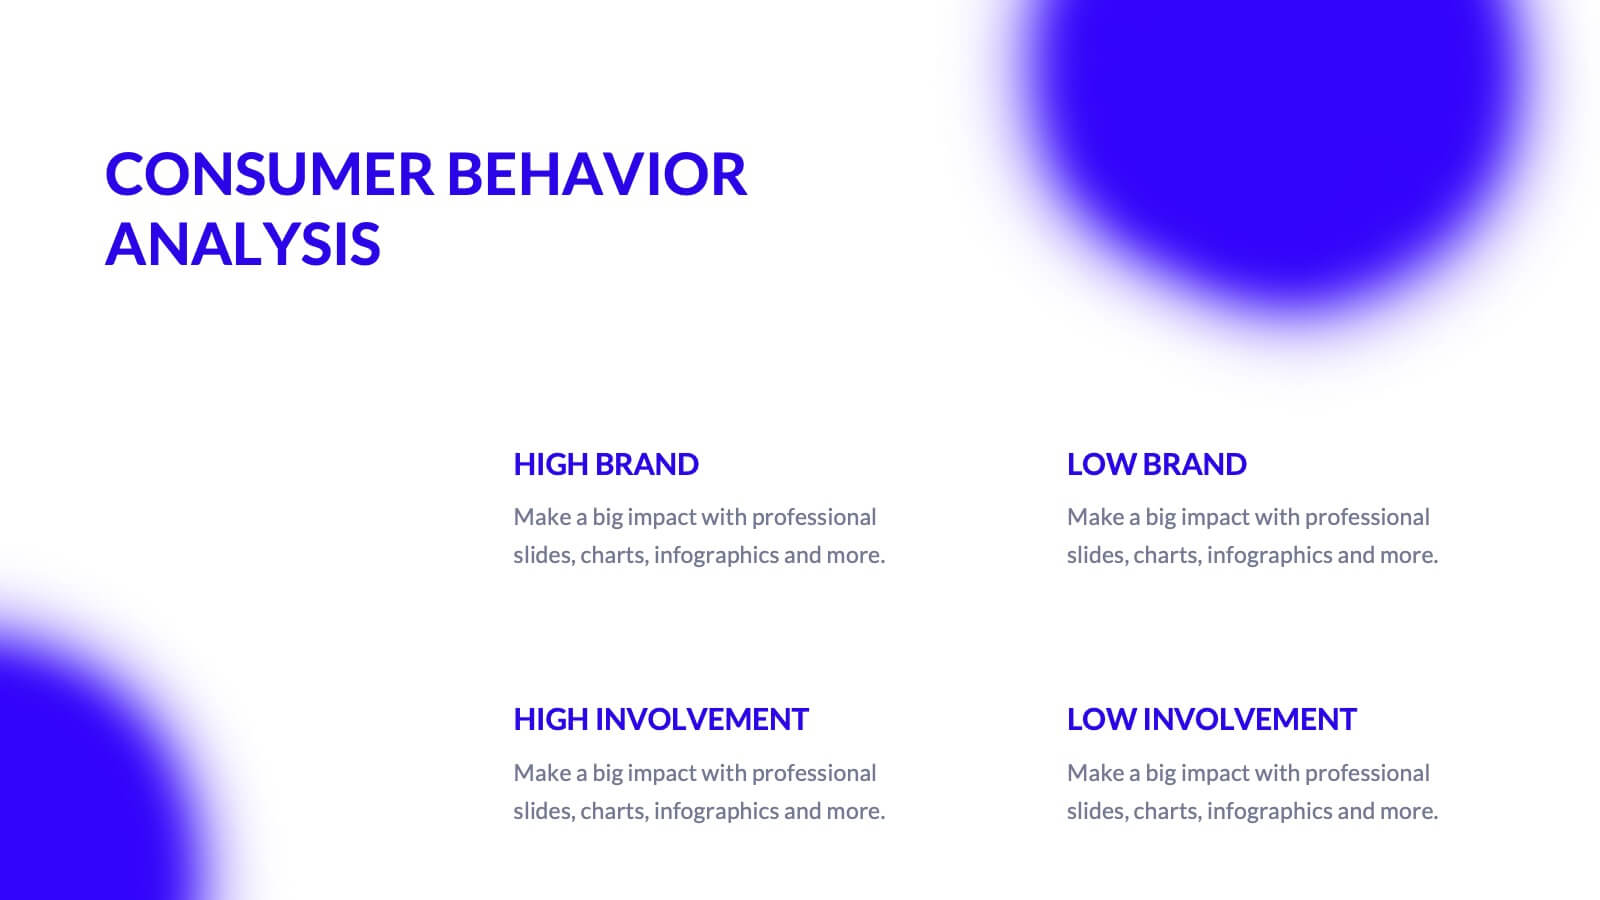
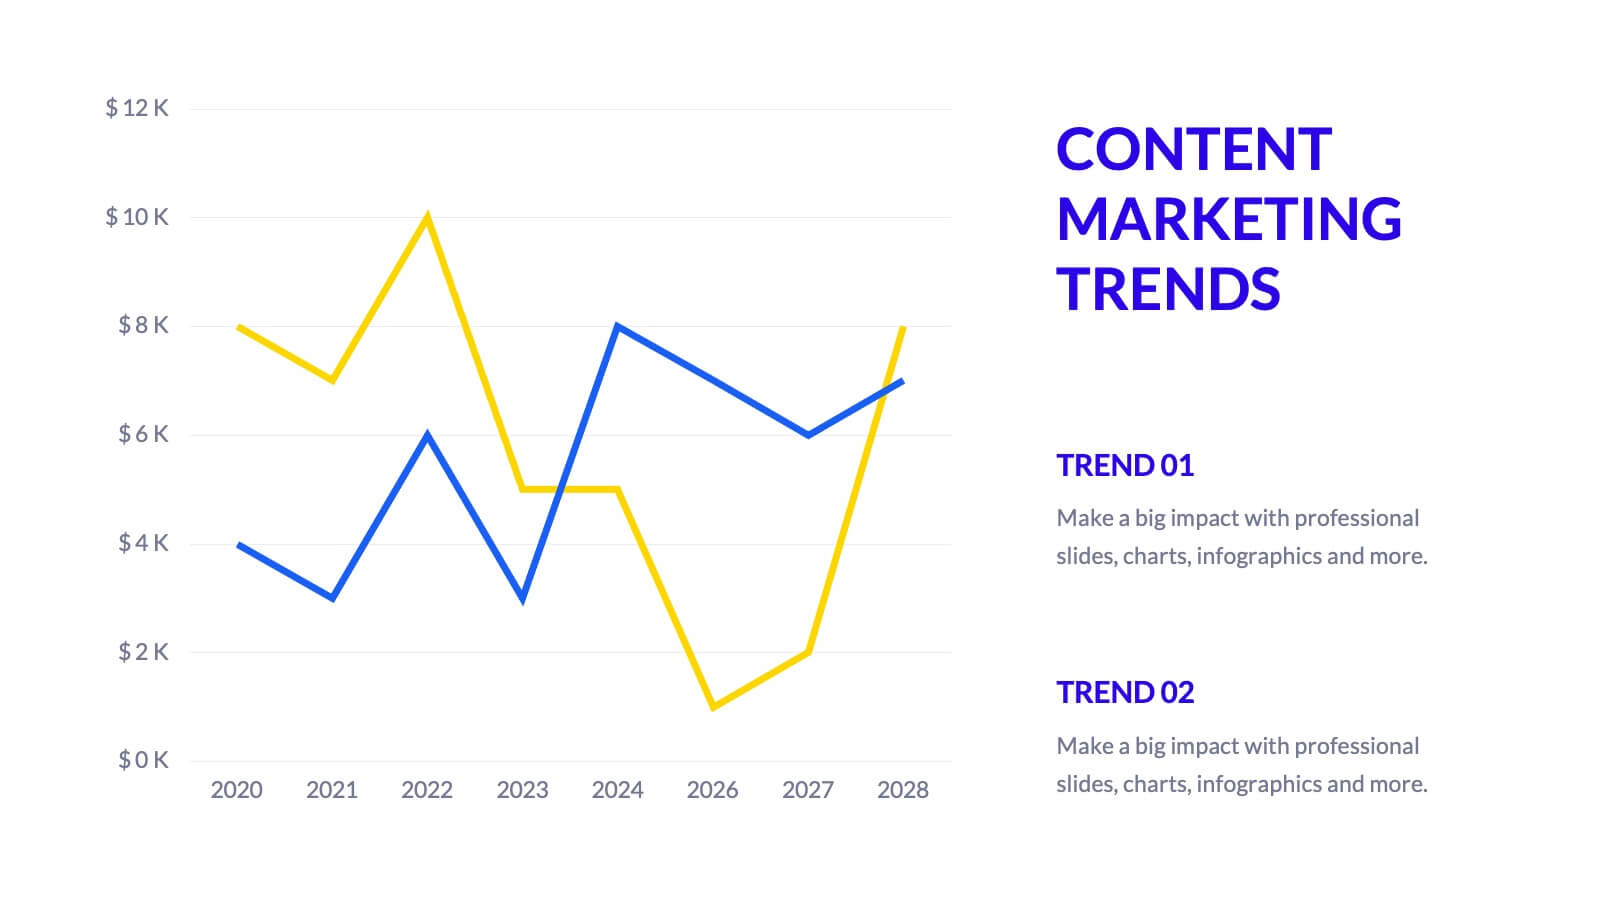
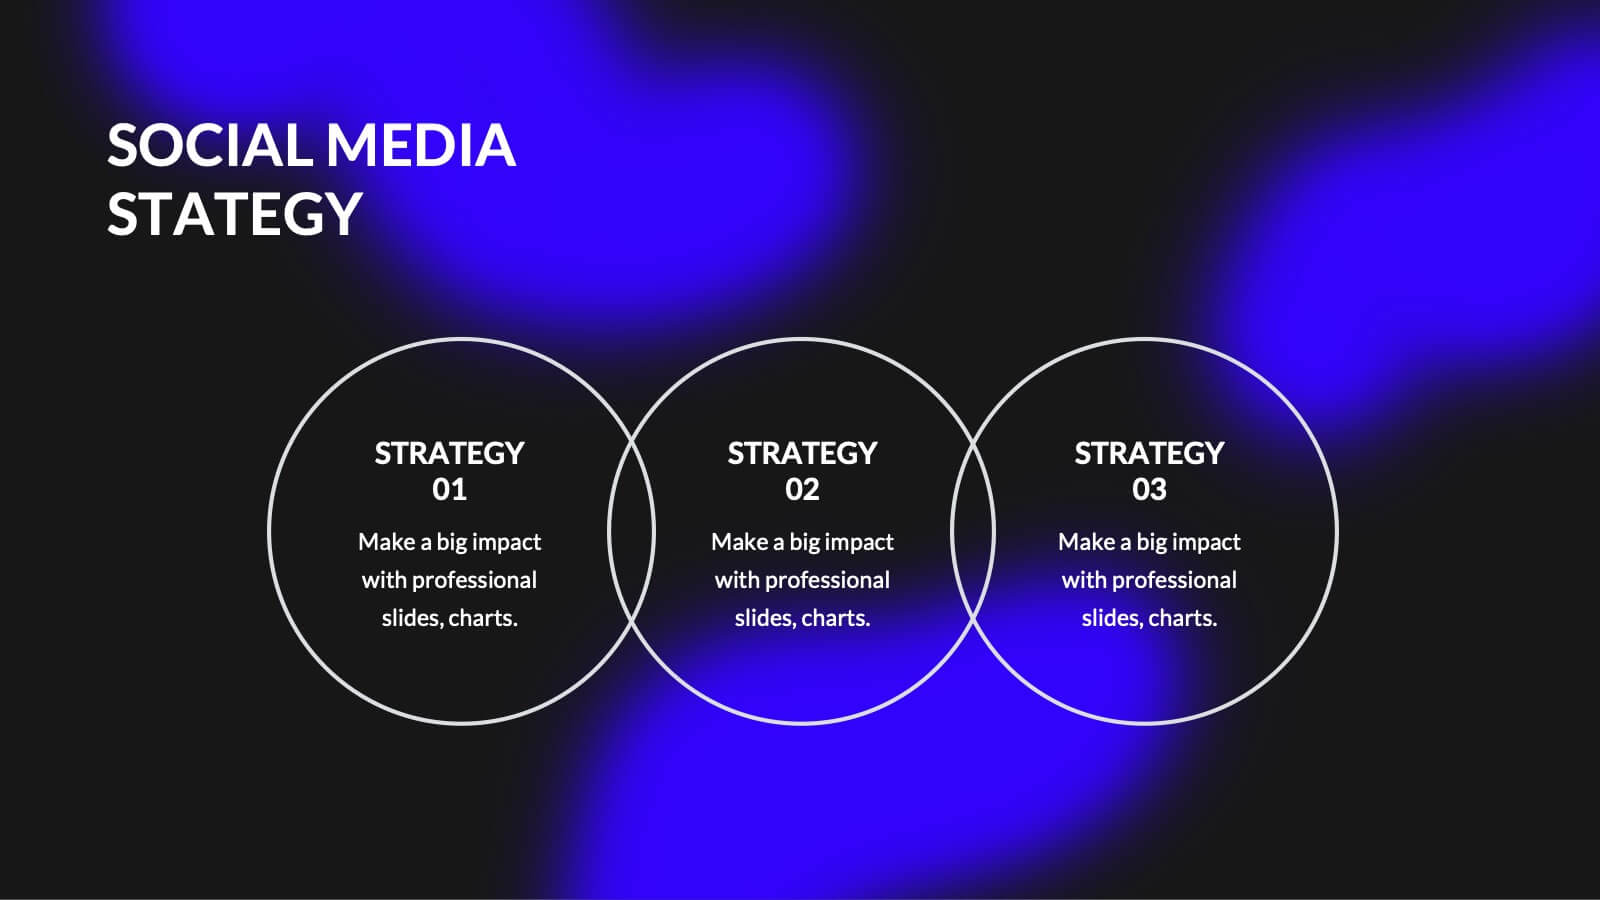
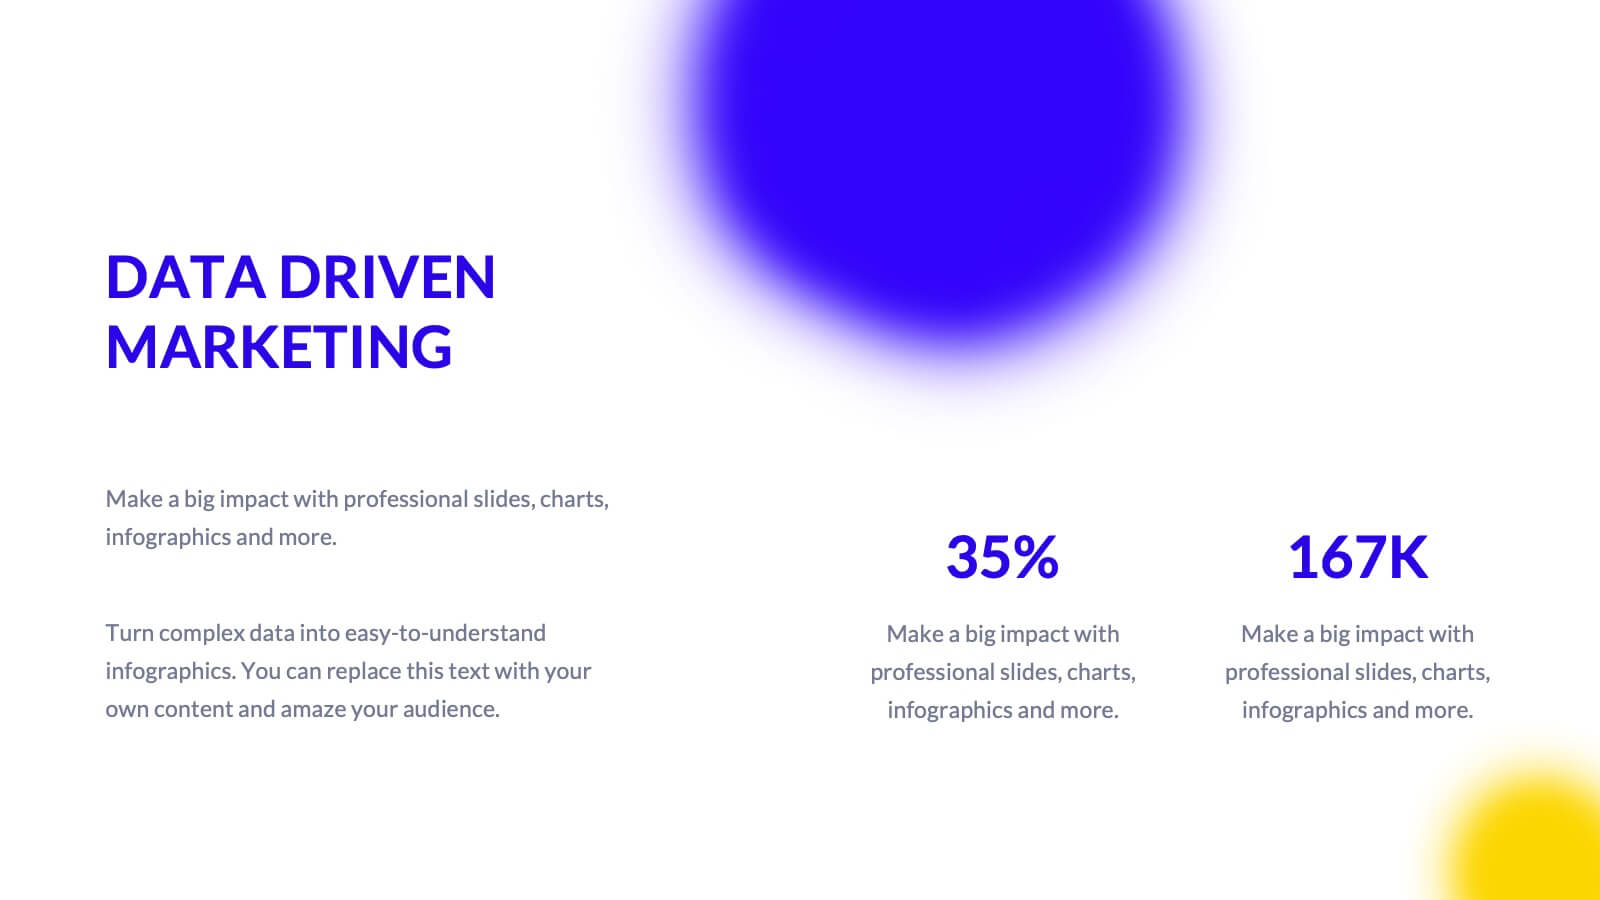
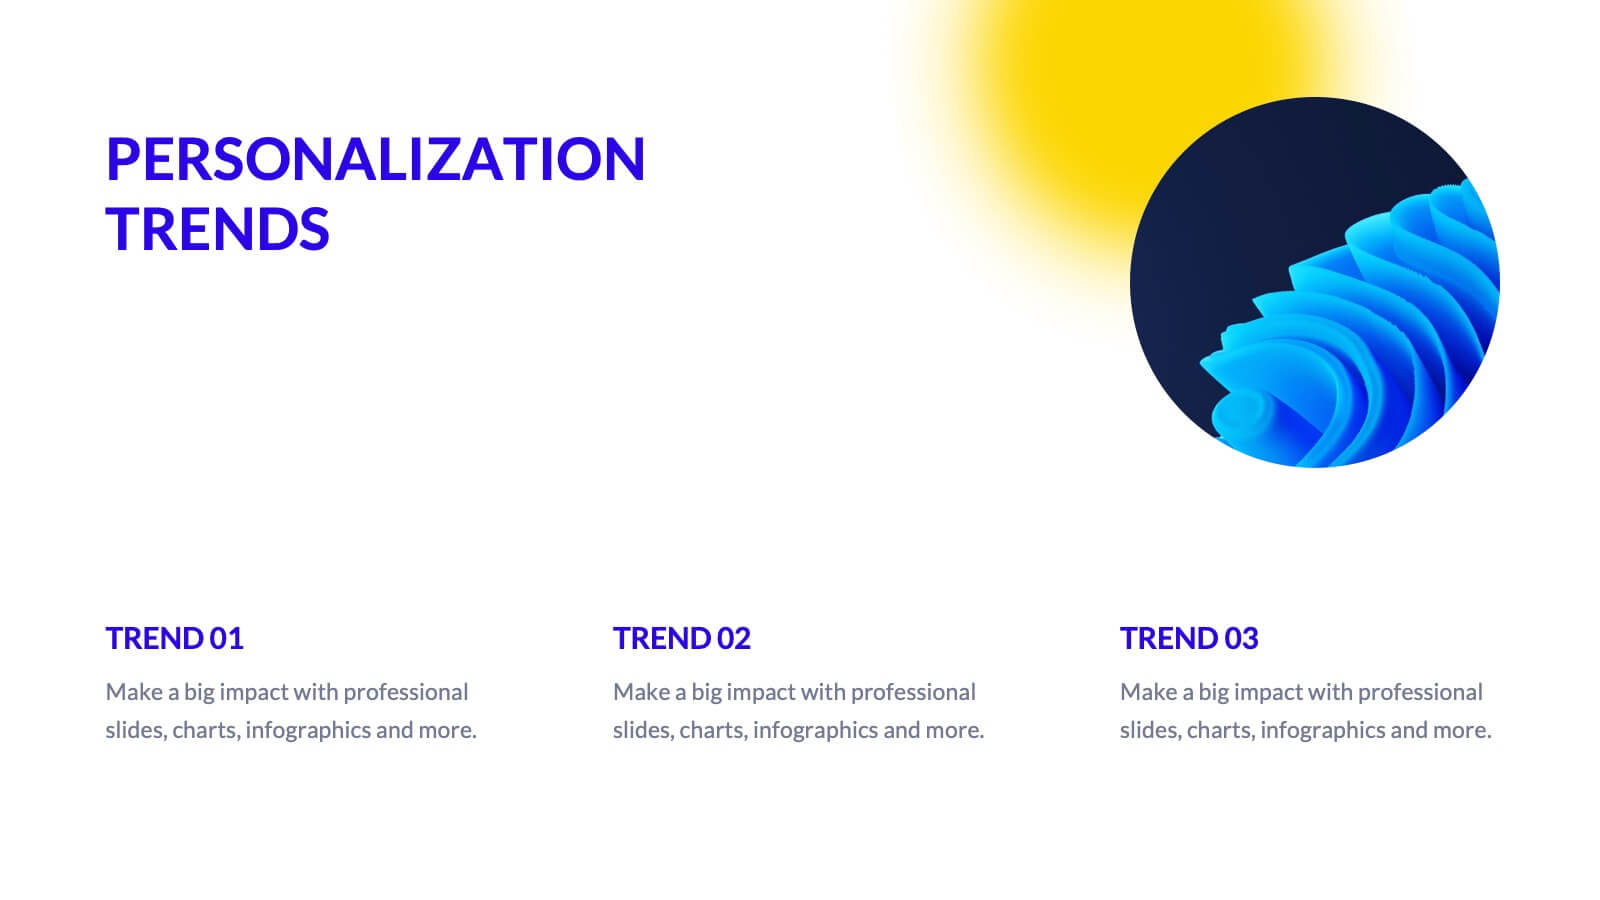
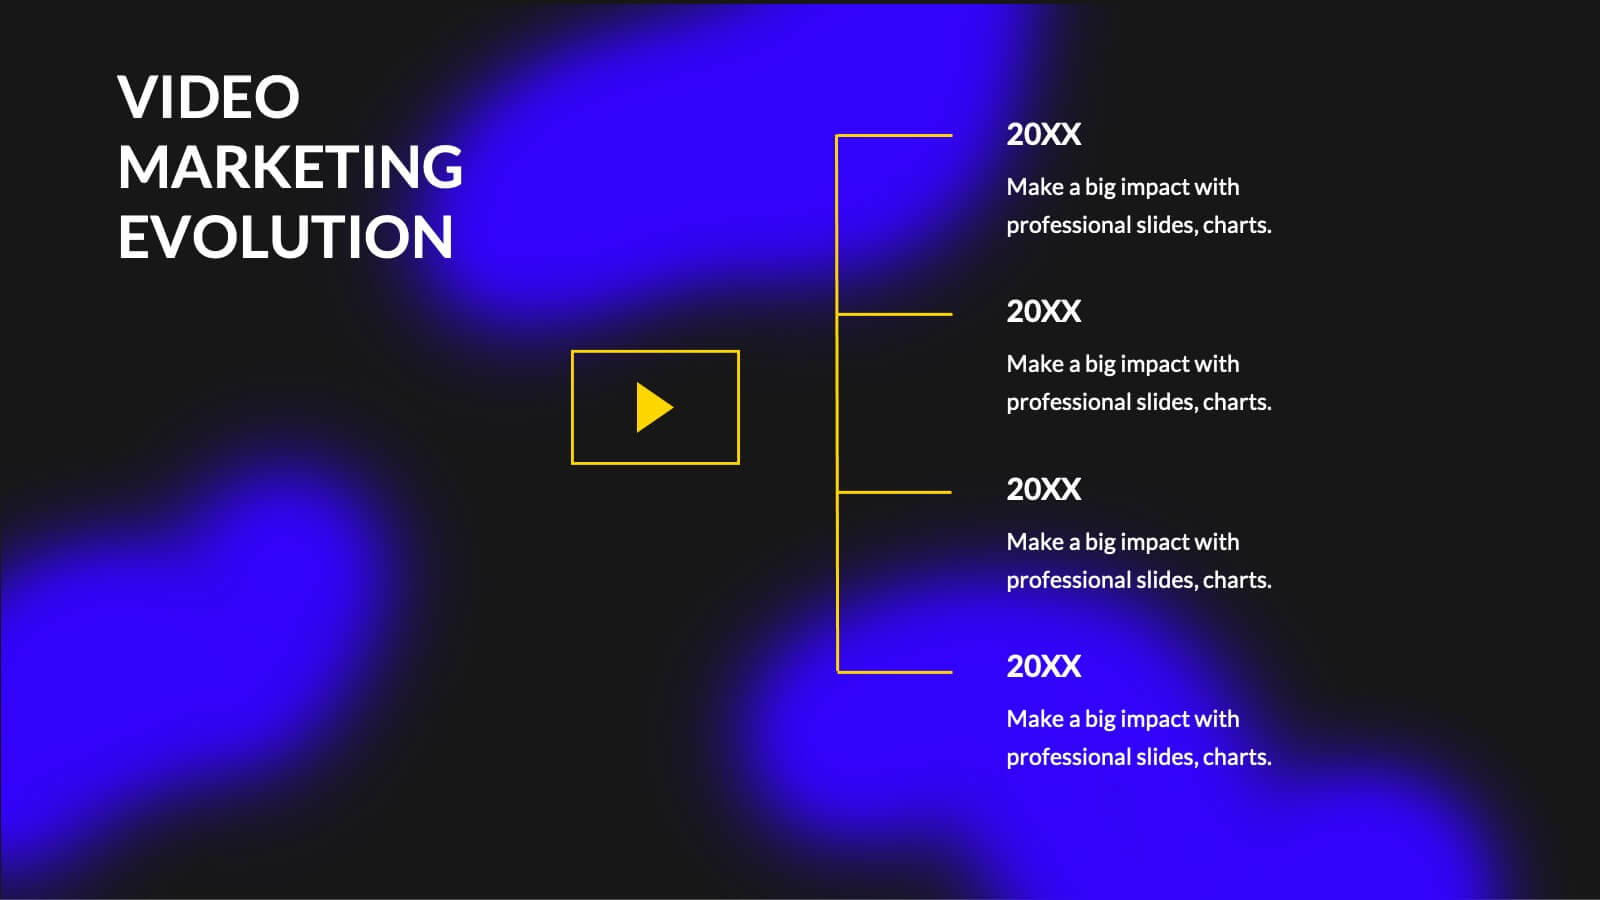
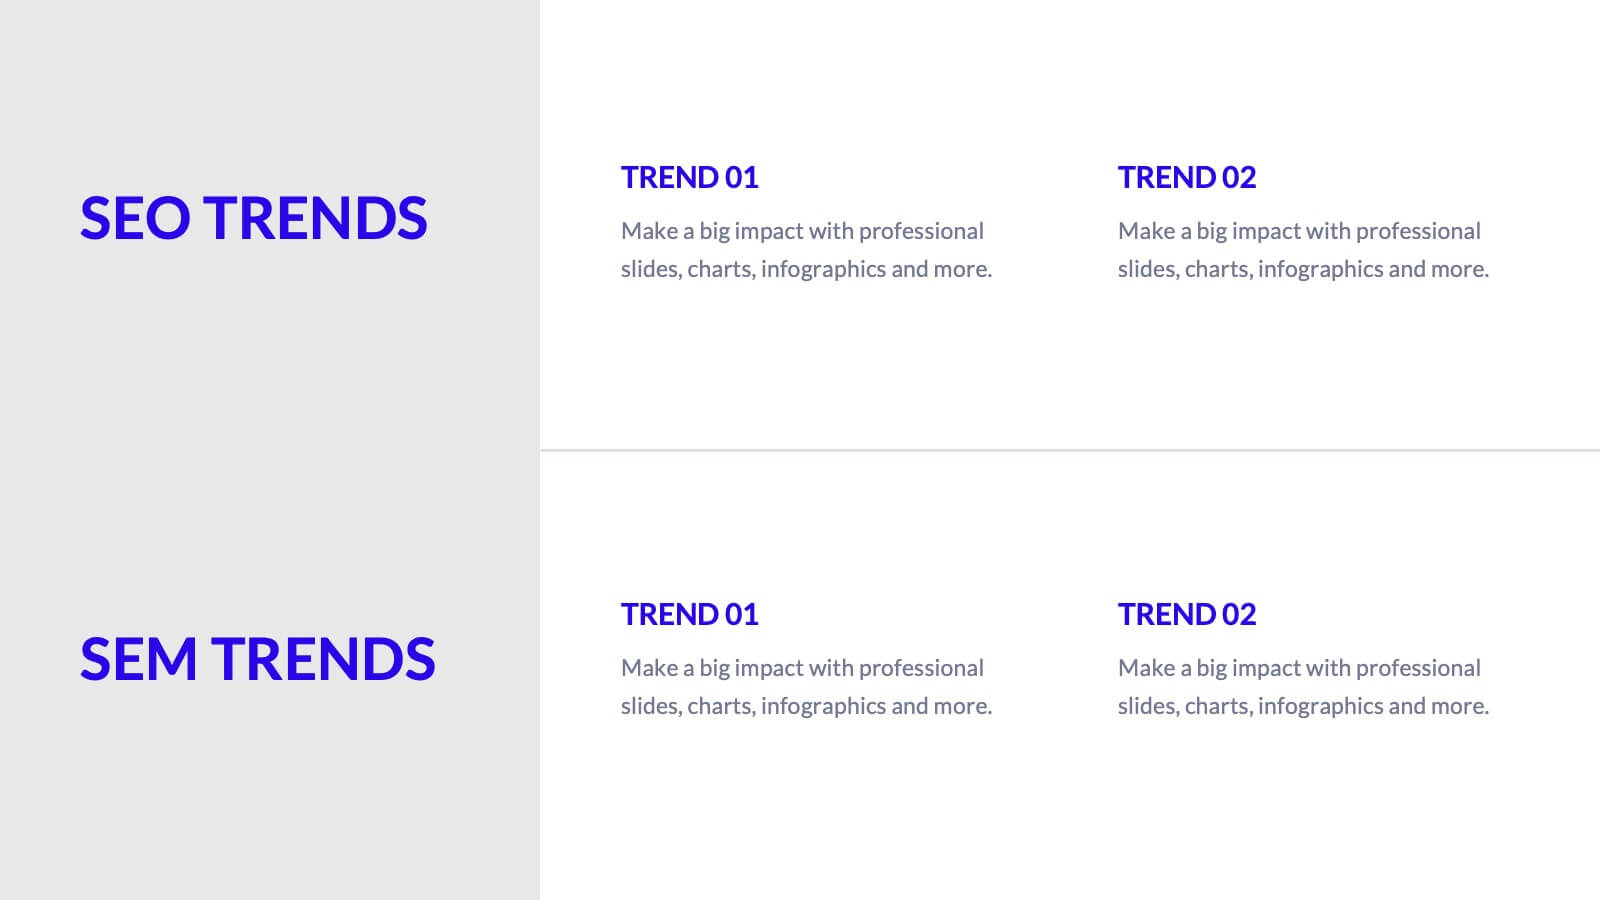
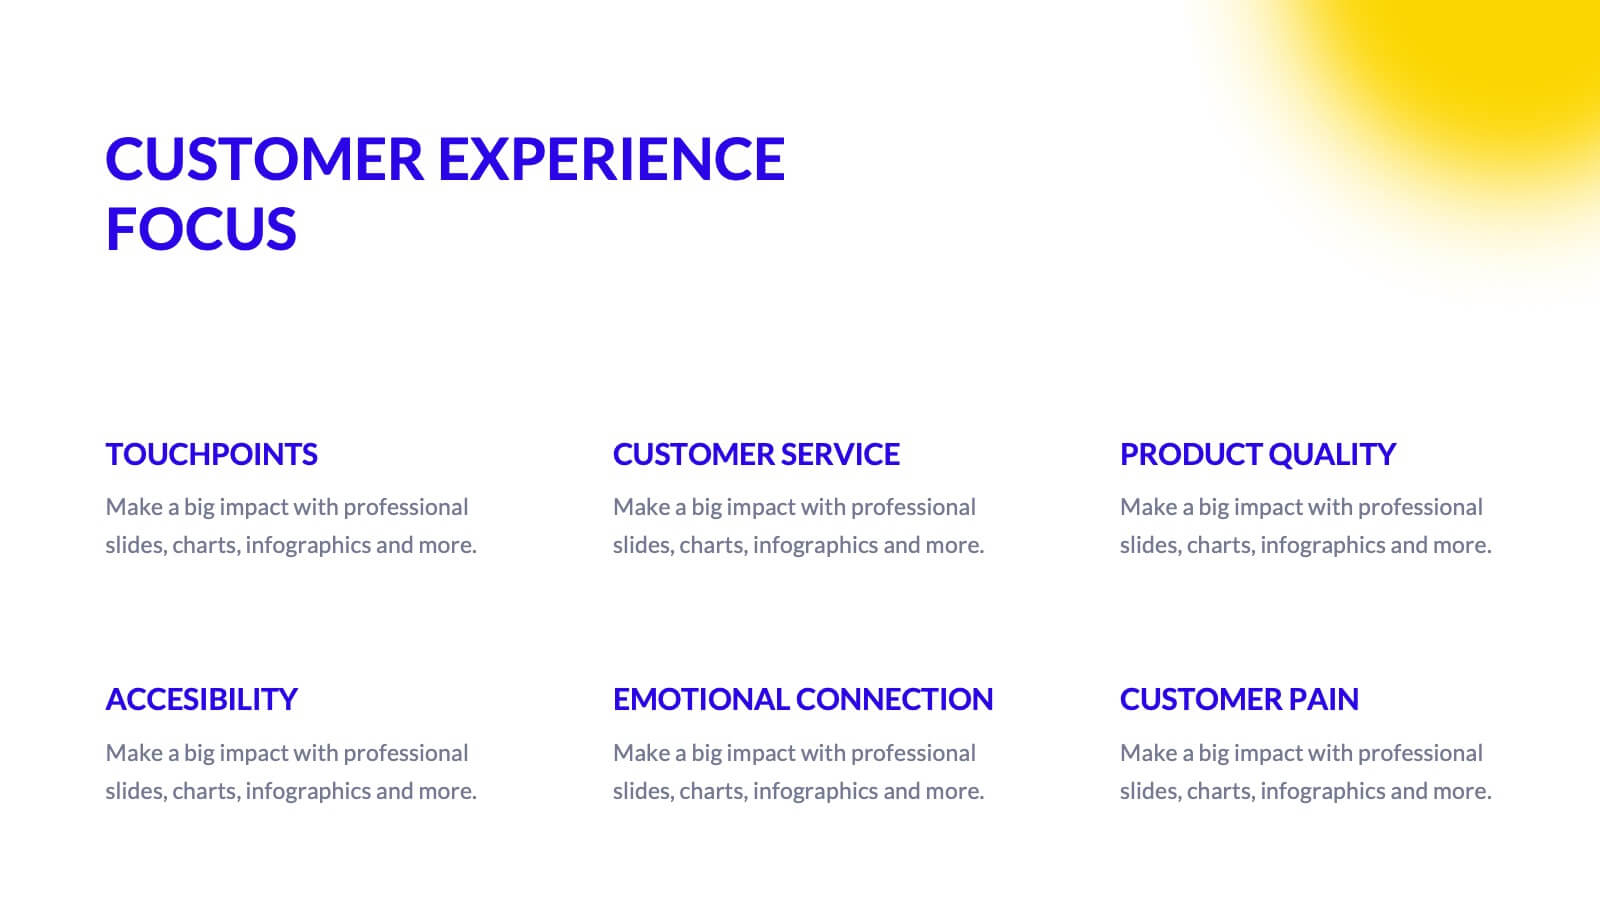
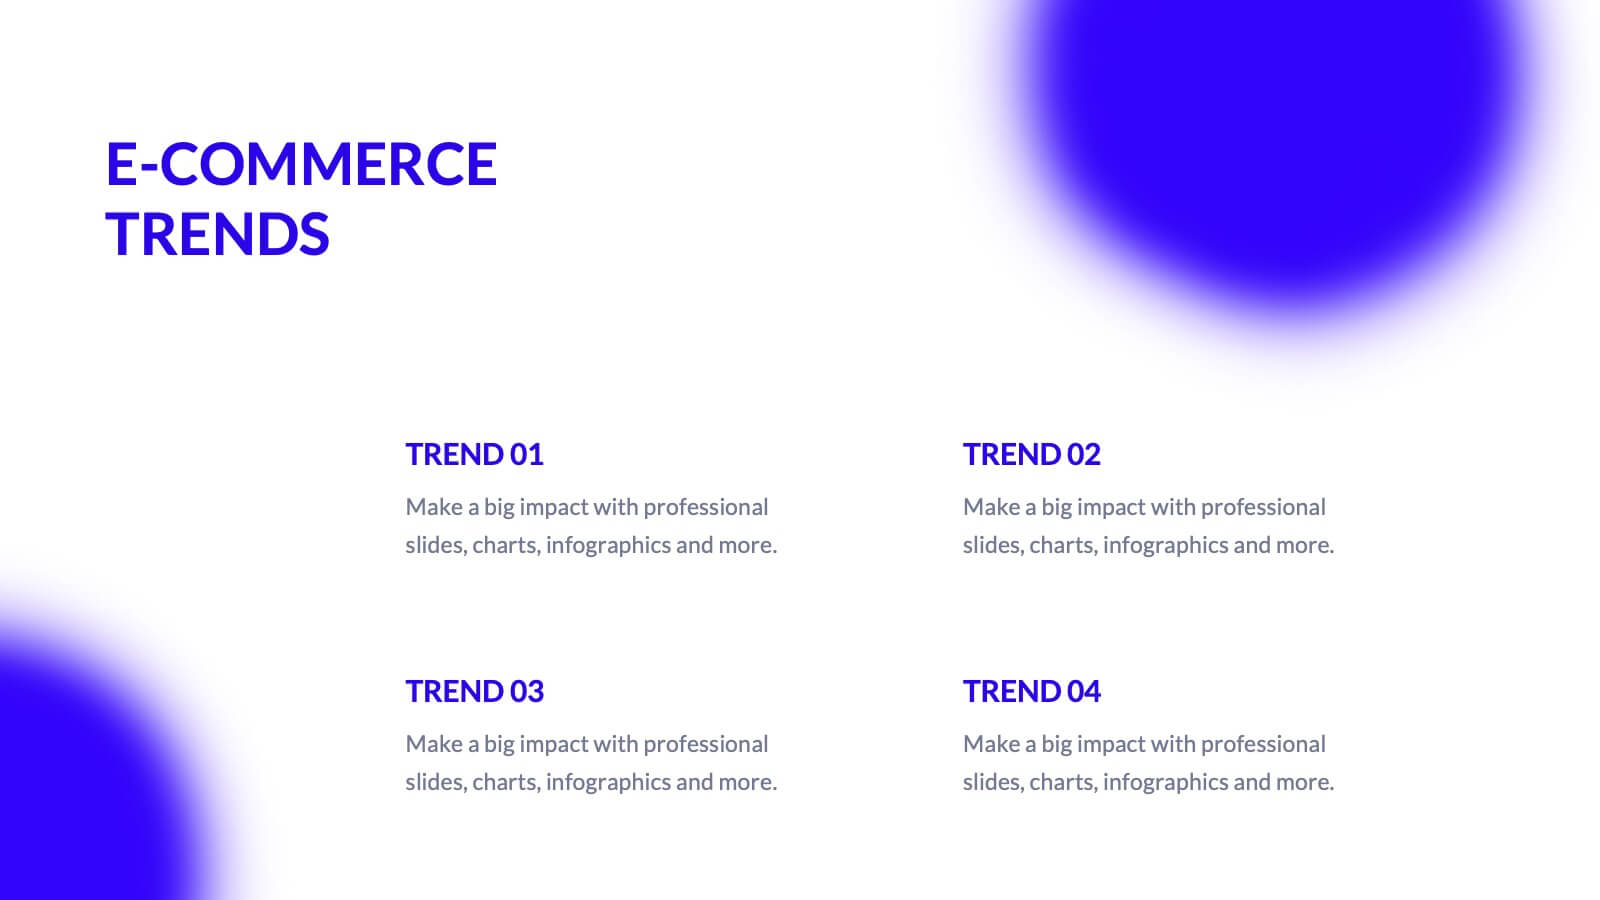
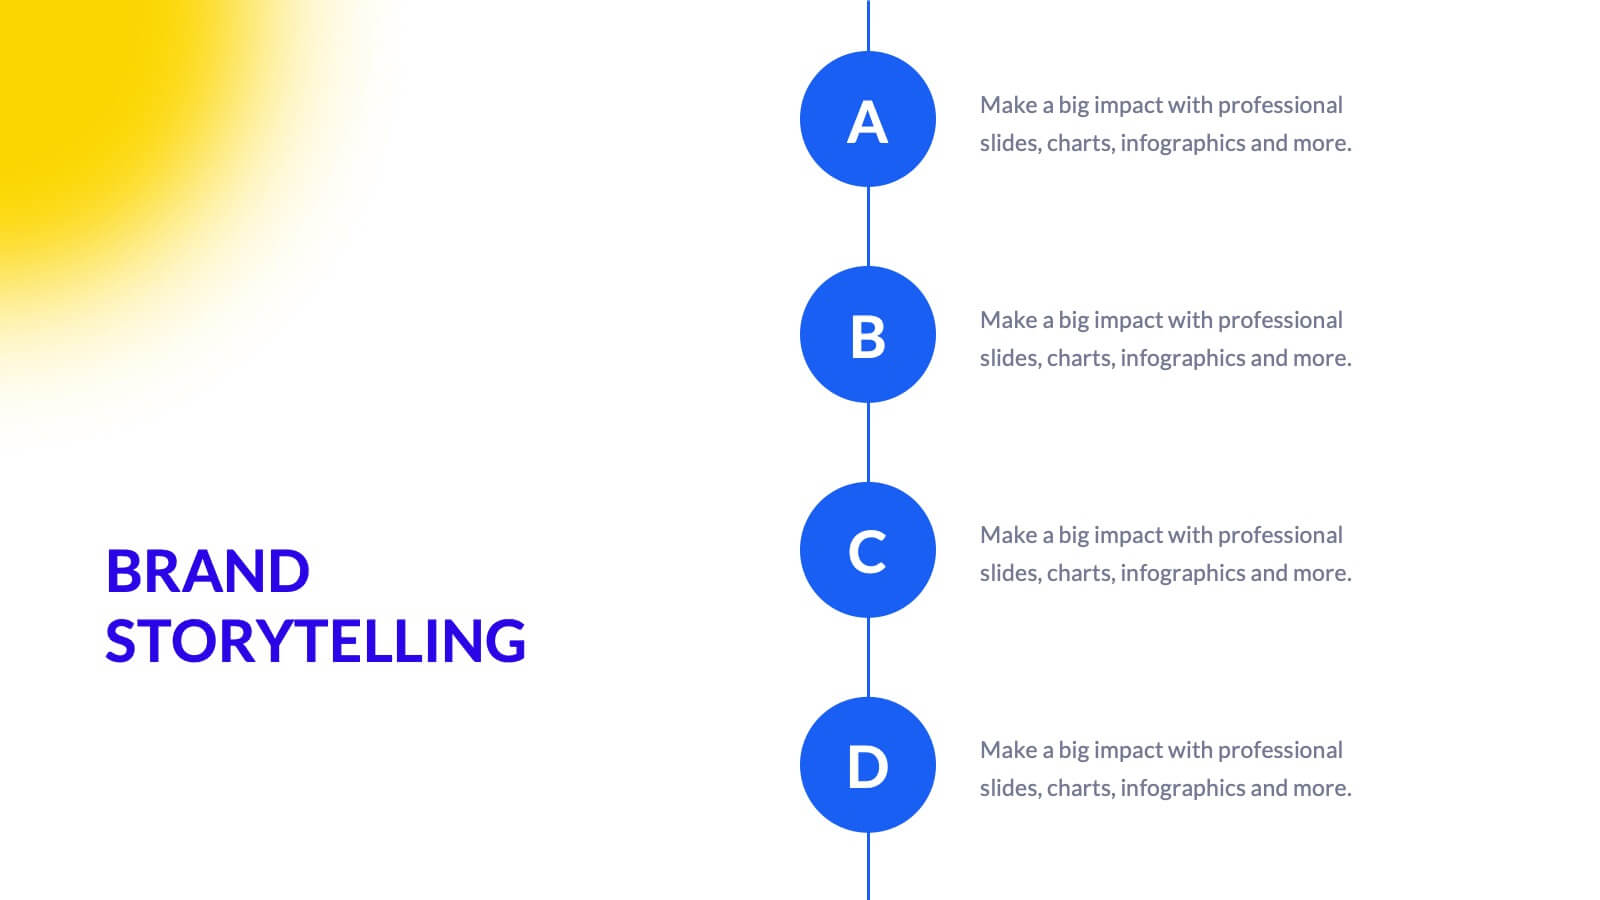
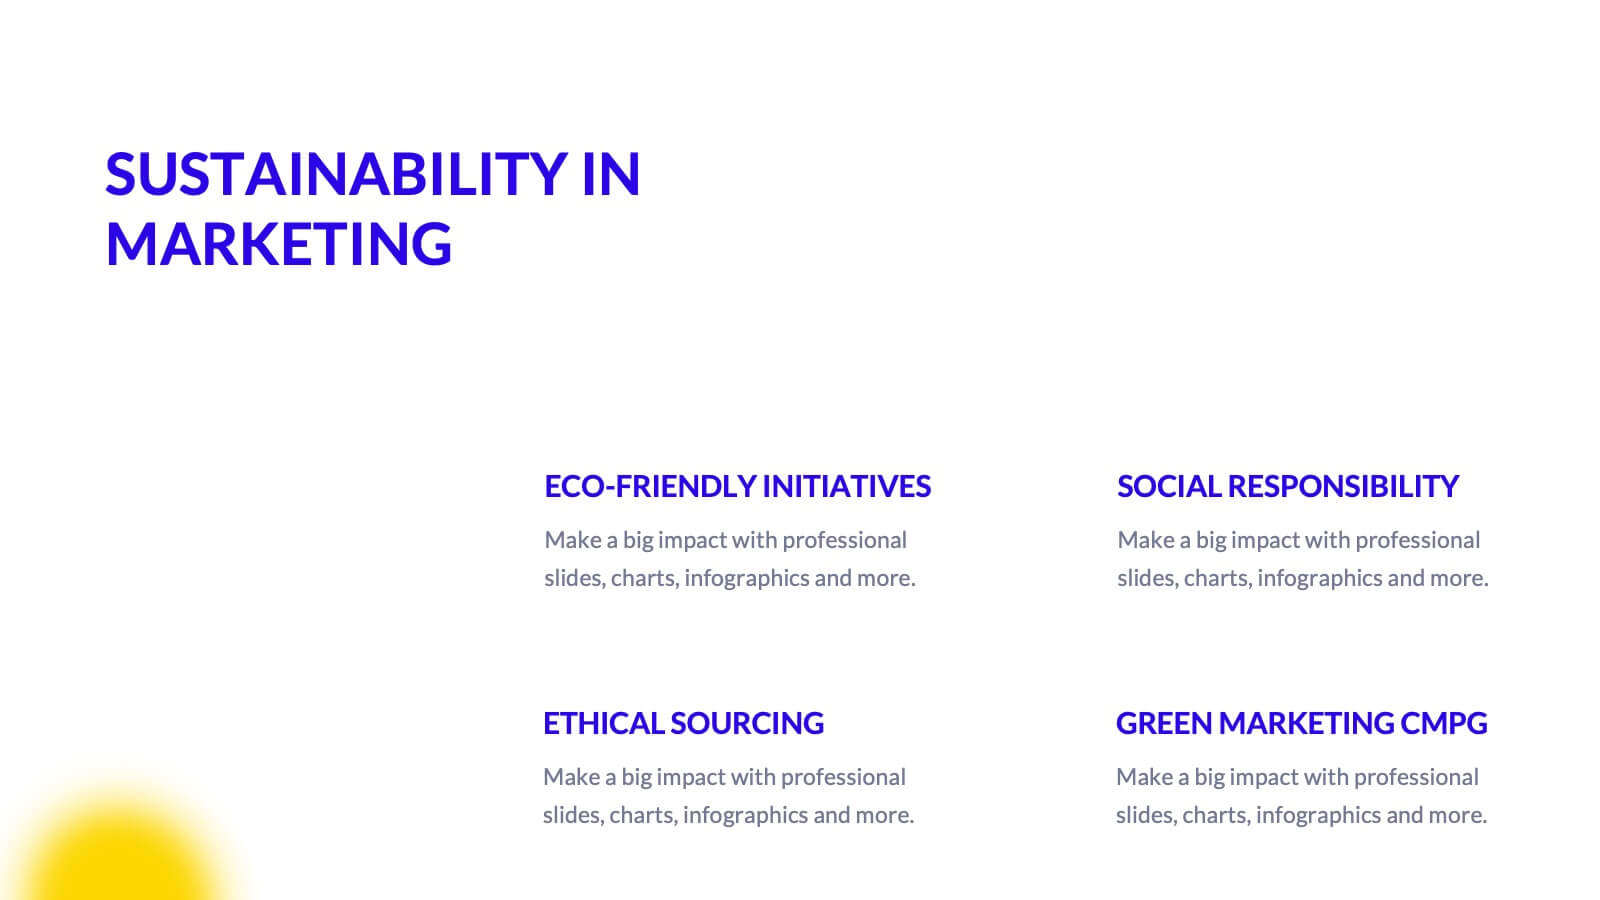
Catalyst Digital Marketing Strategy Plan Presentation
Supercharge your digital marketing strategy with this vibrant, modern presentation template. Perfect for detailing industry overviews, consumer behavior analysis, and social media strategies, it features a dynamic design that captures attention. Highlight key trends like SEO, influencer marketing, and e-commerce to engage your audience. Compatible with PowerPoint, Keynote, and Google Slides, it ensures seamless presentations on any platform.


7 diapositivas
Remote Work Guidelines and Setup Presentation
Bring clarity to your remote work setup with this sleek visual guide—designed to communicate processes, tools, and best practices in one easy-to-follow layout. Whether you're onboarding a team or streamlining operations, this slide helps break it all down step by step. Fully compatible with PowerPoint, Keynote, and Google Slides.


6 diapositivas
Demographic Data Analysis
Visualize key population insights with this Demographic Data Analysis slide, designed as a segmented pie chart with icon-based representation. Perfect for showcasing audience breakdowns, customer profiles, or survey results across five demographic categories. Fully editable in PowerPoint, Keynote, and Google Slides.


3 diapositivas
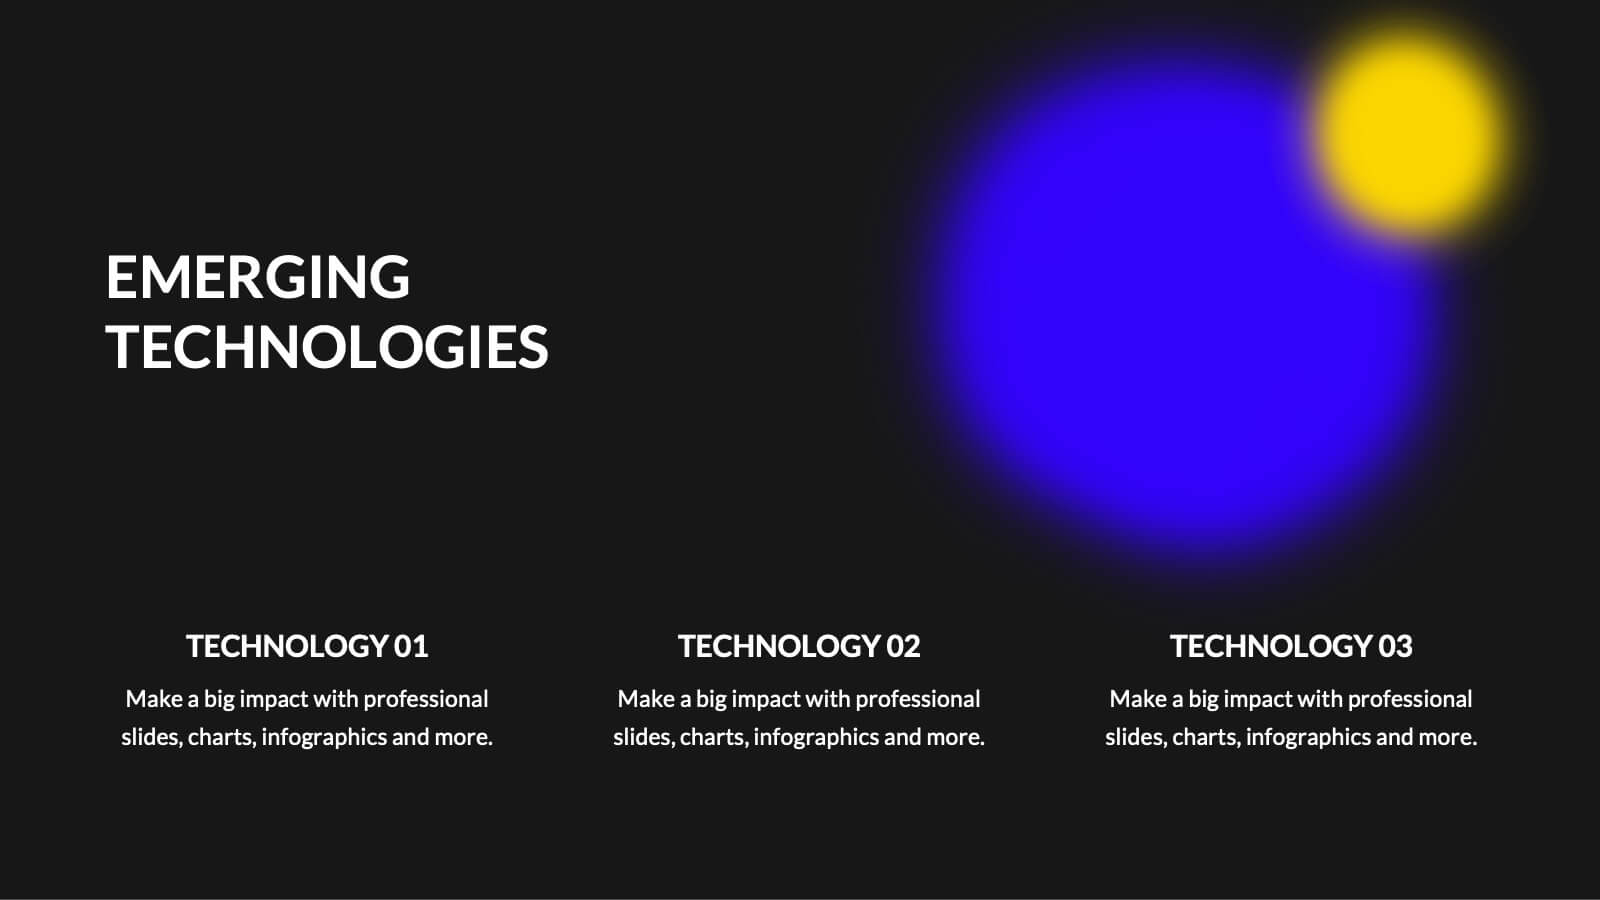
Emerging Tech Innovations Deck Presentation
Present futuristic ideas with this Emerging Tech Innovations Deck. Perfect for tech leaders, startups, and educators, this slide set features modern visuals with robot illustrations and sleek layouts. Easily editable in PowerPoint, Keynote, or Google Slides. Ideal for showcasing cloud computing, automation, or AI-driven strategies in a compelling format.


26 diapositivas
Jacob Free Powerpoint Template
Are you looking for a classy designer template? Then the Jacob is for you. The Jacob template is a chic, beautiful, modern and easy to use template. It's suitable for all types of businesses, from small business accounts, to large corporate companies and even personal use. It has a very hip aesthetic, with pink tones giving it a very fresh appealing look. The pictures and charts are easy to understand as well as easy to read without too much confusion on reading informative content. Easy to use high quality charts and graphs makes this template best for all types of businesses.


21 diapositivas
Drowsira Marketing Research Report Presentation
Present your market insights effectively with this professional and modern template. Covering key sections such as market presence, target audience, competitive landscape, and financial highlights, it offers a structured layout for impactful storytelling. Fully customizable and available for PowerPoint, Keynote, and Google Slides.


5 diapositivas
Key Business Benefits and Value
Present your organization’s core strengths using this 4-part value diagram. Ideal for outlining benefits, service pillars, or strategic goals, the slide features directional arrows with matching icons for clarity and structure. Easy to customize in PowerPoint, Keynote, and Google Slides—adjust text, icons, and colors to align with your business branding.


4 diapositivas
Cybersecurity and Data Protection Presentation
Safeguard your digital assets with this Cybersecurity and Data Protection template. Designed for IT security professionals, compliance officers, and business leaders, this slide illustrates key security measures, risk mitigation strategies, and data protection protocols. Featuring a modern cloud security theme, it effectively conveys network safety, encryption, and compliance frameworks. Fully editable and compatible with PowerPoint, Keynote, and Google Slides for seamless customization.


6 diapositivas
Goal Setting and Strategic Planning Presentation
Present objectives and action plans with the Goal Setting and Strategic Planning template. Featuring a modern segmented design, this layout is perfect for outlining priorities, initiatives, and milestones. Fully editable in Canva, PowerPoint, and Google Slides, allowing you to adapt colors, icons, and text to match your business vision.


4 diapositivas
Strategic Risk Assessment and Control Presentation
Highlight layered risk priorities with the Strategic Risk Assessment and Control Presentation. This visual template uses a 3D concentric model (D to A) to illustrate escalating risk levels or control measures. Ideal for risk managers and compliance teams. Fully editable in PowerPoint, Google Slides, and Canva for seamless customization.


8 diapositivas
Sustainable Operation & Ethical Practice Presentation
Illustrate your ethical initiatives and operational sustainability with this water drop flow diagram. Ideal for outlining four key actions or principles, it features a faucet visual and icon-based content drops. Fully customizable in PowerPoint, Keynote, and Google Slides—perfect for ESG reporting, CSR updates, and eco-conscious business presentations.


6 diapositivas
Biology Tree Diagram Infographic
Tree diagrams in biology are graphical representations that show the hierarchical relationships and evolutionary history of different organisms, species, or biological traits. This infographic template is designed to simplify complex biological information and show the interconnectedness between different biological topics or classifications. This infographic is a visual representation of various biological concepts and relationships in a hierarchical tree structure. This template color codes the different branches to distinguishing between the different categories and make the infographic easier to navigate.


5 diapositivas
Human Resource Functions Infographics
Illuminate the complexities of people management with our human resource functions infographics template. Cast in the professional yet warm palette of black, orange, pink, and red, this template is an essential tool for HR professionals, corporate trainers, and business leaders. It elegantly dissects various HR realms with its sleek graphics, intuitive icons, and dedicated image placeholders, making it perfect for showcasing recruitment processes, employee engagement strategies, or organizational culture principles. Its creative, vertical style is designed to hold the attention and fuel the imagination, turning any HR presentation into a compelling narrative.