


Características


¿Tienes alguna pregunta?
Recomendar


4 diapositivas
Remote Learning Classroom Engagement Presentation
Make virtual classrooms more engaging with this clear, conversation-inspired visual. Designed for educators, trainers, and e-learning professionals, this infographic helps highlight interaction points, participation levels, or communication flows in remote learning. Easy to customize and fully compatible with PowerPoint, Keynote, and Google Slides.


6 diapositivas
Funding and Return on Investment Overview Presentation
Showcase your funding strategy and ROI journey with this growth-themed infographic. The plant-inspired design visually represents financial progress across six stages, making it perfect for startups, business proposals, or investor updates. Fully editable in PowerPoint, Google Slides, and Keynote for seamless customization and a polished, professional presentation experience.


6 diapositivas
Progressive Work From Home Infographics
The "Progressive Work From Home" infographic template is an essential tool for today's evolving workplace. Compatible with PowerPoint, Keynote, and Google Slides, this template is designed for managers, team leaders, and organizations embracing the remote work model. This innovative template features essential elements of remote working, including tools for virtual collaboration, productivity metrics, and strategies for maintaining team cohesion. It's crafted to help you effectively communicate the benefits and best practices of remote work, making it invaluable for presentations aimed at optimizing work-from-home policies and procedures. The design is sleek and modern, with a color scheme that is both professional and uplifting. It embodies the flexibility and efficiency of remote work, making your presentation not just informative but also inspiring. Whether you're discussing remote work strategies with your team, presenting to management, or conducting a workshop, this template will ensure your message is clear, concise, and impactful.


22 diapositivas
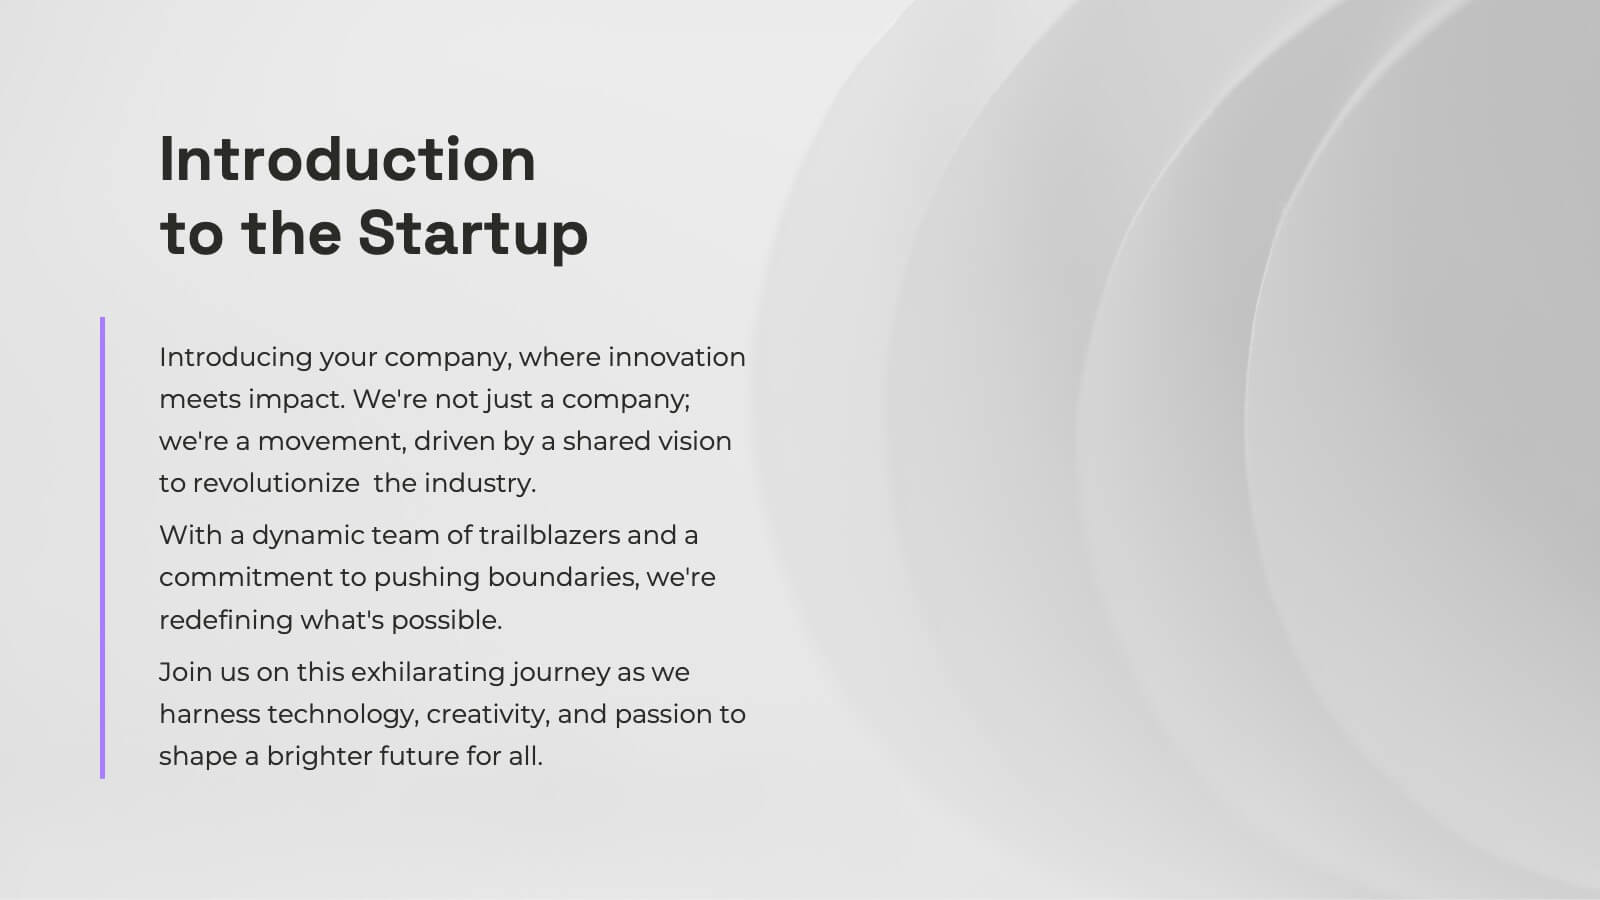
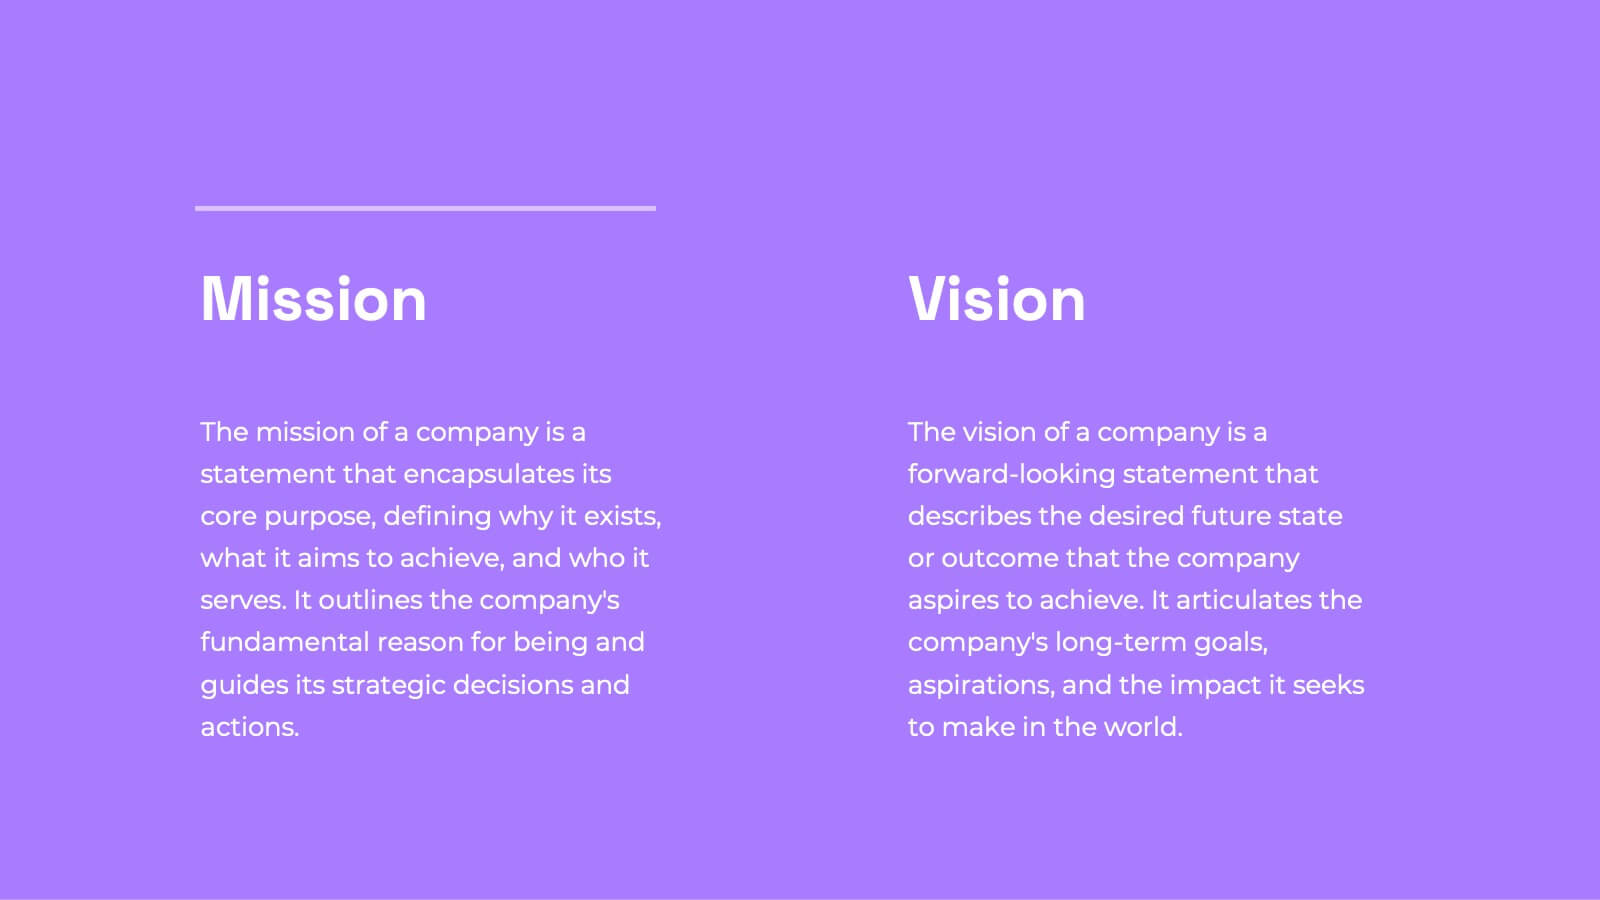
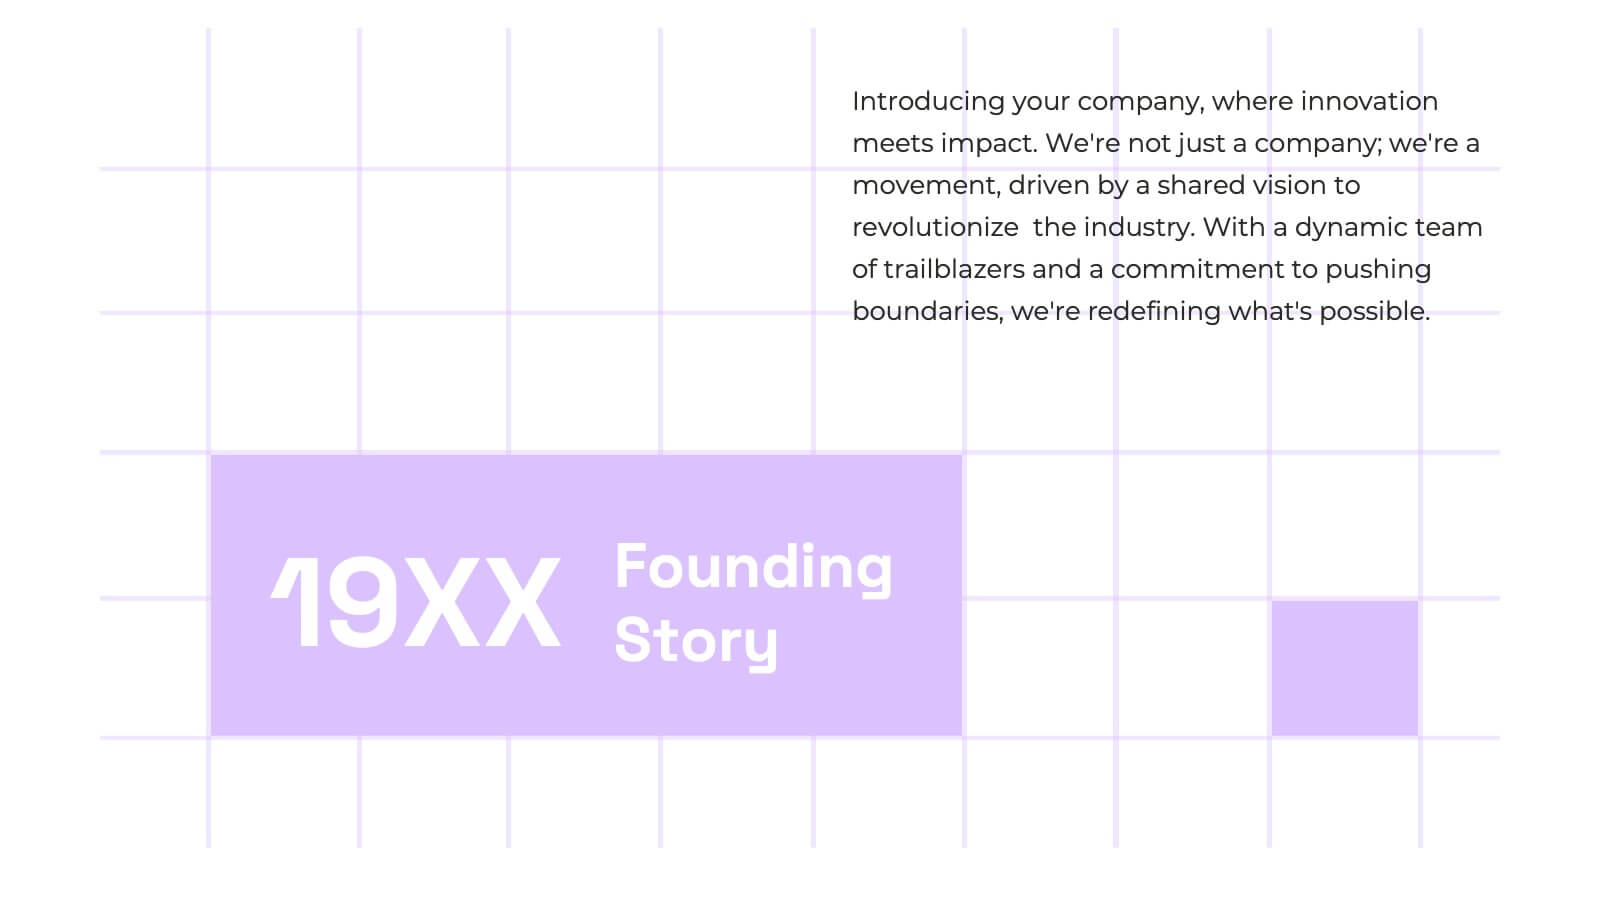
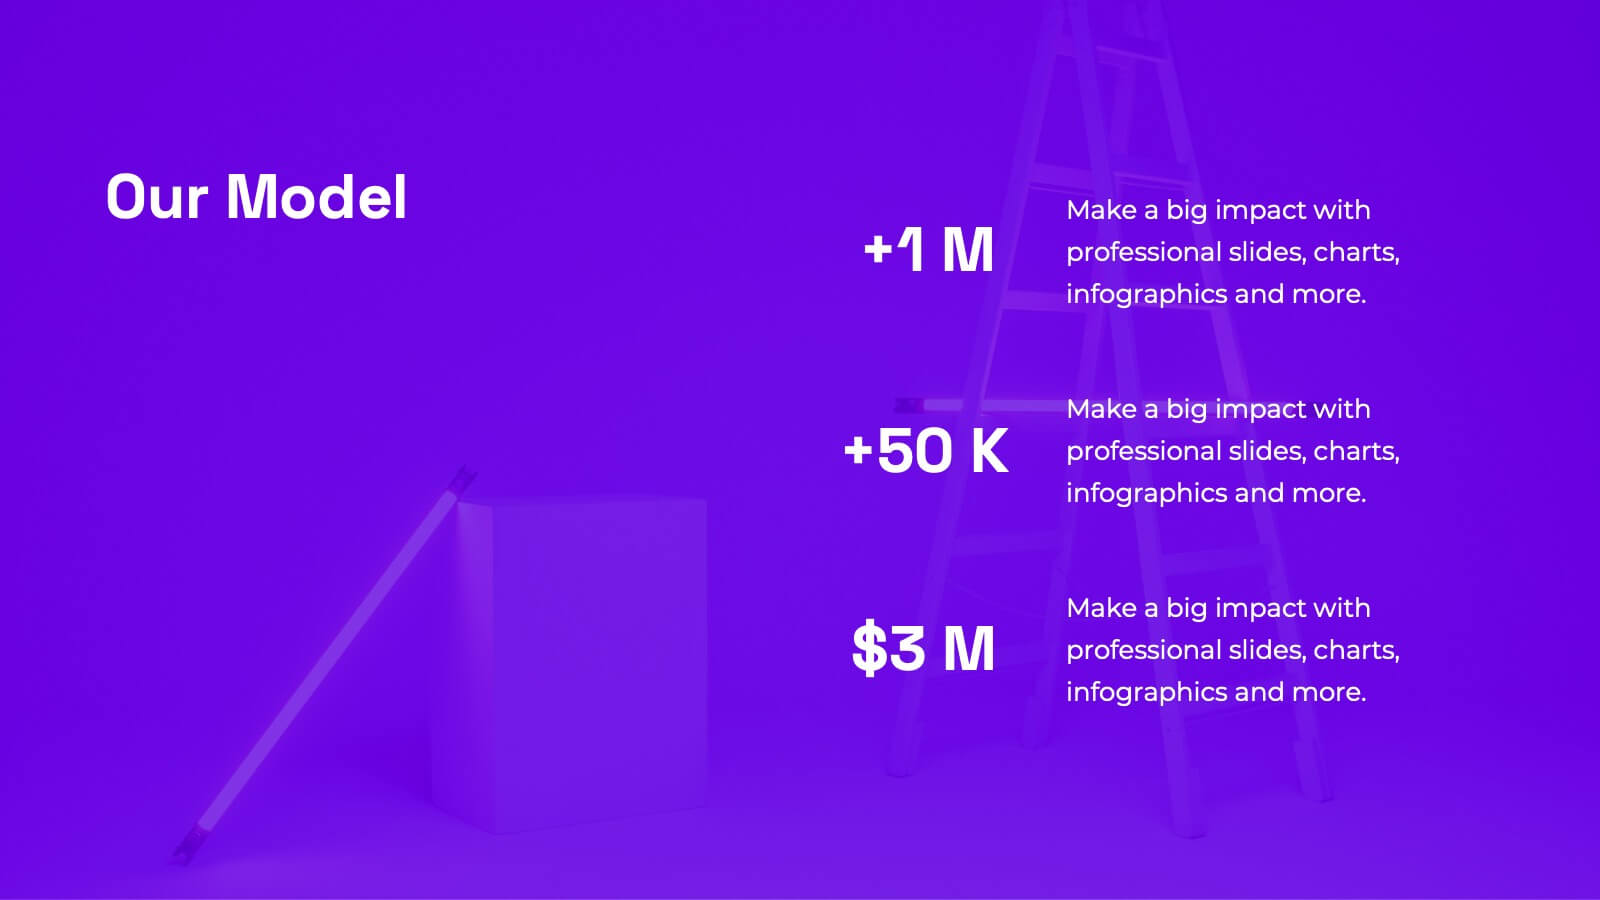
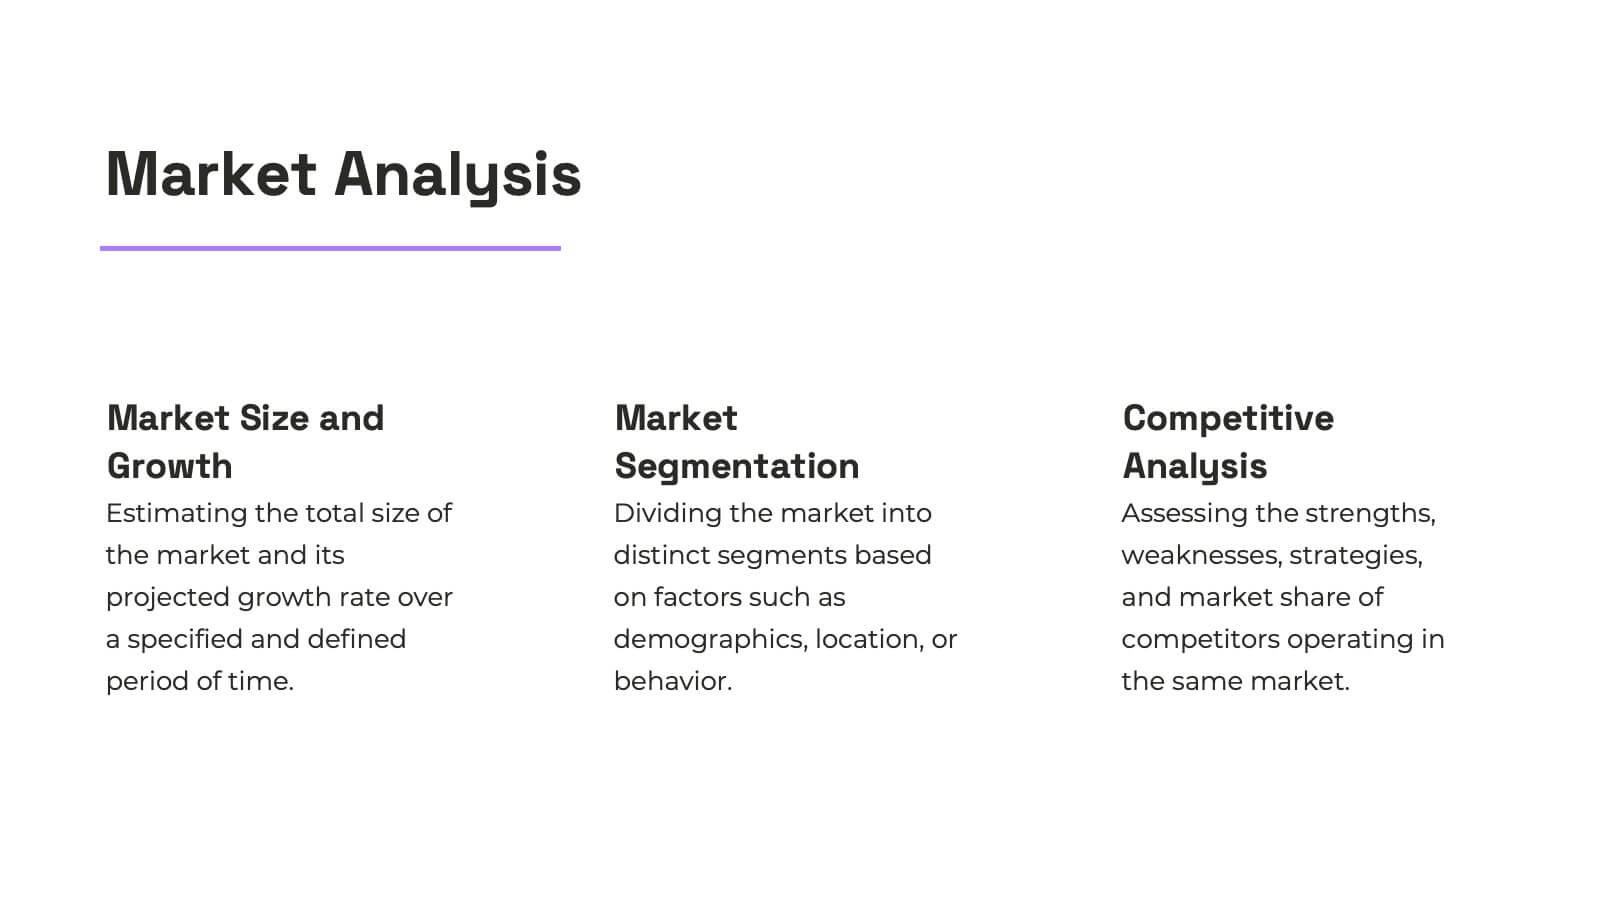
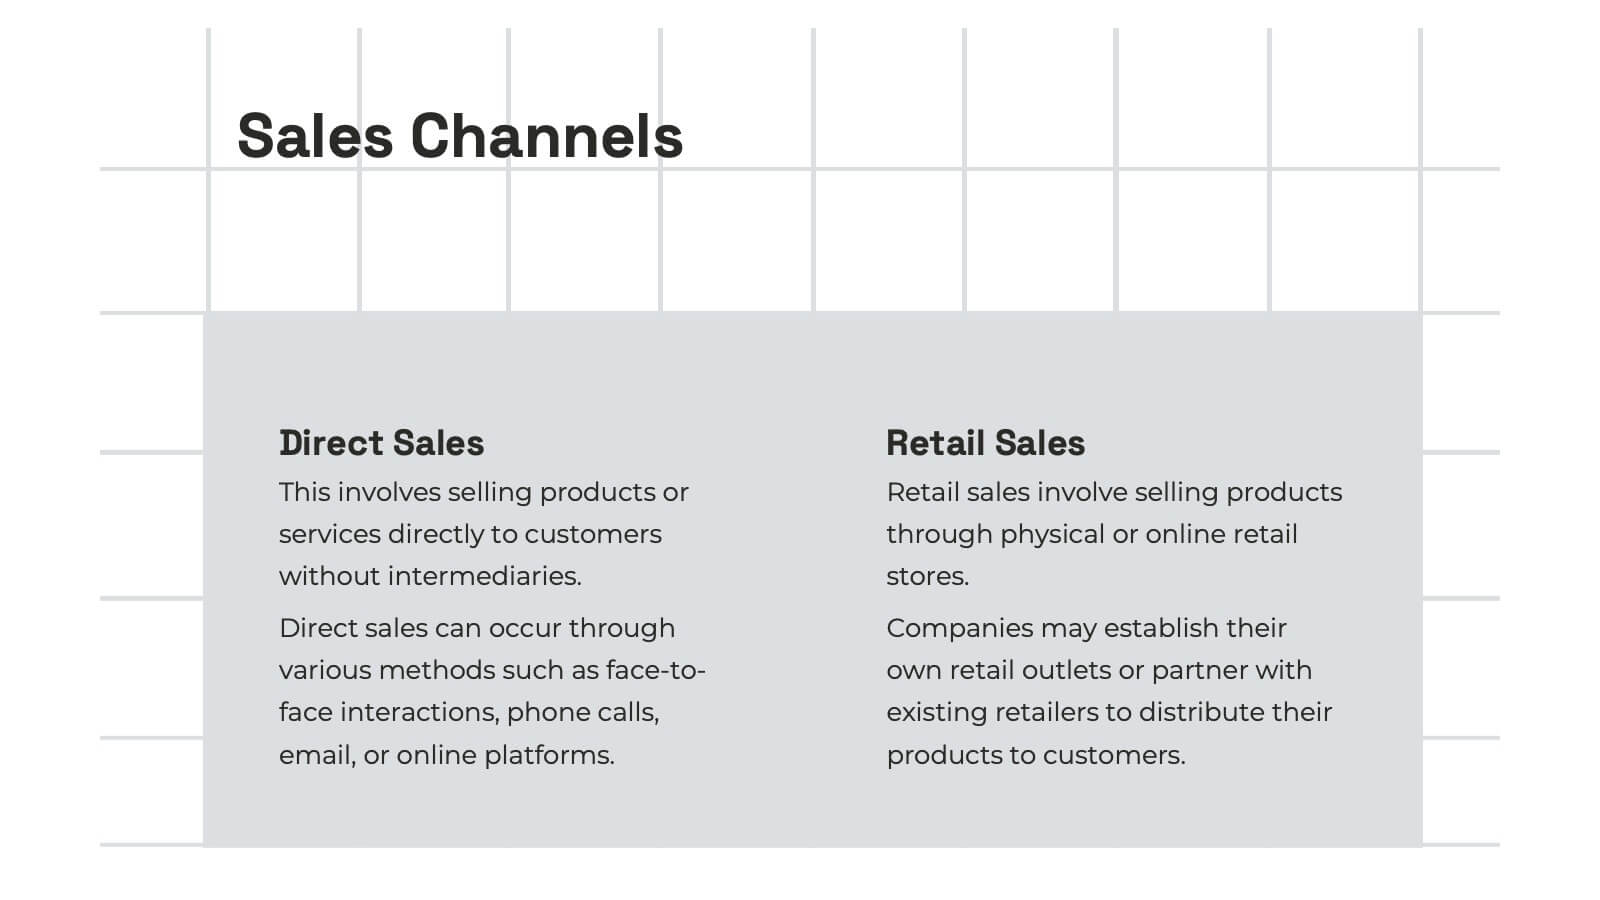
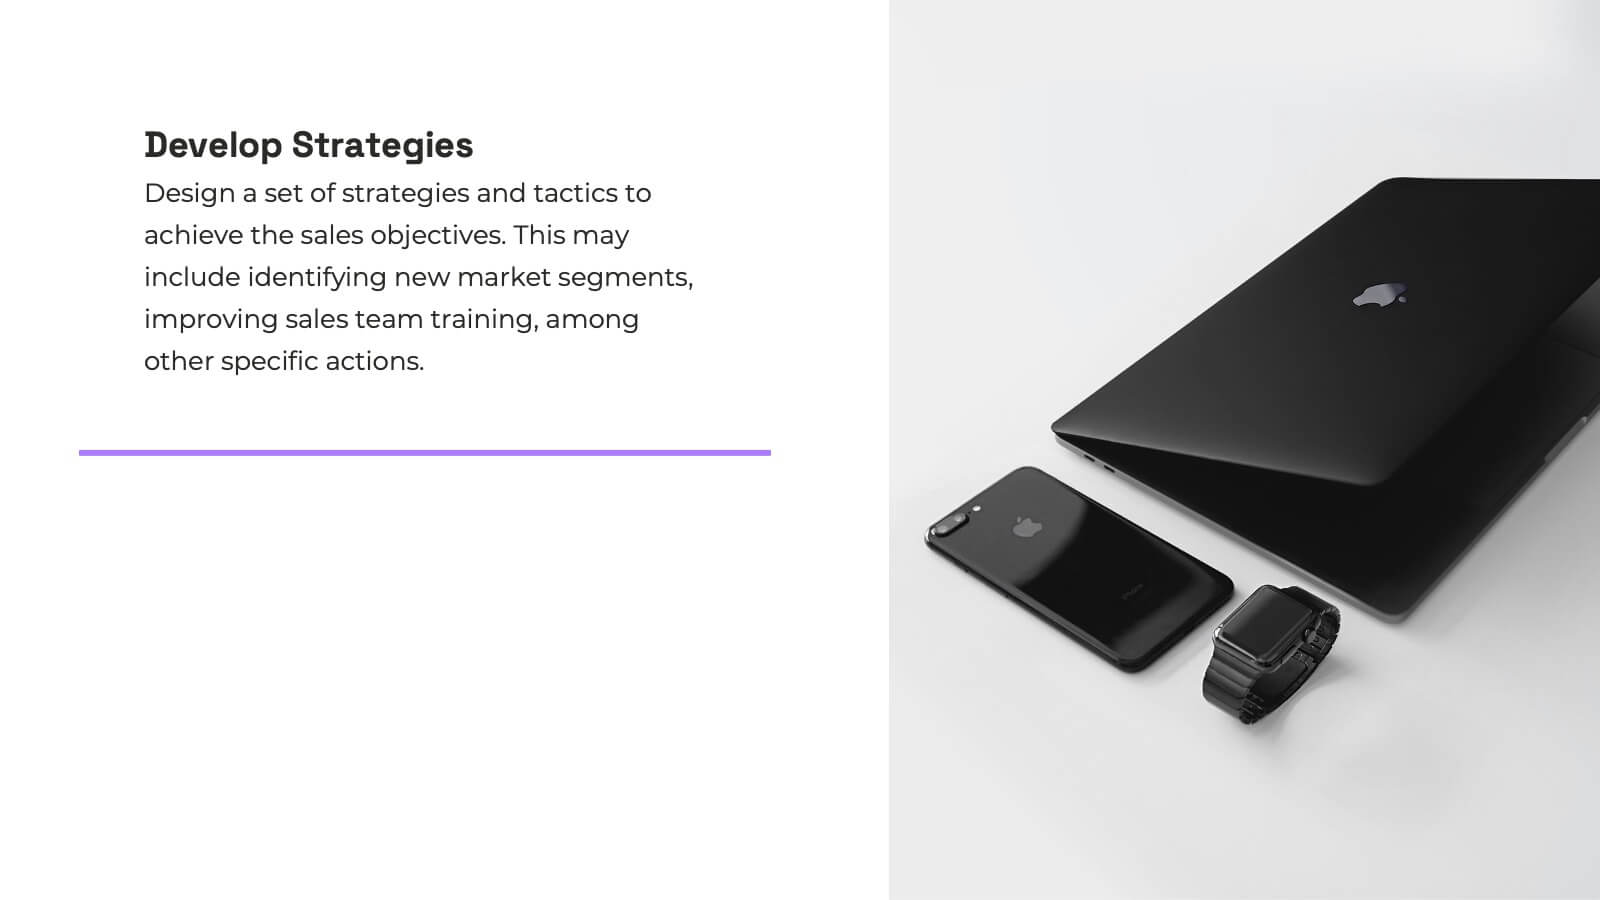
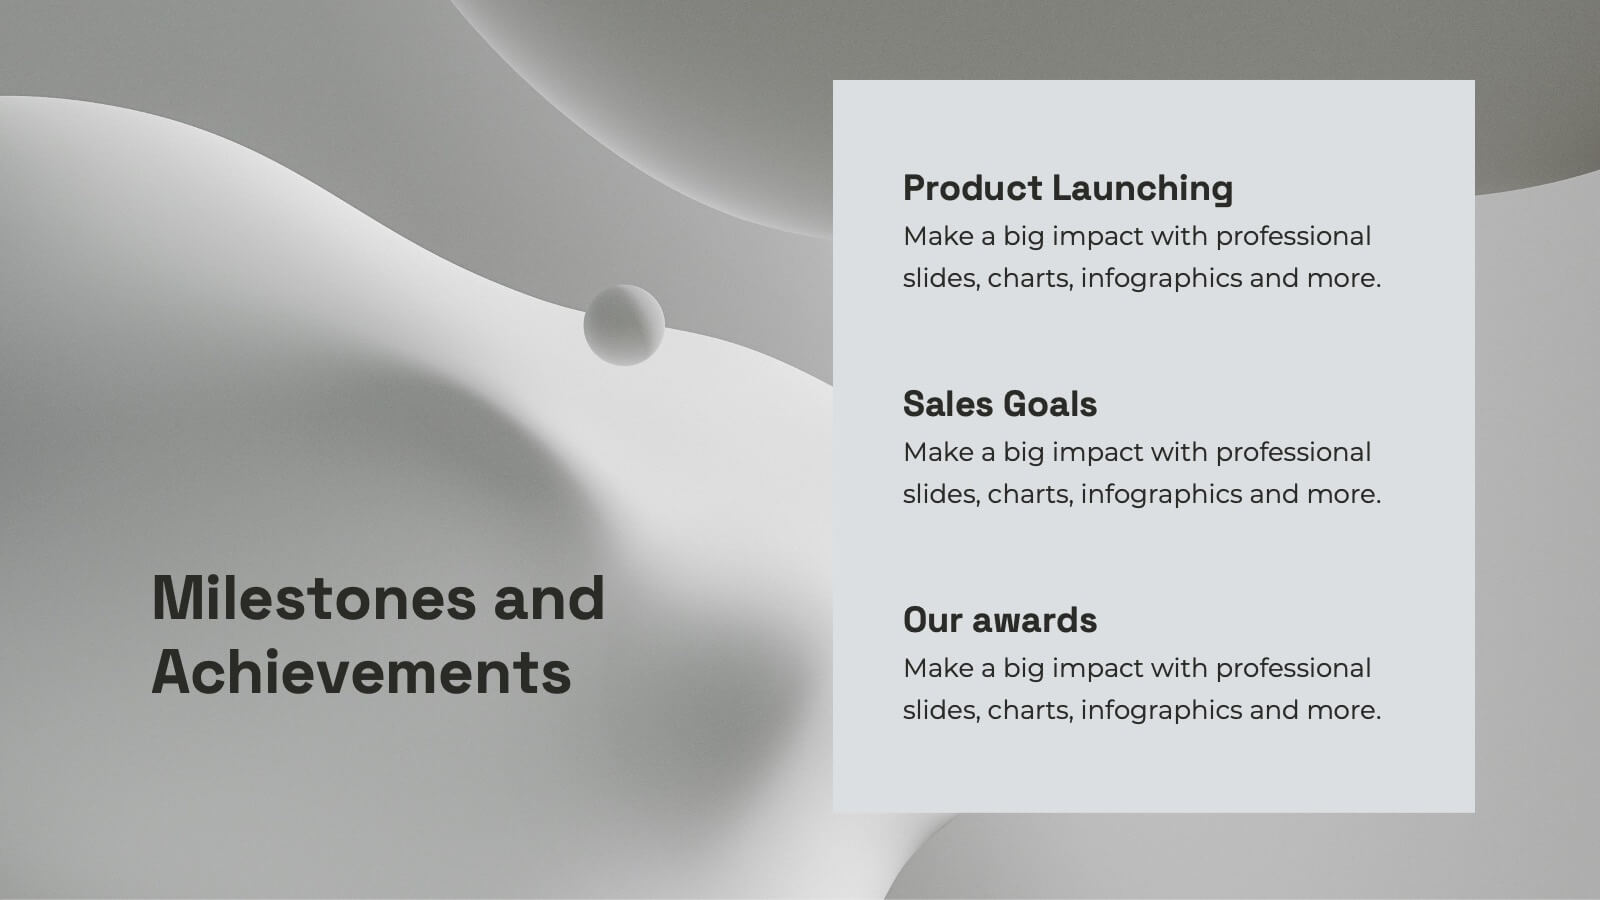
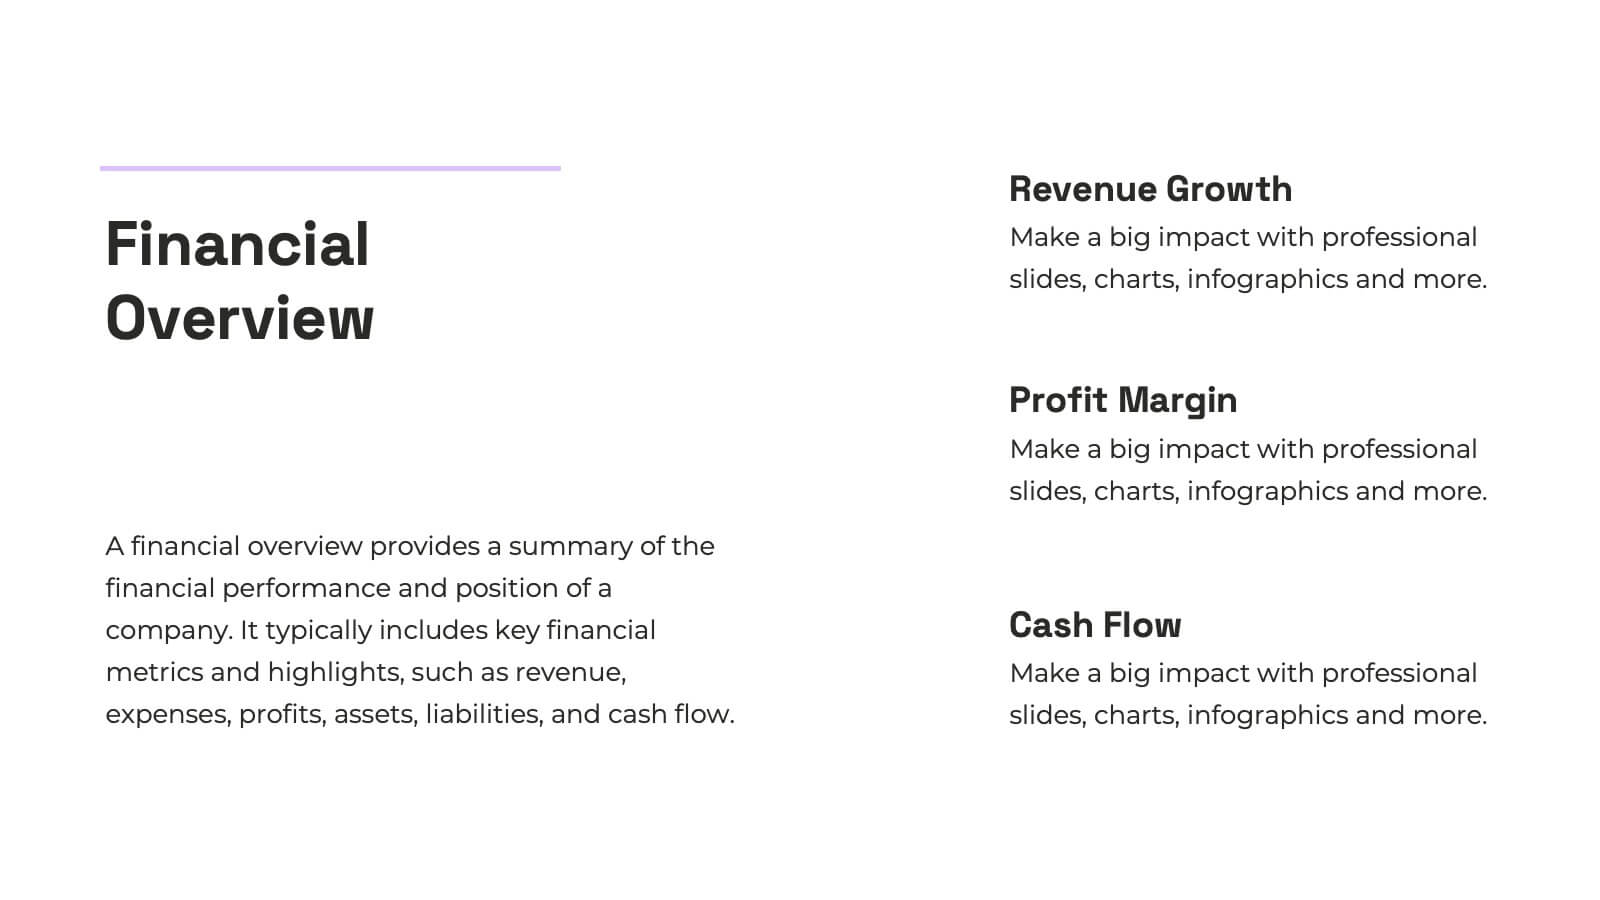
Nexus Startup Growth Plan Presentation
Jumpstart your business journey with this dynamic presentation template! Ideal for outlining your startup growth plan, it covers mission, vision, market analysis, and financial projections with sleek, professional slides. Capture investor interest and articulate your strategy effortlessly. Compatible with PowerPoint, Keynote, and Google Slides, ensuring seamless presentation across all platforms.


5 diapositivas
Online Advertising and SEO Marketing Presentation
Elevate your digital marketing strategy with this engaging infographic template! Designed for clarity, it simplifies online advertising and SEO concepts, covering key metrics, trends, and strategies. Perfect for teams, clients, or stakeholders, it’s fully customizable and compatible with PowerPoint, Keynote, and Google Slides for seamless presentations that captivate and inform.


5 diapositivas
Agribusiness Market Strategy Overview
Showcase your market plan with the Agribusiness Market Strategy Overview Presentation. This engaging slide uses fresh produce illustrations to symbolize market growth, distribution, and agricultural planning. Perfect for farm business proposals, supply chain discussions, or food sector reports. Fully customizable and works seamlessly in PowerPoint, Keynote, and Google Slides.


8 diapositivas
Team Time Allocation and Planning Presentation
Stay on top of your team's workload with the Team Time Allocation and Planning presentation slide. This template features a clear, month-by-month Gantt-style layout, helping you visualize team tasks, priorities, and resource distribution across the year. Ideal for project managers, department leads, or operations teams aiming to streamline scheduling and improve collaboration. Fully customizable in PowerPoint, Keynote, and Google Slides.


24 diapositivas
Veritas UX Research Report Presentation
This UX research report template is designed for clarity and modern style, using a sleek color palette and structured layouts to showcase insights. It includes sections for project overview, user research, personas, wireframes, prototyping, and user testing results. Compatible with PowerPoint, Keynote, and Google Slides, it’s ideal for presenting findings effectively.


4 diapositivas
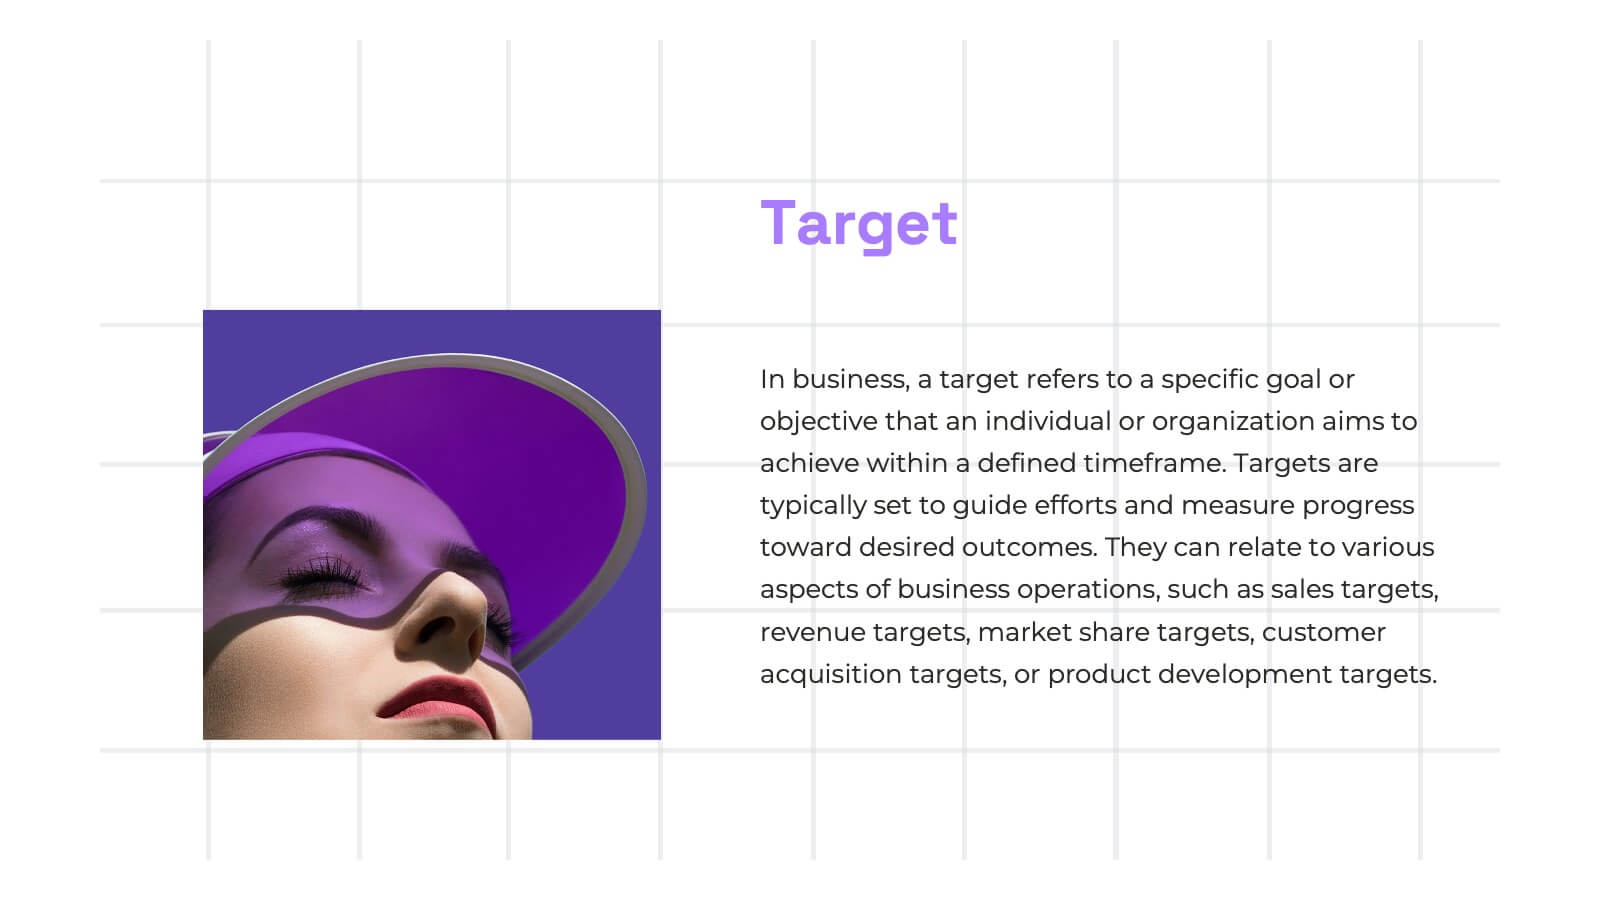
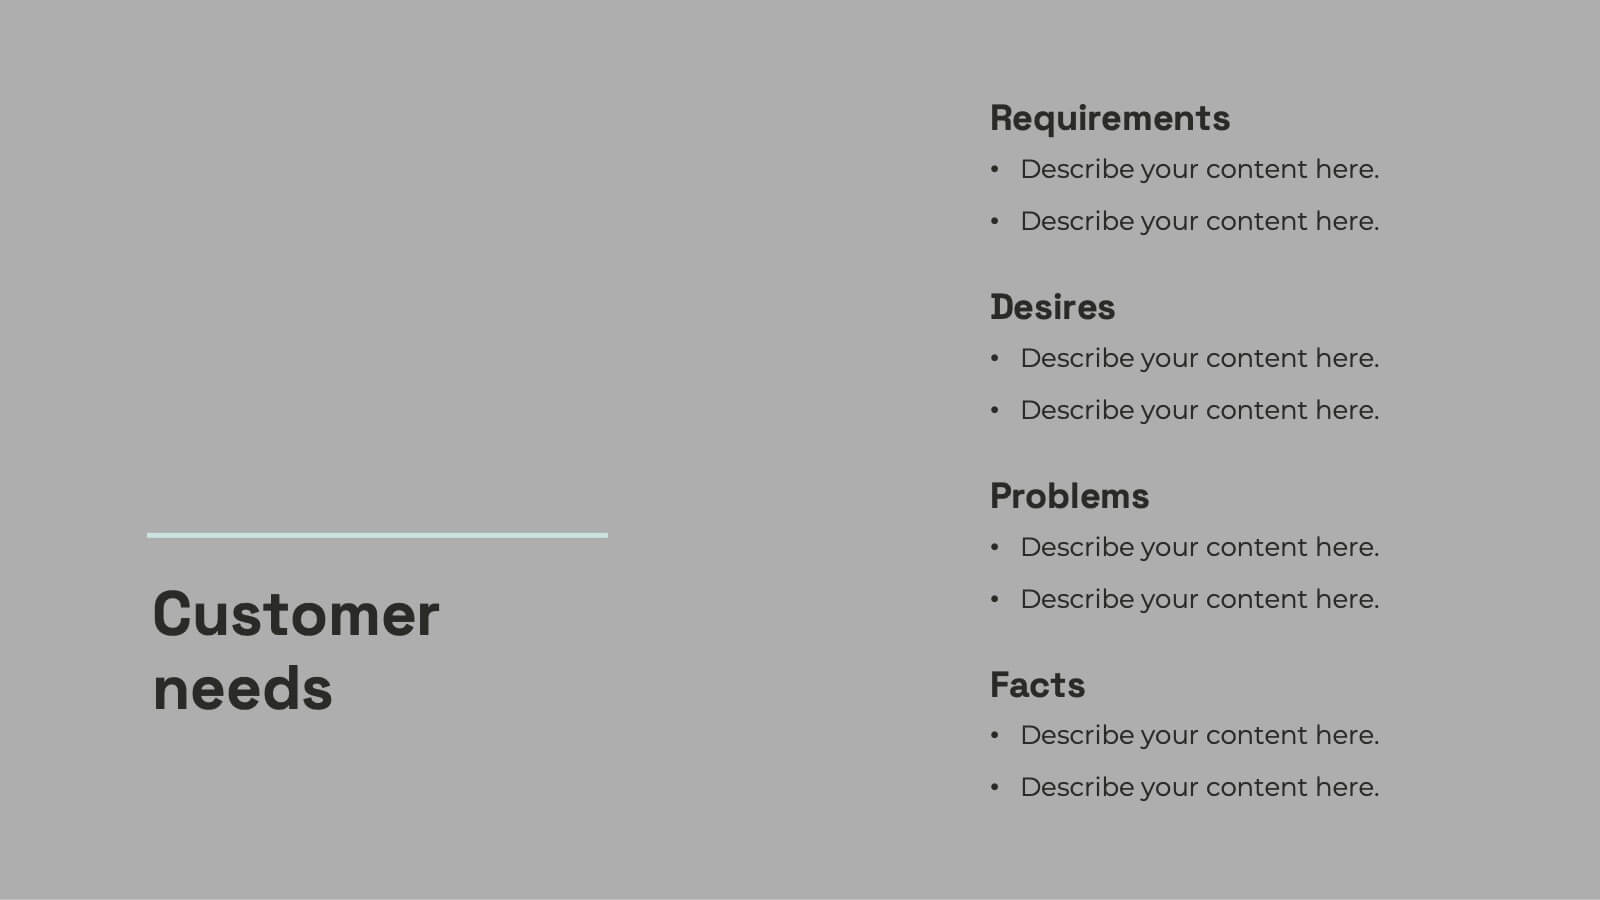
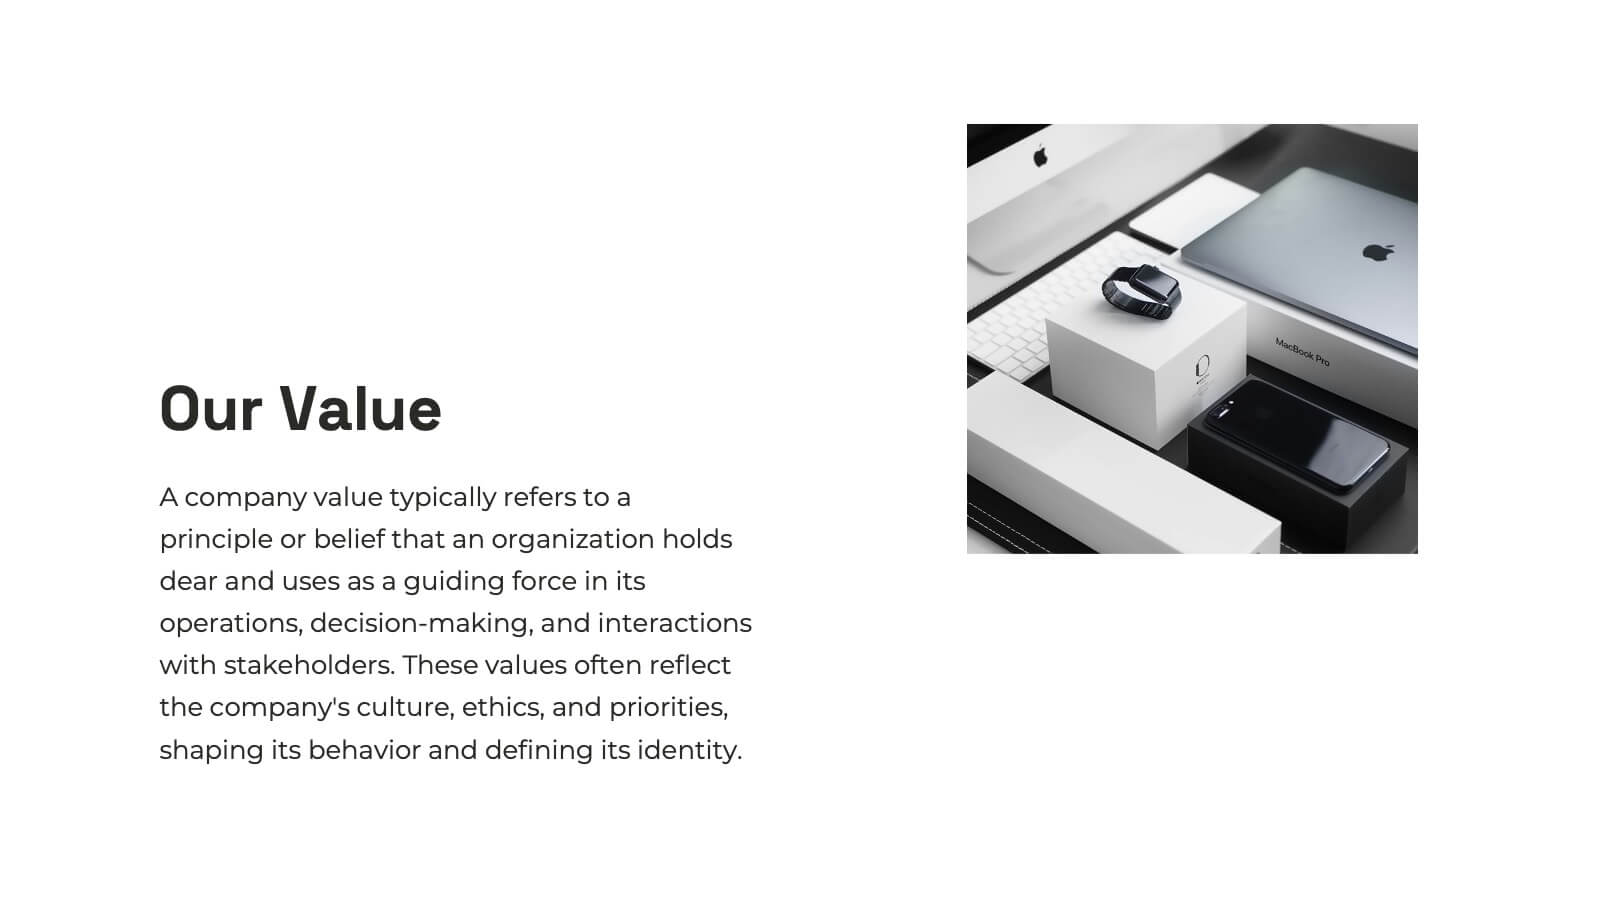
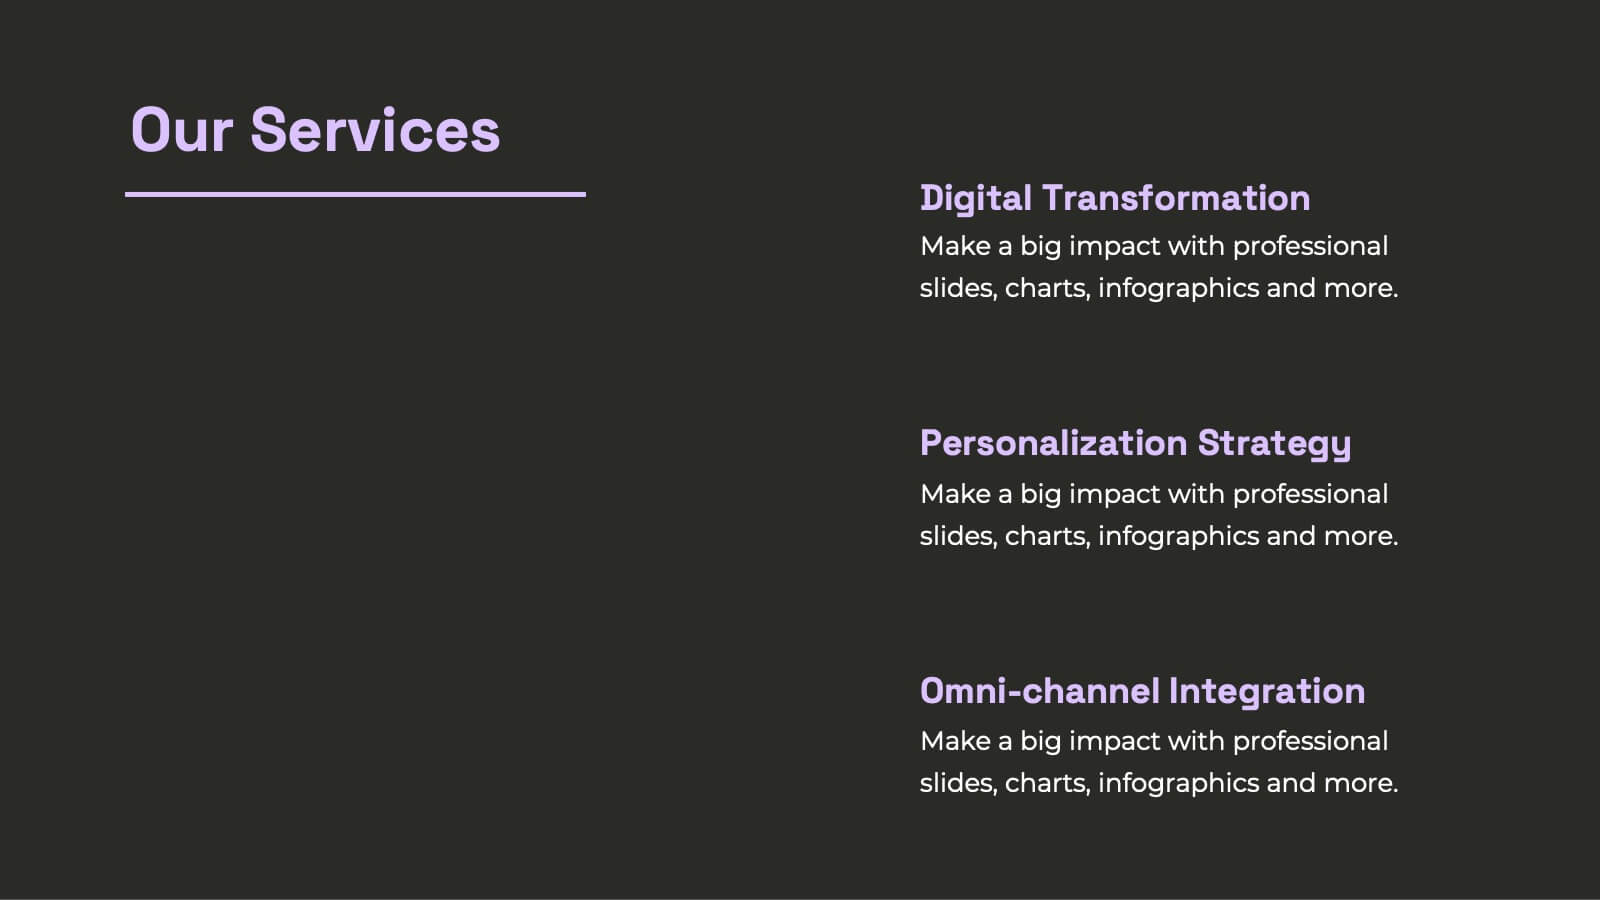
Target Audience Slide Deck Presentation
Make your message click instantly with a bold, puzzle-style slide that brings your audience insights to life. This presentation helps you break down key segments, user needs, and demographic details in a clear, engaging format that supports strategic decision-making. Fully compatible with PowerPoint, Keynote, and Google Slides.


7 diapositivas
Matrix System Diagram Infographic
A matrix diagram is a visual representation of data in a matrix format, commonly used to analyze the relationships between two or more sets of items. This infographic template is a valuable tool in various fields including business, project management, quality management, and decision-making processes. Compatible with Powerpoint, Keynote, and Google Slides. This is designed to help you present intricate relationships, structures, and data in a clear and visually engaging way. Whether you're illustrating business strategies, decision matrices, or organizational hierarchies, this template simplifies complexity.


3 diapositivas
Digital Course Planning and LMS Strategy Presentation
Design your online courses like a pro with this clean, easy-to-follow visual. Ideal for mapping course flow, LMS strategy, and learner journeys, this presentation template breaks down complex processes into digestible steps. Fully customizable and compatible with PowerPoint, Keynote, and Google Slides for flexible e-learning presentation creation.


21 diapositivas
Alchemos UX Case Study Presentation
Showcase your UX process with clarity and impact using this sleek case study presentation. Covering key aspects like user research, interaction design, prototyping, and responsive design, this template helps you tell a compelling design story. Fully customizable and compatible with PowerPoint, Keynote, and Google Slides for a seamless presentation experience.


7 diapositivas
Supply Chain Logistic Infographics
Streamline your logistics insights with our Supply Chain Logistics Infographic, tailored for logistics managers, supply chain analysts, and operations directors. This infographic provides a visual tool to depict the intricacies and flow of your supply chain from procurement to distribution. Our infographic offers a comprehensive layout to map out each step of the supply chain, highlighting key processes such as supplier selection, manufacturing, inventory management, and logistics. It's designed to facilitate a better understanding of each segment's role in the overall efficiency and effectiveness of the supply chain. Customize this infographic with specific data points, such as lead times, turnover rates, and transportation modes, to provide a detailed view of your logistics operations. This SEO-optimized infographic is crafted to make your supply chain data accessible and actionable. Implement our infographic to communicate the complexities of supply chain logistics succinctly, ensuring that stakeholders grasp the full scope of your supply chain dynamics.


5 diapositivas
Patient Care and Hospital Management Presentation
Communicate critical aspects of Patient Care and Hospital Management with this structured presentation template. Featuring a unique IV-drip-inspired design, this layout visually represents the flow of healthcare processes, making it ideal for hospitals, medical institutions, and healthcare professionals. Use it to outline treatment protocols, patient management strategies, and operational workflows. Fully editable and compatible with PowerPoint, Keynote, and Google Slides for seamless customization.


6 diapositivas
Creative Interior Design Portfolio Showcase Presentation
Showcase your creativity with the Creative Design Portfolio Showcase presentation. This template is perfect for graphic designers, architects, and creative professionals looking to display their work in a visually compelling format. Featuring modern layouts, high-quality image placeholders, and structured text sections, it allows for easy customization to highlight key insights. Fully compatible with PowerPoint, Keynote, and Google Slides.


7 diapositivas
Construction Management Infographic Presentation
A Construction Infographic is a visual representation of data related to the construction industry and processes. This templates uses colorful construction illustrations to presents data, statistics, and other information in a visually appealing way. You can uses this to cover a wide range of topics, including project timelines, budget breakdowns, safety statistics, materials usage, sustainability practices, and more. This infographic uses illustrations, icons, text boxes and other visual elements to help convey your information. This can be easily edited in Powerpoint, Keynote and Google Slides.


6 diapositivas
Strategic Blocks in Business Canvas
Visualize and communicate your business model effectively with the Strategic Blocks in Business Canvas Presentation. This slide breaks down all critical segments—Partners, Activities, Resources, Value Propositions, Channels, Revenue Streams, and more—into a clean and colorful layout for strategic planning and stakeholder alignment. Fully editable in PowerPoint, Keynote, and Google Slides.