


Características


¿Tienes alguna pregunta?
Recomendar


8 diapositivas
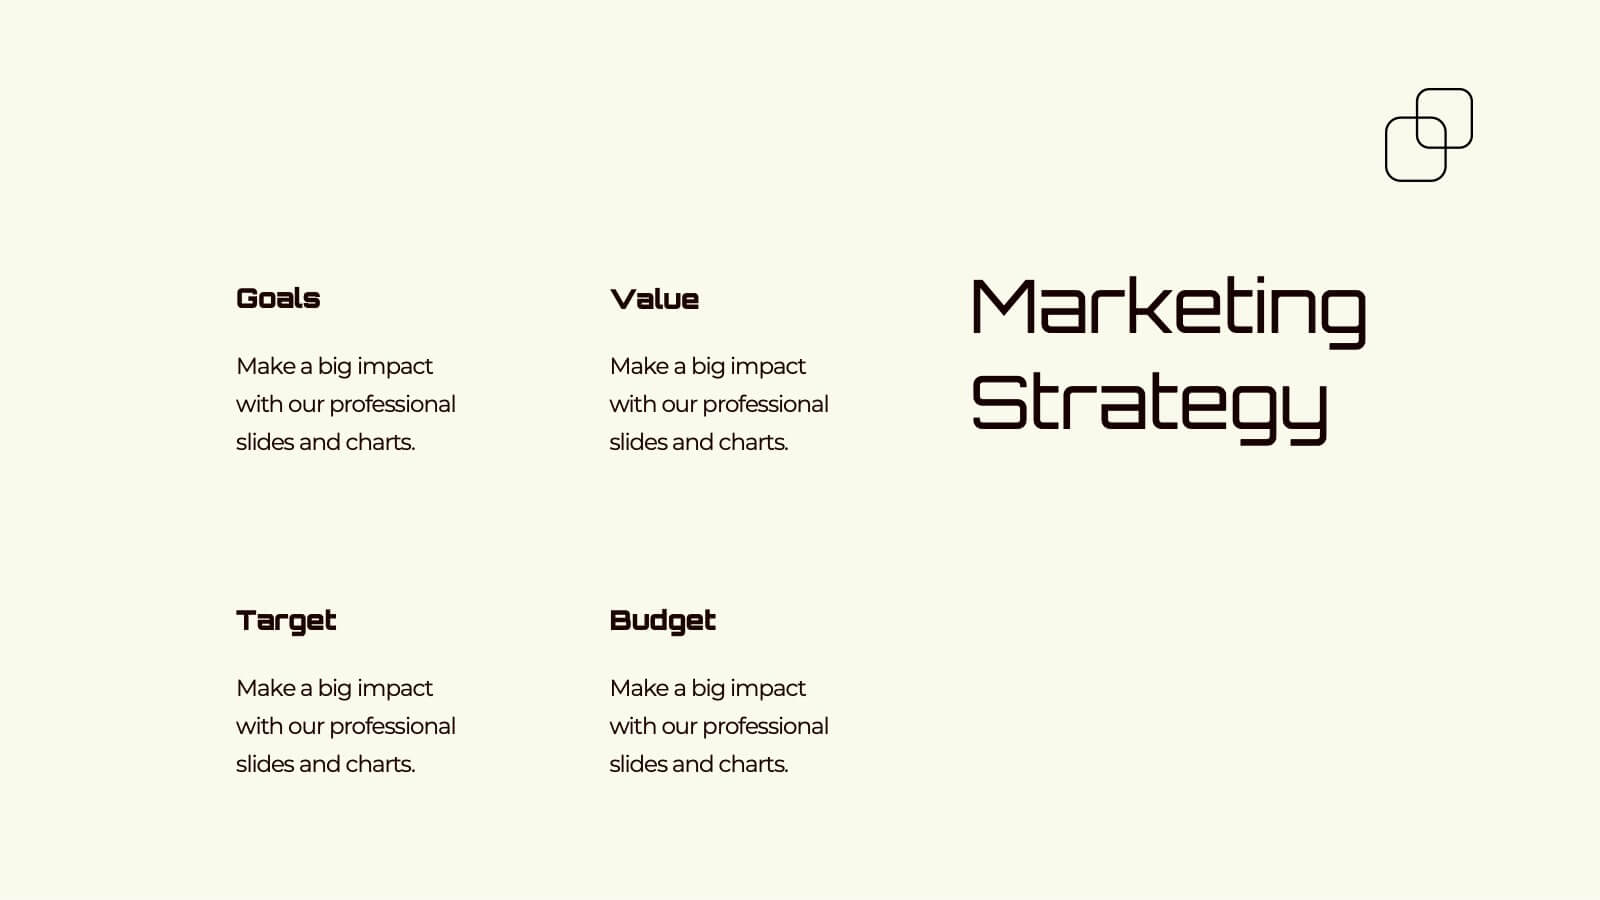
Business KPI Dashboard Presentation
Track performance at a glance with the Business KPI Dashboard Presentation. This clean, professional layout includes a speedometer-style gauge and monthly bar chart to showcase progress, goals, or metrics clearly. Ideal for reporting, analysis, or executive summaries. Fully editable and compatible with PowerPoint, Keynote, and Google Slides.


7 diapositivas
SCRUM Infographic Presentation Template
A SCRUM infographic is an Agile methodology for software development. The goal of this infographic template is to provide a clear and easy-to-understand overview of the key principles and practices of scrum, such as the roles, events, and artifacts used in the process. This template can be used as a reference for team members, as a teaching tool for new scrum practitioners, or as a way to communicate scrum to stakeholders. Our well-designed scrum infographic can help you and your audience quickly understand the basics of the framework, as well as its benefits, applications, and best practices.


6 diapositivas
Engagement Survey Results Infographics
Effectively communicate your engagement survey results with our Engagement Survey Results infographic template. This template is fully compatible with popular presentation software like PowerPoint, Keynote, and Google Slides, allowing you to easily customize it to illustrate and convey your survey findings. The Engagement Survey Results infographic template offers a visually engaging platform to present survey data, key findings, and insights related to employee or customer engagement. Whether you're an HR professional, manager, or business leader, this template provides a user-friendly canvas to create informative presentations and reports on engagement survey outcomes. Optimize your communication of survey results with this SEO-optimized Engagement Survey Results infographic template, thoughtfully designed for clarity and ease of use. Customize it to showcase survey methodology, response rates, visualizations of data, and action plans based on the findings, ensuring that your audience gains a comprehensive understanding of the survey results and their implications. Start crafting your personalized infographic today to effectively communicate engagement survey outcomes.


7 diapositivas
Iceberg Infographic Presentation Template
An Iceberg infographic is a powerful and eye-catching way to display information, it is a method for presenting complex information. This template is designed to be fully customizable and include all the elements you need to make an impact on your audience. The Iceberg can be used to visualize any concept that has a direct impact on your performance, from sales to customer retention, from how organizations are staffed to identifying the key players within teams. Use this template to create a detailed iceberg diagram of your business, its customers, and the things that impact them.


6 diapositivas
RACI Matrix Chart Infographic
The RACI matrix is a project management tool used to define roles and responsibilities for tasks and activities within a project. This infographic template is designed to clarify the roles and responsibilities of team members in a project or process. RACI stands for Responsible, Accountable, Consulted, and Informed, and the matrix helps define each team member's involvement in different tasks or activities. This includes a step-by-step guide on how to create a RACI matrix, including identifying tasks, defining roles, and assigning responsibilities. This will simplify your audience's understanding of the RACI matrix chart.


5 diapositivas
Suicide Prevention & Awareness Infographics
Suicide Awareness plays a vital role in addressing the global public health issue of suicide. These vertical infographics are powerful and informative designs that aim to raise awareness about suicide prevention, promote mental health, and provide essential information to help individuals recognize the signs and support those in need. With its thoughtful and sensitive design, the template communicates important statistics, facts, and resources. The template is fully customizable, allowing you to personalize the infographics with your own content, including local helpline numbers, support services, or specific awareness campaigns.


5 diapositivas
The Problem of Food Waste Infographics
Food Waste refers to any food that is discarded or lost along the food supply chain, from production to consumption. These vertical infographics are designed to cover the problem of food waste and can be designed to highlight statistics and facts about the issue. This infographic can be used to show how much food is wasted annually and the negative impact that this waste has on the environment. In the text boxes provide tips for reducing food waste, such as buying only what you need, storing food properly, and using leftovers creatively. Included are engaging visuals, such as icons and illustrations, and a clear layout.


22 diapositivas
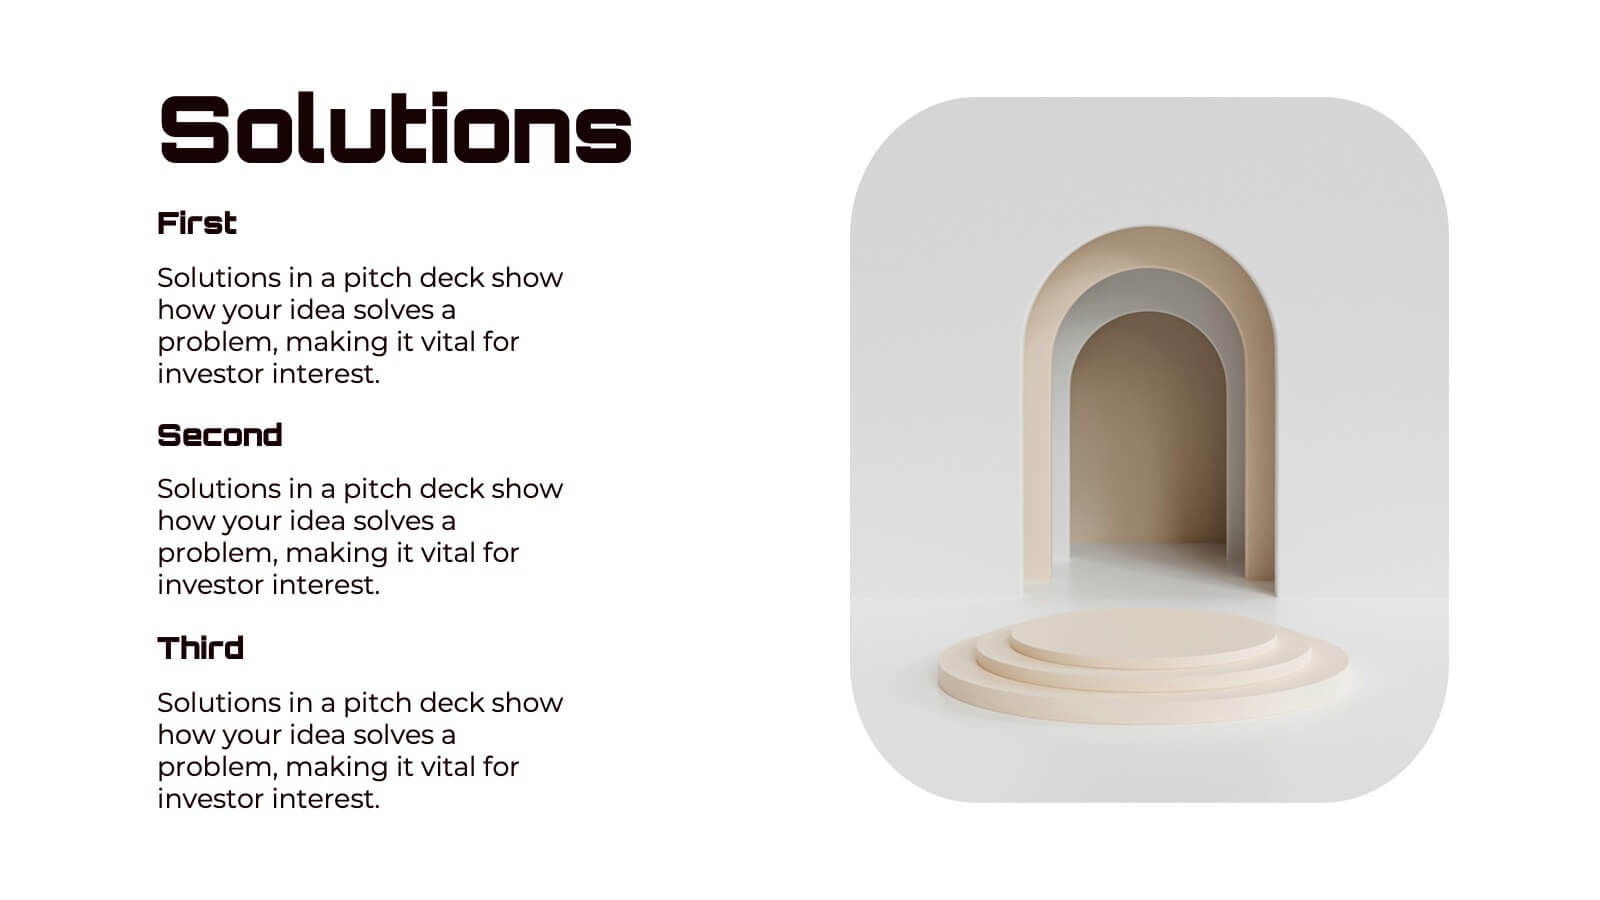
Pearl Product Launch Pitch Deck Presentation
Make your product launch shine with this sleek, pearl-inspired presentation! Perfect for pitching your product’s unique value, market positioning, and growth potential, this template is designed to captivate investors and stakeholders. Its elegant, minimalist layout keeps your message front and center. Compatible with PowerPoint, Keynote, and Google Slides.


5 diapositivas
Water Problems Infographics
Water Problems refer to the various issues that arise due to the scarcity, pollution, or mismanagement of water resources. These vertical infographics are perfect for addressing various issues related to water management and conservation. They are effective tools for raising awareness about water-related issues and promoting sustainable water management practices. This template is completely customizable and includes various icons and images related to water such as water droplets, faucets, and ocean waves. The color scheme is predominantly blue, signifying the importance of water conservation and preservation.


7 diapositivas
TAM SAM SOM Infographic Presentation Template
TAM, SAM and SOM are acronyms that represents different subsets of a market. Which stand for (TAM) Total Addressable Market, (SAM) Serviceable Addressable Market, and (SOM) Serviceable Obtainable Market. Understanding these acronyms can help you better target your marketing efforts to potential customers. This presentation template is a great tool to organize and plan any of your important business projects. Using this template can become critically important to the very foundation of your business model, and TAM, SAM, SOM should be key components to craft the details of your business plan.


7 diapositivas
Home Office Scenes Infographic
Dive into the intricacies of the home office environment with our office scenes infographic. Rendered in a sophisticated palette of white and dark blue, this infographic offers an insightful visual exploration of today's work-from-home culture. With detailed icons and illustrative graphics, the design brings to life various scenarios and components of a home office. The layout is geared towards offering practical insights to its viewers. This template is perfect for remote work advocates, and any company transitioning to a hybrid work model. Compatible with PowerPoint, Keynote, and Google Slides this ensures seamless integration into your presentations.


9 diapositivas
Font Alphabet Infographic
Typography plays a pivotal role in conveying mood, tone, and personality. Our font alphabet infographic is a dazzling blend of red, green, yellow, and blue, providing a vibrant showcase of diverse font styles. Each alphabet letter is uniquely stylized, making it an ideal resource for graphic designers, educators, and marketing professionals looking to make a statement. Whether you're teaching the basics of typography or showcasing a brand's versatility, this infographic serves as a visual treat. Seamless integration with PowerPoint, Keynote, and Google Slides ensures you can weave this colorful font journey into any presentation.


6 diapositivas
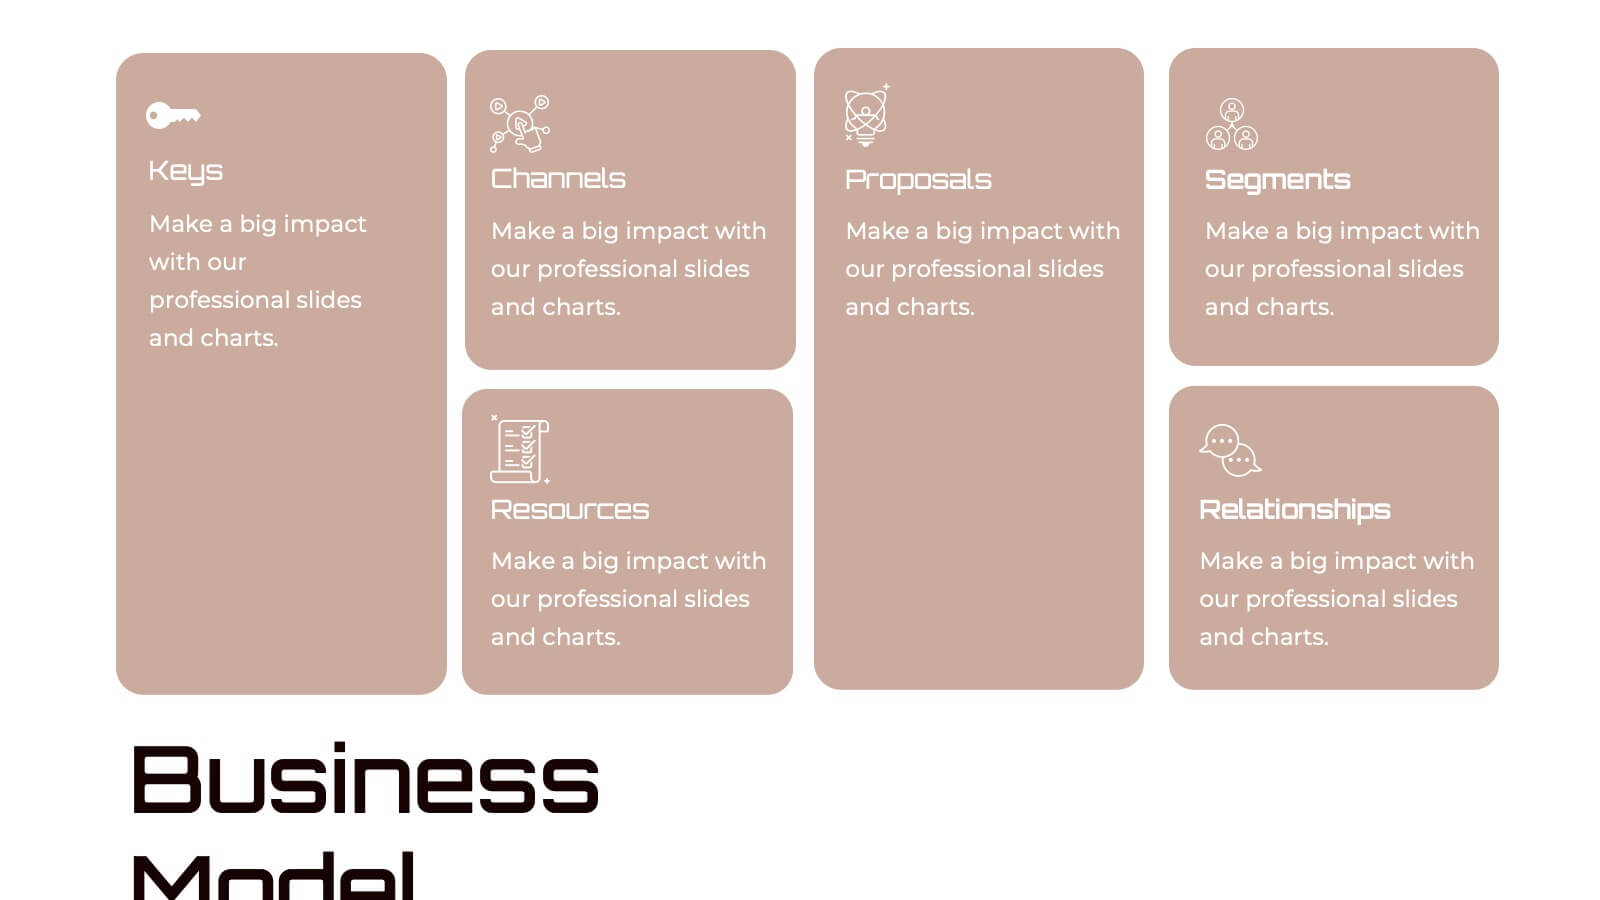
Market Challenges and Resilience Strategy Presentation
Tackle volatility with clarity using the Market Challenges and Resilience Strategy presentation. This slide features a modern smartphone graphic surrounded by six key strategy zones, each with its own icon and text area—ideal for outlining market pressures, competitive moves, or adaptive responses. Use it to communicate resilience frameworks, digital transformation steps, or scenario planning. Fully customizable in PowerPoint, Keynote, and Google Slides.


6 diapositivas
Domestic Statistics Infographic
Domestic statistics typically refers to numerical data and information related to a specific country's internal affairs, activities, and demographics. This infographics can be an effective way to present important data and trends related to a specific country or region. This template is designed with a balance between design aesthetics and data accuracy. By presenting the information in a visually engaging manner, you can effectively communicate key insights to your target audience. Compatible with Powerpoint, Keynote, and Google Slides. This ensures that your infographic is accessible by providing alternative text for images and using high-contrast colors.


7 diapositivas
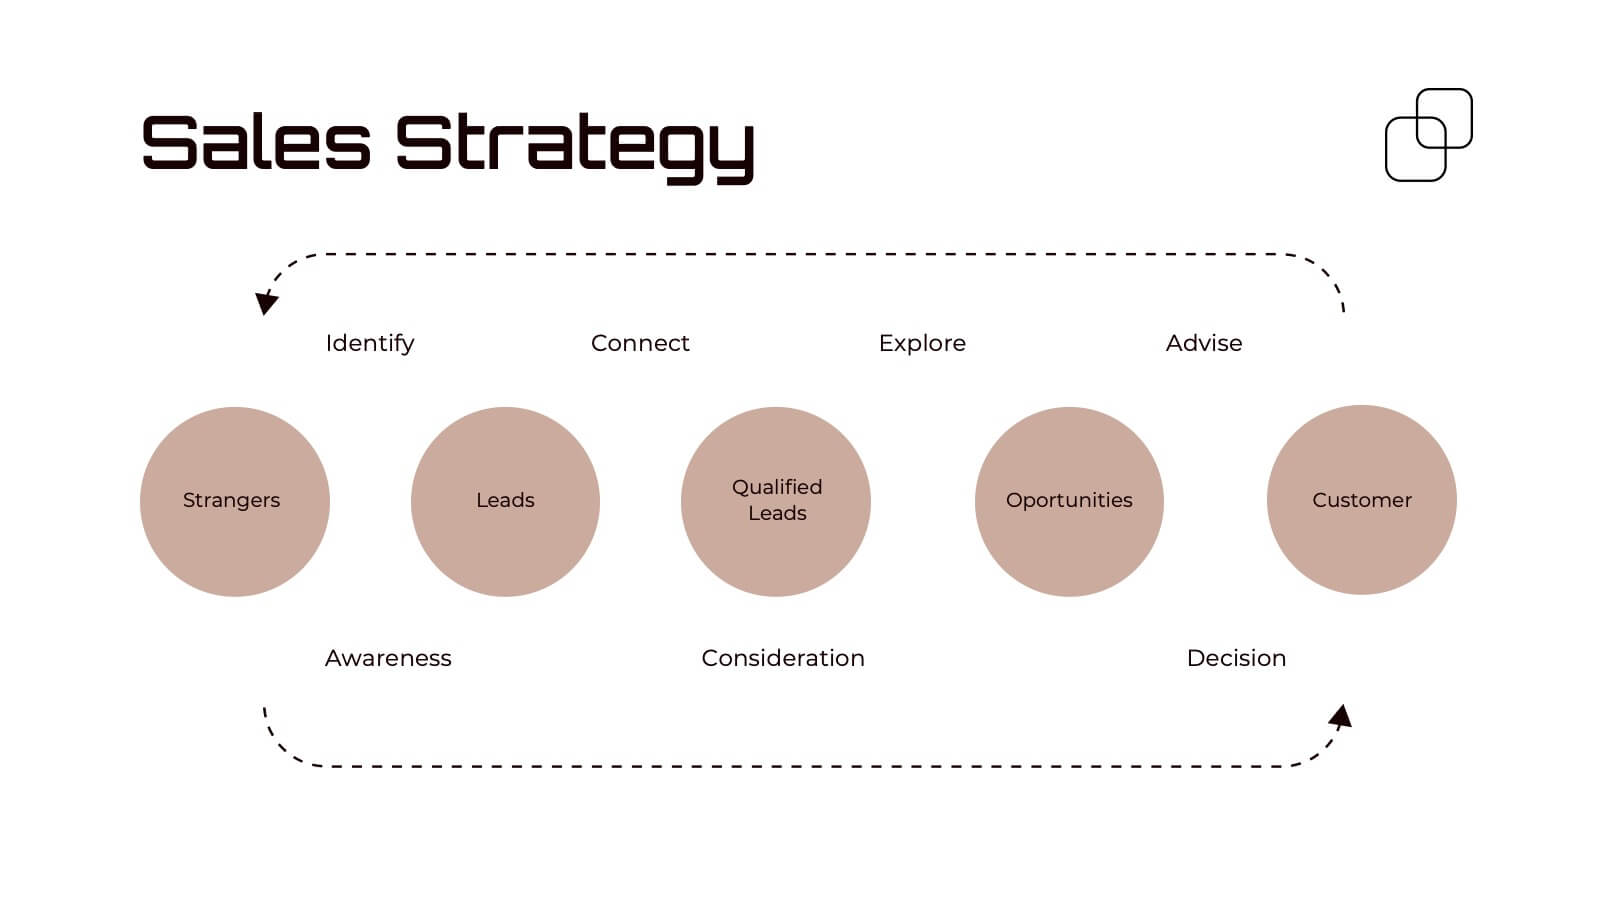
Associate Sales Infographic Presentation
An Associate Sales typically refers to a job title or position in a sales department, where the individual is responsible for supporting the sales team in achieving their goals. This template is perfect for presenting sales data, product information, or anything else you need. You can use this template for teaching and training associates on products, services, and strategies. This template is a great sales tool to give your audience information about the services or product you offer. Present your data in an organized way, and edit this template in Powerpoint, Keynote or Google slides.


5 diapositivas
North America Business Landscape Map Presentation
Explore the business terrain with the "North America Business Landscape Map" template, which delivers a comprehensive visualization of business data across various regions. Designed for strategic presentations, it enables clear communication of market insights and data points, crucial for decision-making. This template is compatible with PowerPoint, Keynote, and Google Slides, enhancing its utility for professionals in diverse fields.


5 diapositivas
IT Support and Systems Presentation
Streamline your tech communication with a clean, structured layout that highlights your IT services, support processes, and system workflows. Perfect for teams presenting solutions, infrastructure overviews, or technical strategies, this presentation brings clarity to complex topics. Fully compatible with PowerPoint, Keynote, and Google Slides for effortless editing and delivery.