


Características


¿Tienes alguna pregunta?
Recomendar


5 diapositivas
Client Engagement Journey Touchpoints
Map out every stage of client interaction with the Client Engagement Journey Touchpoints Presentation. This visual slide template highlights four key customer touchpoints, with a central user icon to emphasize the client-centric approach. Ideal for showcasing brand awareness, first contact, engagement strategies, and conversion steps. Easily customizable in PowerPoint, Keynote, and Google Slides.


7 diapositivas
Milestones Credit Card Infographic Presentation
A Milestones Infographic is a visual representation of significant events, accomplishments, or achievements in a project, business, or individual's life. This template include timelines, graphs, diagrams, and other visual elements to help convey important information. You can use this infographic to cover many different topics, including project management, business growth, personal achievements, or company history. This template is useful for businesses or individuals who want to showcase their accomplishments, highlight important dates or events, or just share progress updates.


6 diapositivas
SCAR Process Model Presentation
The "SCAR Process Model" presentation template provides a clear visualization of the SCAR (Supplier, Corrective, Action, Request) model, designed to help professionals manage and enhance supplier relationships effectively. Each quadrant of the template is dedicated to one of the SCAR components, neatly arranged around a central hub, symbolizing the interconnected nature of these processes. The circular layout facilitates the understanding of how each component influences the others, leading to a more streamlined approach in handling supplier interactions and corrective actions. This template is perfect for presentations in supply chain management, operational reviews, and strategic planning meetings, offering a practical framework for discussing and planning effective supply chain strategies.


4 diapositivas
Execution-Based Strategic Action Plan Presentation
Highlight your execution strategy with this visually striking pinwheel diagram. Each blade represents a focused action step, ideal for showcasing implementation plans or performance initiatives. Fully customizable in PowerPoint, Keynote, and Google Slides—perfect for strategic reviews, team briefings, or progress tracking across four critical areas.


6 diapositivas
AI-Driven Innovation in Business Presentation
Bring your ideas to life with a burst of tech brilliance—this bold, modern layout captures the synergy between artificial intelligence and business innovation. Use it to explore automation, data-driven insights, and future-focused strategies. Fully editable and compatible with PowerPoint, Keynote, and Google Slides for seamless presentation design.


5 diapositivas
Organizational Tree Model
Present team structures or company hierarchies with ease using this Organizational Tree Model slide. With five clearly defined roles branching from a central trunk, it’s perfect for visualizing leadership flow, reporting lines, or role responsibilities. Fully editable in PowerPoint, Keynote, and Google Slides.


6 diapositivas
Dynamic Chart Visual Toolkit Presentation
Visualize data at a glance with the Dynamic Chart Visual Toolkit Presentation. This modern slide set combines revenue boxes, line trends, and circular progress charts to showcase performance metrics or KPIs effectively. Clean, minimal, and fully editable in Canva, PowerPoint, Keynote, or Google Slides—perfect for reports, dashboards, and marketing updates.
21 diapositivas
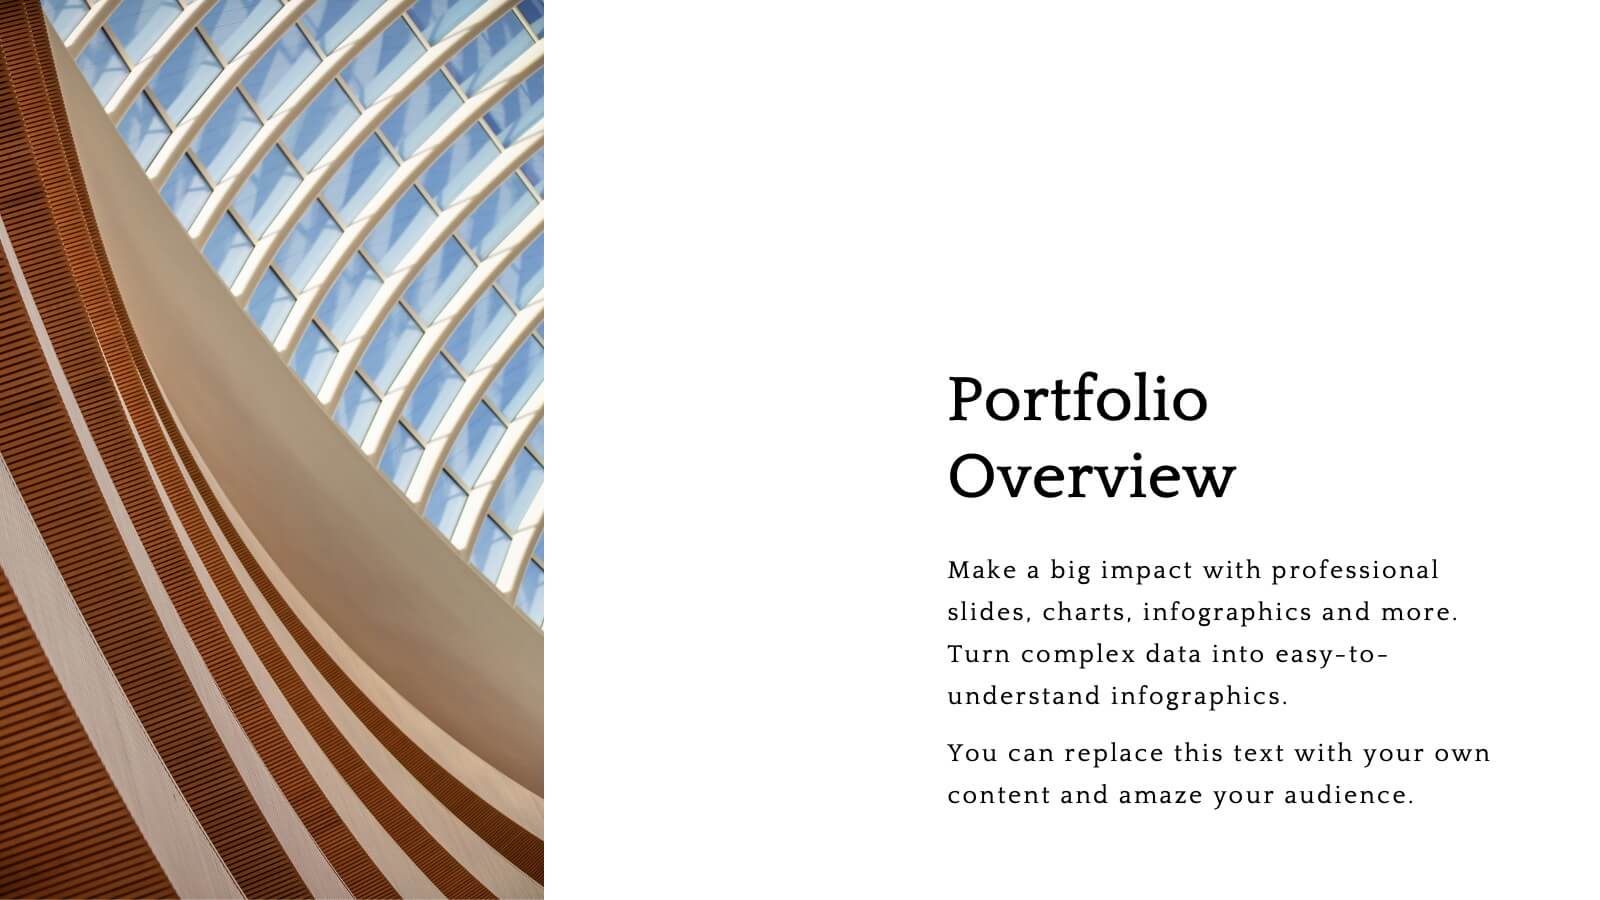
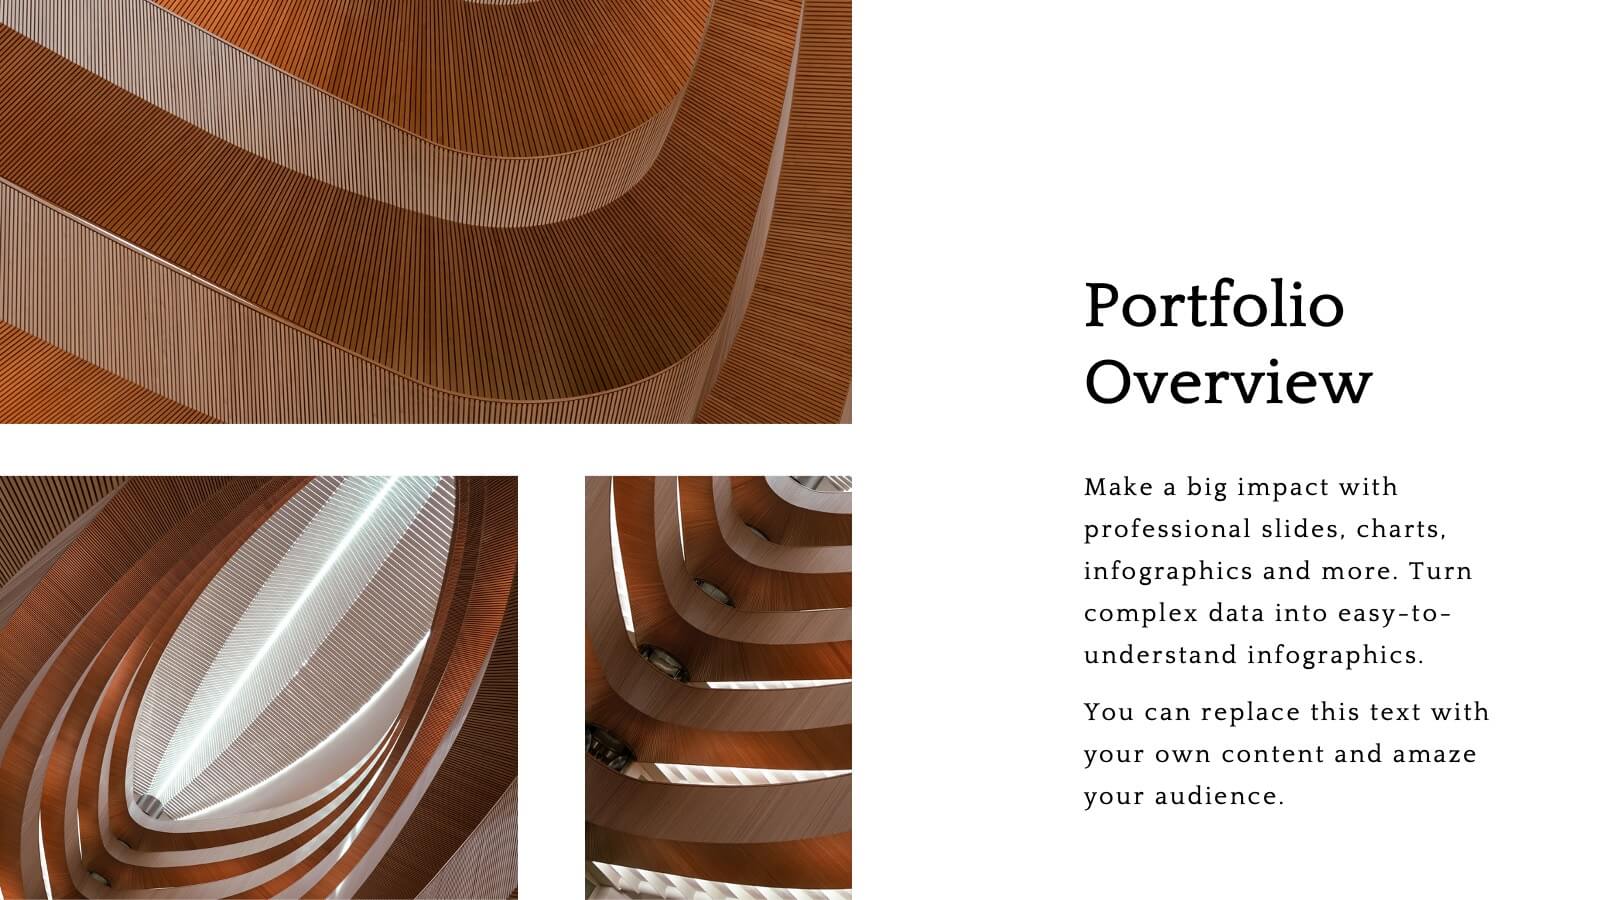
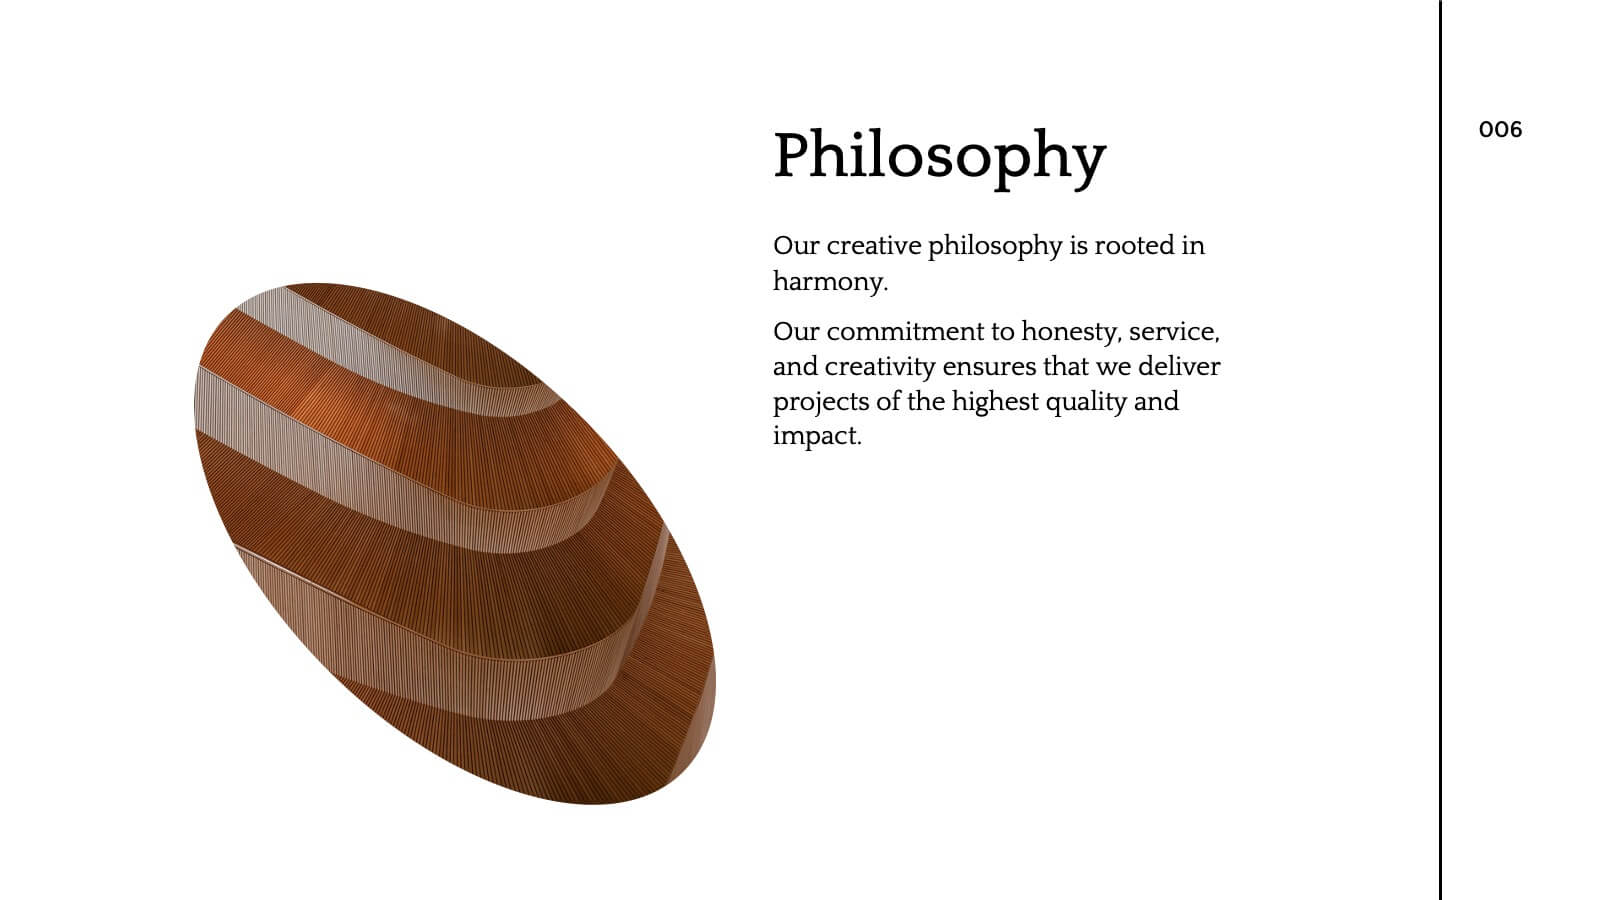
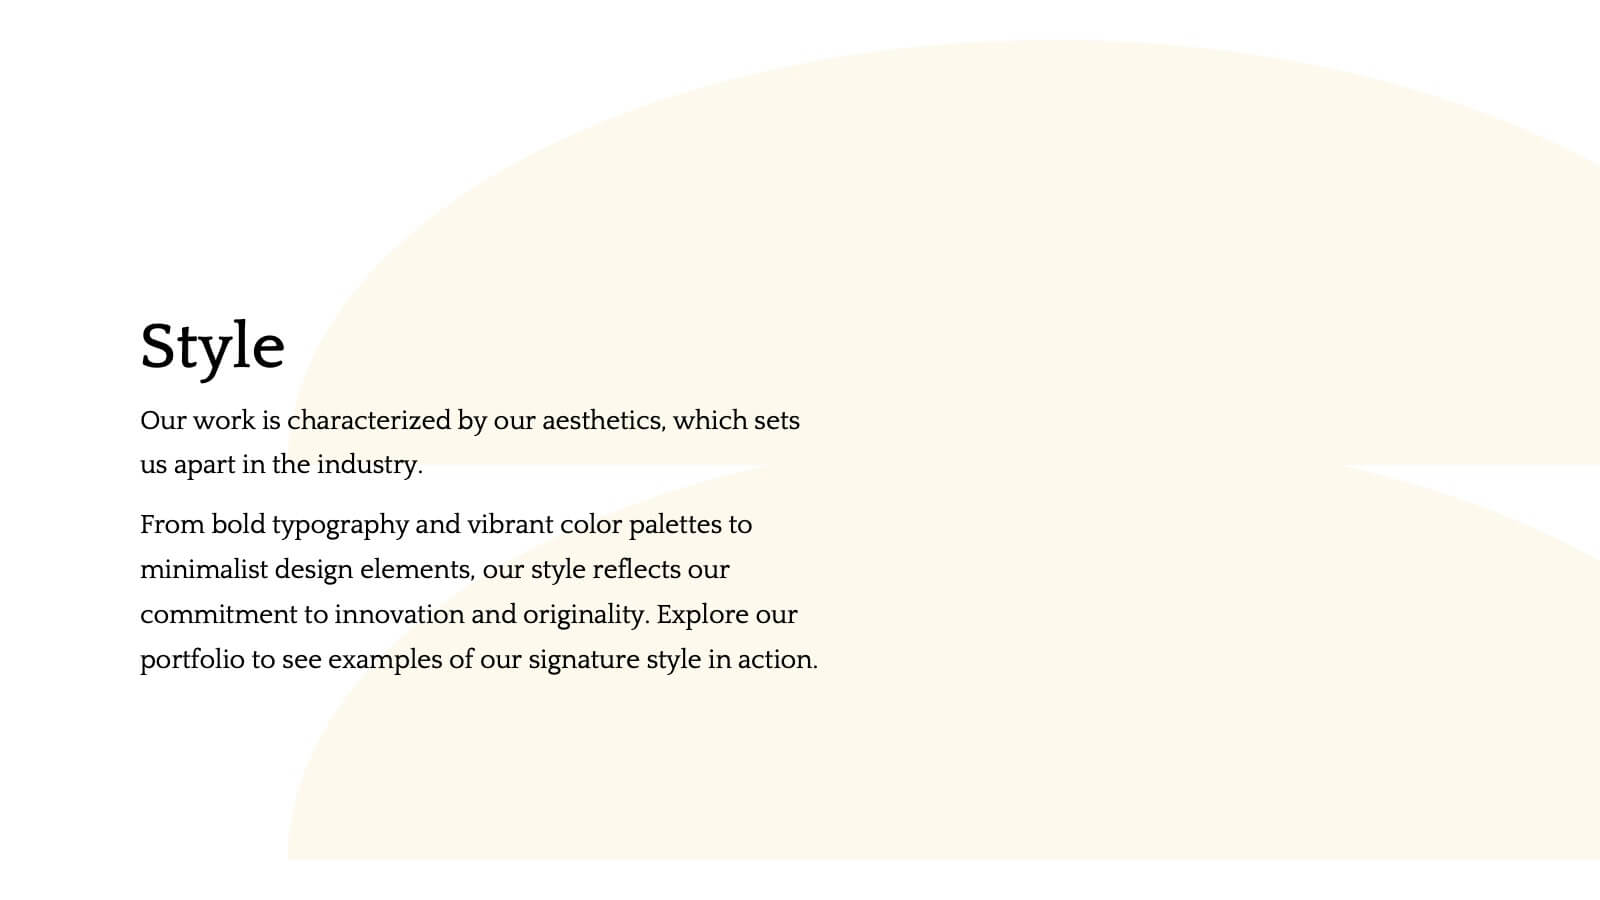
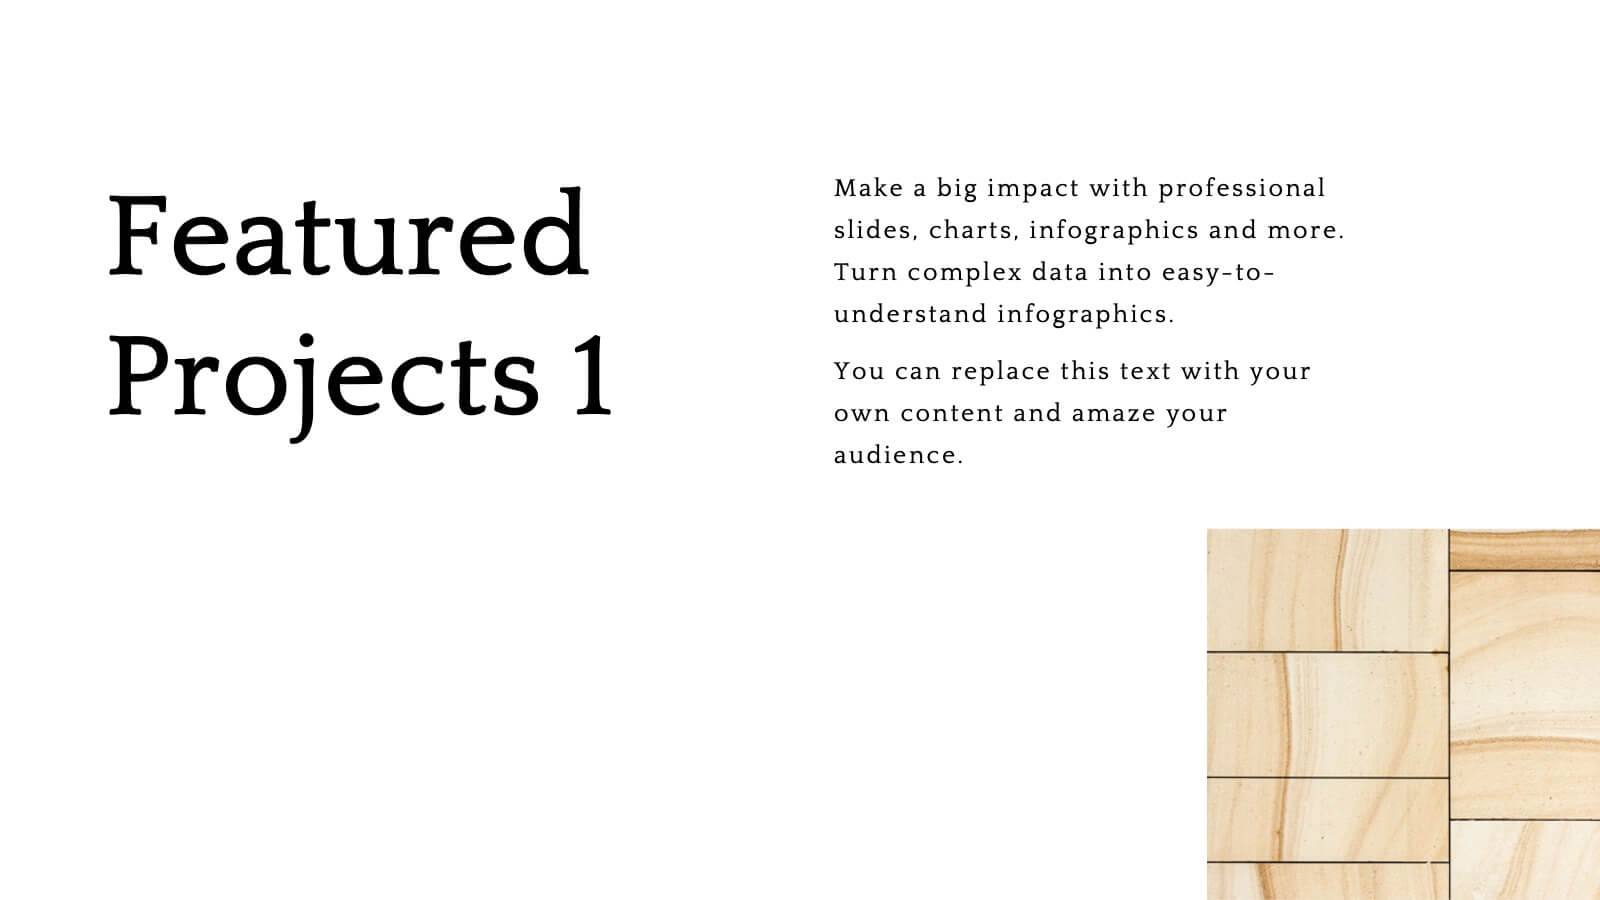
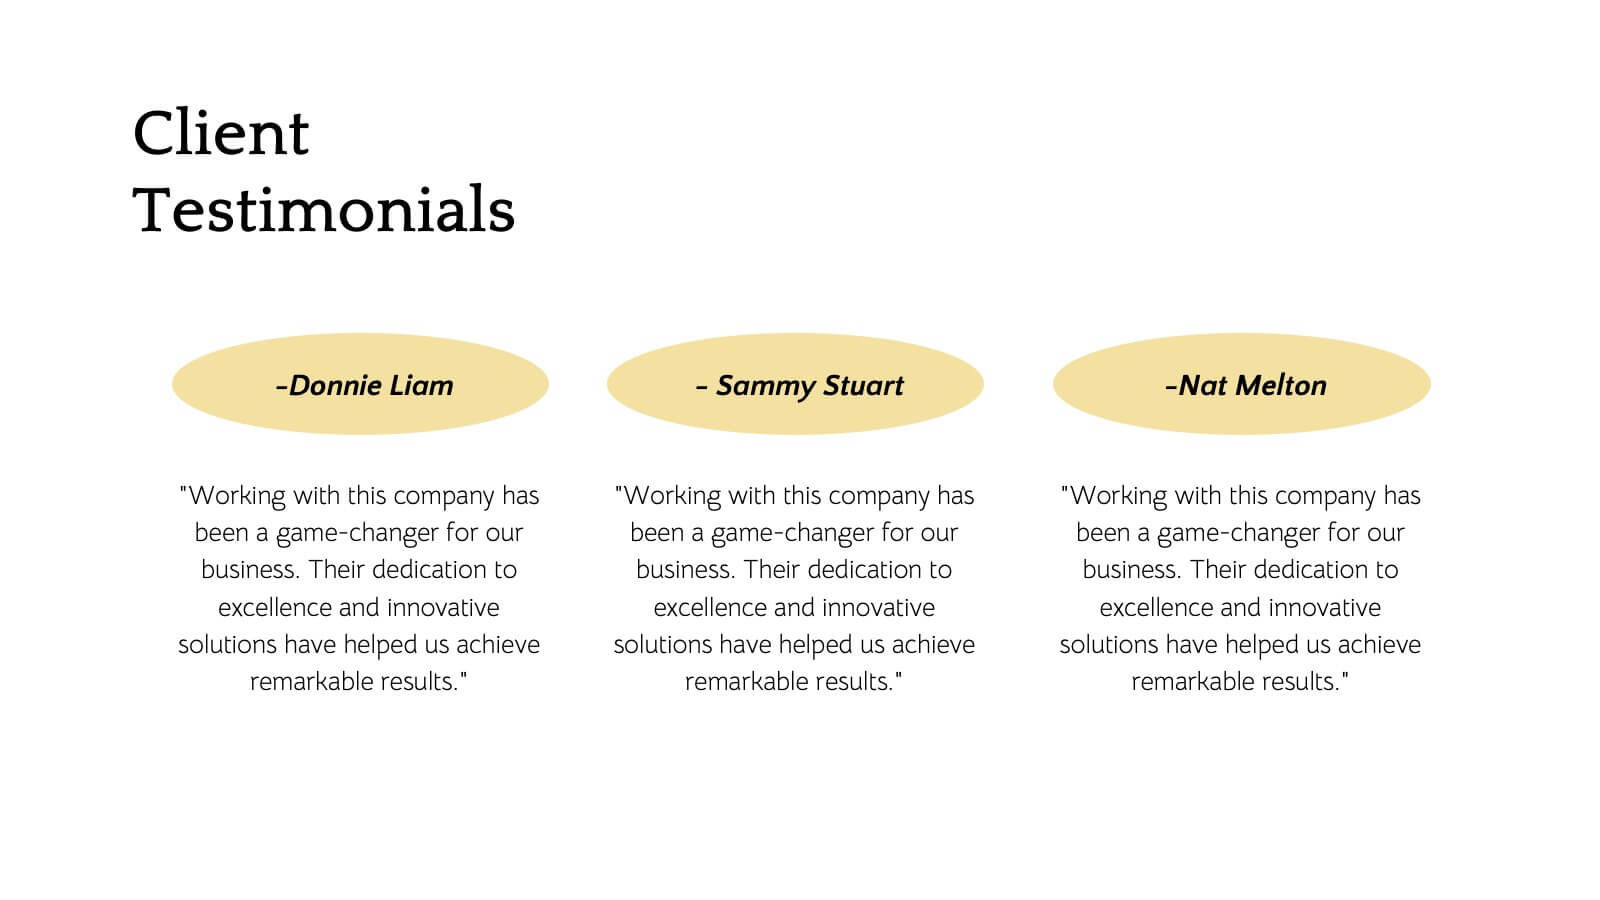
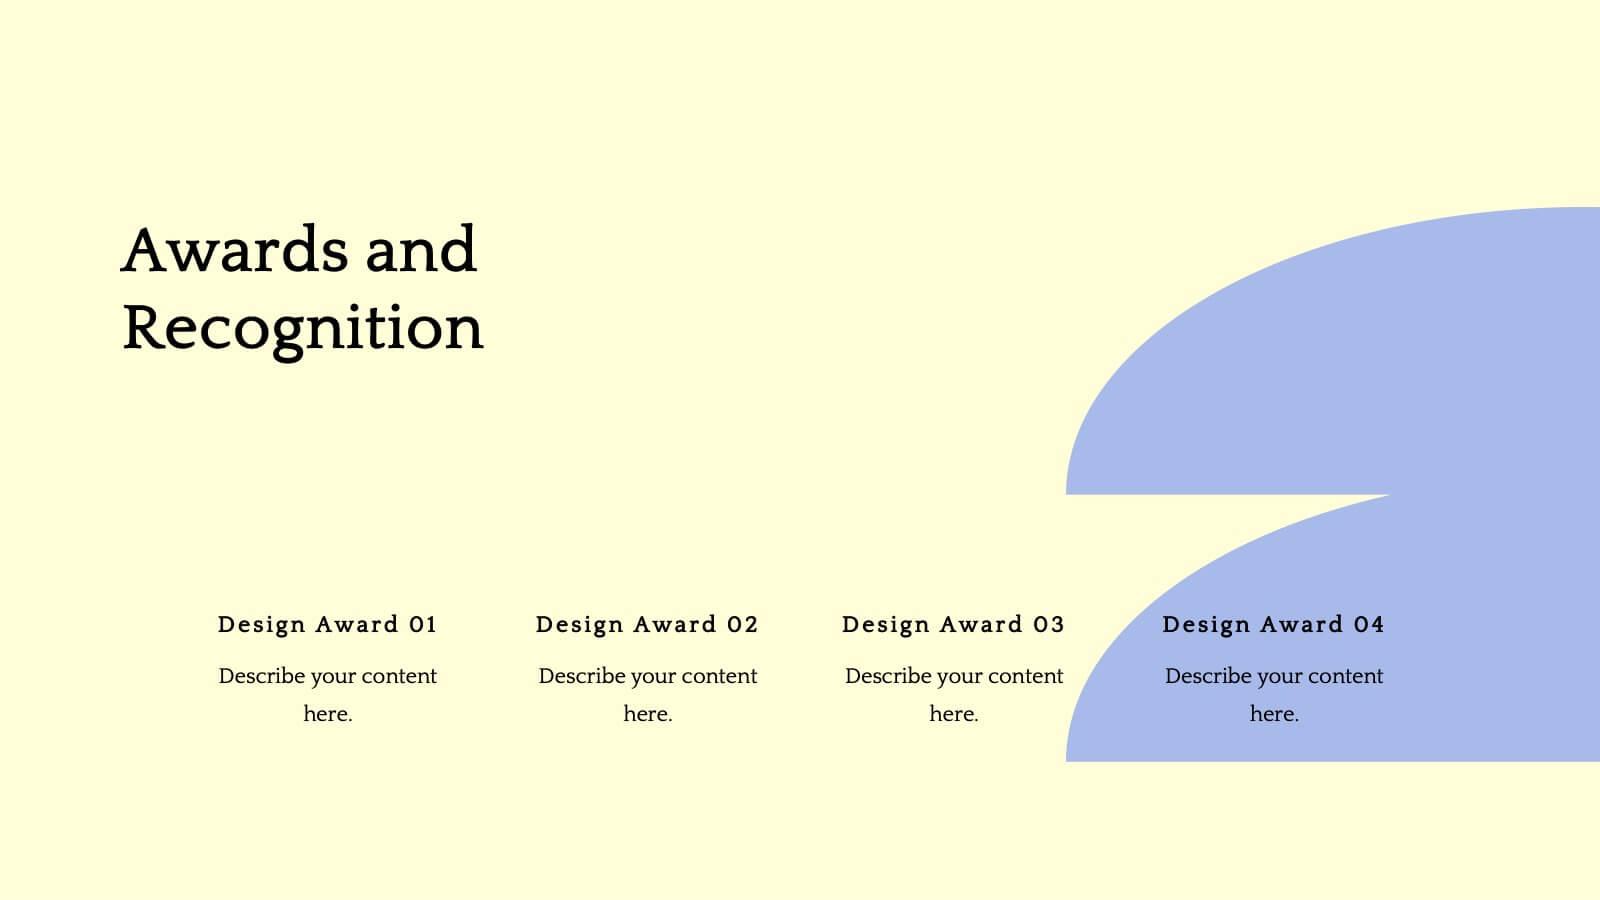
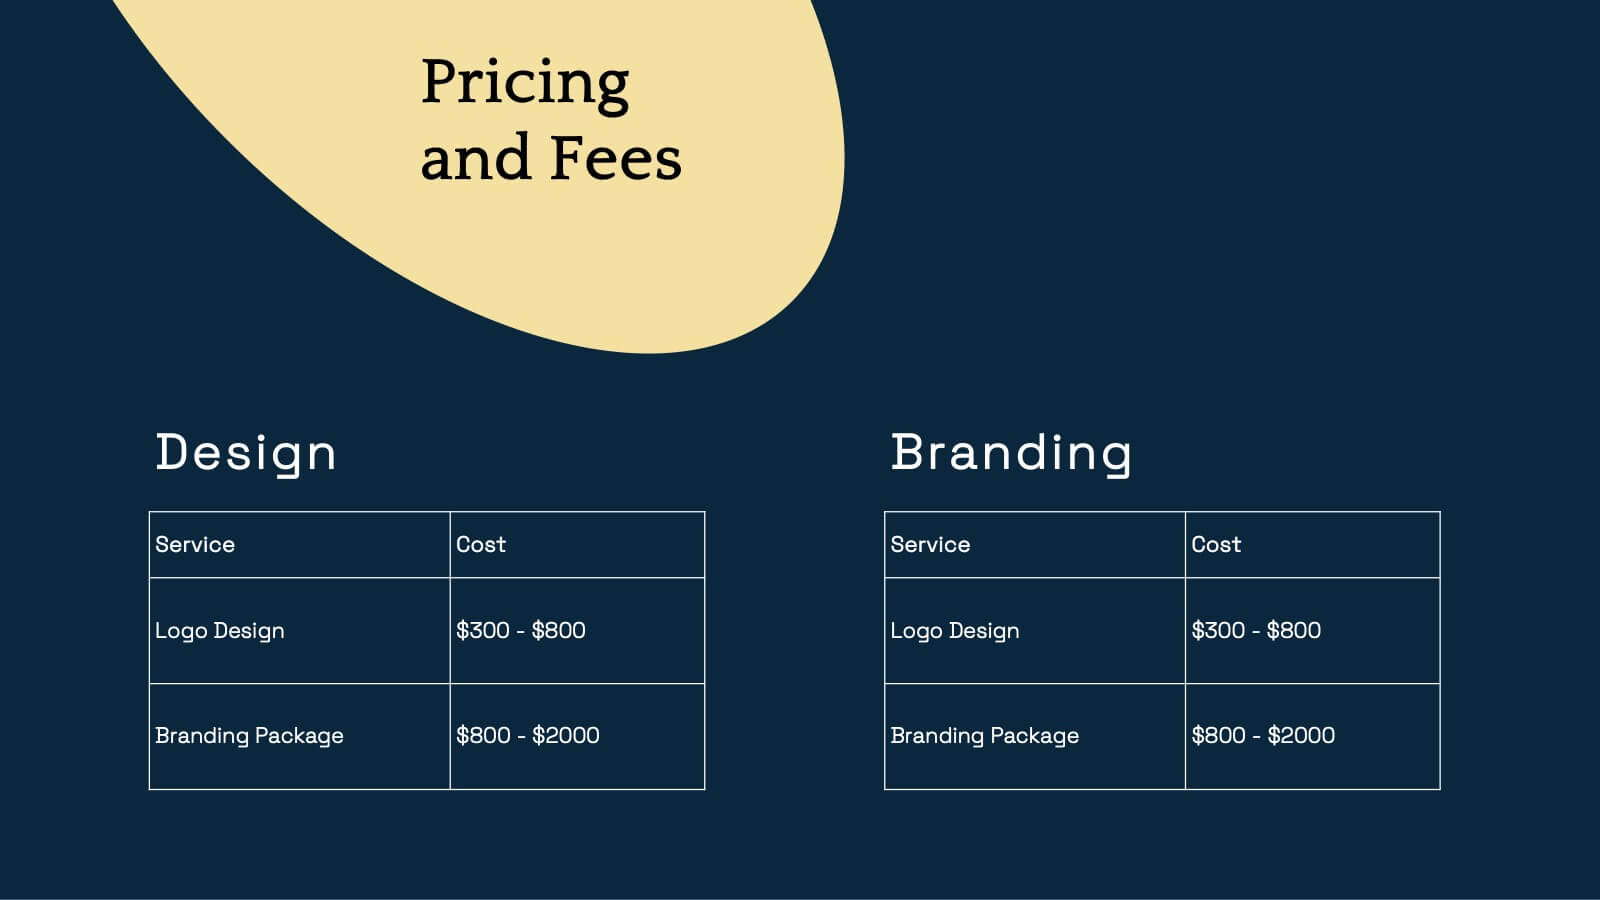
Flare Creative Portfolio Presentation
Showcase your creative work with this elegant portfolio template! Perfect for highlighting projects, client testimonials, and services offered. Ideal for artists, designers, and creatives aiming to impress clients and collaborators. Compatible with PowerPoint, Keynote, and Google Slides, this template ensures your portfolio is clear, professional, and visually stunning. Make your work shine!


8 diapositivas
Startups Pitch Deck Presentation
Bring your idea to life with a bold, energetic layout designed to showcase vision, traction, and future potential. This presentation helps you communicate your business model, strategy, and key insights with clarity and confidence. Clean visuals and structured sections keep your message strong and compelling. Fully compatible with PowerPoint, Keynote, and Google Slides.


7 diapositivas
Smart Goals Infographic
Smart goals are a framework used to create effective and achievable objectives in various contexts, including personal development, business, education, and more. Our smart goals infographic is your roadmap to success. Uncover the power of smart goals - Specific, Measurable, Achievable, Relevant, and Time-bound, and how they can revolutionize your journey towards personal and professional achievement. This Infographic is more than a visual guide; it's an invitation to transform your ambitions into achievements. Discover the power of smart goals, seize control of your destiny, and embark on a path to success like never before.


6 diapositivas
Identifying Market Challenges Presentation
Stay ahead of the competition by breaking down market challenges with this dynamic presentation template! Designed for business strategists, marketers, and analysts, this layout helps you visually structure key obstacles and opportunities. Perfect for market research and competitive analysis. Fully customizable and compatible with PowerPoint, Keynote, and Google Slides.


4 diapositivas
Company Long-Term Vision Presentation
Craft your company's roadmap with our "Company Long-Term Vision" presentation template. This design lets you vividly showcase your strategic direction and future goals through a modern, image-centric layout. Ideal for board meetings and stakeholder briefings, it supports PowerPoint, Keynote, and Google Slides, ensuring you can reach your audience on any platform. Utilize this template to clearly communicate your vision and drive your organization forward.


4 diapositivas
Budget Projection with Predictive Analysis Presentation
Visualize future financial outcomes with clarity using the Budget Projection with Predictive Analysis Presentation. This modern funnel-style layout helps break down key stages of budget forecasting, making it easy to communicate progressions and data-driven insights. Perfect for financial planning, reporting, or strategic reviews. Fully editable in PowerPoint, Google Slides, Keynote, and Canva.


5 diapositivas
Mind and Brain Creativity Concept Diagram Presentation
Ignite fresh thinking with the Mind and Brain Creativity Concept Diagram Presentation—a smart and visually engaging template that maps out five core concepts around a central brain icon. Each idea is linked with intuitive visuals and labeled A through E, ideal for creative strategy, innovation pitches, or mental model breakdowns. Fully customizable in PowerPoint, Keynote, and Google Slides.


6 diapositivas
Six Sigma Process Infographic
Dive into the world of process improvement with our six sigma process infographic. Crafted with a harmonious blend of blue, yellow, and white, this infographic elucidates the principles of Six Sigma methodology in an engaging manner. Ideal for business analysts, quality assurance teams, and corporate trainers, it delineates the DMAIC process in vivid detail. The design encapsulates the rigorous methodology of Six Sigma, providing clarity and fostering knowledge retention. This versatile template is a perfect fit for PowerPoint, Keynote, and Google Slides, making your presentations both captivating and insightful.


6 diapositivas
Credit Card Comparison and Benefits Presentation
Clearly compare features, perks, and advantages of different credit card options using this visually dynamic infographic slide. With side-by-side sections, icons, and clean labeling, this layout makes it easy to present pros and cons, reward tiers, or service details. Ideal for financial services, banking presentations, or consumer education. Compatible with PowerPoint, Keynote, and Google Slides for seamless customization.


5 diapositivas
Corporate Office Life Illustration Scene Presentation
Bring your workplace concepts to life with this modern office scene illustration. Featuring a top-down view of diverse team members in a meeting, this slide is perfect for showcasing collaboration, brainstorming, or teamwork insights. Fully customizable and compatible with PowerPoint, Keynote, and Google Slides for seamless editing.