


Características


¿Tienes alguna pregunta?
Recomendar


21 diapositivas
Sonicwave Market Analysis Report Presentation
A vibrant, modern template designed for market analysis presentations. Covers agenda, key highlights, metrics, financial summaries, competitor insights, and strategic initiatives. Ideal for professionals presenting data-driven insights on trends and performance. Fully customizable in PowerPoint, Keynote, and Google Slides for business, marketing, and analytical reporting needs.


5 diapositivas
Creative Geometric Layouts Presentation
Give your content a fresh, modern spark with bold geometric elements that guide attention and create a clean visual rhythm. This presentation helps you structure ideas clearly, highlight key sections, and maintain a polished, creative look throughout your slides. Fully editable and compatible with PowerPoint, Keynote, and Google Slides.


4 diapositivas
Social Campaign Planning Presentation
Bring clarity to your outreach goals with a bold, funnel-style layout that makes every campaign step easy to visualize. This presentation helps you outline stages, objectives, and audience actions in a clean, structured format ideal for marketing teams. Fully editable and compatible with PowerPoint, Keynote, and Google Slides.


13 diapositivas
Key Performance Indicators (KPI) Presentation
Track success with the Key Performance Indicators (KPI) Presentation template. This data-driven layout showcases essential metrics, from social media engagement to financial performance, helping you visualize progress and optimize strategies. Perfect for business reports, marketing analysis, and executive dashboards. Fully customizable in PowerPoint, Keynote, and Google Slides for seamless integration into your workflow.


4 diapositivas
Stakeholder Analysis and Engagement Presentation
Enhance your strategic planning with our Stakeholder Analysis and Engagement Presentation template. Designed to map influence and interest effectively, this tool aids in identifying key stakeholders and tailoring engagement strategies. It’s compatible with PowerPoint, Keynote, and Google Slides, perfect for impactful presentations and workshops.


7 diapositivas
Customer Thank You Infographic
Elevate your expressions of gratitude with this sophisticated collection, designed to blend elegance with heartfelt thanks. Each piece in this set is crafted with meticulous attention to detail, featuring a mix of subtle color palettes, elegant typography, and beautifully arranged visual elements to enhance the sincerity of your message. Choose from a variety of designs, ranging from minimalist to more richly layered compositions, each providing a unique way to communicate appreciation. These designs can be customized to suit any occasion, making them perfect for expressing professional thanks to clients, customers, or partners. Ideal for use across both digital and physical mediums, this collection helps ensure that your messages not only convey thanks but also resonate deeply with recipients, strengthening relationships and leaving a memorable impression.


20 diapositivas
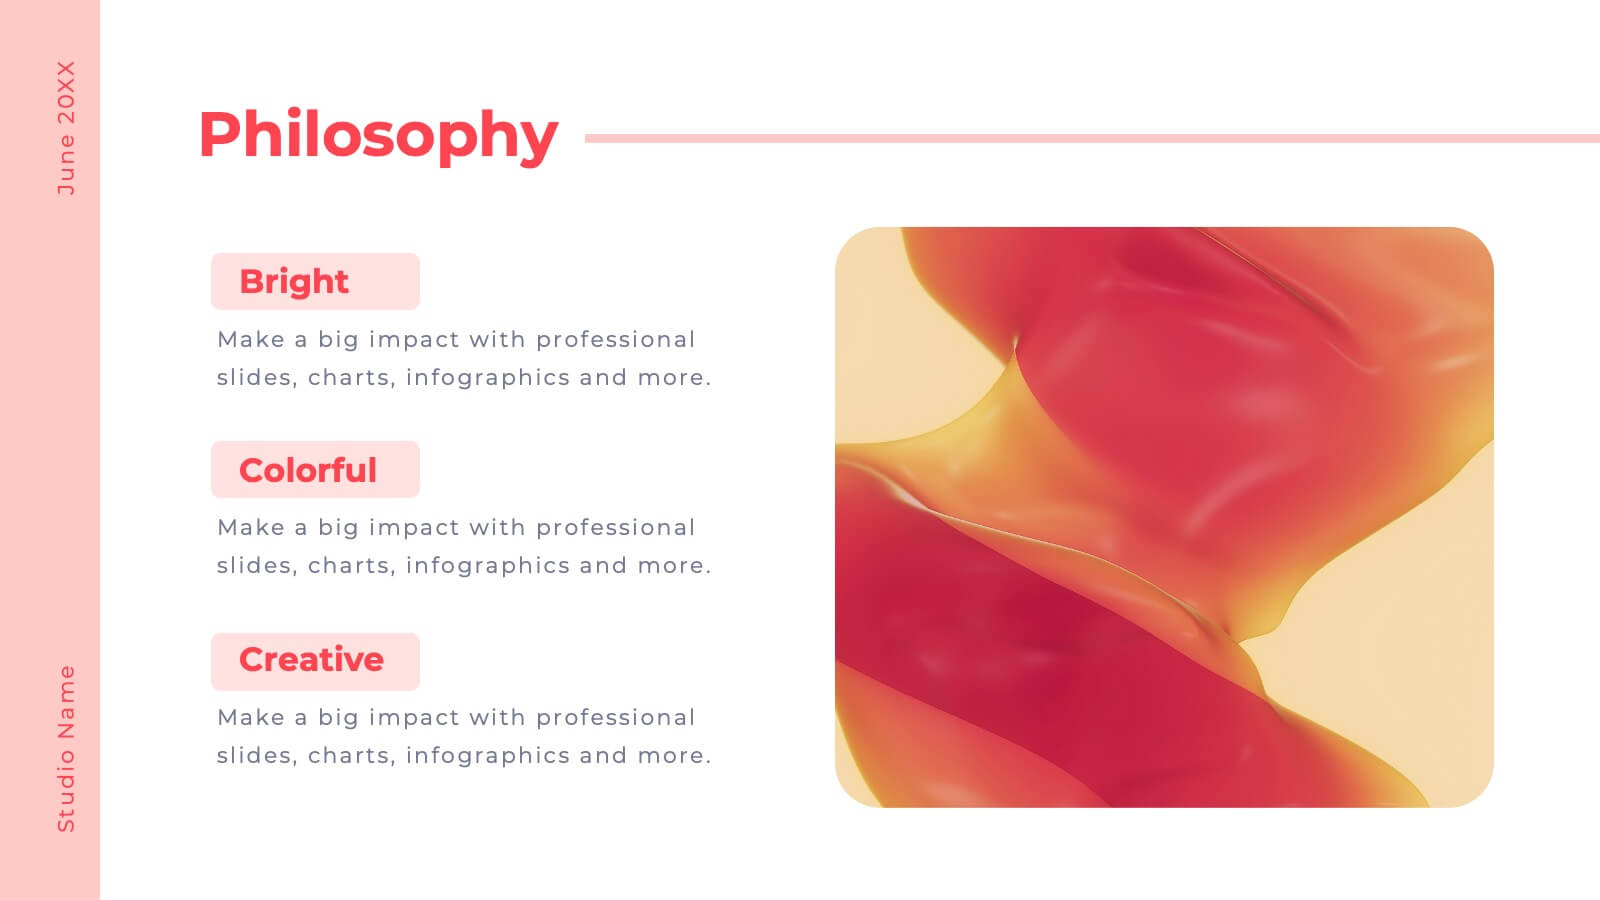
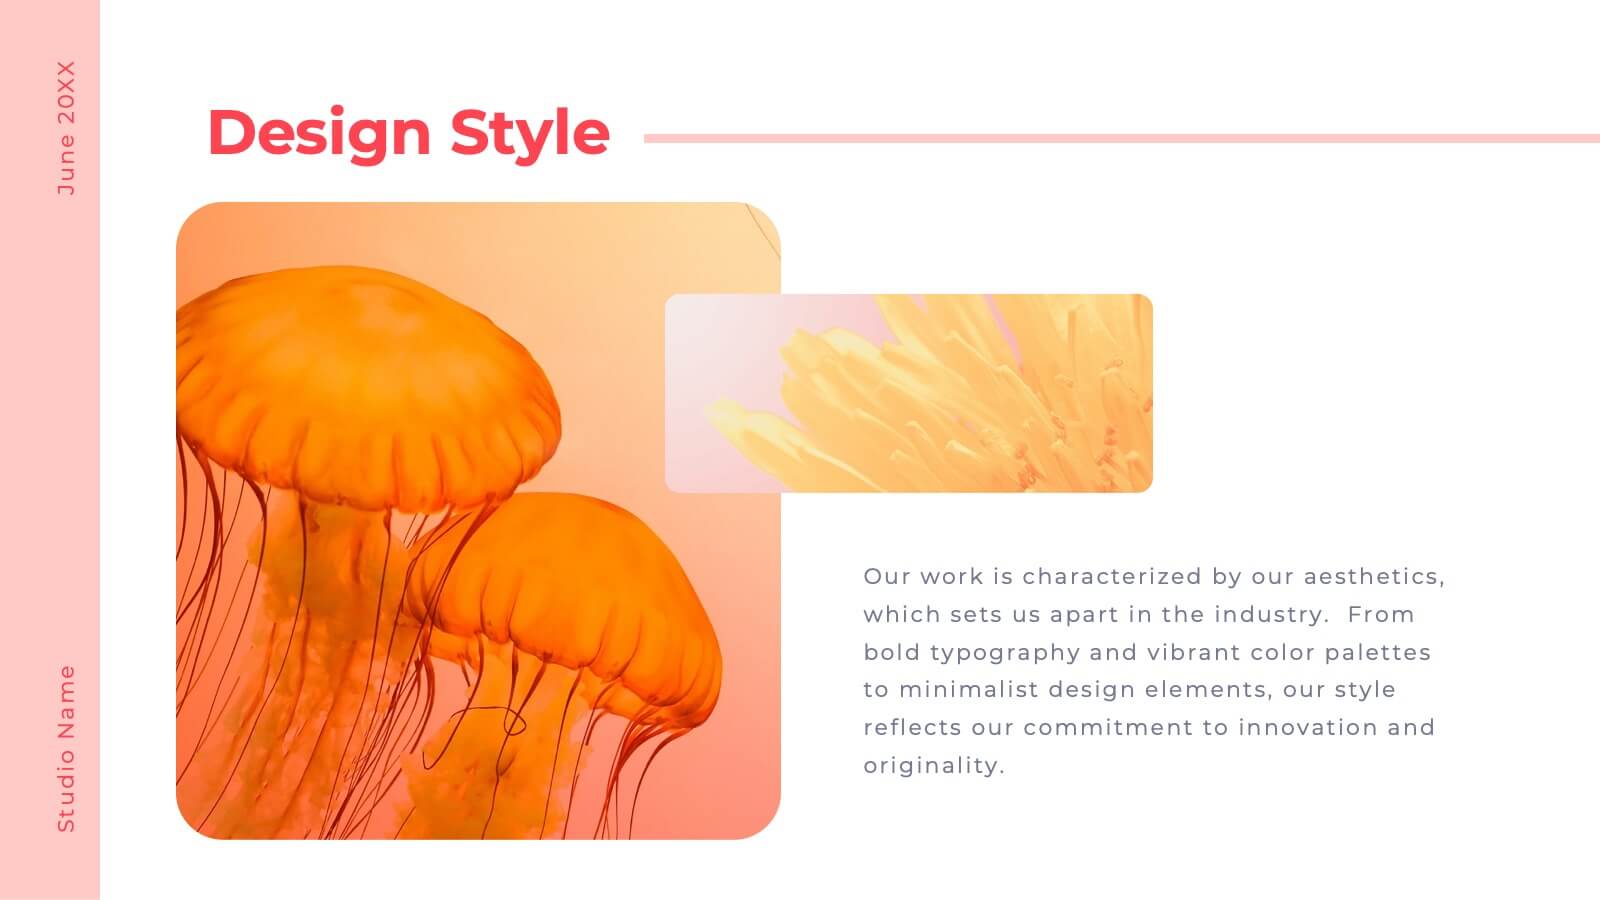
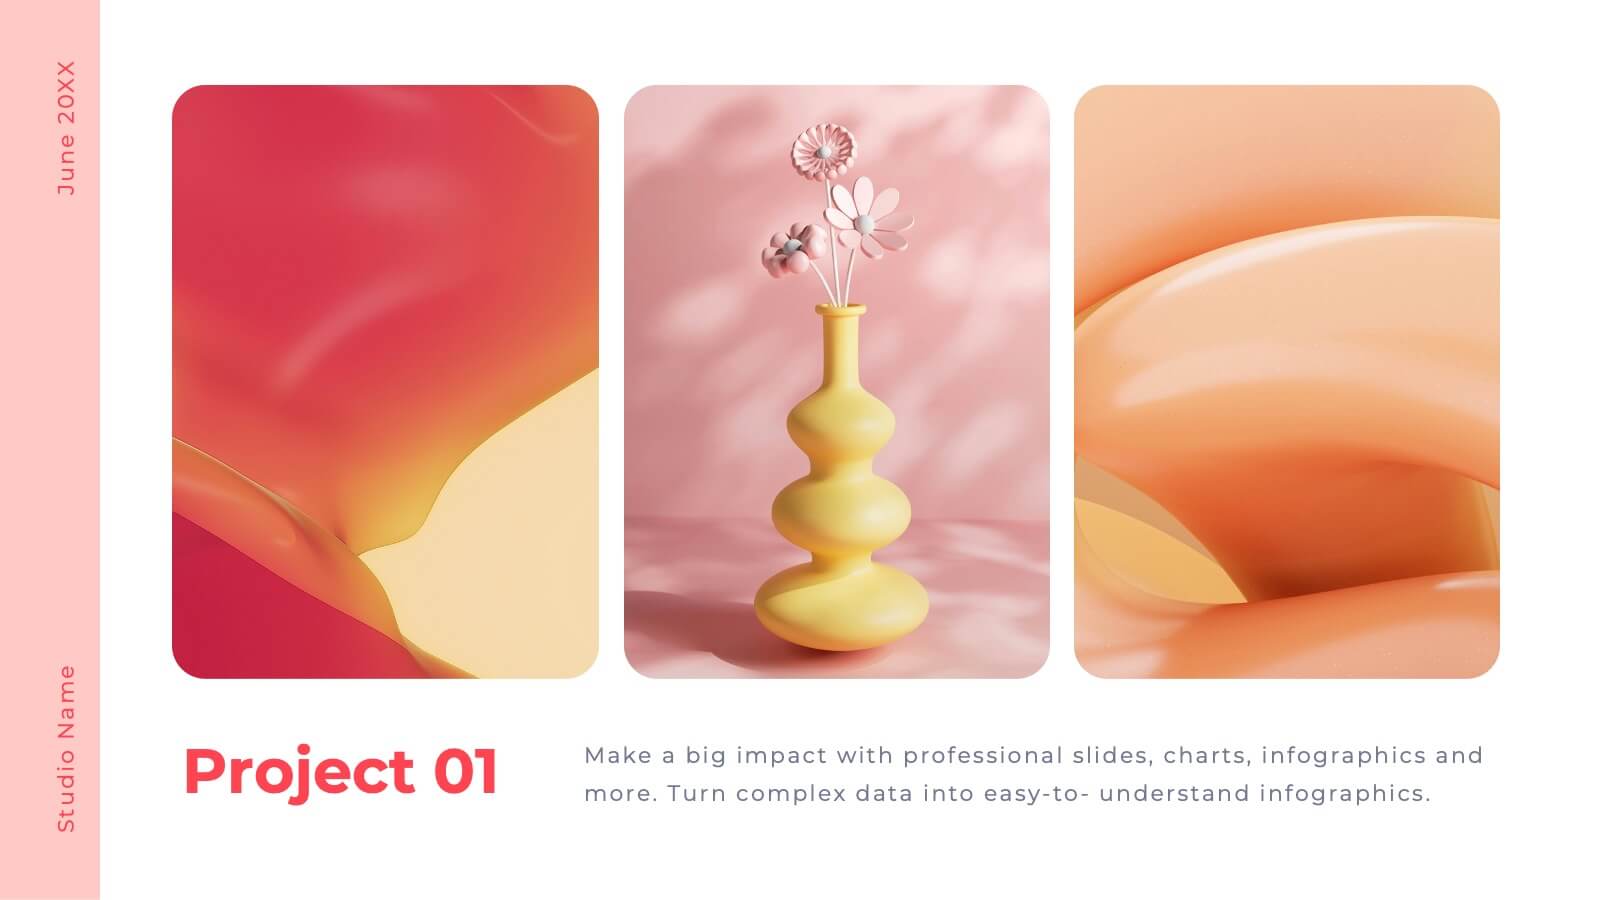
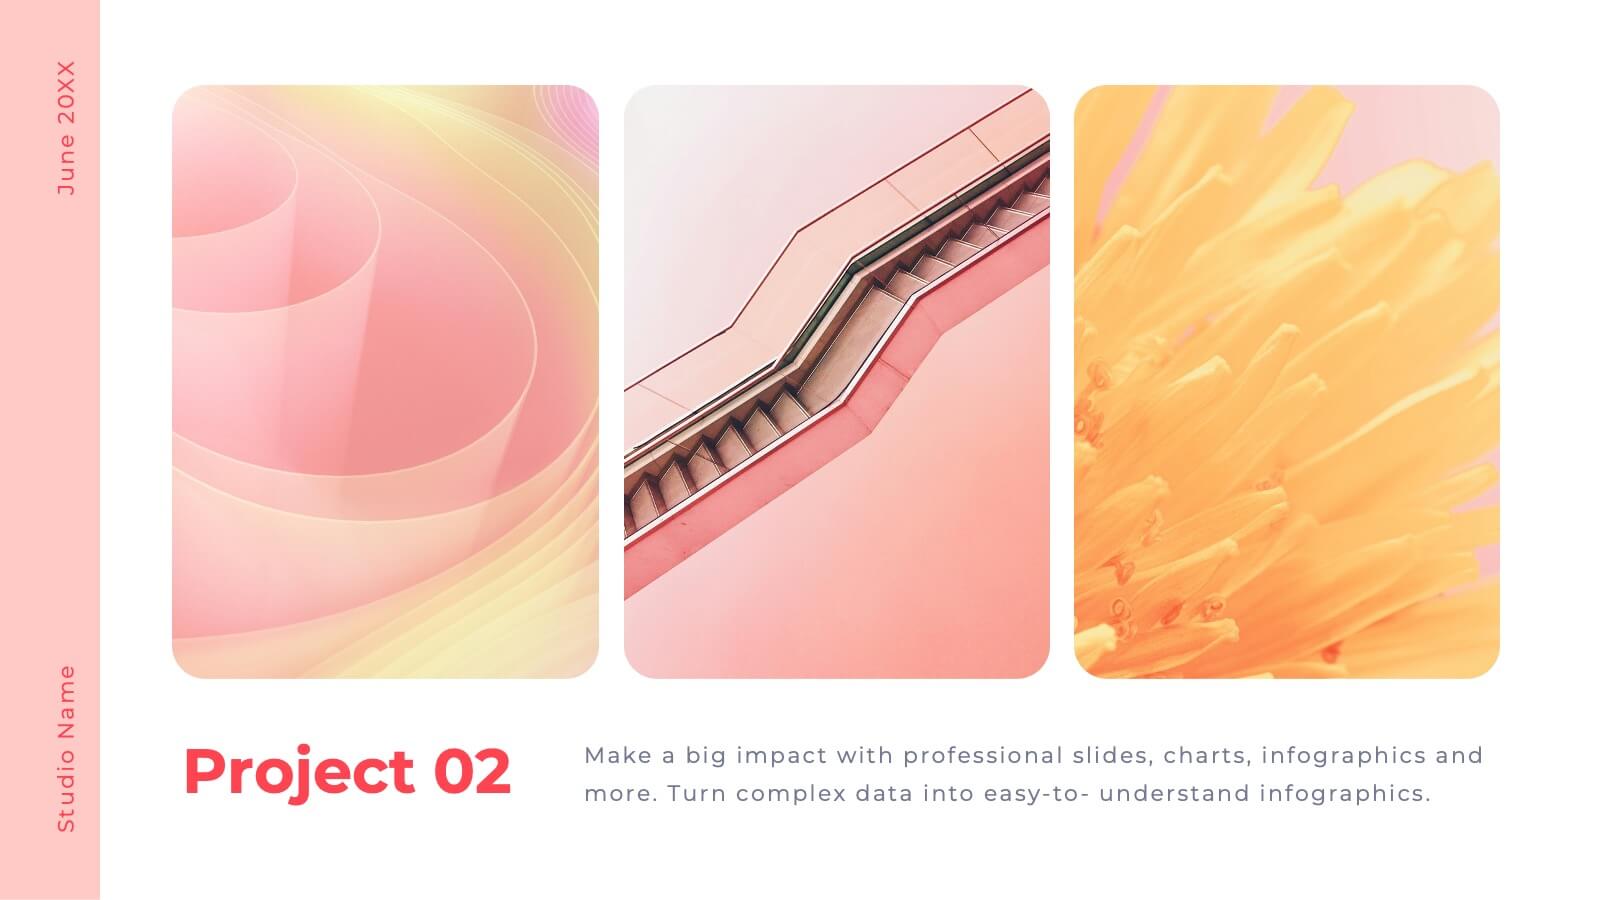
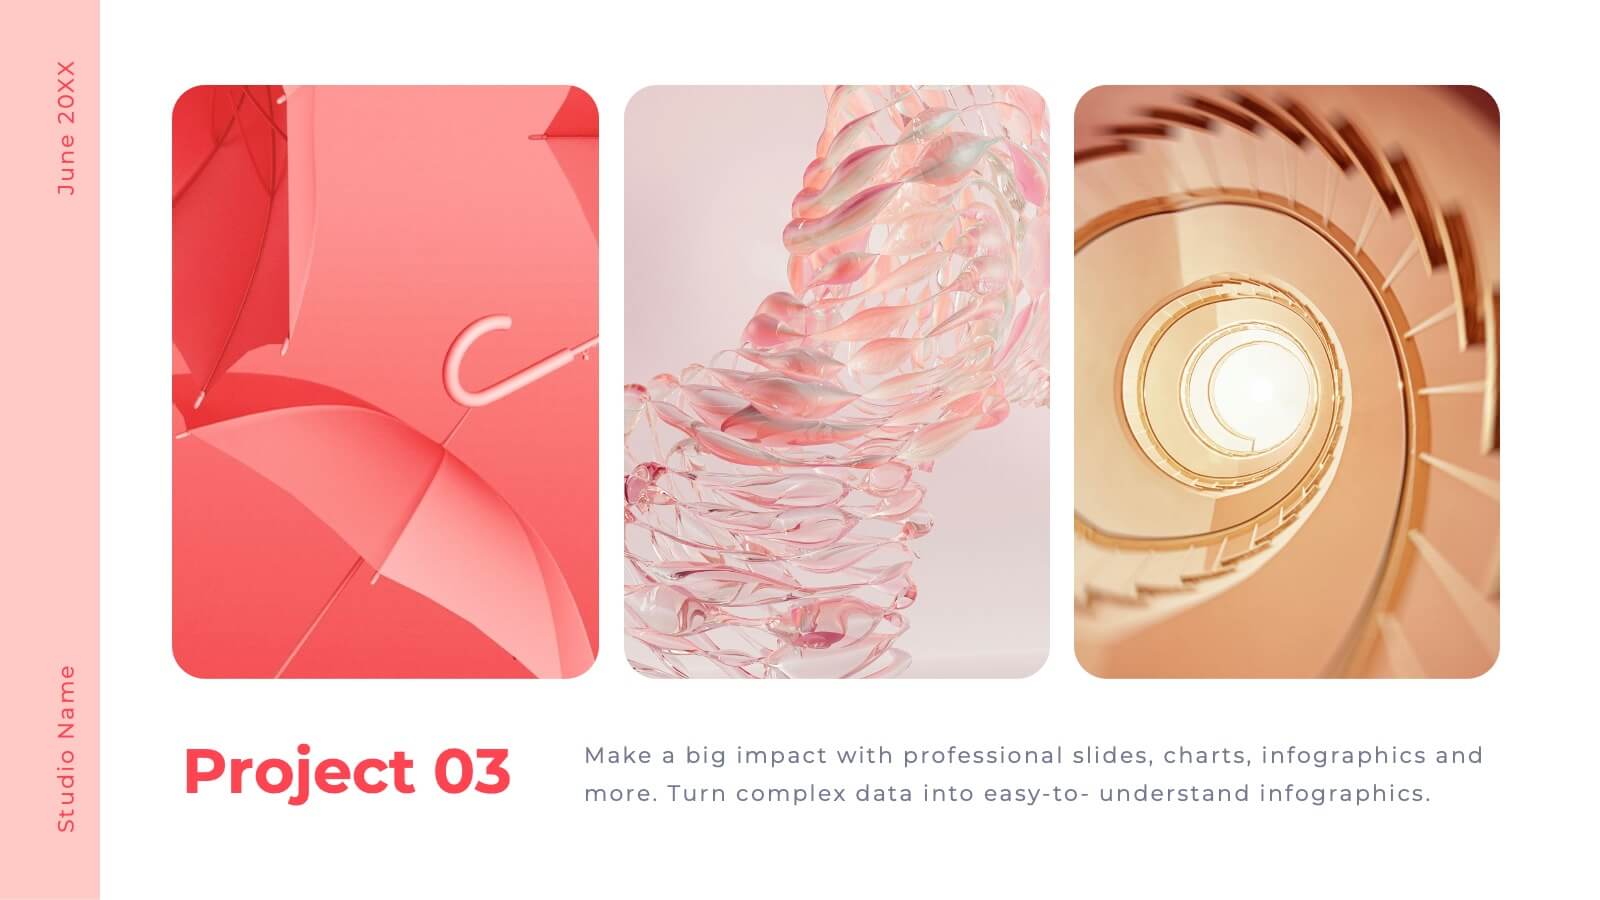
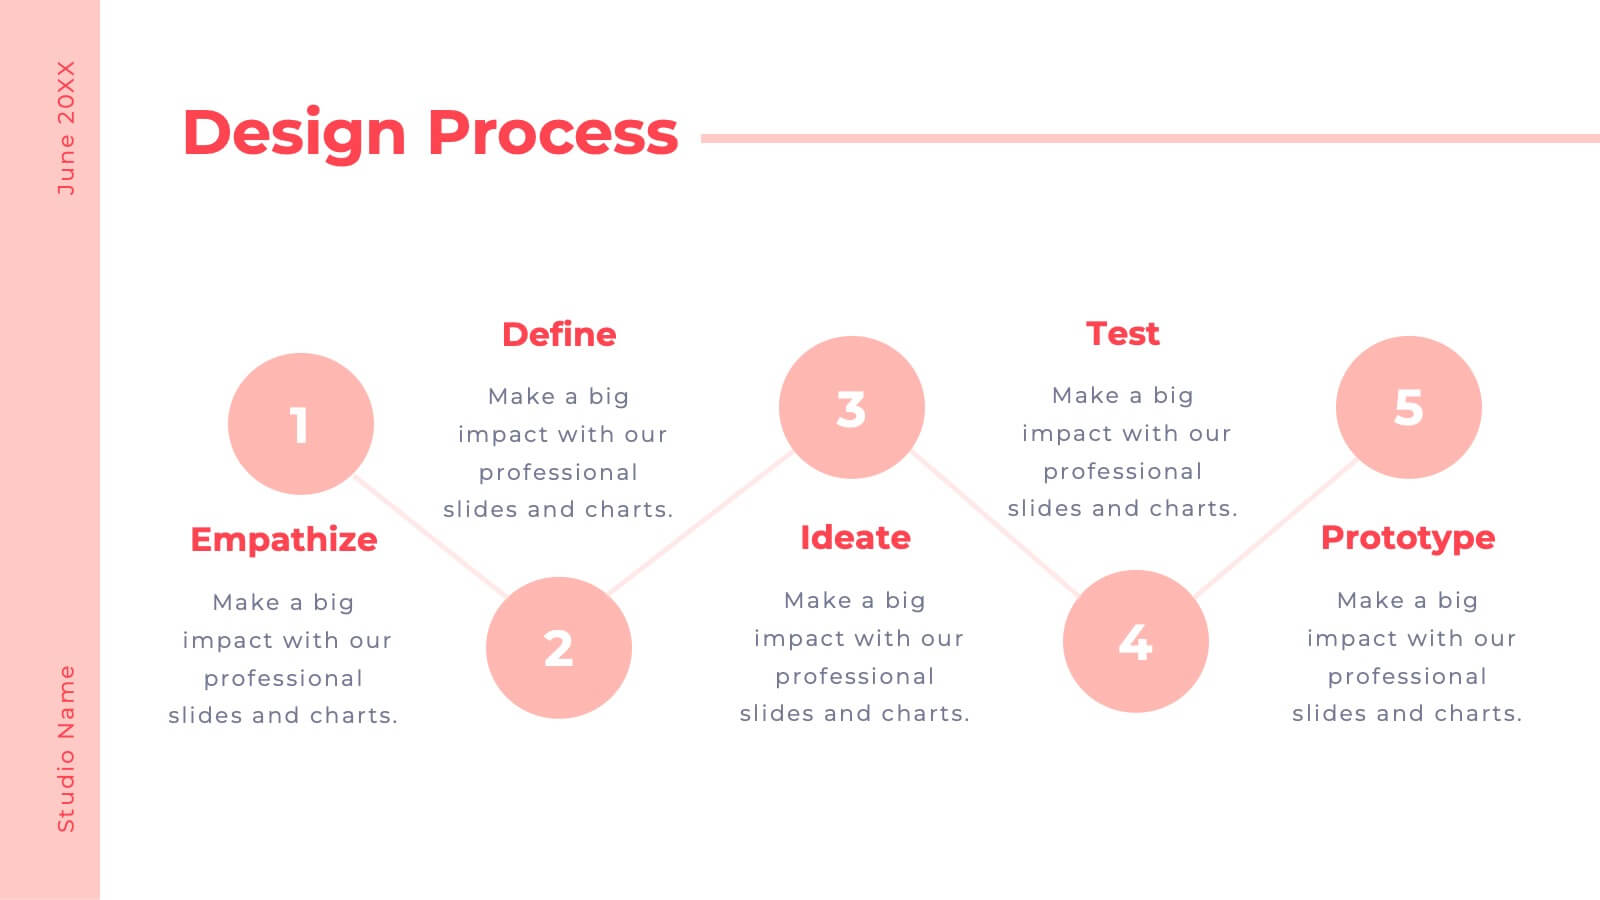
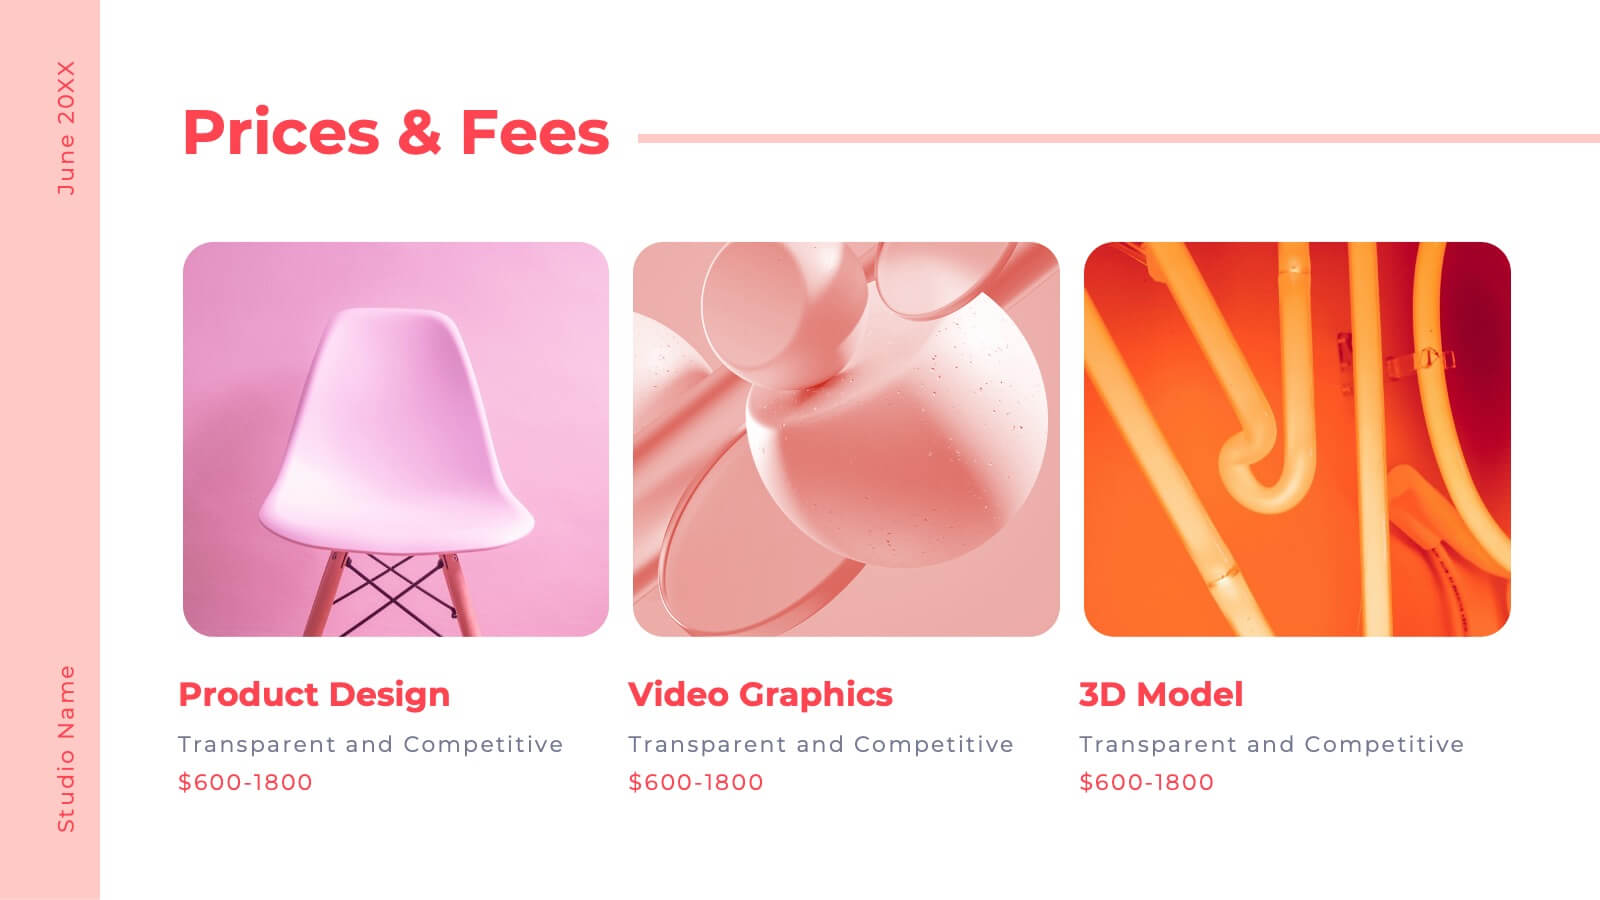
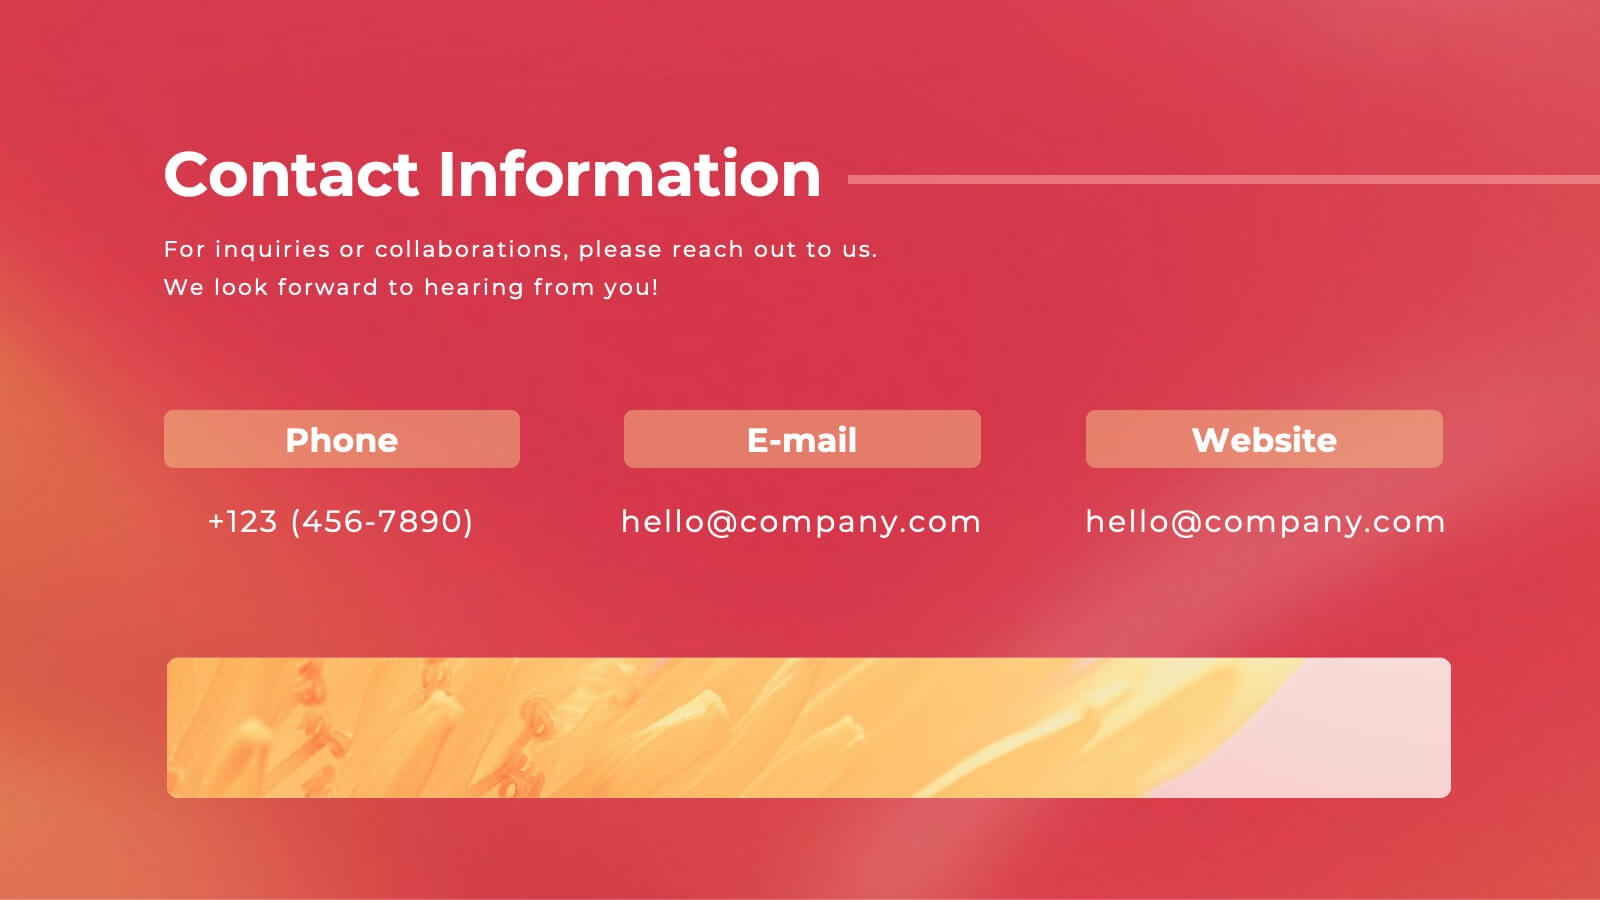
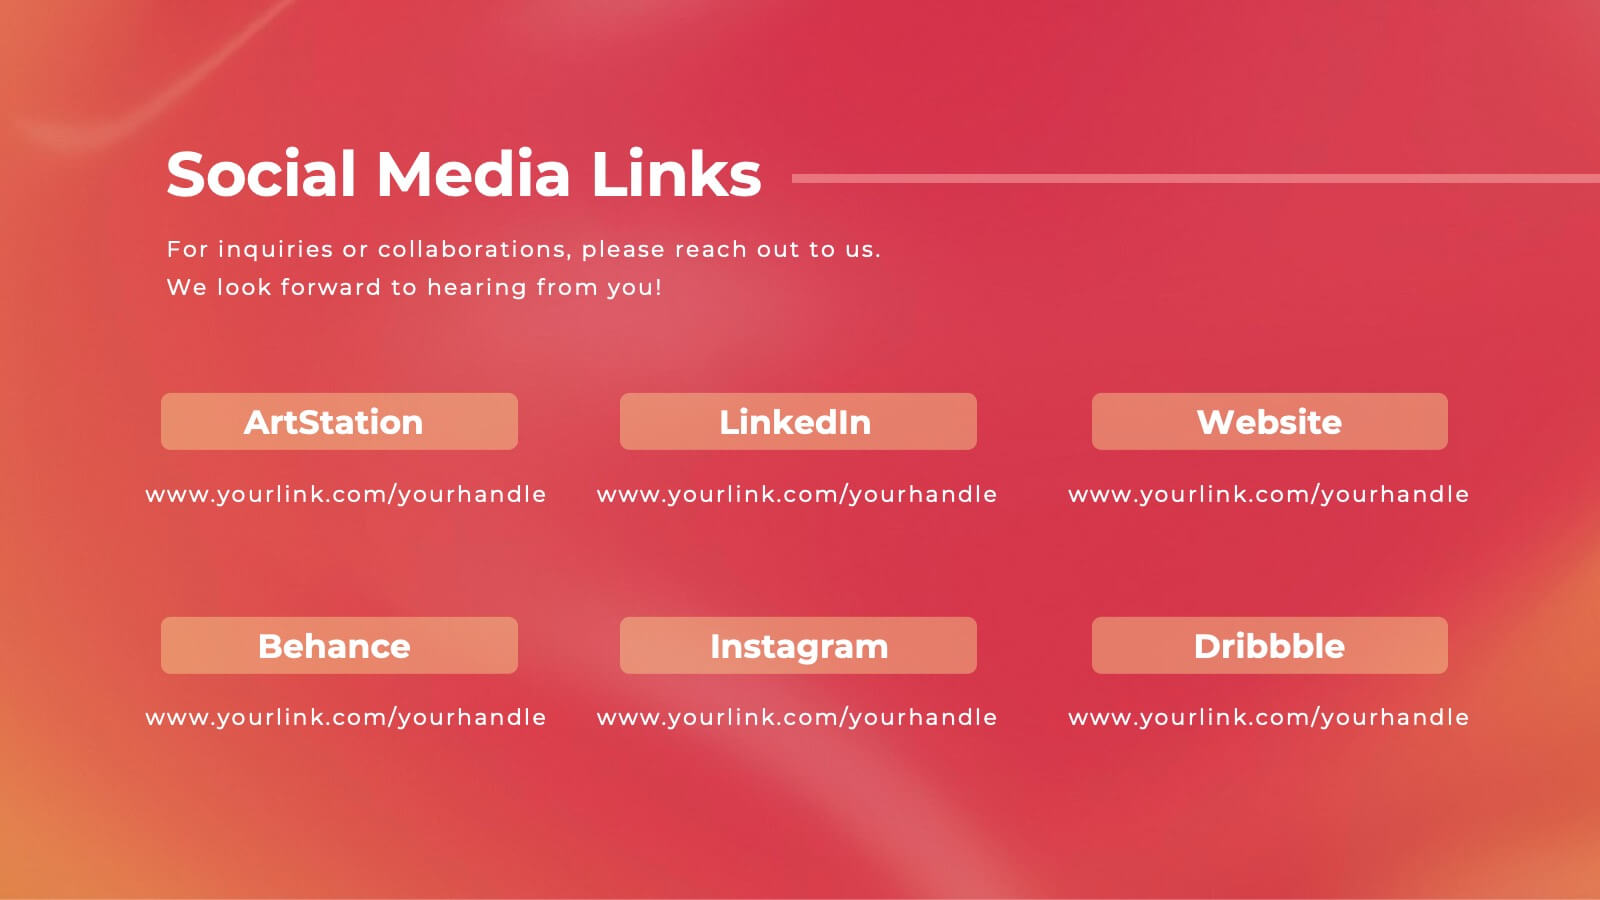
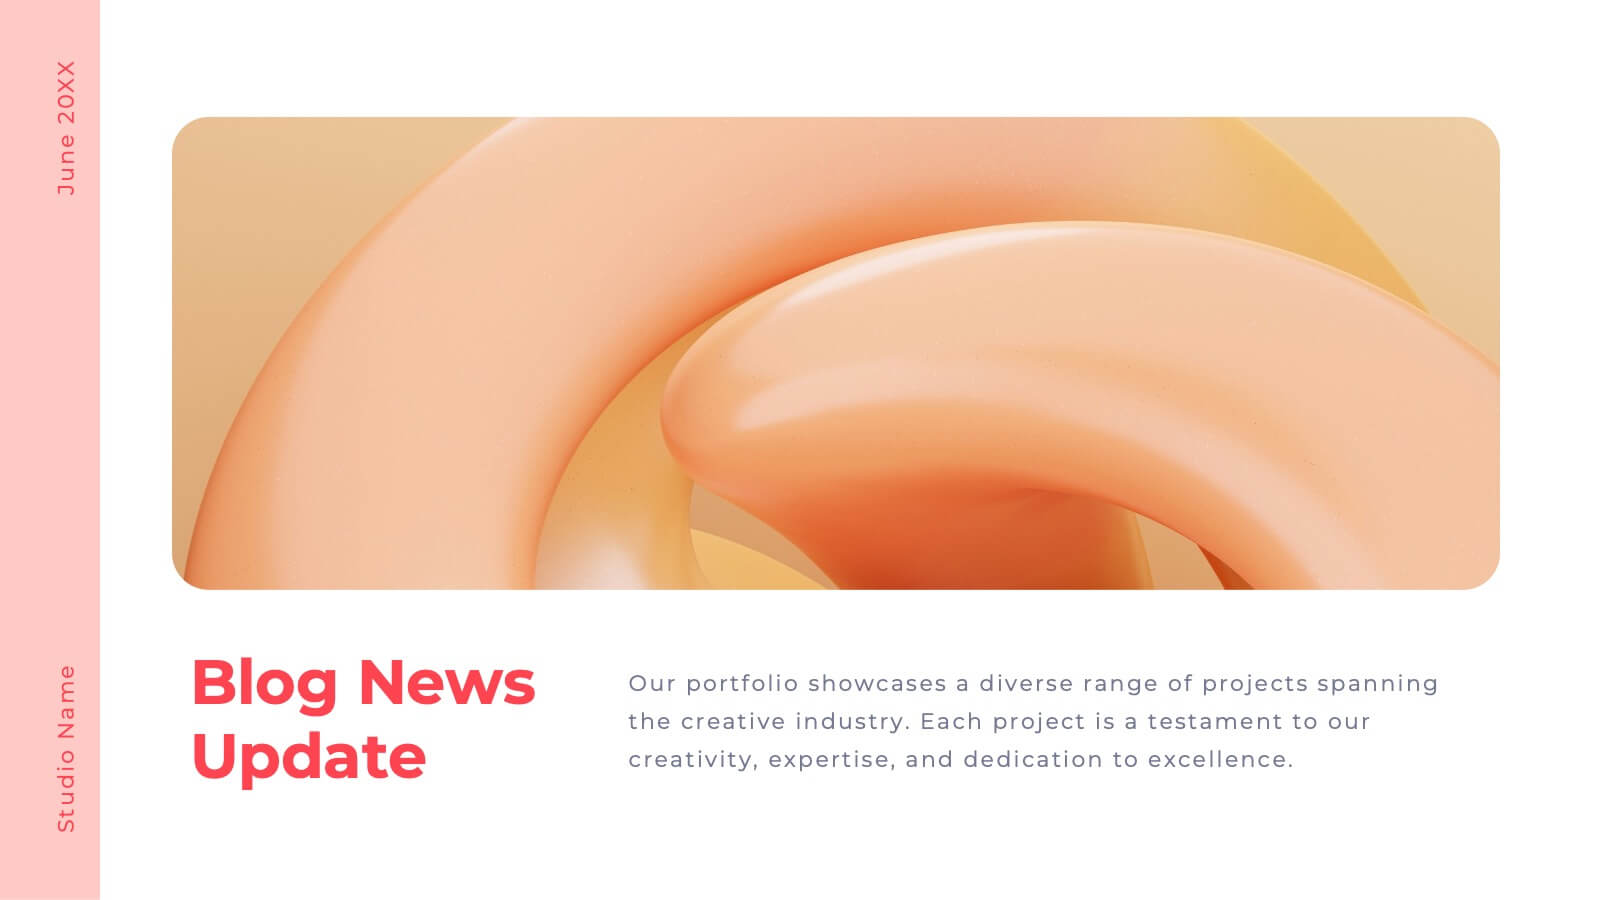
Valor Creative Portfolio Presentation
Step into creativity with this stunning portfolio template! Showcase your projects, design philosophy, and client testimonials with style and flair. Ideal for designers, artists, and creatives wanting to impress. Compatible with PowerPoint, Keynote, and Google Slides, this template elevates every portfolio to new heights. Perfect for making a lasting impact.


5 diapositivas
Behavioral Psychology in the Workplace Presentation
Boost employee engagement and team dynamics with the Behavioral Psychology in the Workplace Presentation. This slide deck is designed to help HR leaders, managers, and consultants visualize psychological insights that shape workplace behavior. Use it to present motivation theories, behavioral models, or communication styles. Fully editable in Canva, PowerPoint, Google Slides, and Keynote.


6 diapositivas
Breast Cancer Effects Infographic
Breast Cancer Awareness Month, is an annual international health campaign organized by various organizations to raise awareness about breast cancer, highlight the importance of early detection and treatment, and provide support for those affected by the disease. This infographic template is a visual representation that provides information about the various effects and impacts of breast cancer on individuals' health, well-being, and daily lives. This infographic can be used to raise awareness, educate, and support individuals who are affected by breast cancer, as well as their families and communities.


6 diapositivas
Strategy for Effective Solutions Presentation
Unlock strategic clarity with the Strategy for Effective Solutions template, which effectively organizes complex strategies into six interconnected segments, ideal for sequentially showcasing business insights. Its clear, systematic design supports concise communication and is compatible with PowerPoint, Keynote, and Google Slides, making it a versatile tool for professional presentations.


6 diapositivas
Profit vs Cost Analysis Presentation
Make your numbers tell a story of balance and success with this clean, data-driven presentation design. Perfect for comparing expenses and gains, it helps showcase business efficiency, growth, and decision-making clarity. Fully customizable and compatible with PowerPoint, Keynote, and Google Slides for a professional and seamless presentation experience.


23 diapositivas
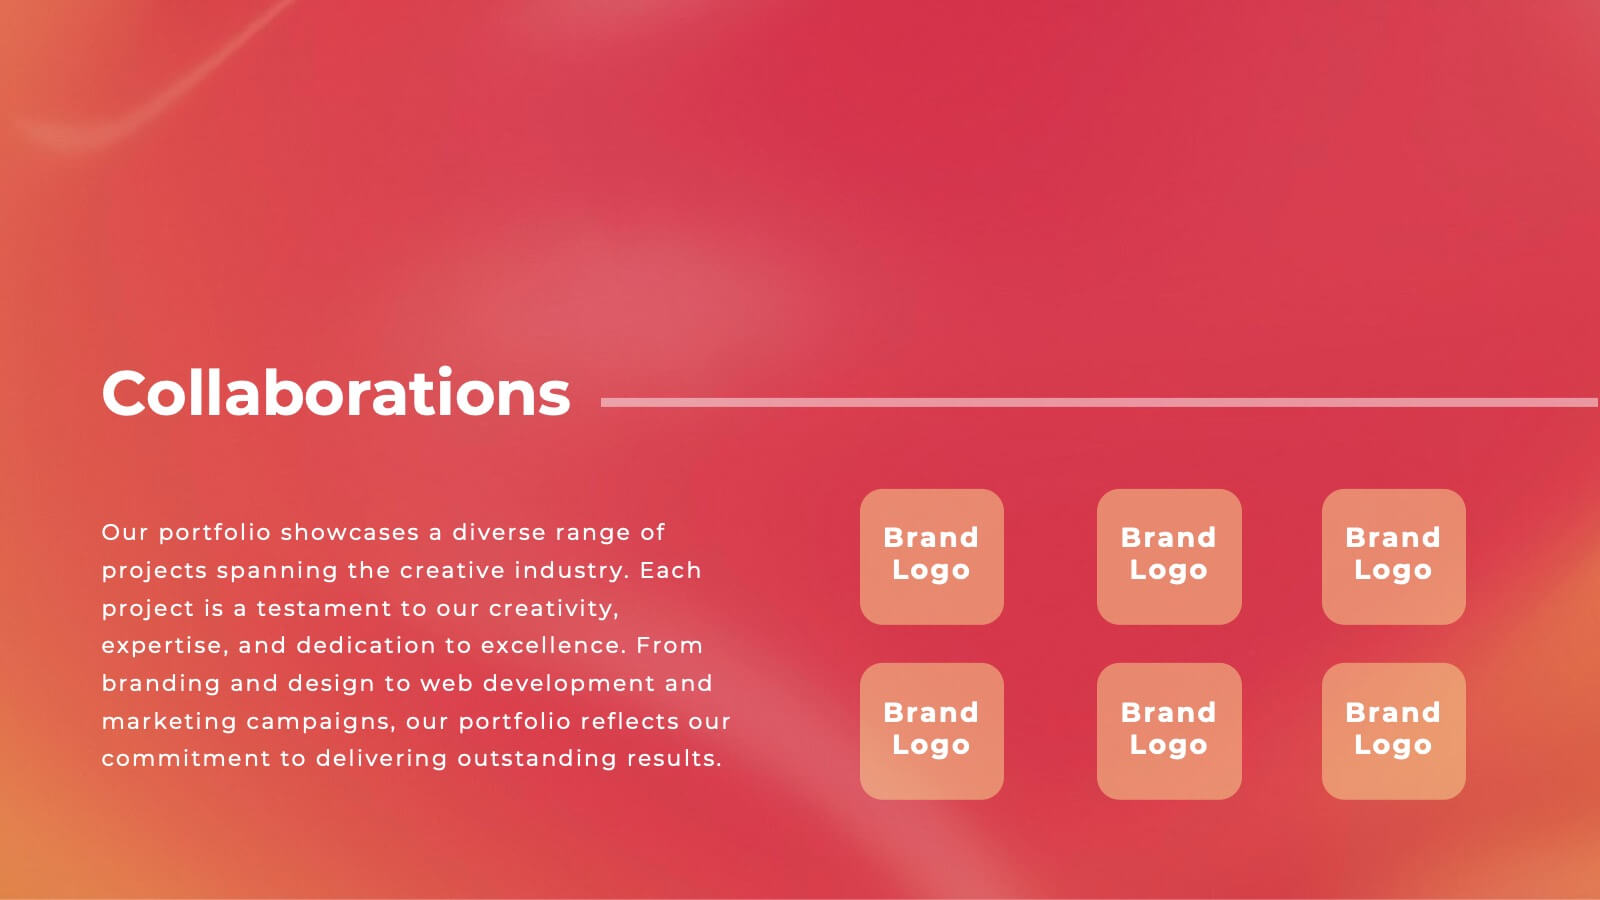
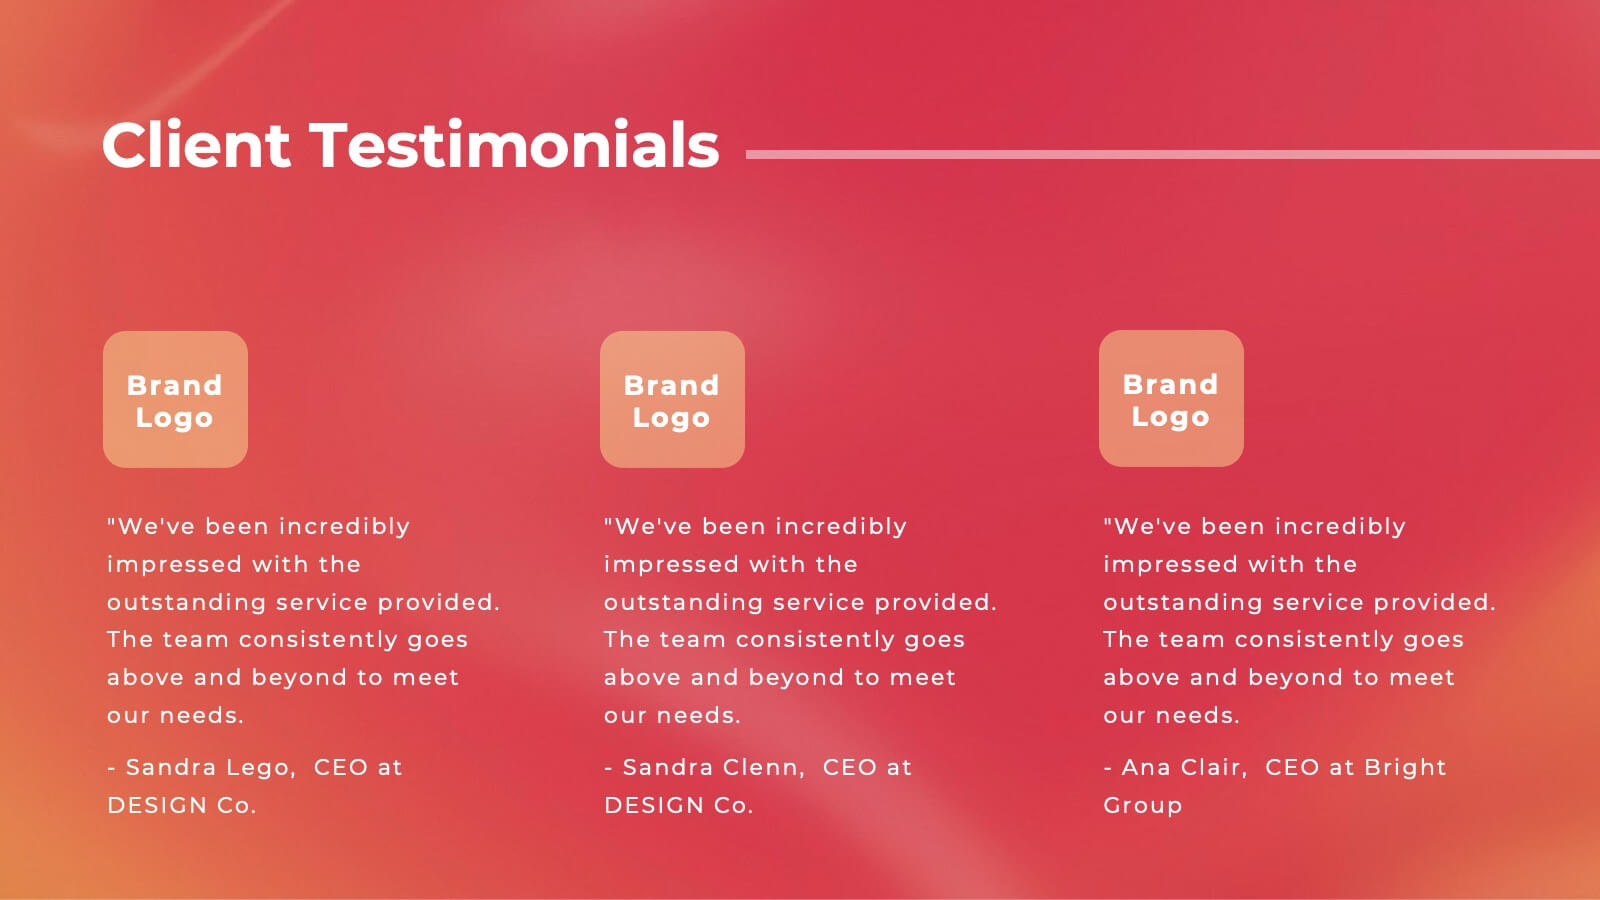
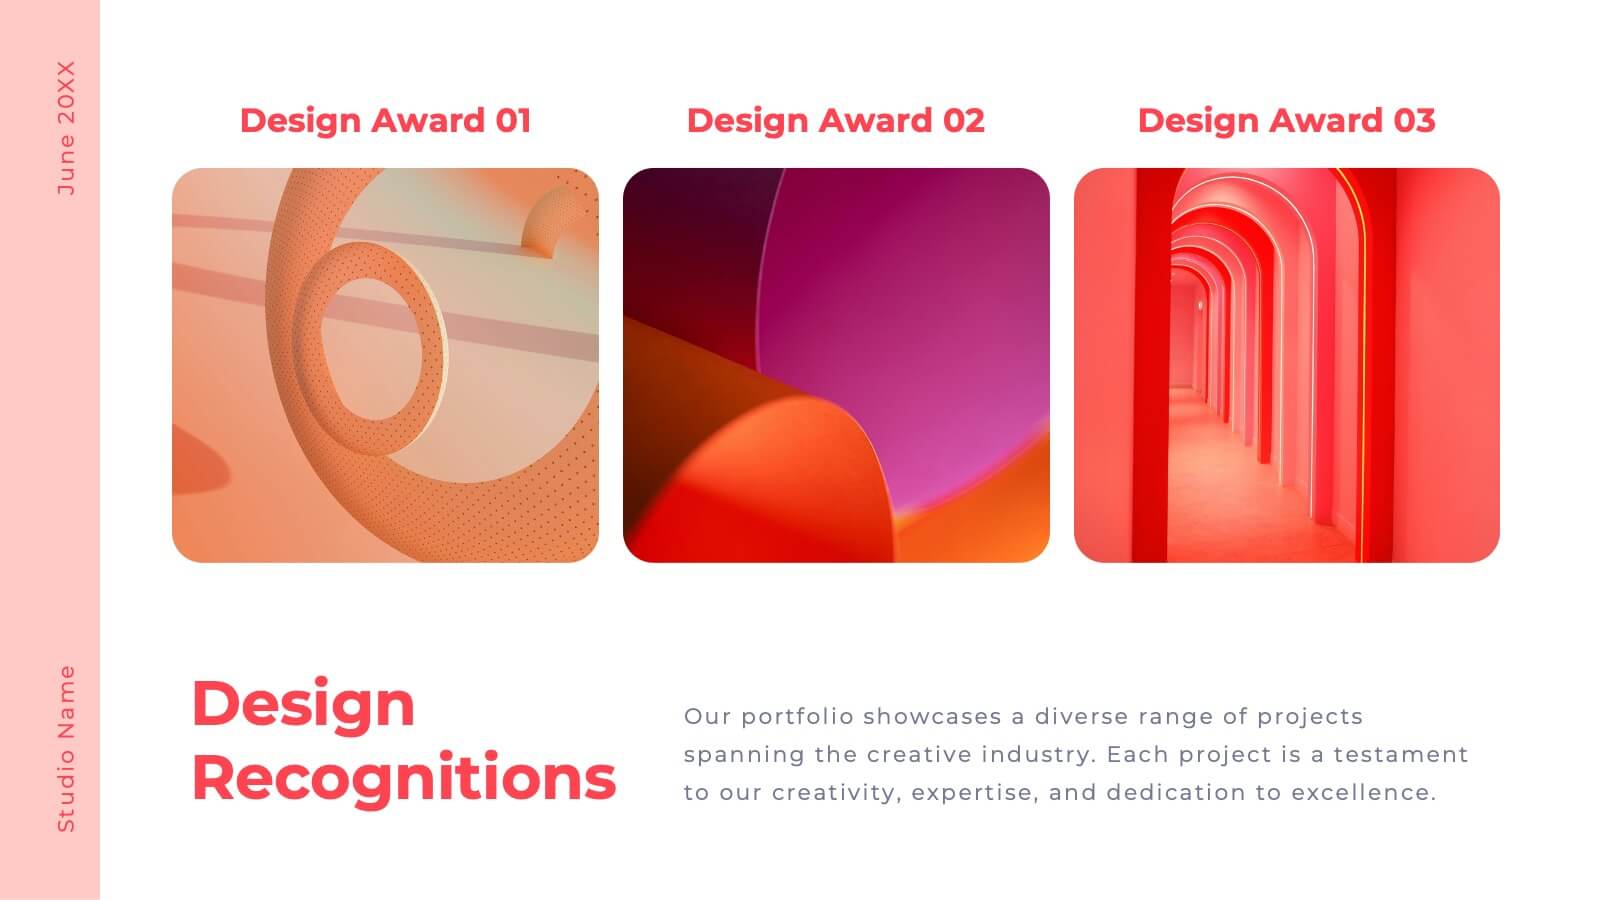
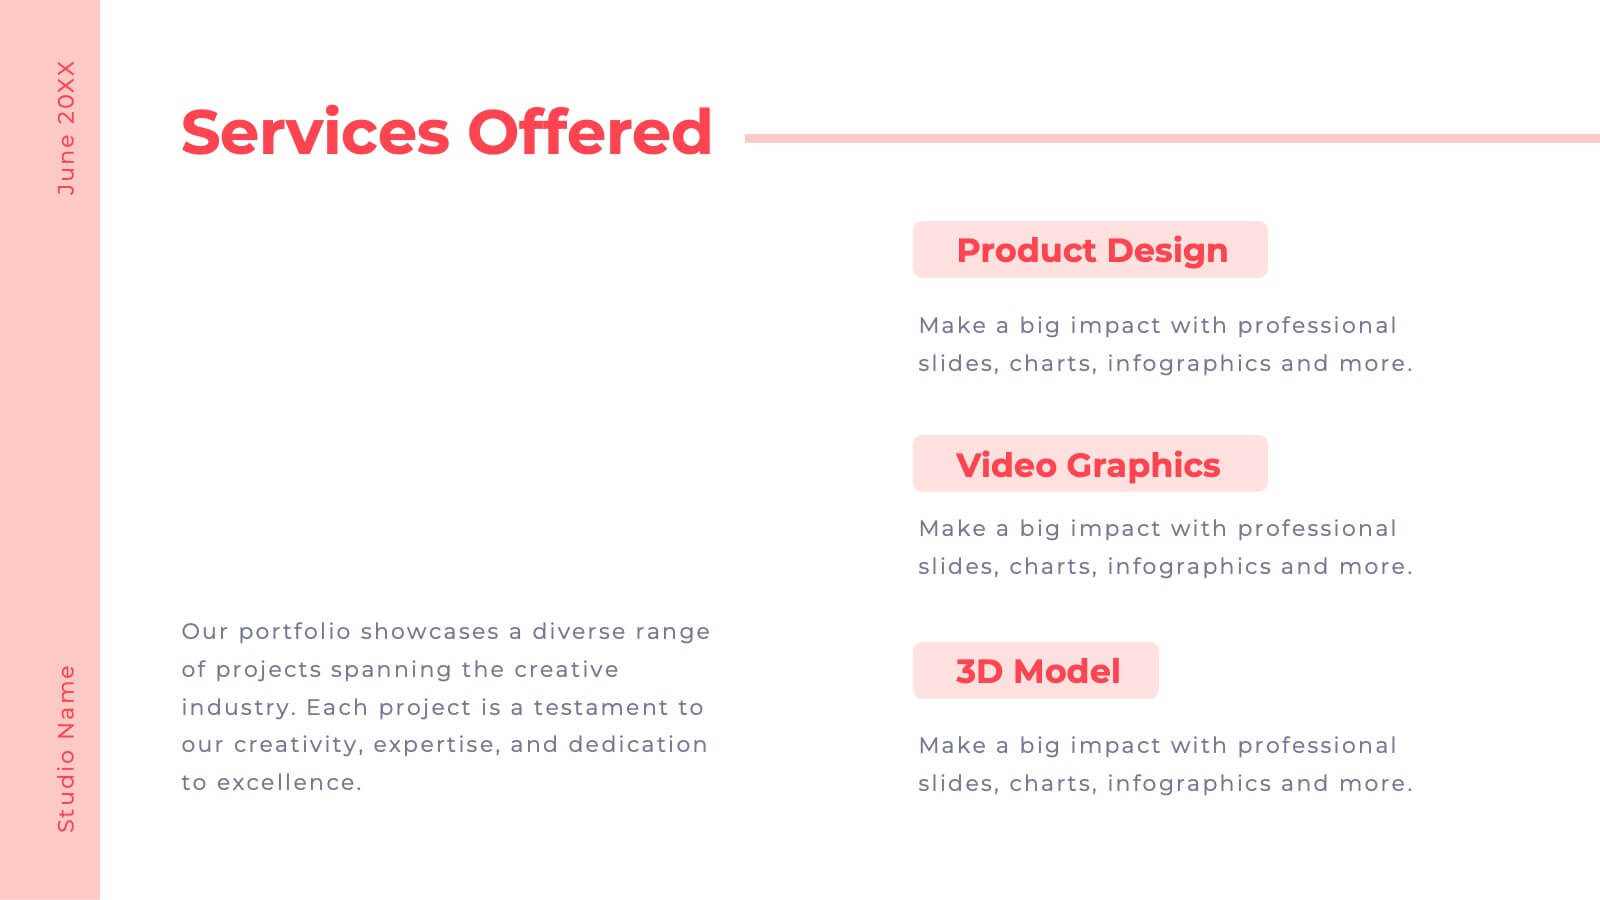
Tempest Design Portfolio Presentation
Elevate your creative showcase with the Tempest Design Portfolio Presentation template! This beautifully crafted layout is designed to highlight your best work in a sophisticated and professional manner. The subtle earthy tones and minimalist design create a perfect backdrop for presenting your projects, from the initial concept to the final execution. Whether you're an individual designer or a creative agency, this template allows you to elegantly present your portfolio, philosophy, and style, making a powerful impact on your audience. Each slide is thoughtfully designed to emphasize your achievements, client testimonials, and services offered, ensuring that your work shines through with clarity and style. Ideal for client presentations, creative pitches, or showcasing your portfolio online, this template is fully compatible with PowerPoint, Keynote, and Google Slides. Make your design story unforgettable with the Tempest template, and let your creativity speak volumes!


8 diapositivas
Air Travel Safety and Operations Presentation
Capture your audience’s attention with this aviation window-inspired layout, designed to visualize safety protocols or operational steps in air travel. Featuring four distinct segments arranged like a view through a plane window, it’s ideal for airline safety briefings, operational workflows, or compliance overviews. Fully editable in PowerPoint, Keynote, and Google Slides.


8 diapositivas
Scrum Agile Framework Presentation
Visualize your iterative workflows and deliverables with this Scrum Agile Framework Presentation. Designed for Agile teams, this layout simplifies the depiction of Scrum principles—product backlogs, sprints, and reviews—into one cohesive graphic. Ideal for planning meetings, sprint reviews, or stakeholder updates. Fully editable in PowerPoint, Keynote, and Google Slides.


4 diapositivas
Clean Business Table Slide Design Presentation
Present your data with clarity using this Clean Business Table Slide Design presentation. Ideal for service comparisons, feature checklists, or role responsibilities, this layout uses simple icons and crisp tables for quick scanning. Professional and modern, it's perfect for client presentations or internal reports. Compatible with PowerPoint, Canva, and Google Slides.


7 diapositivas
Value Chain Analysis Infographic
Streamline your business processes with our Value Chain Analysis Infographic, an essential tool for business analysts, management consultants, and strategic planners. This infographic provides a visual breakdown of the primary and supporting activities that create value for your customers. Our Value Chain Analysis Infographic illustrates how each segment of your business contributes to the overall product or service delivery. It's designed to help you identify opportunities for improvement, cost savings, and competitive advantage. The infographic is customizable, allowing you to detail activities such as inbound logistics, operations, outbound logistics, marketing, sales, and service. This SEO-optimized tool ensures that your strategic analysis is accessible for professionals seeking to enhance operational efficiency and value creation. Employ this infographic to dissect and understand your business operations, fostering informed decision-making and optimizing the value delivered to your customers.


7 diapositivas
Medical Care Infographic Presentation
A medical infographic is a visual representation of information related to medicine, health and healthcare. This infographic design can help people understand complex topics and communicate more effectively about science. This medical infographic template features a dynamic background image, along with a visual representation of information related to healthcare. It is a great way to promote your health-related content. This infographic is a great tool to provide patients with a breakdown of information. This template is compatible with Powerpoint, Keynote and Google Slides.