


Características


¿Tienes alguna pregunta?
Recomendar


2 diapositivas
Meeting and Business Planning Services Illustrations
Take your planning game to the next level with our meeting and business planning services illustrations pack! This illustrations pack is perfect for companies that need a way to visualize their ideas quickly and easily. Fully compatible with Powerpoint, Keynote, and Google Slides. Boost your productivity and make your meetings more exciting—download the meeting and business planning services illustrations pack today!


4 diapositivas
Corporate Governance Structure Presentation
Build transparency and leadership clarity with this clean, layered presentation layout that visualizes company hierarchies and decision-making systems. Ideal for explaining organizational roles, responsibilities, and reporting flows, it simplifies complex structures into easy visuals. Fully editable and compatible with PowerPoint, Keynote, and Google Slides for professional, flexible use.


4 diapositivas
Environmental Sustainability Strategy Presentation
The "Environmental Sustainability Strategy" presentation template is a visually engaging tool designed to outline an organization's approach to integrating sustainable practices into its operations. The template illustrates the journey from social to environmental and corporate sustainability, represented by seedlings growing into mature plants, symbolizing development and growth in sustainable practices. This template is perfect for businesses aiming to communicate their commitment to sustainability, detailing specific strategies and milestones in social, environmental, and corporate domains. It encourages viewers to think about the progressive stages of implementing sustainable actions within a corporate framework.


7 diapositivas
Mind Map Project Infographic
A mind map is a visual representation of information, ideas, or concepts arranged around a central topic or theme. This template is a powerful brainstorming and organizational tool that helps individuals or teams visually connect related ideas, explore new connections, and see the bigger picture. This diagram organizes information around a central theme or idea, with branches extending outwards to represent related concepts or tasks. This infographic is perfect for for capturing ideas, and presenting complex information in a structured and easily manner. This template is customizable and compatible with Powerpoint, Keynote, and Google Slides.


5 diapositivas
Social Media Strategies Presentation
Bring your online vision to life with a clean, modern layout that makes planning campaigns feel effortless. This presentation helps you map out goals, content pillars, audience insights, and platform tactics with clarity and impact. Fully editable and compatible with PowerPoint, Keynote, and Google Slides.


22 diapositivas
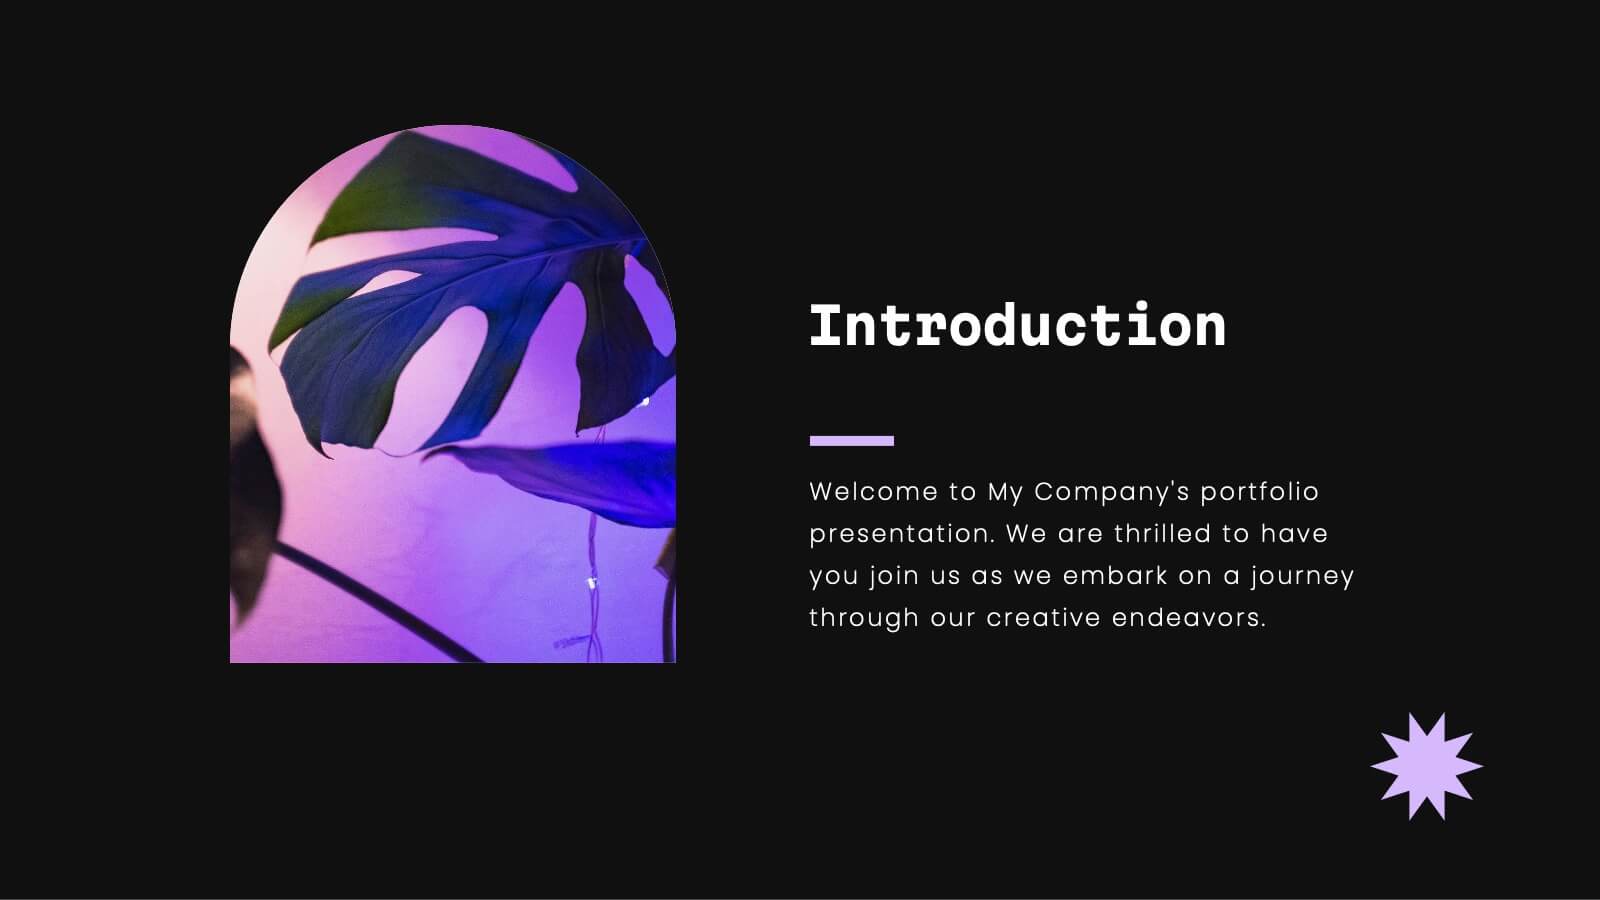
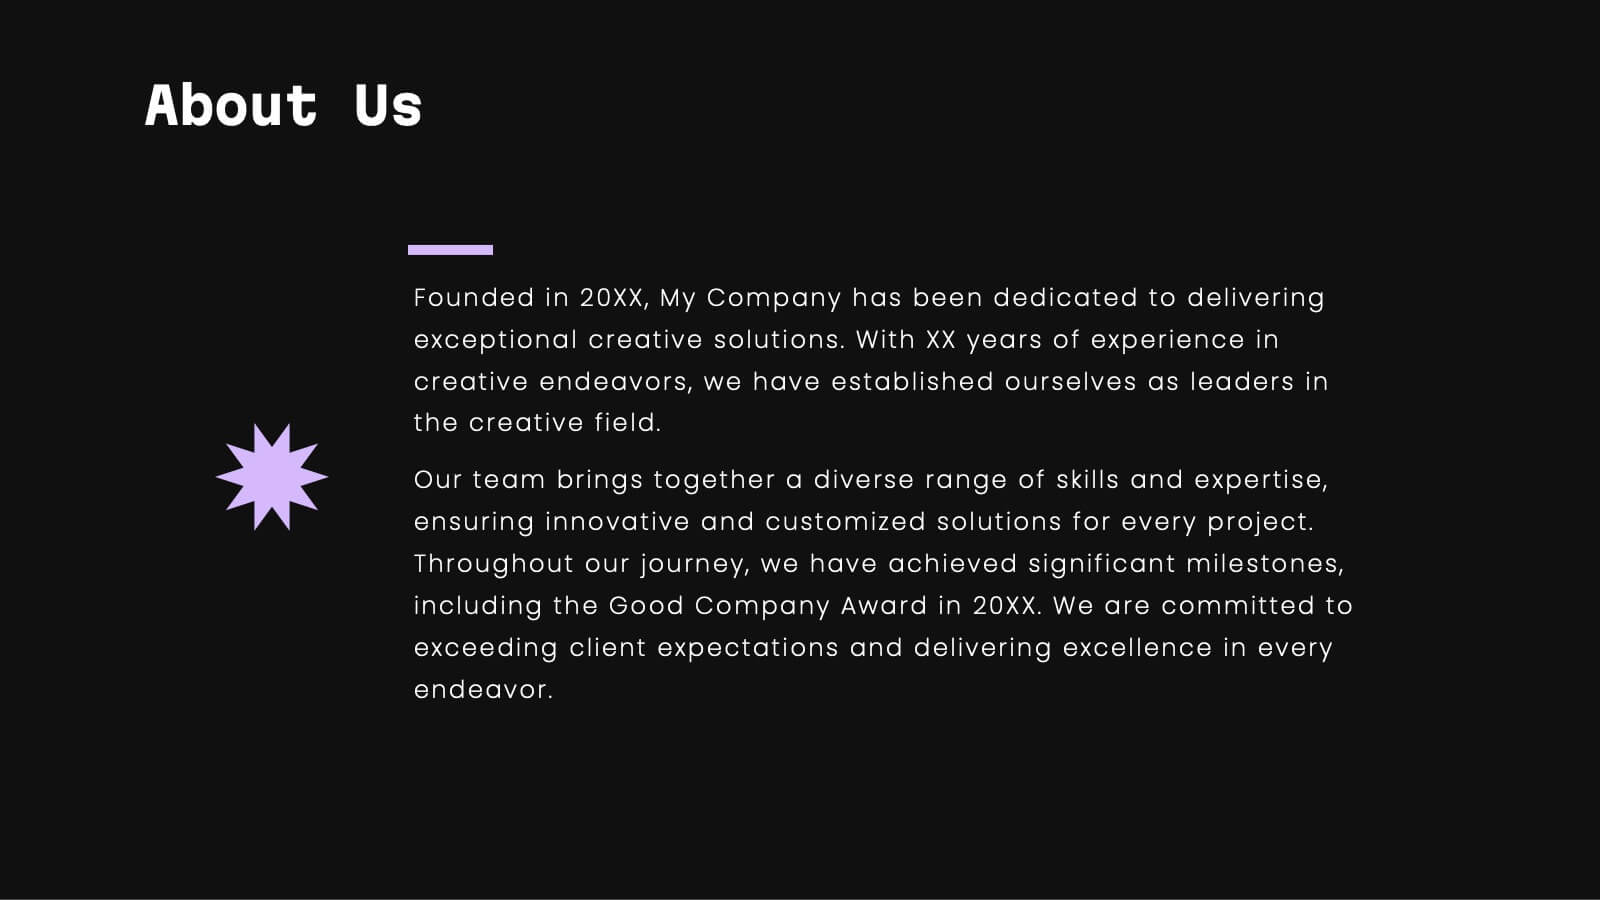
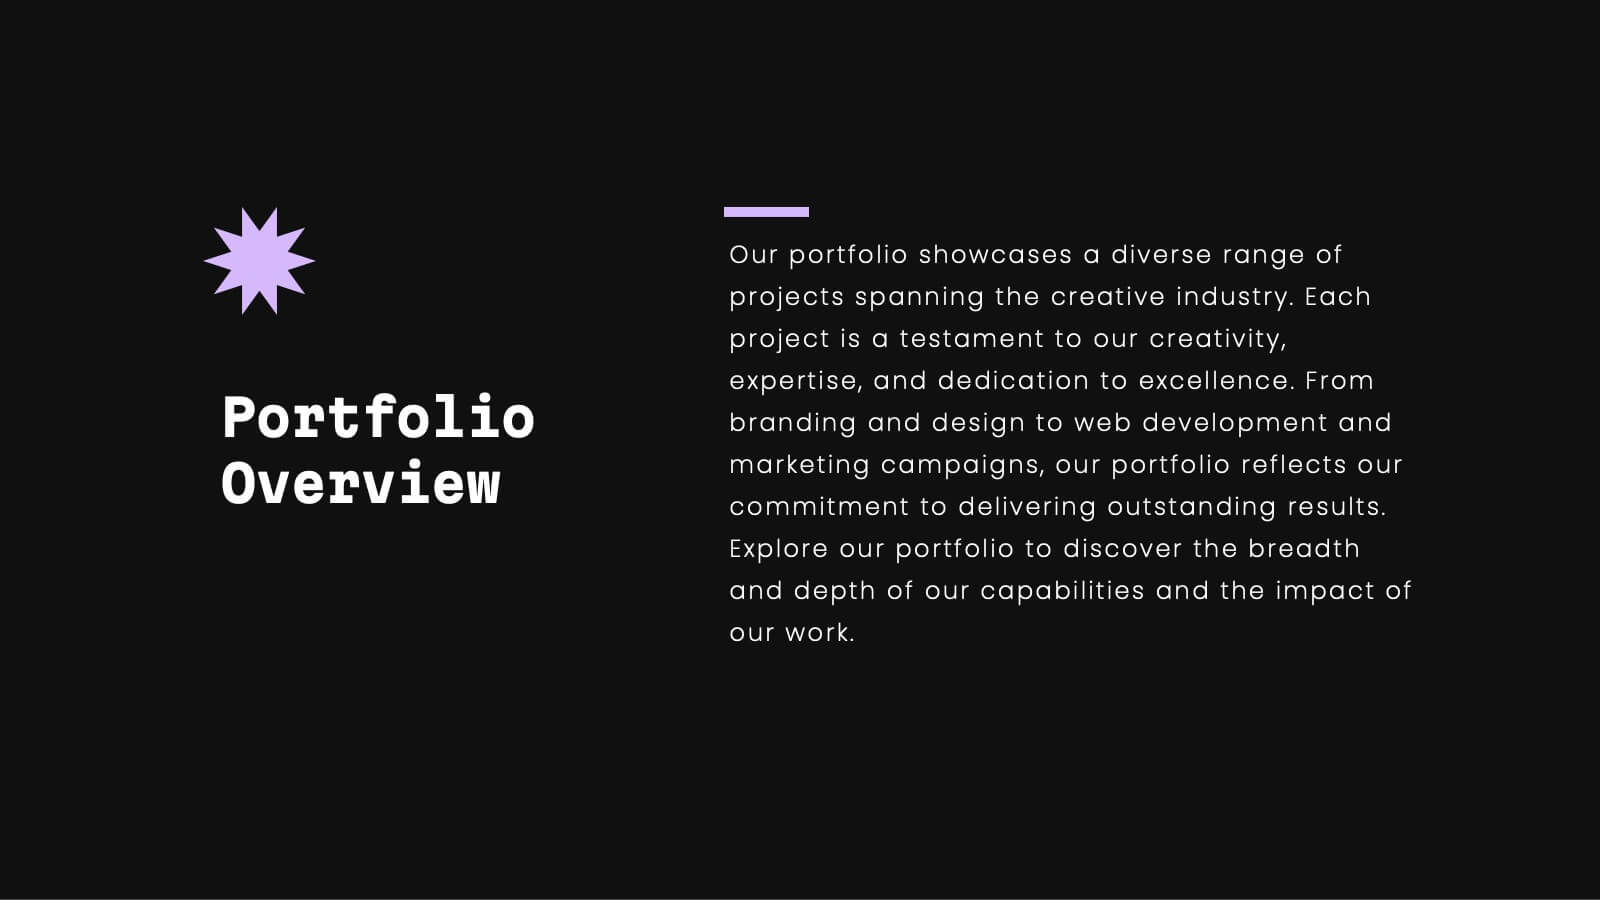
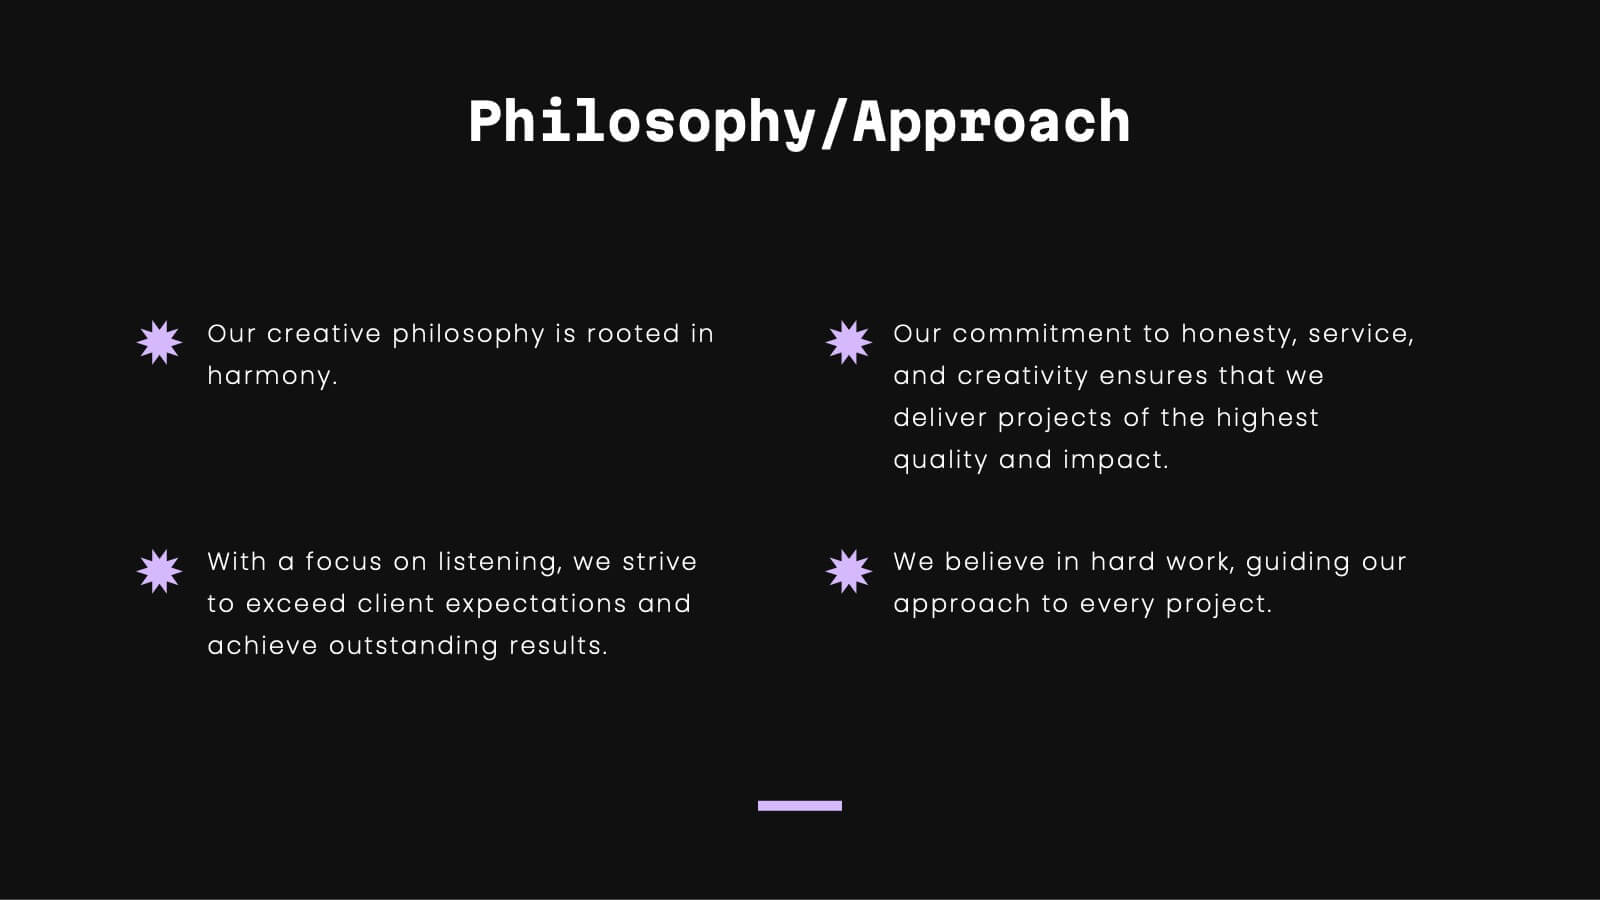
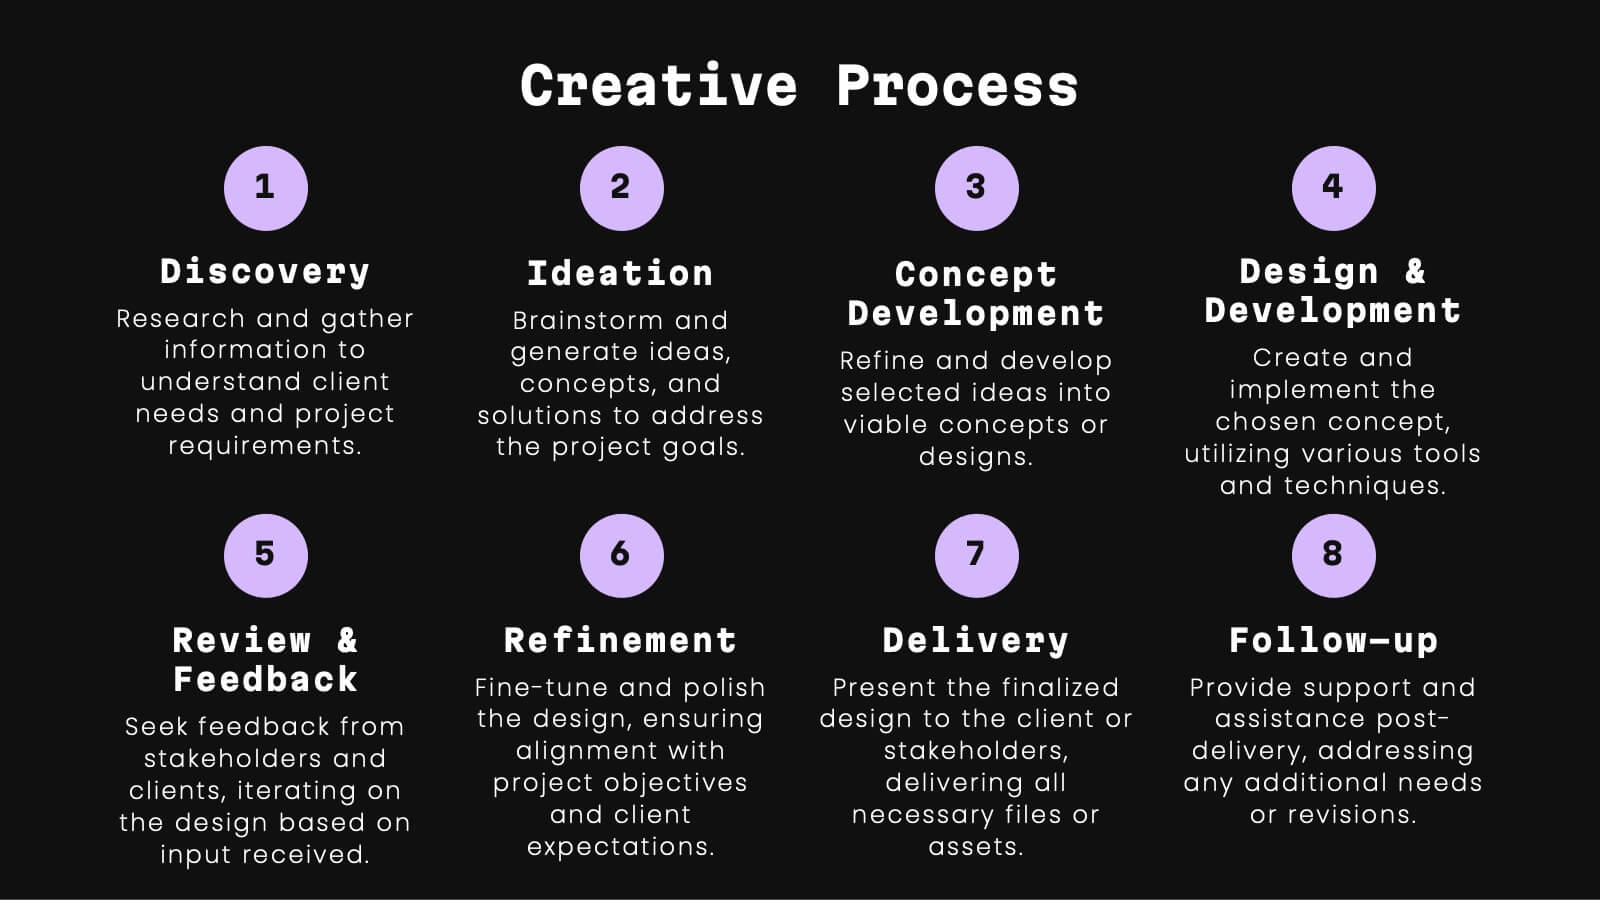
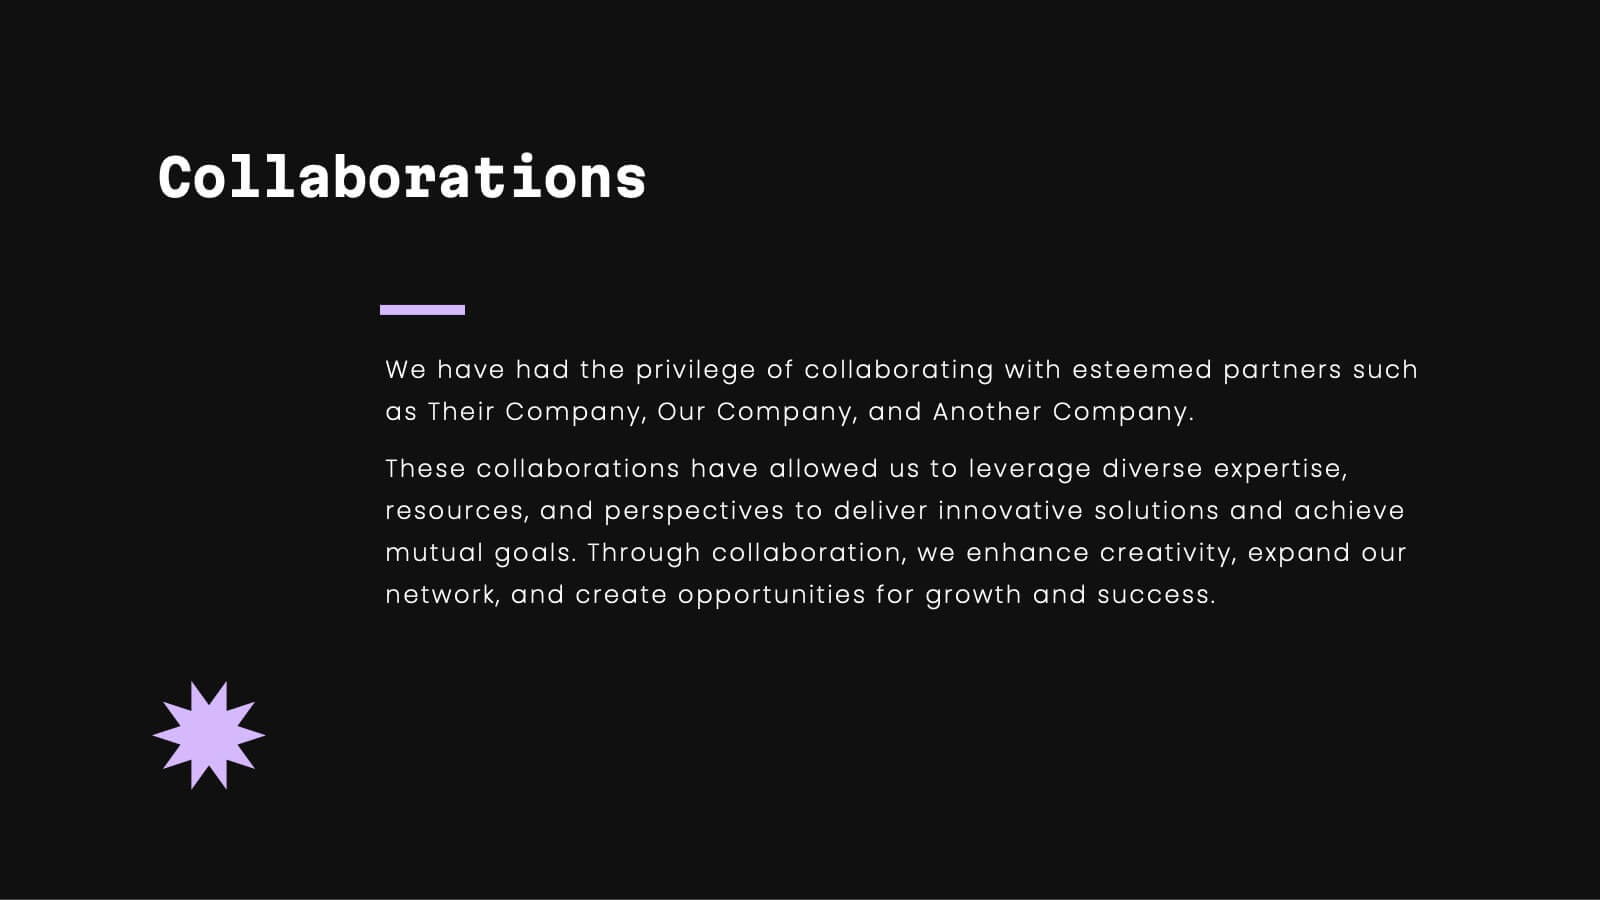
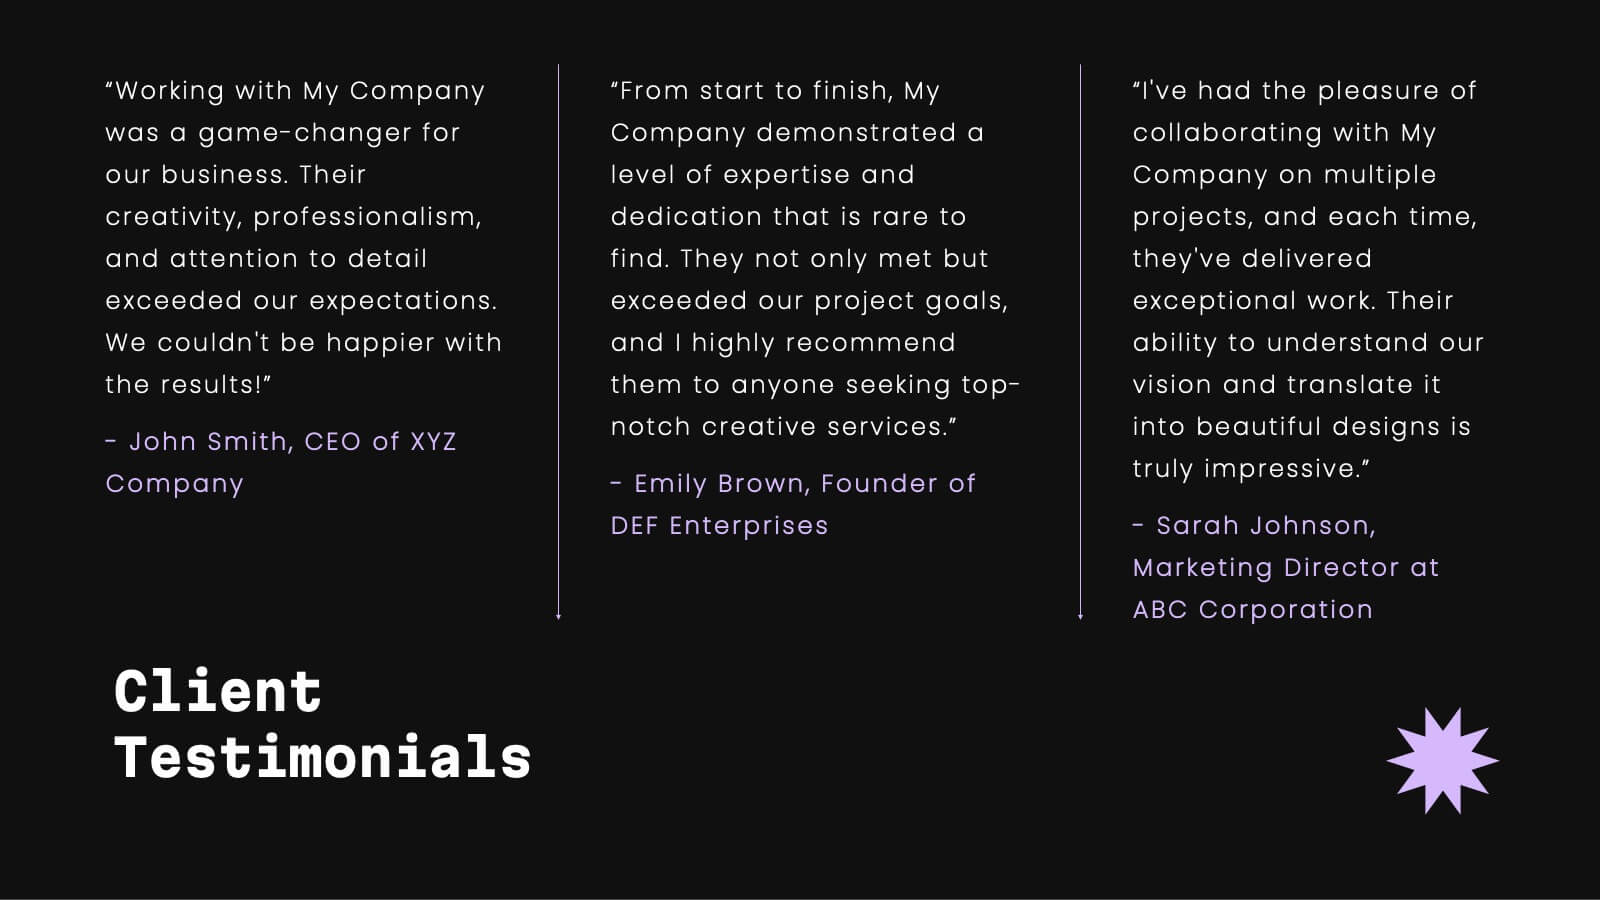
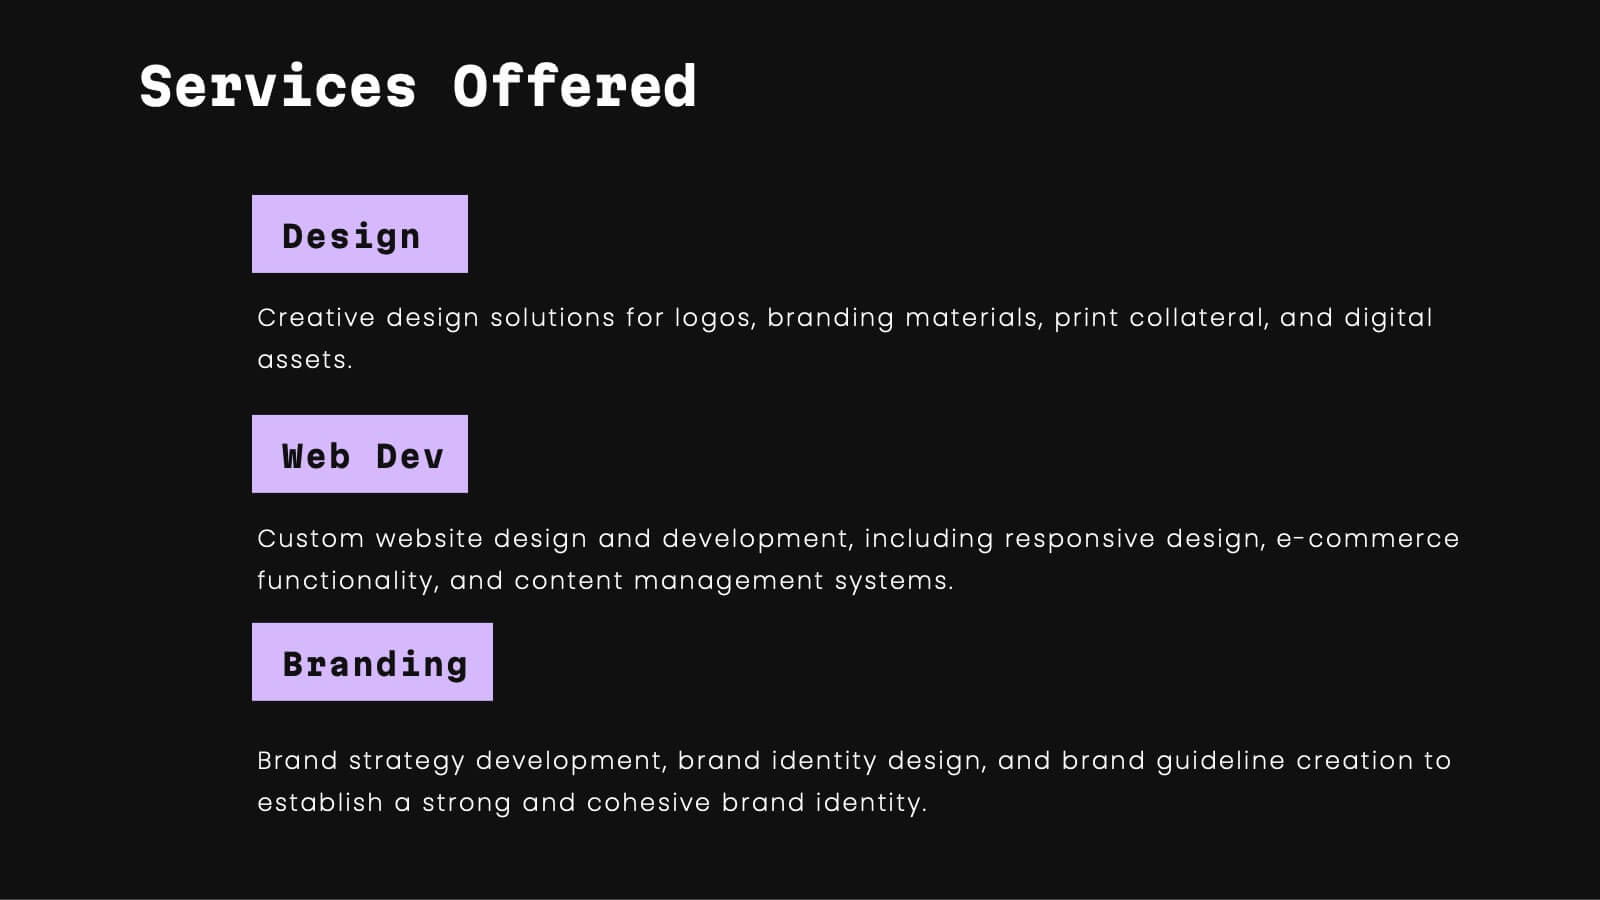
Celeste Professional Portfolio Showcase Presentation
Impress with style using this sophisticated portfolio presentation template. Perfect for showcasing featured projects, creative processes, and client testimonials, this template enhances the visual appeal of your work. Its modern, dark-themed design ensures your content stands out, making a lasting impression. Compatible with PowerPoint, Keynote, and Google Slides, it's versatile for any platform.


6 diapositivas
Business Development Strategy Infographic
Business Strategy refers to a set of planned actions and decisions designed to achieve specific goals and objectives within an organization. This infographic template is designed to showcase the key elements and steps involved in a business development strategy. Ideal for entrepreneurs and marketing professionals, this template helps present the roadmap for business growth and success. The visuals showcase the market research and analysis conducted to identify target audiences, market trends, and competitors. Graphs and charts represent market growth potential and opportunities. This template is fully compatible with Powerpoint, Keynote, and Google Slides.


6 diapositivas
Break Even Point Presentation
Turn your data into a story of profit and precision with this clean and modern presentation design. Ideal for showcasing financial performance, cost analysis, or revenue forecasts, it helps visualize where your business meets success. Fully customizable and compatible with PowerPoint, Keynote, and Google Slides for smooth editing.


4 diapositivas
Agile Workflow Presentation
Bring energy and motion to your process overview with a clean, loop-based flow that makes each stage easy to follow. This presentation is designed to clarify steps, illustrate iterations, and support clear decision-making for any project. Fully customizable and compatible with PowerPoint, Keynote, and Google Slides.


26 diapositivas
Startup Presentation
Elevate your startup's story with this Startup Presentation template. It features slides for your mission, innovation highlights, market analysis, and growth strategy. Perfect for engaging potential investors and partners. This versatile template is compatible with PowerPoint, Keynote, and Google Slides, making it easily accessible for all your presentation needs.


7 diapositivas
Project Management Process Infographic
Navigate the vast arena of project management with our project management infographic. Anchored on a clear white base, the design is adorned with the calm of green, the trustworthiness of blue, and the innovative spirit of purple. Engage with meticulously designed infographics, tailored icons, and flexible image placeholders, providing a comprehensive visual guide to the realms of project planning, execution, and evaluation. Perfectly sculpted for Powerpoint, Keynote, or Google Slides. An invaluable asset for project managers, team leaders, consultants, or anyone in the corporate landscape wanting to visualize and optimize project stages.


12 diapositivas
Quarterly Status Report Presentation
Crafted for clarity and impact, the Quarterly Status Report presentation template efficiently summarizes a period's achievements and insights. The opening slide immediately captivates the audience, clearly setting the stage for a comprehensive review. Subsequent slides meticulously organize critical data points, from financial forecasts to project milestones, allowing for a granular examination of past performance. The report not only reflects on the quarter's outcomes but also offers a well-defined path forward, with strategic recommendations and a thoughtful action plan. Concluding on a note of gratitude, the template acknowledges the audience's time and consideration, while the final credits slide ensures due recognition of all informational sources used throughout the presentation.


10 diapositivas
South America Business Development Growth Map Presentation
Showcase business growth insights with this South America-focused development map. Featuring vibrant bar-style columns aligned with country highlights, this layout helps visualize economic potential, investment zones, and performance indicators. Perfect for regional strategy presentations, market analysis, and expansion proposals. Fully editable for PowerPoint, Keynote, and Google Slides compatibility.


4 diapositivas
Digital Marketing and SEO Best Practices Presentation
Communicate your digital strategy with this clean and structured visual layout. This template features a horizontal flowchart design with four circular icons branching from a central infographic, allowing you to showcase core areas such as audience targeting, content creation, performance analytics, and ranking improvement. Ideal for marketers, consultants, and SEO professionals. Fully editable in PowerPoint, Keynote, and Google Slides.


6 diapositivas
Customer Conversion Funnel
Visualize every stage of your customer journey with the Customer Conversion Funnel Presentation. This layered funnel diagram breaks down the conversion process into five clear levels—from awareness to action—making it easy to explain how leads are captured and converted. Ideal for digital marketers, sales teams, and consultants presenting campaign performance, lead nurturing, or CRM workflows. Compatible with PowerPoint, Keynote, and Google Slides.


7 diapositivas
Programming Framework Infographic
Delve into the intricate world of coding with the programming framework infographic. With a harmonious palette of blue, white, and green, this template visualizes the intricacies of different programming frameworks in a clear and engaging manner. Tailor-made for developers, software engineers, educators, and tech enthusiasts, it transforms complex concepts into digestible visual snippets. Embedded with custom graphics, relevant icons, and adaptable image placeholders, it enhances any tech presentation. Moreover, its seamless adaptability with PowerPoint, Keynote, and Google Slides ensures you leave a lasting impression.


5 diapositivas
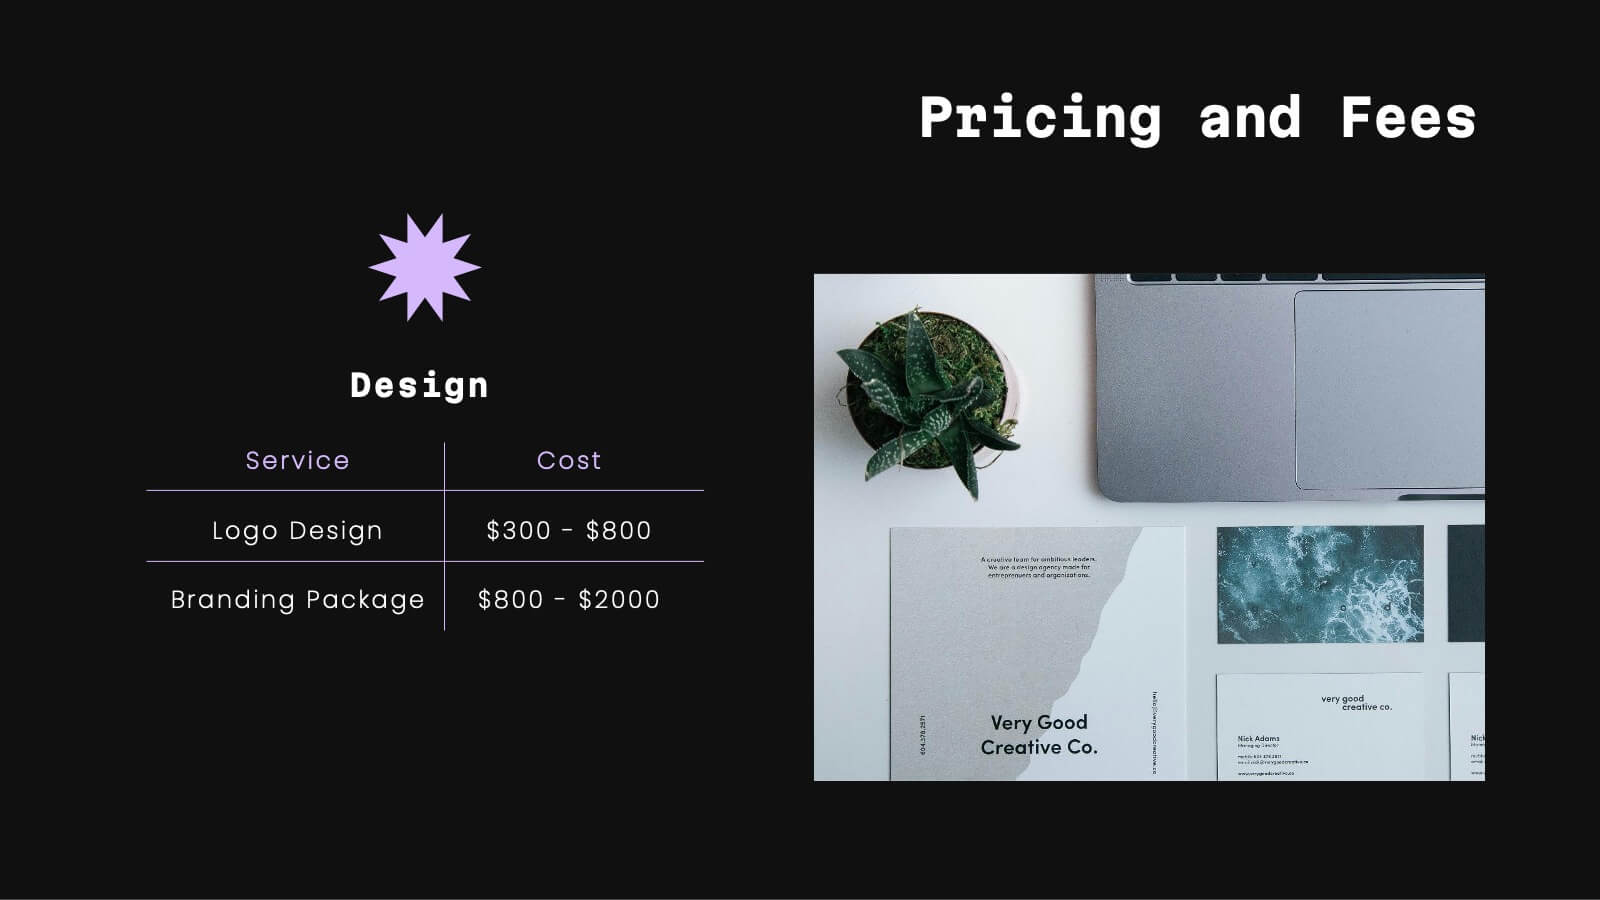
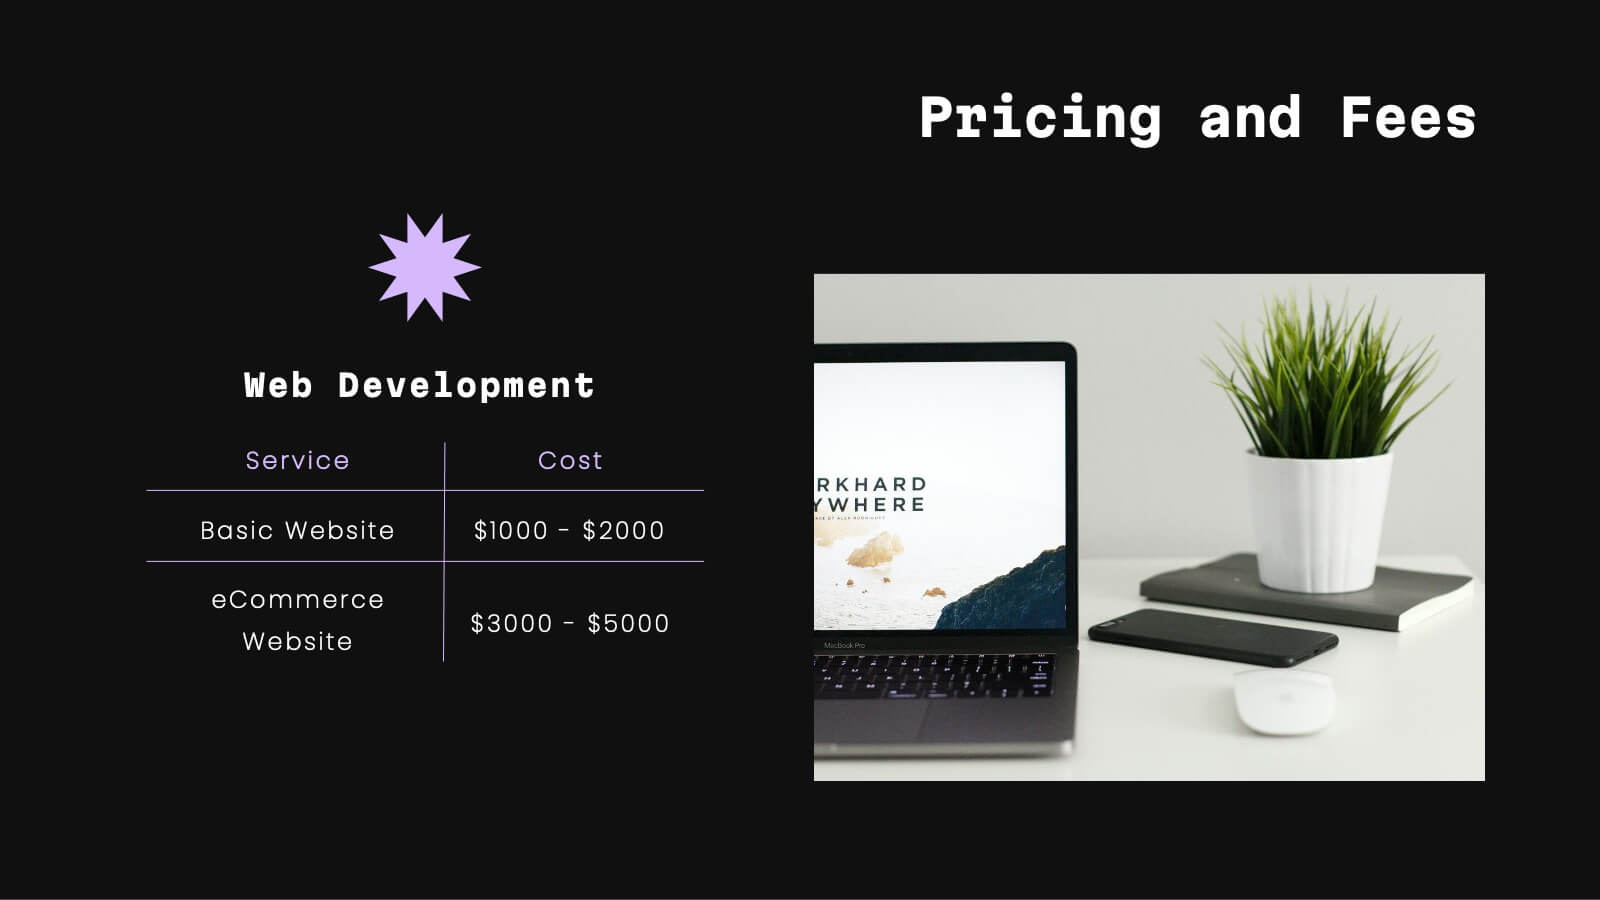
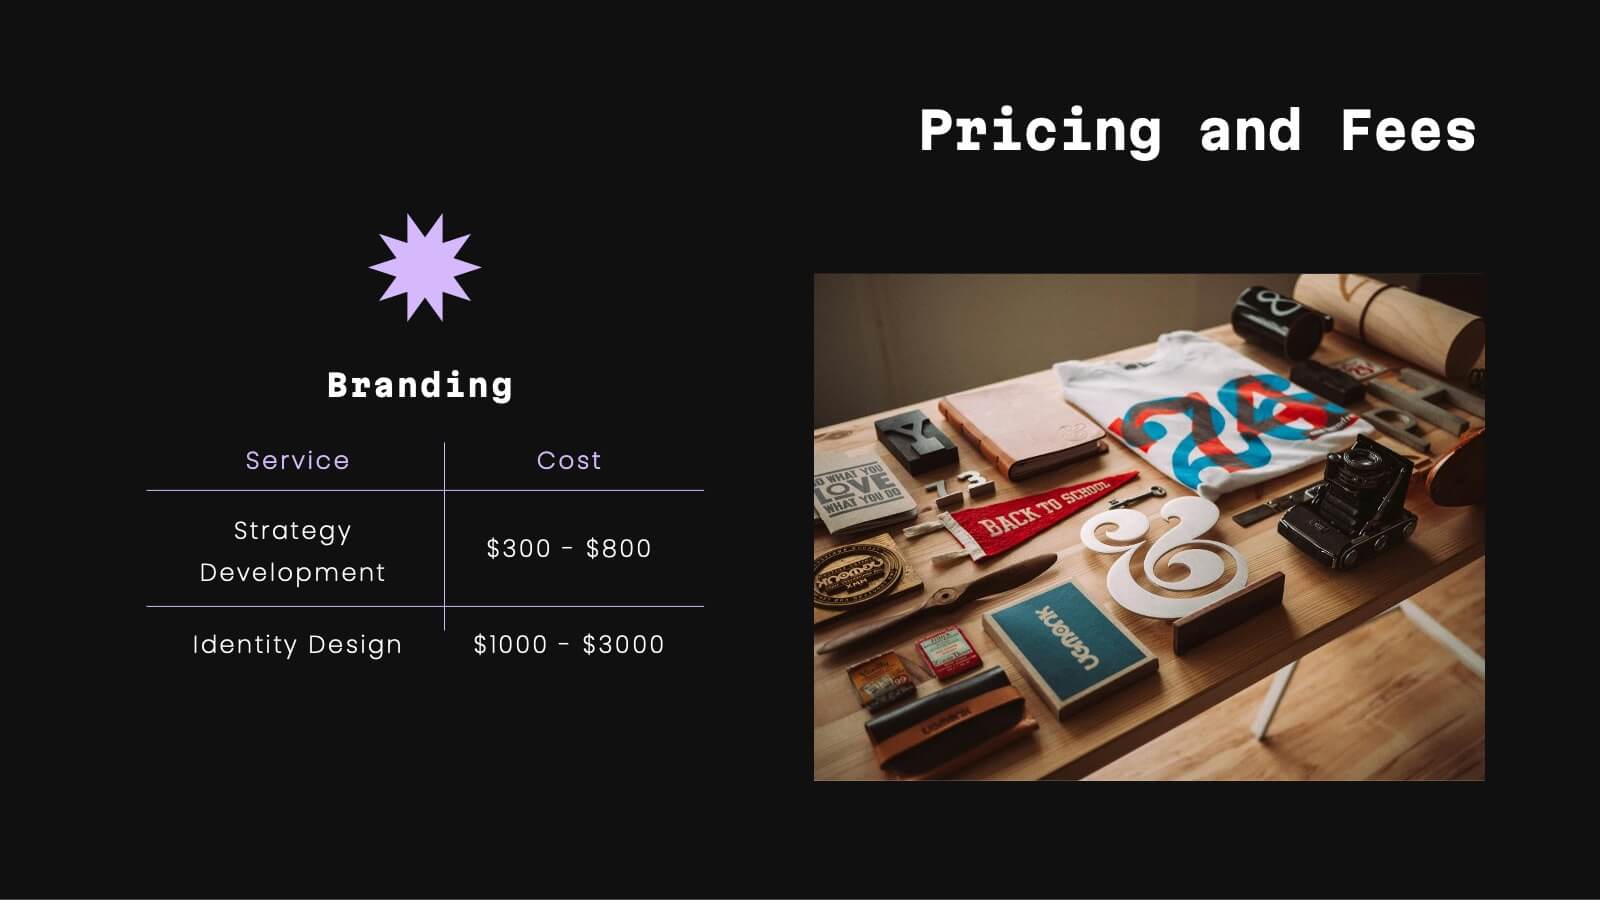
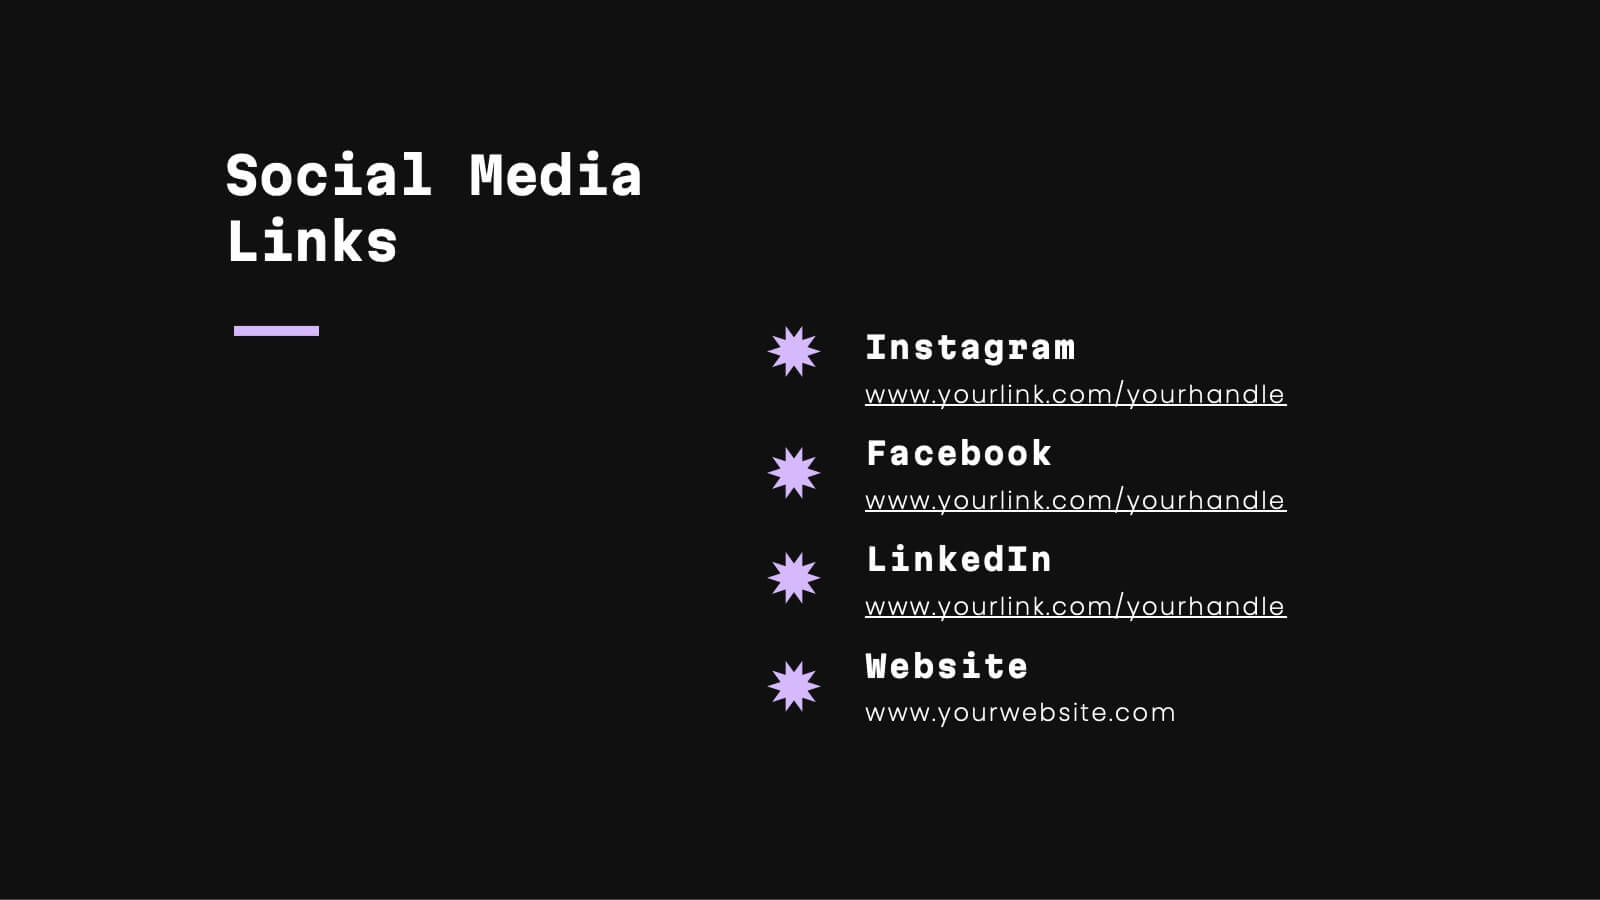
Professional Business Plans Presentation
Bring your ideas to life with a clean, structured slide that simplifies complex planning into an easy-to-follow visual. This presentation highlights key business priorities, long-term strategy, and action steps in a modern layered format that’s clear and practical for any audience. Fully compatible with PowerPoint, Keynote, and Google Slides.