


Características


¿Tienes alguna pregunta?
Recomendar


5 diapositivas
Pets Paradise Infographics
"Pets Paradise" is used to refer to a place or concept that revolves around providing a perfect and delightful environment for pets. These vertical infographics are designed to celebrate the wonderful world of pets and provide essential information for pet owners and enthusiasts. This infographic template covers a wide range of topics related to pets, showcasing their impact on human lives and the importance of responsible pet ownership. The templates present fascinating statistics about pet ownership worldwide. These infographics are fully customizable, allowing users to modify colors, fonts, and layout to align with their personal preferences.


21 diapositivas
Frostwind Financial Report Presentation
Deliver a comprehensive financial report with the Frostwind Financial Report Presentation. This sleek and modern template is designed to captivate your audience while showcasing essential business metrics and insights. With dedicated sections for key highlights, financial summaries, performance metrics, and operational updates, this presentation ensures clarity and professionalism. Dive deeper into customer feedback, market trends analysis, and competitive insights to provide a well-rounded view of your organization's performance. Showcase strategic initiatives, goals review, and next week's priorities with visually engaging charts and graphics. The inclusion of a Q&A and recommendations for improvement slide allows for seamless interaction with your audience. Perfect for corporate meetings, annual reviews, and financial updates, this template is fully customizable to suit your branding. Compatible with PowerPoint, Google Slides, and Keynote, it offers versatility and ease of use, ensuring you leave a lasting impression. Take your financial reporting to the next level!


21 diapositivas
Tourmaline Project Proposal Presentation
This sleek design proposal template covers all essential sections like project summary, objectives, goals, and deliverables. With a modern and professional layout, it's perfect for presenting solutions and methodologies. Compatible with PowerPoint, Keynote, and Google Slides, it’s designed to impress clients and stakeholders with clear, structured information.


5 diapositivas
Problem-Solving and Business Solutions
Simplify complex challenges with this dynamic problem-solving and business solutions slide. Designed with a clear, step-by-step layout, this template helps outline problems, strategies, solutions, and outcomes in a visually engaging way. Ideal for workshops, strategic planning sessions, consulting proposals, and team brainstorming. Fully editable and compatible with PowerPoint, Keynote, and Google Slides.


7 diapositivas
30 60 90 Nutritional Plan Infographic
Chart a path to healthful living with the 30 60 90 Nutritional Plan Infographic. In a vibrant mix of yellow, purple, blue, and white, this template presents a visually delightful guide to nutrition enthusiasts and health-conscious audiences. The tailored design encourages a gradual approach to dietary transitions, making it easier to understand and adhere to. Health coaches, dietitians, or fitness trainers will find this as an indispensable tool for workshops, webinars, or consultations. Its seamless integration with PowerPoint, Keynote, and Google Slides enhances the user experience during presentations.


5 diapositivas
Corporate Ethics and Legal Guidelines
Clearly outline company policies and ethical standards with this organized and professional slide. Featuring a checklist-style layout with customizable categories, it’s ideal for corporate trainings, compliance presentations, and HR onboarding. Fully editable and compatible with PowerPoint, Keynote, and Google Slides.


6 diapositivas
5 Forces Model Business Analysis Presentation
Showcase your business insights with a bold, flowing design that makes each competitive force easy to compare and understand. This presentation helps you break down market pressures, highlight strategic opportunities, and communicate analysis with clarity and confidence. Fully editable and compatible with PowerPoint, Keynote, and Google Slides.


6 diapositivas
Bubble Chart Data Visualization Presentation
Make your data pop with visuals that tell a story at a glance. This modern presentation transforms raw numbers into clear, engaging bubble charts that simplify complex insights and comparisons. Fully editable and compatible with PowerPoint, Keynote, and Google Slides for effortless customization and professional results.


8 diapositivas
Business KPI Dashboard Presentation
Track performance at a glance with the Business KPI Dashboard Presentation. This clean, professional layout includes a speedometer-style gauge and monthly bar chart to showcase progress, goals, or metrics clearly. Ideal for reporting, analysis, or executive summaries. Fully editable and compatible with PowerPoint, Keynote, and Google Slides.
4 diapositivas
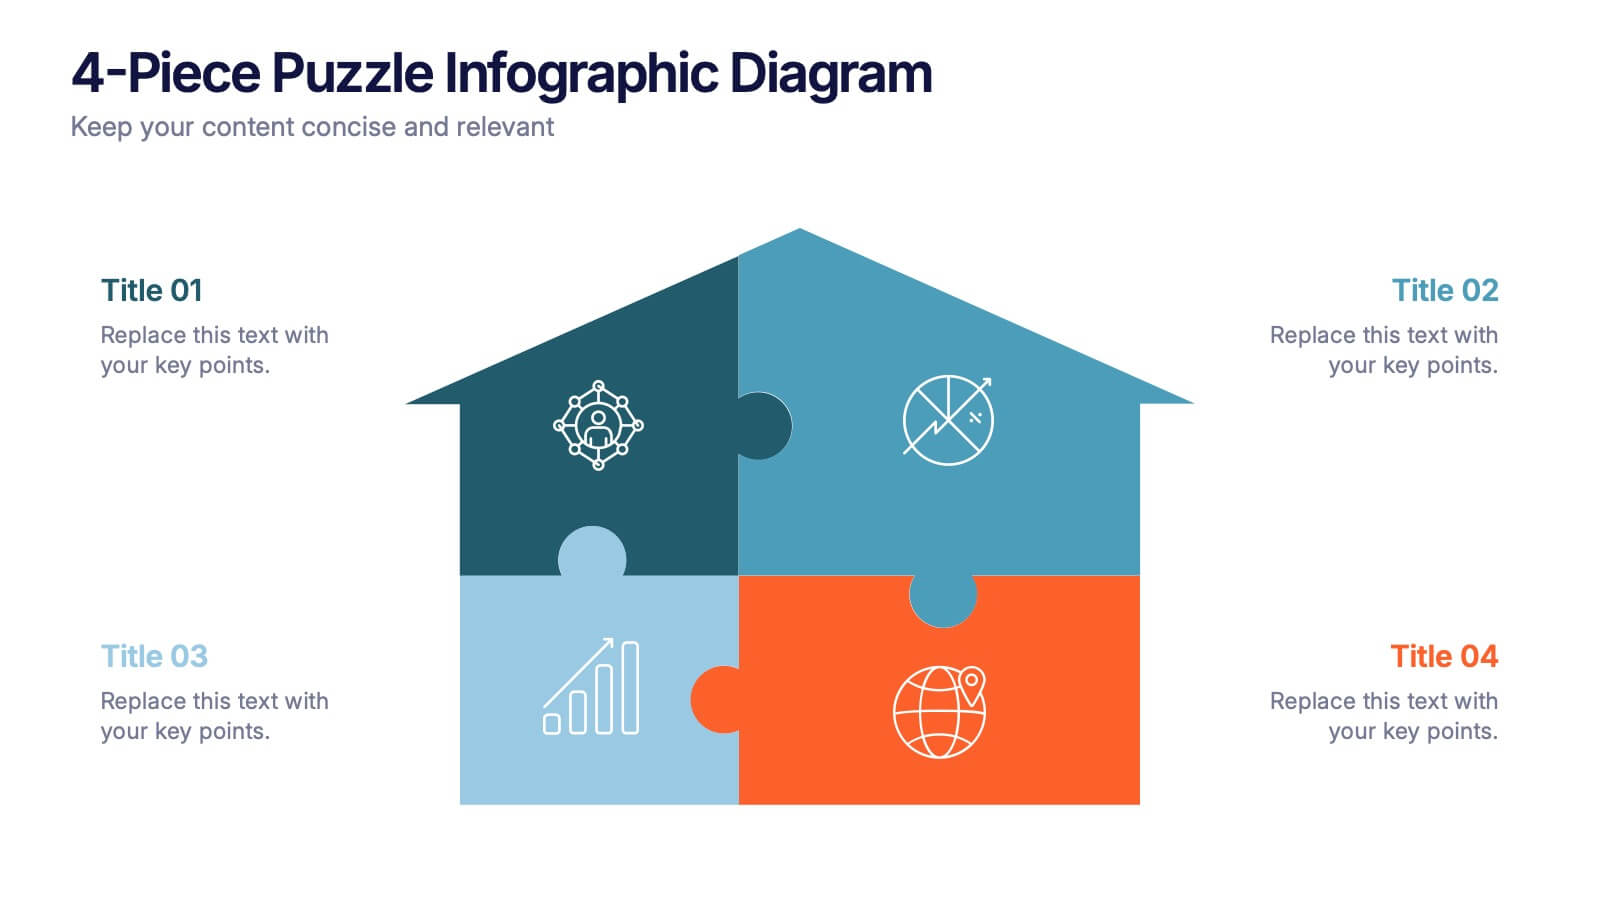
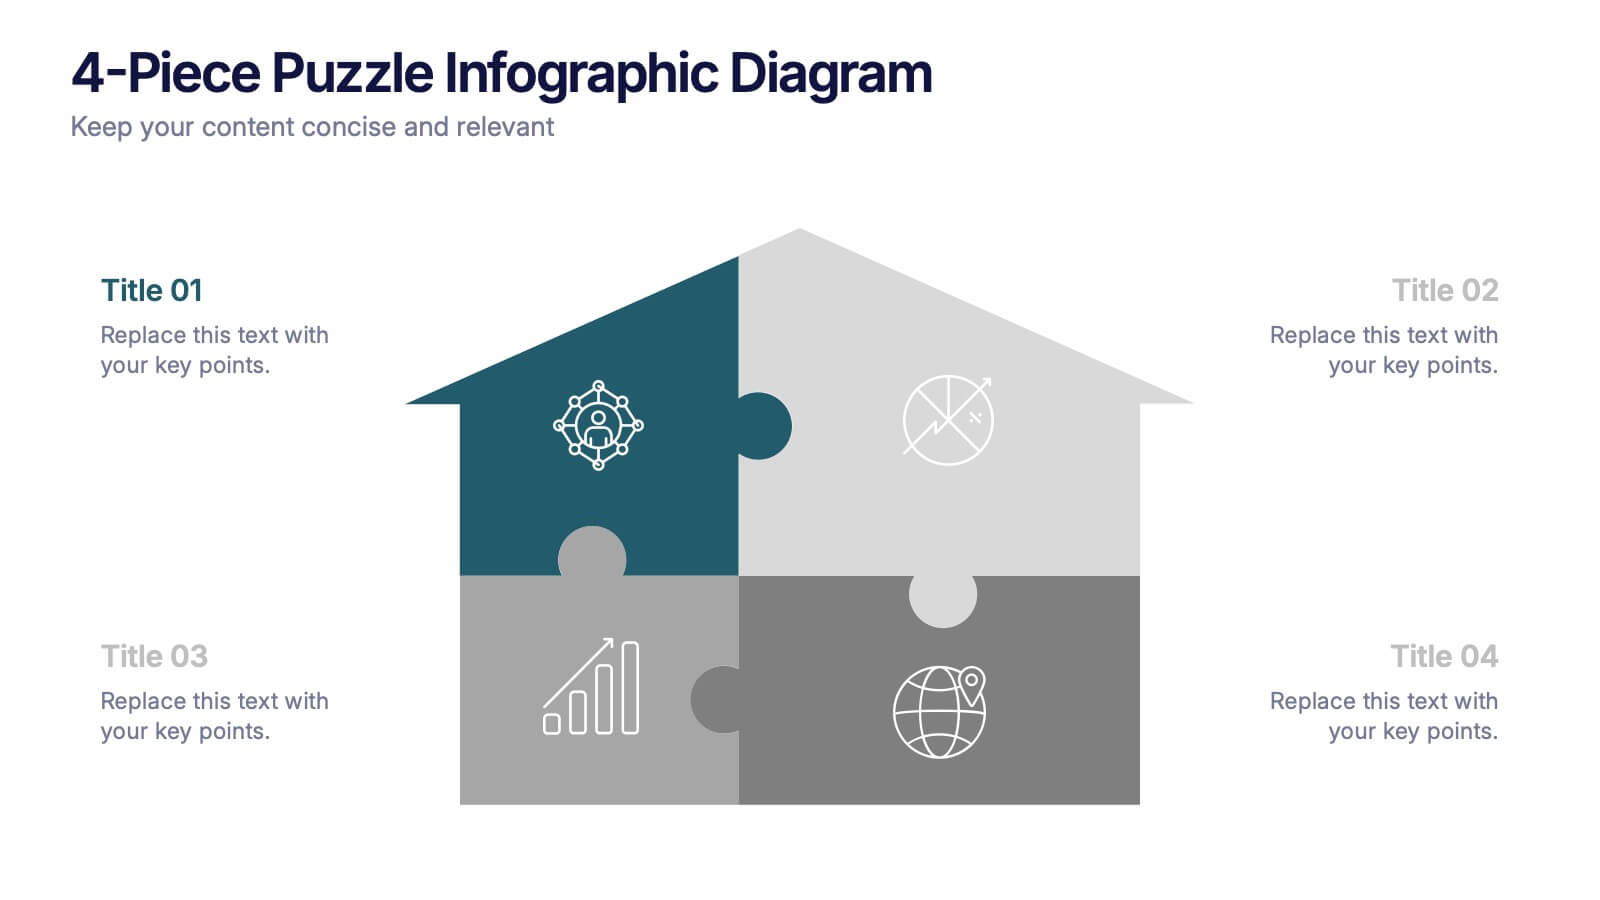
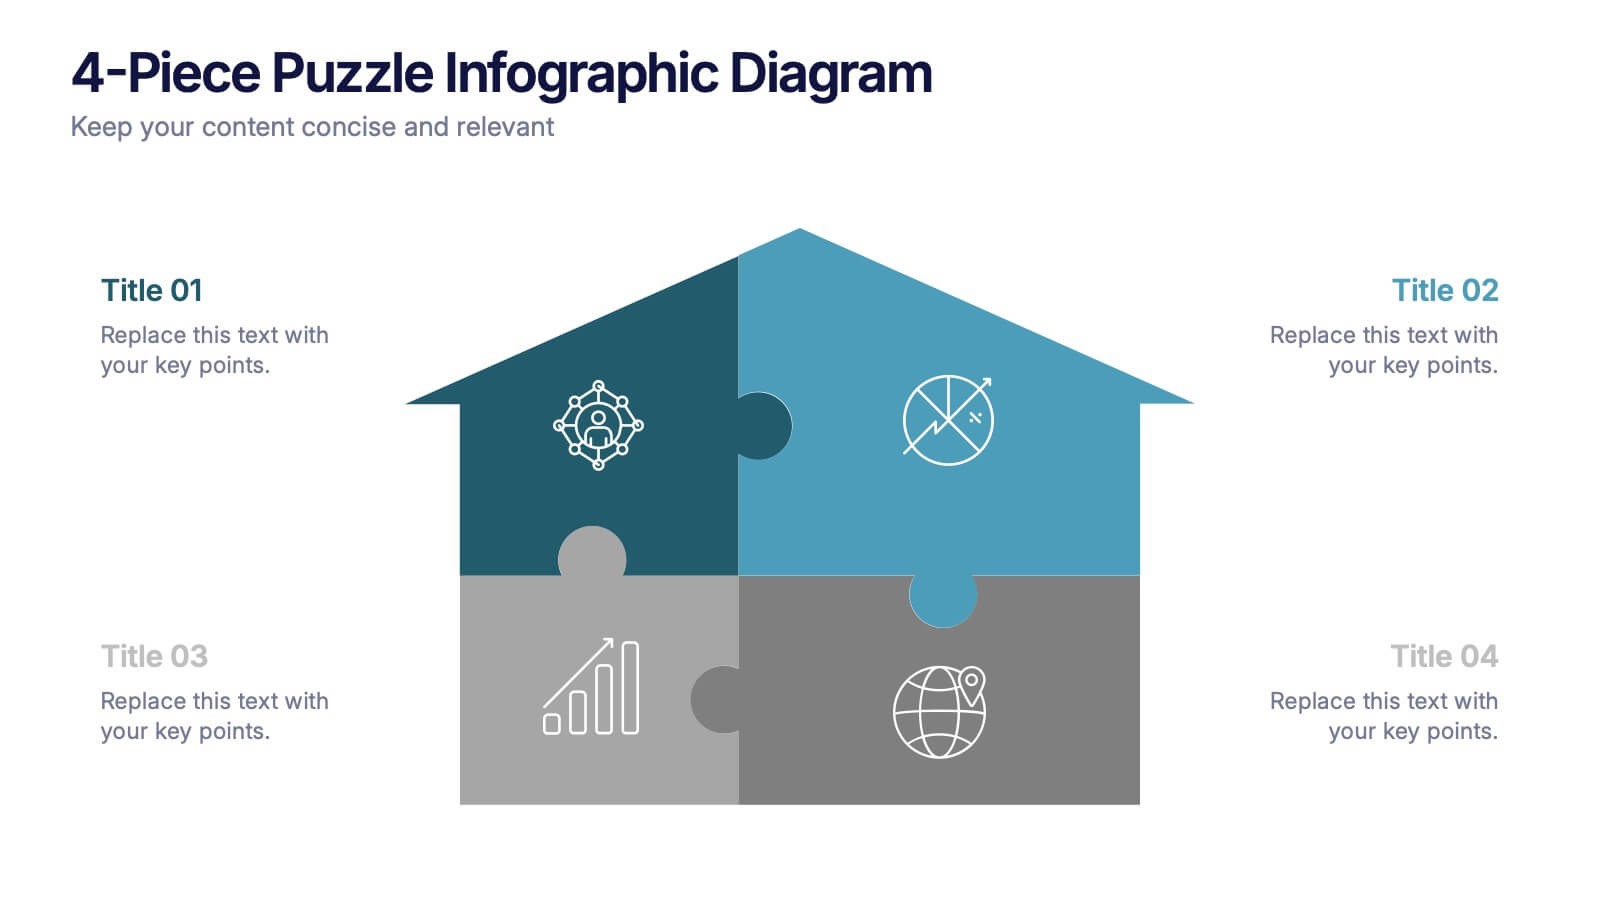
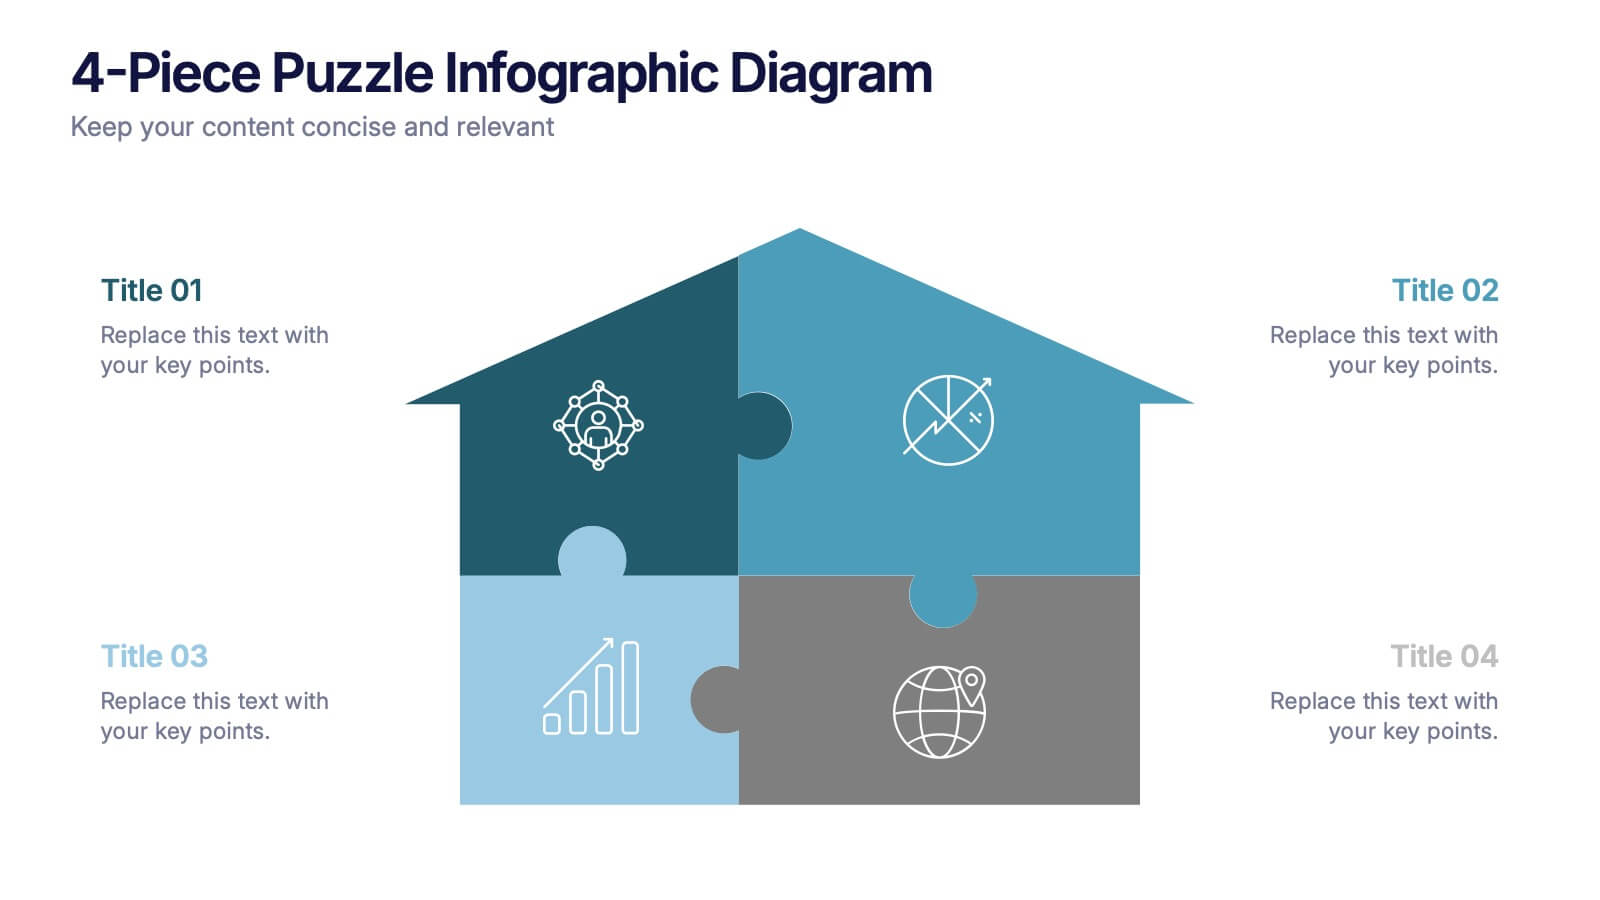
4-Piece Puzzle Infographic Diagram Presentation
Bring clarity and impact to your message with a visual layout that snaps big ideas together like a puzzle. This presentation helps you break complex concepts into four connected sections, making explanations easier and more engaging for any audience. Ideal for planning, insights, or strategy sessions. Fully compatible with PowerPoint, Keynote, and Google Slides.


6 diapositivas
Data-Driven Decision Making Presentation
Showcase your data-to-action process with this clean, step-by-step layout. Ideal for illustrating analytics workflows, this template features five connected stages with modern icons and clear labeling. Perfect for business, tech, or strategy presentations. Fully editable in Canva, PowerPoint, and Google Slides to match your branding and communication needs.


20 diapositivas
Illumira Design Proposal Presentation
Impress clients with this modern and professional design proposal presentation template. It covers key sections such as project summary, objectives, budget breakdown, and action plans. Fully customizable with clean layouts and engaging visuals, perfect for showcasing your design solutions effectively. Compatible with PowerPoint, Keynote, and Google Slides.


5 diapositivas
Innovative Strategic SWOT Layout
Visualize your strategic edge with the Innovative Strategic SWOT Layout Presentation. This clean, overlapping-circle design brings attention to the interconnection between Strengths, Weaknesses, Opportunities, and Threats while maintaining a minimal, modern look. Each element is paired with space for concise insights, making it perfect for leadership briefings, planning sessions, or team reviews. Fully editable in PowerPoint, Keynote, and Google Slides.


5 diapositivas
Closing Slide with Key Takeaways Presentation
Conclude your presentation with impact using the Closing Slide with Key Takeaways Presentation. This streamlined design features a bold visual flow to emphasize up to five main points, ensuring your audience walks away with clear, memorable insights. Ideal for summarizing findings, next steps, or action items. Fully customizable and works seamlessly with PowerPoint, Keynote, and Google Slides.


10 diapositivas
Lean Six Sigma Business Strategy Presentation
Enhance your operational efficiency with our Lean Six Sigma Business Strategy template! This user-friendly guide helps you navigate through the core stages—Define, Measure, Analyze, Improve, and Control—optimizing processes and reducing waste. Compatible with PowerPoint, Keynote, and Google Slides, this template is perfect for professionals aiming to drive business excellence through structured problem-solving.


5 diapositivas
Data Analytics Heat Map
Visualize data intensity and trends effortlessly using this heat map-style layout. Ideal for performance tracking, comparative analysis, and decision-making frameworks, this slide organizes information by low, medium, and high value ranges. Fully customizable in PowerPoint, Keynote, and Google Slides.


5 diapositivas
Pandemic Spreading & Symptoms Infographics
Pandemic spreading refers to the rapid and widespread transmission of a contagious disease, affecting a large number of people across multiple regions or countries. These infographic templates are comprehensive visual tools designed to educate and inform viewers about the spreading patterns and symptoms of pandemics. These aims to raise awareness and promote understanding of how pandemics spread, their impact on public health, and the common symptoms associated with infectious diseases. Compatible with Powerpoint, Keynote, and Google Slides. These enable viewers to better understand the dynamics of pandemics and take measures to protect themselves and their communities.