Gantt Chart Infographic Presentation Template
PowerPoint Template and Google Slides Theme


Características
Etiquetas
- Eliminar de favoritos
Plantilla de PowerPoint
1 MB
Plantilla de Google Slides
Enlace externo
Plantilla de Keynote
1 MB
Recomendar
- Eliminar de favoritos
Plantilla de PowerPoint
1 MB
Plantilla de Google Slides
Enlace externo
Plantilla de Keynote
2 MB
7 diapositivas
Company Vision and Future Direction
Bring your company’s future into focus with this sleek, icon-led layout designed to showcase strategic goals, values, and long-term vision. Perfect for leadership presentations, investor updates, or team briefings, this slide turns abstract direction into a clear path forward. Fully compatible with PowerPoint, Keynote, and Google Slides.
- Eliminar de favoritos
Plantilla de PowerPoint
1 MB
Plantilla de Google Slides
Enlace externo
Plantilla de Keynote
1 MB
7 diapositivas
IT Architecture Solution Infographic
Enhance your presentations with our IT Architecture Solution infographic, tailored for optimal clarity in Powerpoint, Keynote, and Google Slides. This infographic offers a comprehensive visual tool to simplify complex IT structures, ideal for professionals aiming to articulate intricate systems with ease. Its design facilitates a clear understanding of hierarchical IT frameworks, making it perfect for educational environments, business meetings, and tech conferences. Our IT Architecture Solution infographic is crafted to aid in the seamless conveyance of IT strategies and structures. The intuitive layout provides a straightforward narrative to IT infrastructure, ensuring your audience grasps technical details without feeling overwhelmed. This infographic is a must-have for anyone presenting IT concepts, delivering a balanced combination of simplicity and detail that caters to both novice and expert levels. With compatibility across various presentation platforms, this infographic integrates smoothly into your existing slides, enhancing your ability to communicate effectively in the digital age. Elevate your IT presentations with this essential visual aid.
- Eliminar de favoritos
Plantilla de PowerPoint
Enlace externo
Plantilla de Google Slides
Enlace externo
Plantilla de Keynote
Enlace externo
15 diapositivas
Business Plan Infographic Presentation
Businesses are important components of a healthy economy and society. They create jobs, drive innovation, encourage entrepreneurship, and contribute to the well-being of society. With this template you can create a clear and effective business Infographic for your pitches, or projects. The design is made to enhance your message and inspire your audience. This template can be used for presenting any business information whether it be data, statistics, facts etc. It is compatible with Powerpoint, keynote and google slides so all the elements are editable, and can be changed to fit your needs.
- Eliminar de favoritos
Plantilla de PowerPoint
1 MB
Plantilla de Google Slides
Enlace externo
Plantilla de Keynote
1 MB
5 diapositivas
The Future of Food Waste Infographics
Food Waste refers to the loss or disposal of food that is still edible or could have been consumed. These infographic template are designed with the aim of raising awareness, inspiring change, and empowering individuals and organizations to take action towards a more sustainable food system. These infographics are perfect for anyone interested in understanding the future trajectory of food waste and exploring potential solutions. With these infographic templates, create a presentation that inspires action and foster a collective commitment to combating food waste for a more sustainable future.
- Eliminar de favoritos
Plantilla de PowerPoint
1 MB
Plantilla de Google Slides
Enlace externo
Plantilla de Keynote
1 MB
5 diapositivas
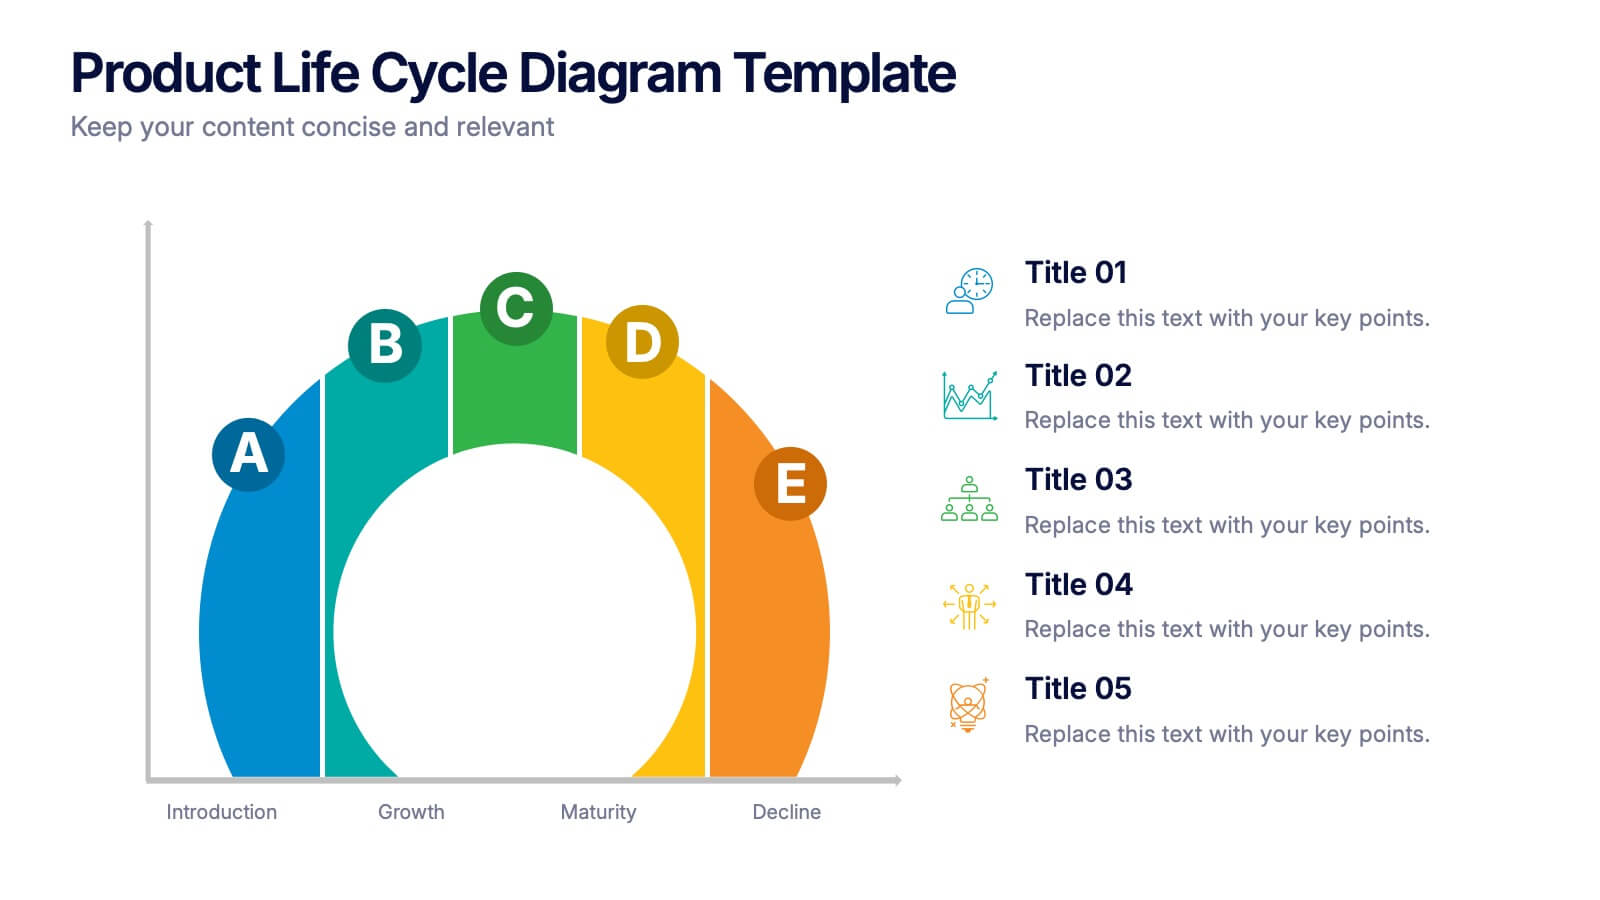
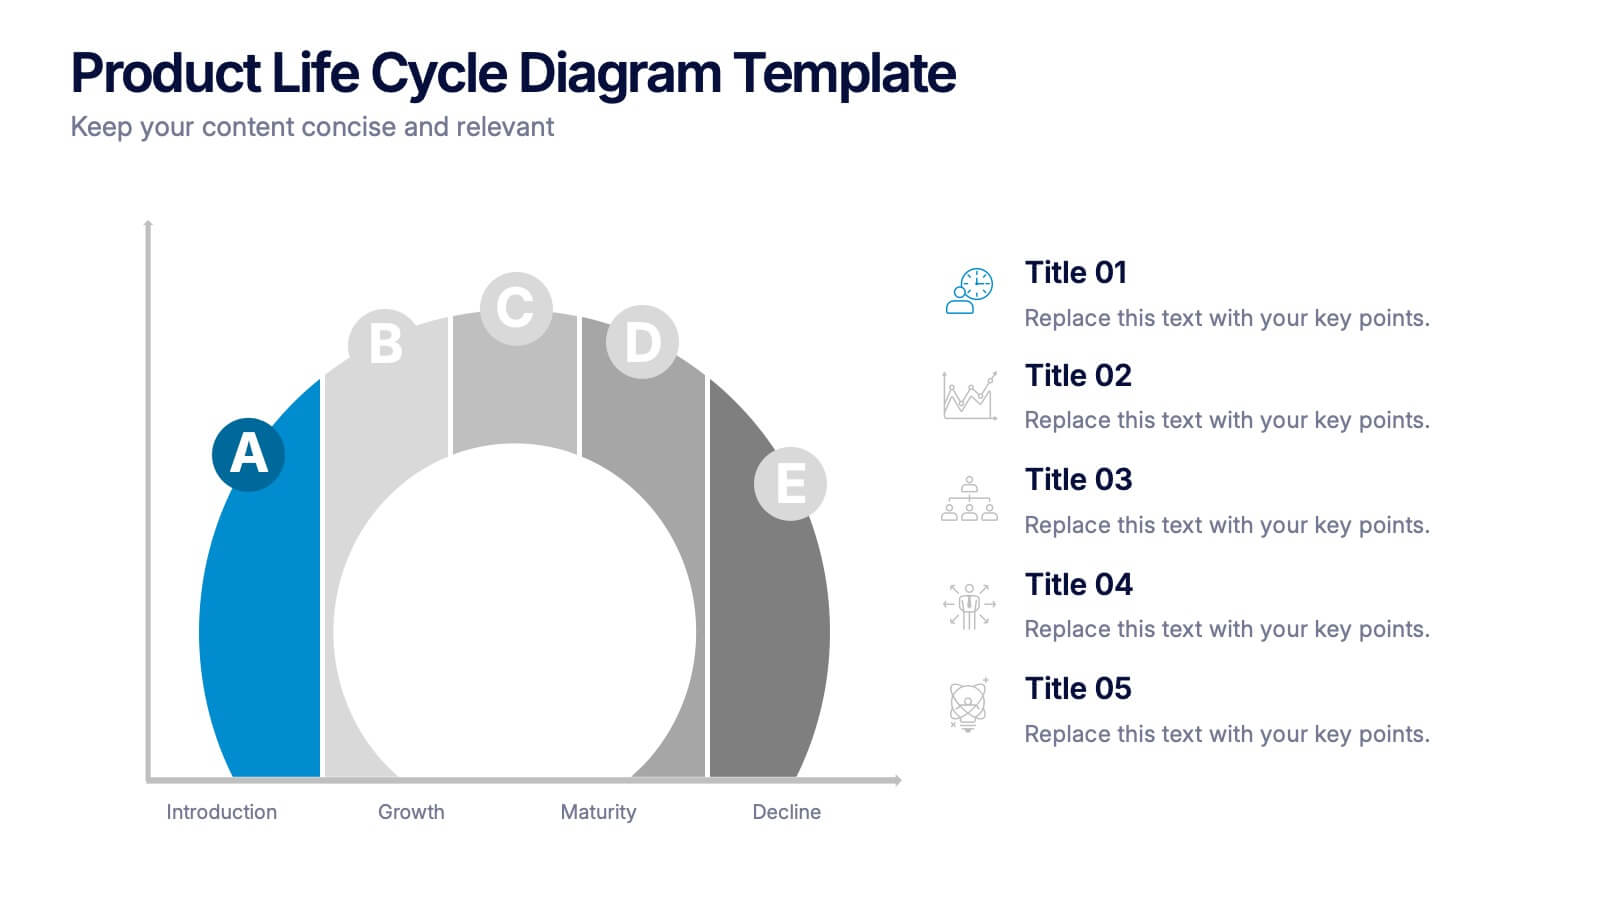
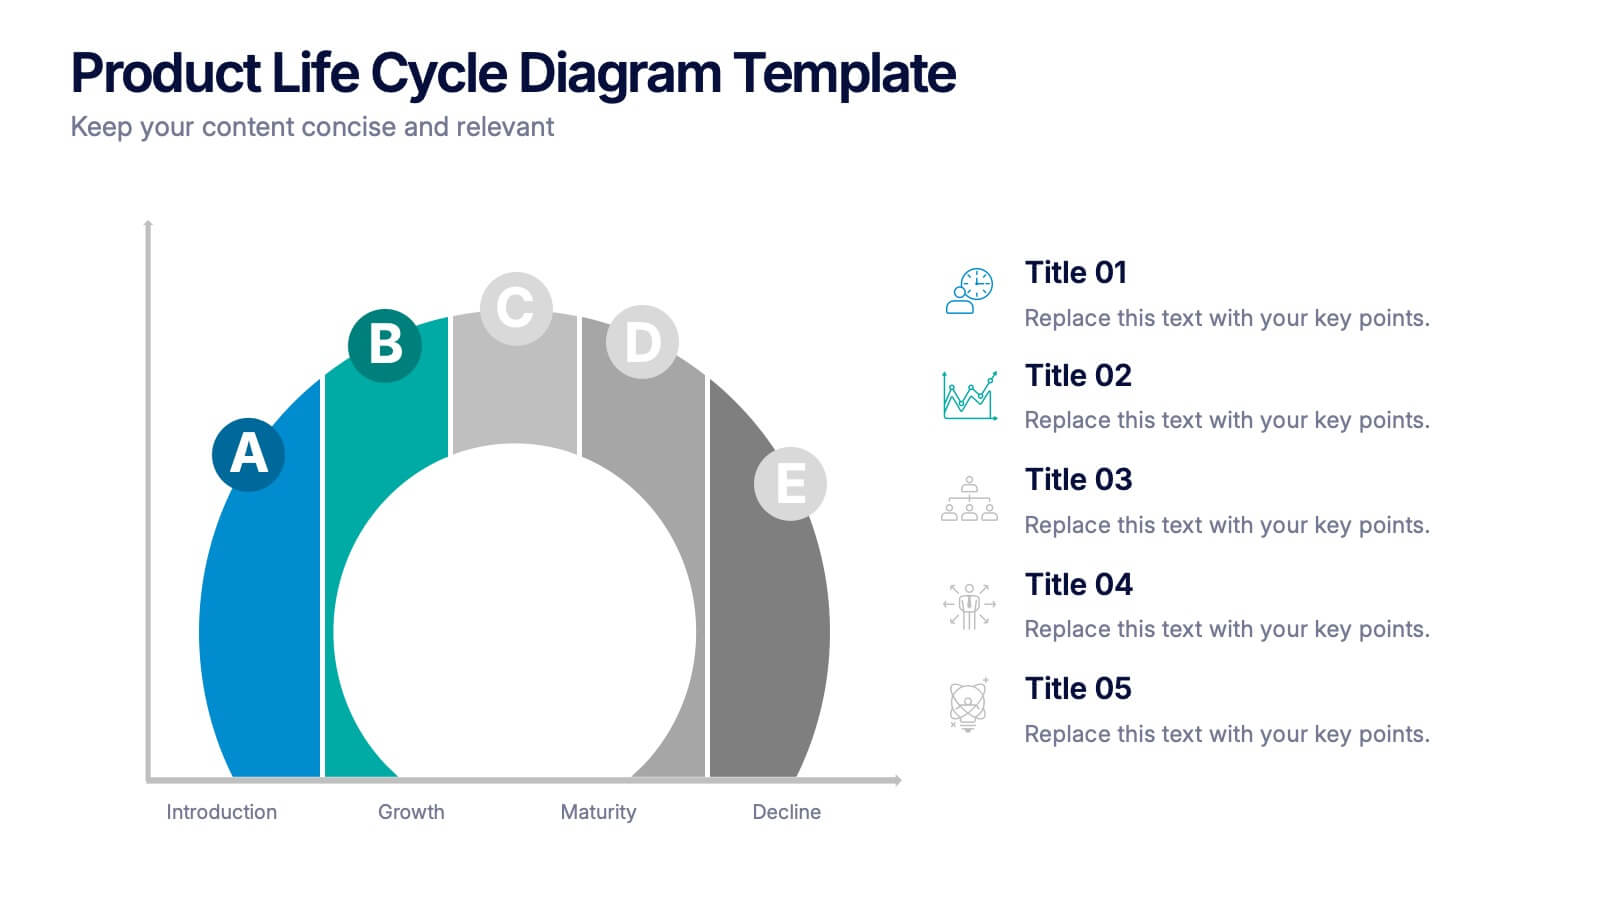
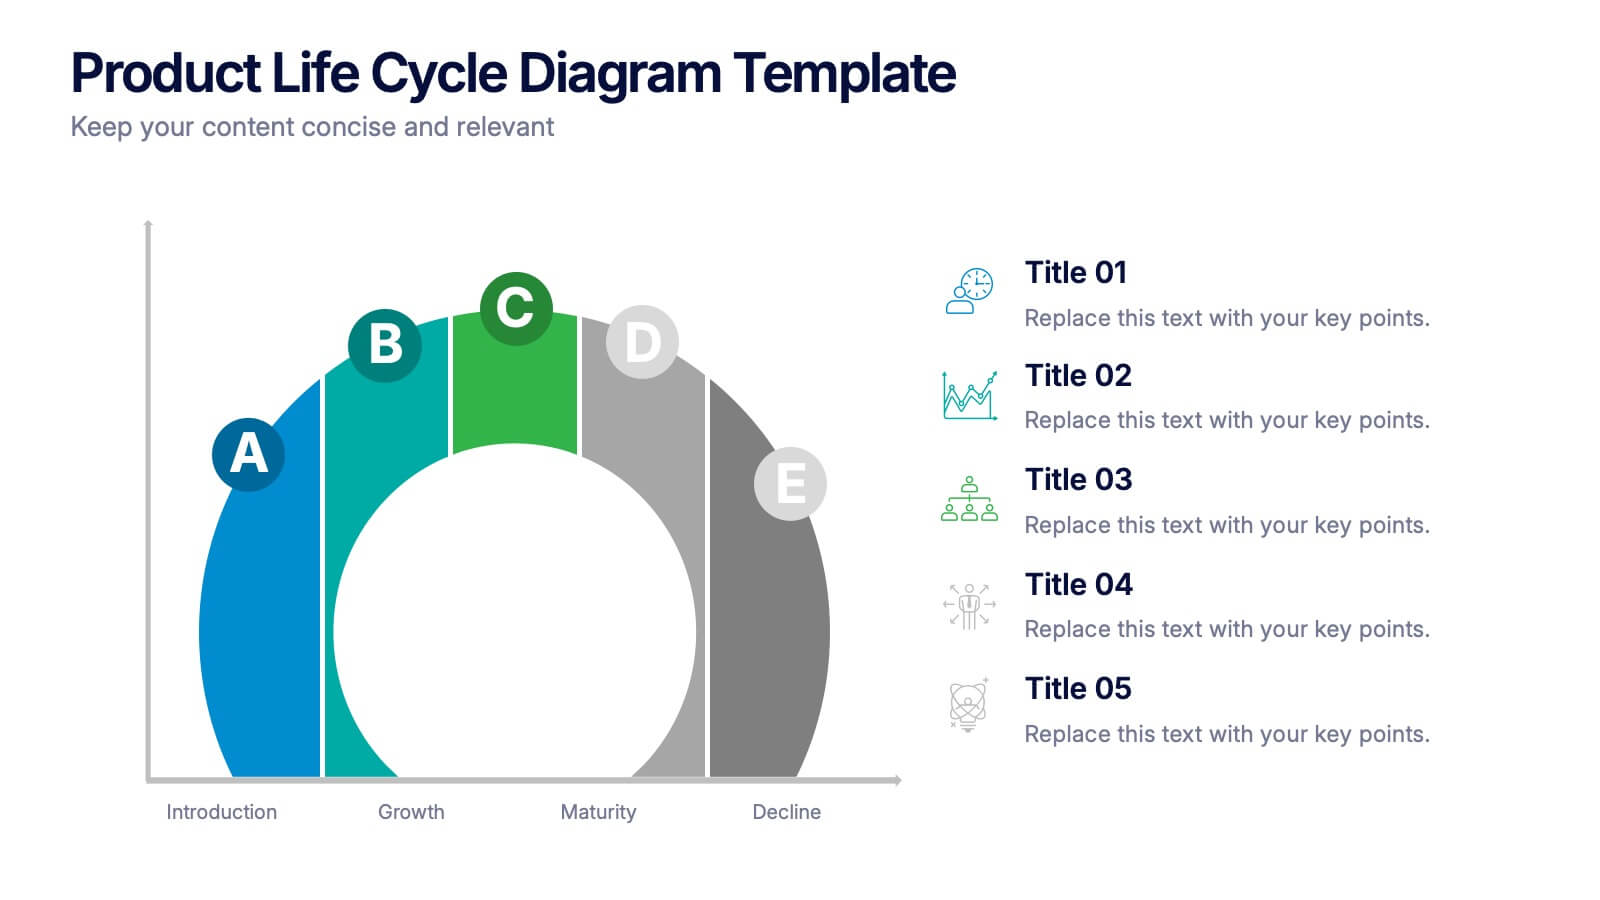
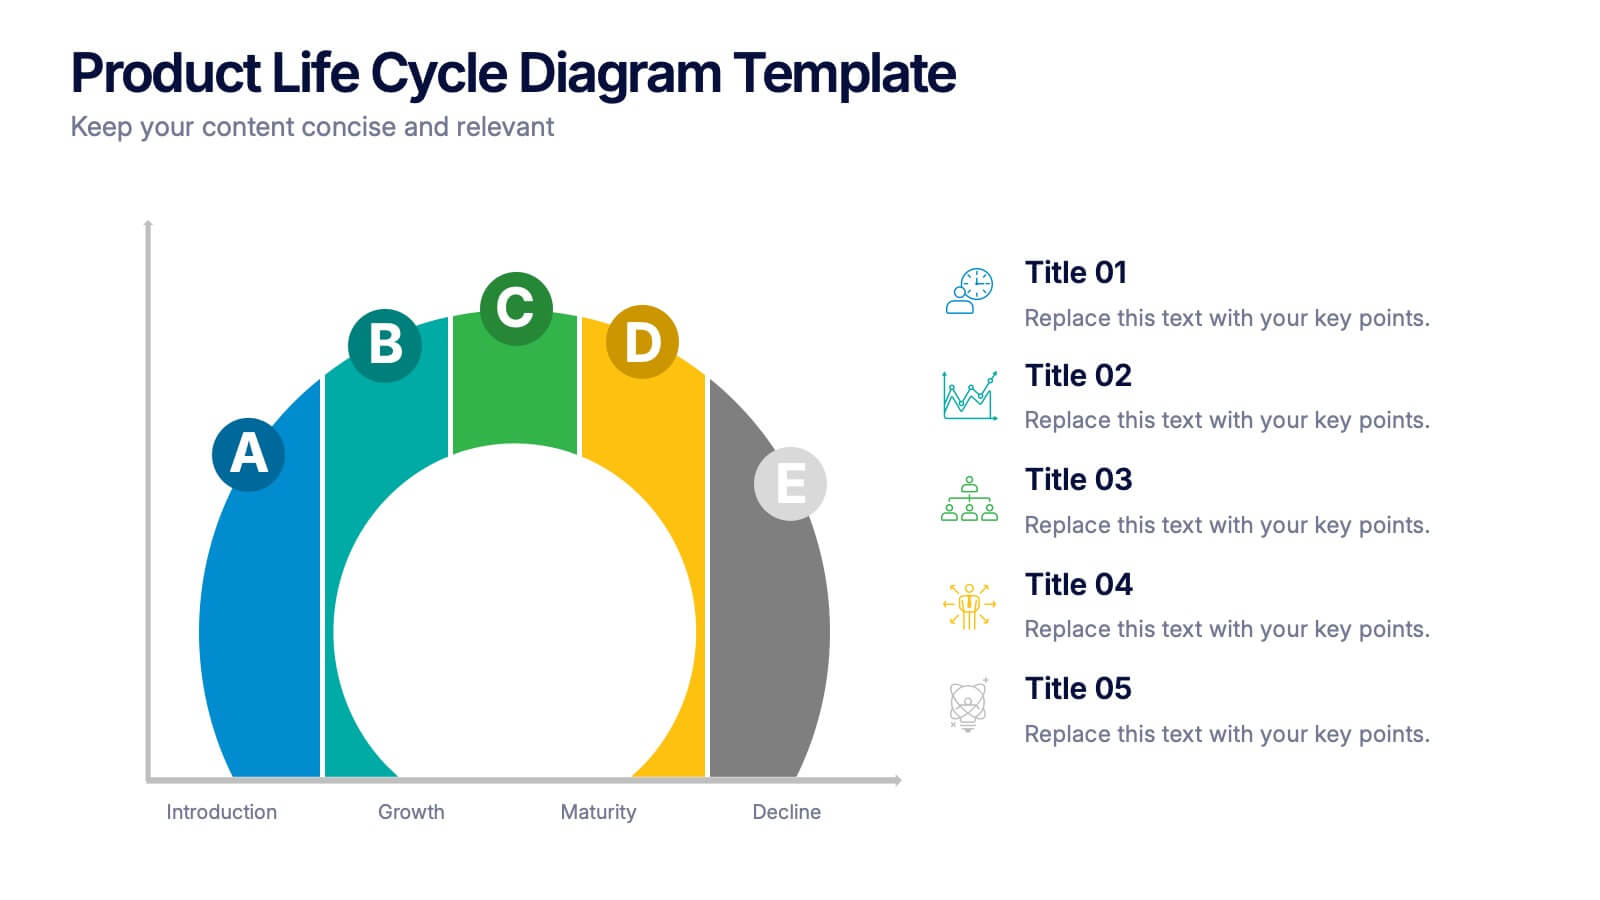
Product Life Cycle Diagram Presentation
Bring your business insights to life with this dynamic visual layout designed to simplify complex growth stages. Ideal for showcasing product performance, innovation timelines, or strategic planning, it transforms data into a clear, engaging narrative. Fully editable and compatible with PowerPoint, Keynote, and Google Slides for professional use.
- Eliminar de favoritos
Plantilla de PowerPoint
1 MB
Plantilla de Google Slides
Enlace externo
Plantilla de Keynote
1 MB
6 diapositivas
Workflow and Operations Flow Presentation
Optimize your operations with the Workflow and Operations Flow presentation. This structured and visually appealing template helps you map out workflows, streamline processes, and enhance team coordination. Perfect for project managers, business analysts, and operational leaders, these fully editable slides allow you to visualize key steps and dependencies with ease. Compatible with PowerPoint, Keynote, and Google Slides.
- Eliminar de favoritos
Plantilla de PowerPoint
1 MB
Plantilla de Google Slides
Enlace externo
Plantilla de Keynote
2 MB
6 diapositivas
Supply Chain Management Strategy
Navigate your next big idea with a flow that’s clear, visual, and sharp. This presentation template breaks down key business logistics and process steps into a bold, easy-to-follow infographic layout. Ideal for showcasing strategic planning and operational structure, it's fully compatible with PowerPoint, Keynote, and Google Slides for effortless use.
- Eliminar de favoritos
Plantilla de PowerPoint
1 MB
Plantilla de Google Slides
Enlace externo
Plantilla de Keynote
1 MB
5 diapositivas
Business and Personal Goal Planning Presentation
Align your vision with action using the Business and Personal Goal Planning slide. This clean, professional layout helps break down up to four key objectives using flag-themed visuals, customizable text blocks, and supportive icons. Perfect for comparing business goals with personal development targets in a single view. Fully editable in PowerPoint, Keynote, and Google Slides—ideal for team meetings, coaching sessions, or strategic planning.
- Eliminar de favoritos
Plantilla de PowerPoint
1 MB
Plantilla de Google Slides
Enlace externo
Plantilla de Keynote
2 MB
5 diapositivas
Professional Business People Collaboration Presentation
Showcase effective teamwork and synergy with this Professional Business People Collaboration slide. The puzzle-piece visual metaphor highlights how diverse roles fit together to build cohesive strategies. With five clearly labeled sections, it’s perfect for project collaboration plans, department overviews, or joint venture strategies. Fully editable and compatible with PowerPoint, Keynote, and Google Slides.
- Eliminar de favoritos
Plantilla de PowerPoint
1 MB
Plantilla de Google Slides
Enlace externo
Plantilla de Keynote
1 MB
6 diapositivas
5-Stage Sales Funnel Presentation
Visualize your sales process effortlessly with this 5-Stage Sales Funnel template. Ideal for showcasing lead conversion, customer journey, and sales strategies, this design is fully customizable. Adjust colors, text, and icons to fit your needs. Compatible with PowerPoint, Keynote, and Google Slides for seamless integration into your presentations.
- Eliminar de favoritos
Plantilla de PowerPoint
1 MB
Plantilla de Google Slides
Enlace externo
Plantilla de Keynote
1 MB
5 diapositivas
Iceberg Model Diagram Presentation
Visualize surface issues and deeper underlying factors with this Iceberg Model Diagram Template. Perfect for presentations on behavior analysis, root cause, or systems thinking. Each layer is clearly marked with colorful labels and matching text areas. Fully editable in PowerPoint, Keynote, and Google Slides for streamlined, impactful communication.
- Eliminar de favoritos
Plantilla de PowerPoint
4 MB
Plantilla de Google Slides
Enlace externo
Plantilla de Keynote
2 MB
5 diapositivas
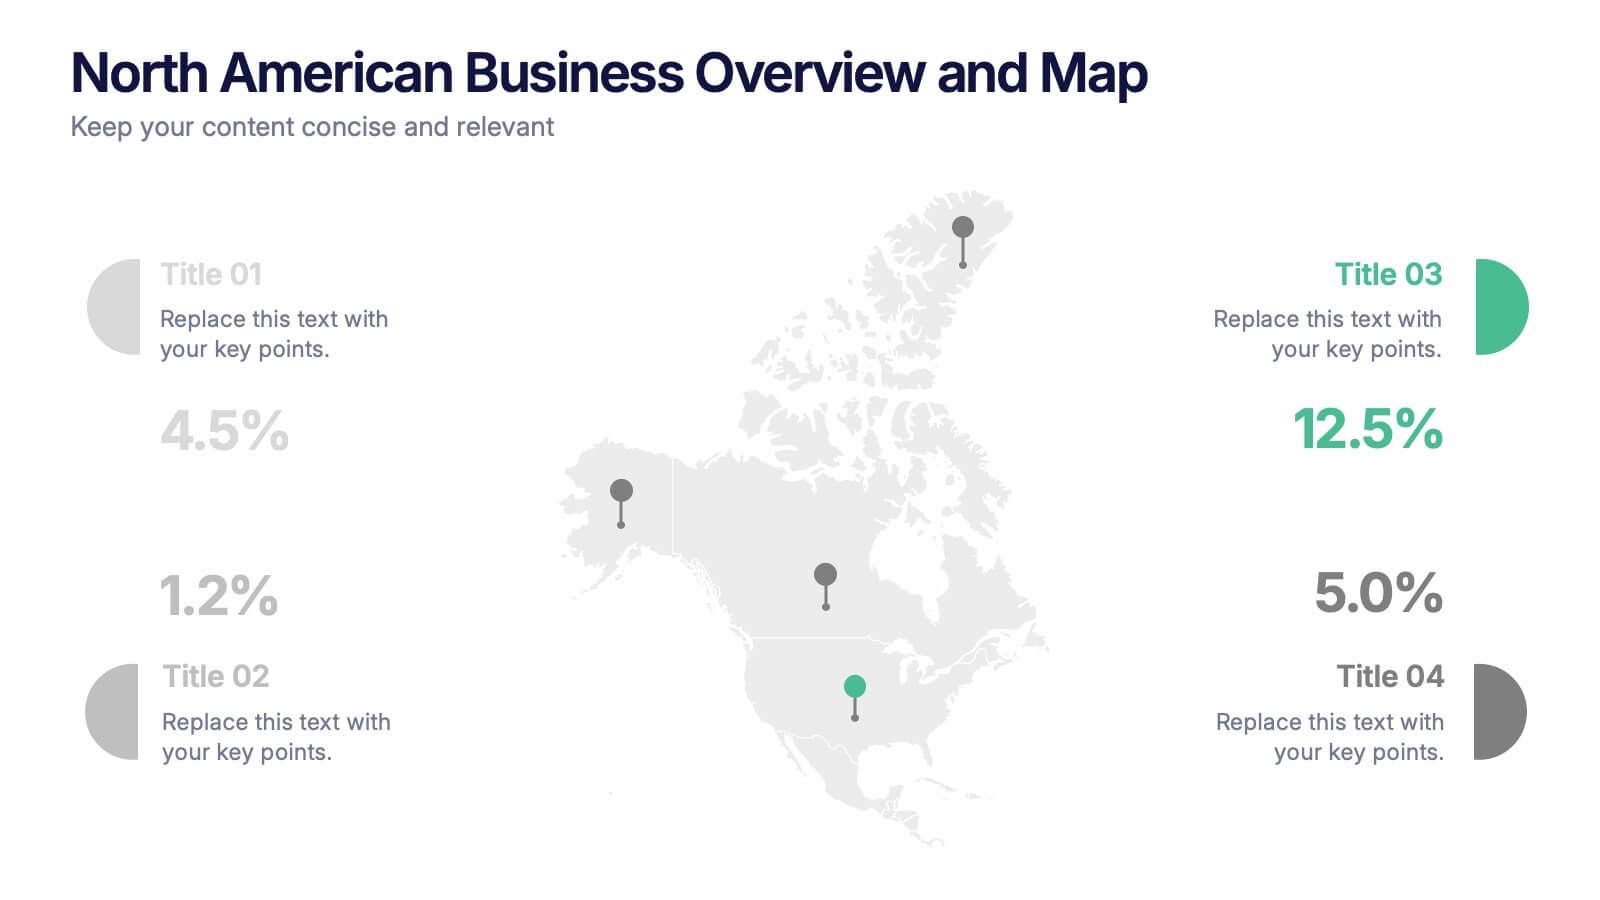
North American Business Overview and Map Presentation
Showcase regional performance data across North America with this clean, data-driven map slide. Highlight four key statistics using pinpoint markers and modern percentage indicators. Ideal for market overview, financial reporting, or strategic insights. Fully customizable and compatible with PowerPoint, Keynote, and Google Slides for seamless business presentations.
- Eliminar de favoritos
Plantilla de PowerPoint
1 MB
Plantilla de Google Slides
Enlace externo
Plantilla de Keynote
1 MB
4 diapositivas
Case Analysis for Executive Decision Making Presentation
Guide stakeholders through data-driven insights with the Case Analysis for Executive Decision Making Presentation. This layout uses a clear upward progression with labeled steps to showcase milestones, challenges, or strategic outcomes—perfect for leadership meetings or high-level reviews. Fully customizable in PowerPoint, Keynote, and Google Slides.
- Eliminar de favoritos
Plantilla de PowerPoint
1 MB
Plantilla de Google Slides
Enlace externo
Plantilla de Keynote
1 MB
4 diapositivas
Business Decision-Making Framework Presentation
Visualize your path to smarter choices with this key-themed decision-making template. Ideal for strategy sessions, executive planning, or consulting presentations, it breaks down three core steps leading to actionable results. The layout emphasizes clarity and progression, with editable text zones and sleek icons. Works with PowerPoint, Keynote, and Google Slides.
- Eliminar de favoritos
Plantilla de PowerPoint
1 MB
Plantilla de Google Slides
Enlace externo
Plantilla de Keynote
1 MB
5 diapositivas
Responsibility Assignment Matrix Slide
Make project accountability crystal clear with this smart and structured matrix designed for assigning responsibilities across roles. Ideal for outlining who's doing what in multi-team environments, this slide keeps everyone on the same page using the classic RACI method. Fully compatible with PowerPoint, Keynote, and Google Slides.
- Eliminar de favoritos
Plantilla de PowerPoint
1 MB
Plantilla de Google Slides
Enlace externo
Plantilla de Keynote
1 MB
5 diapositivas
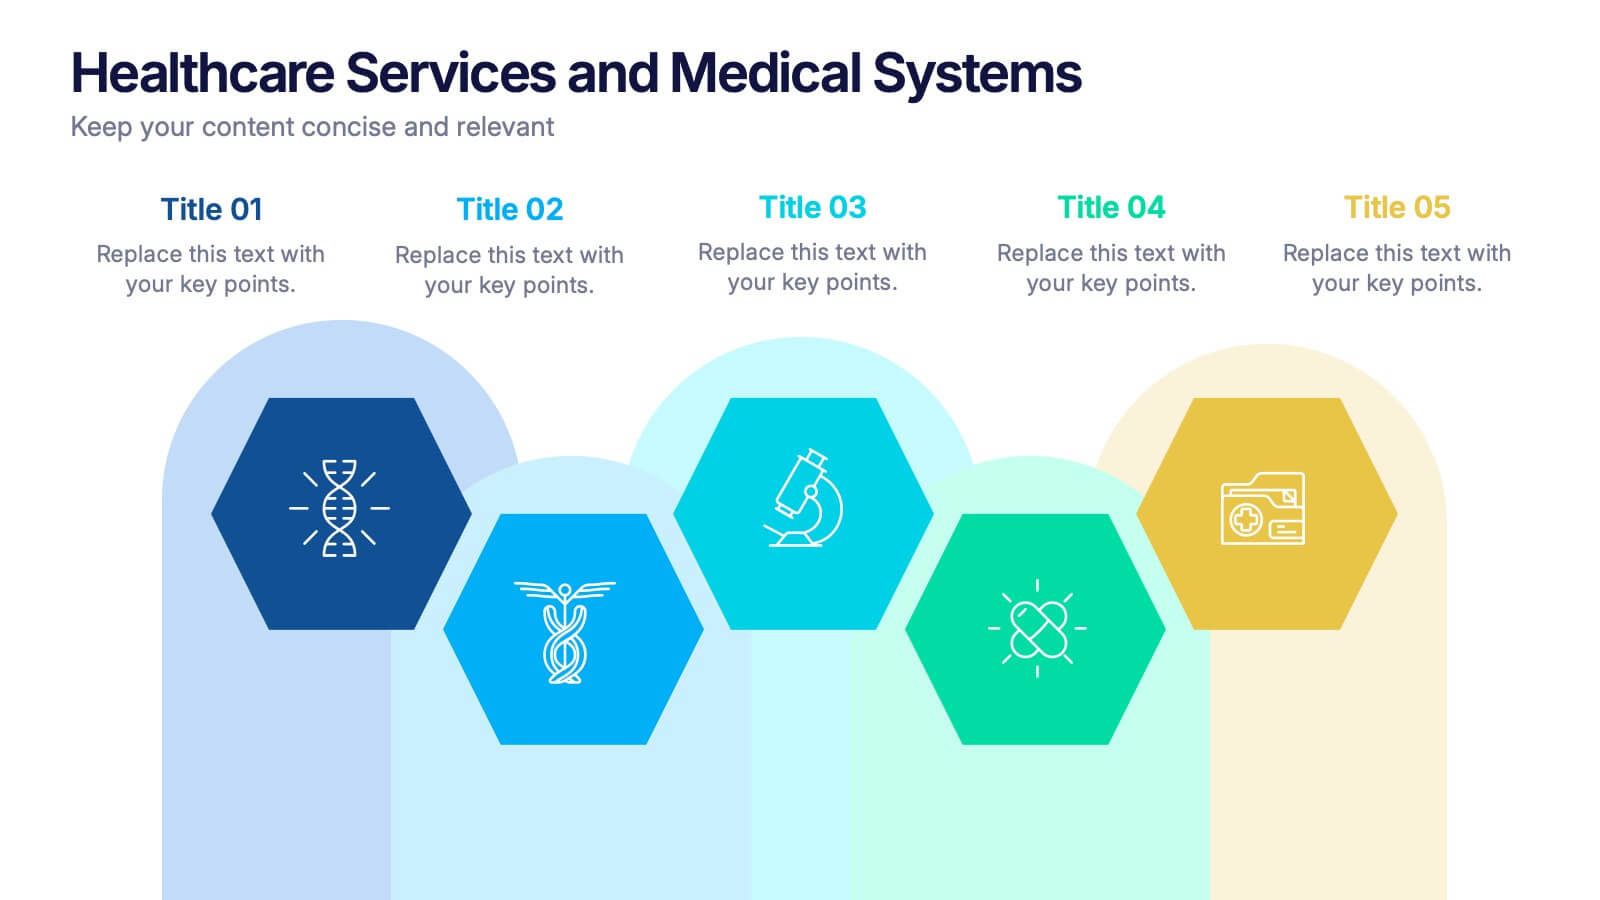
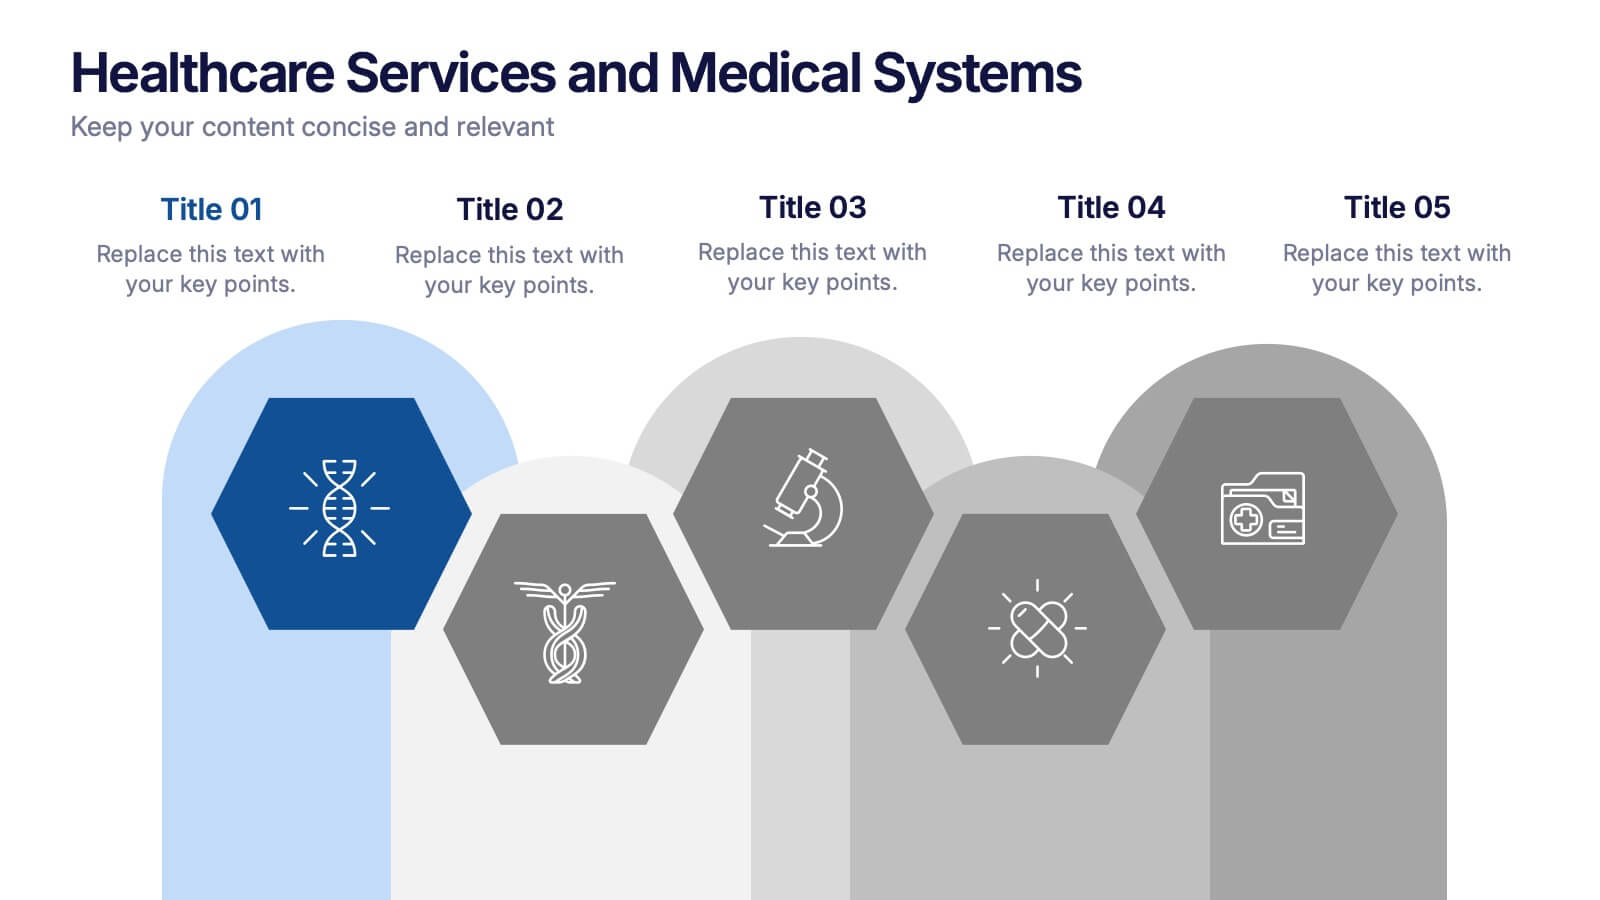
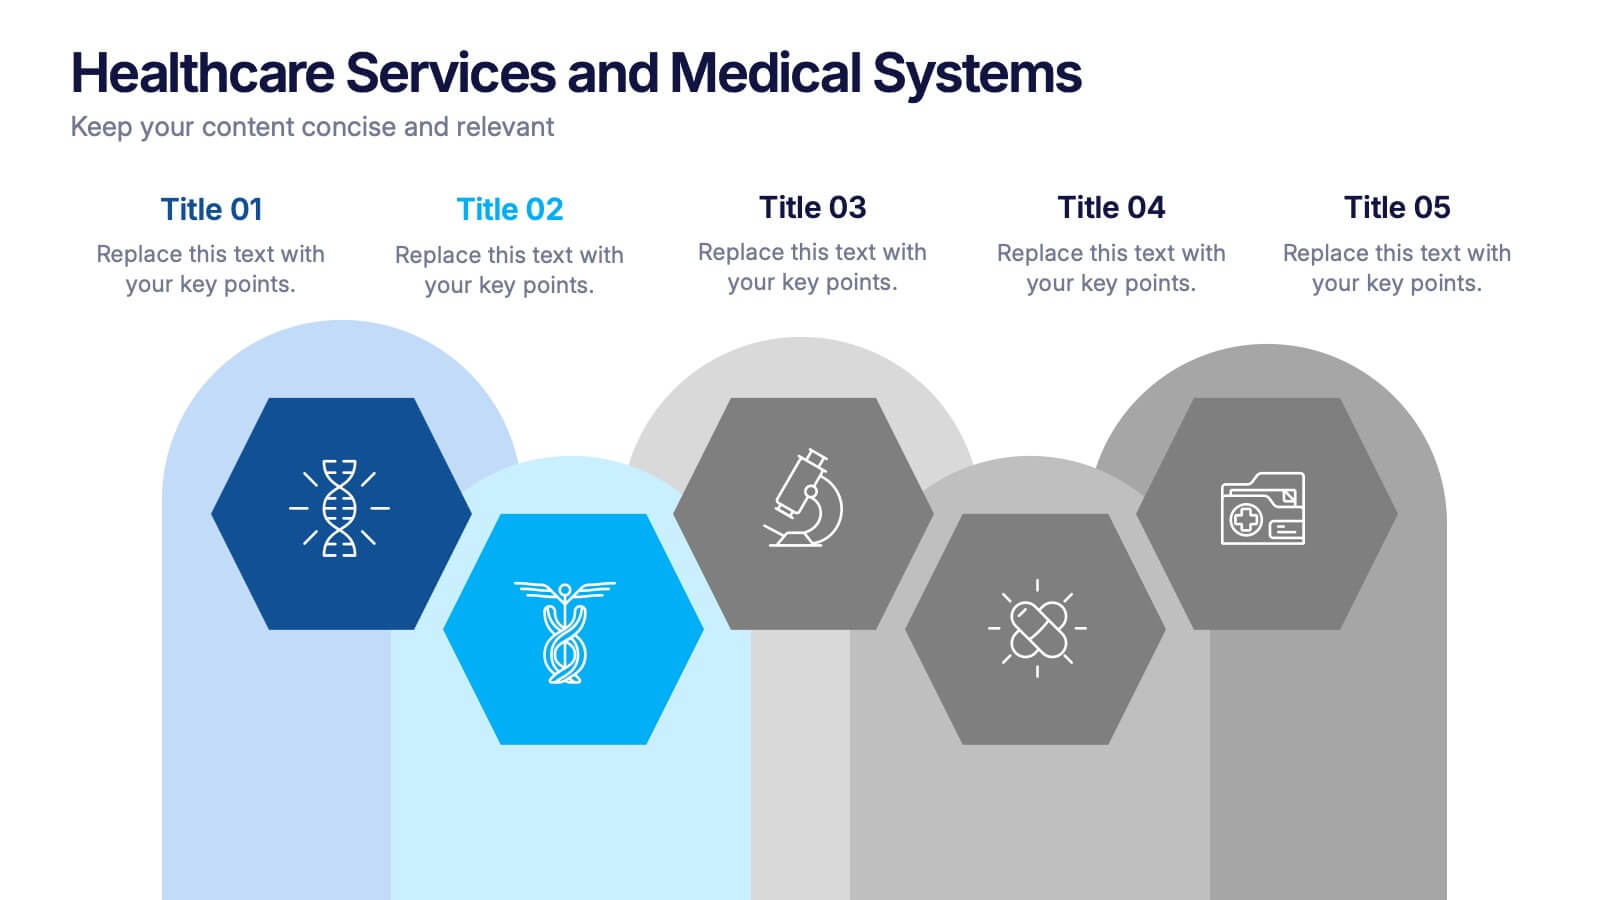
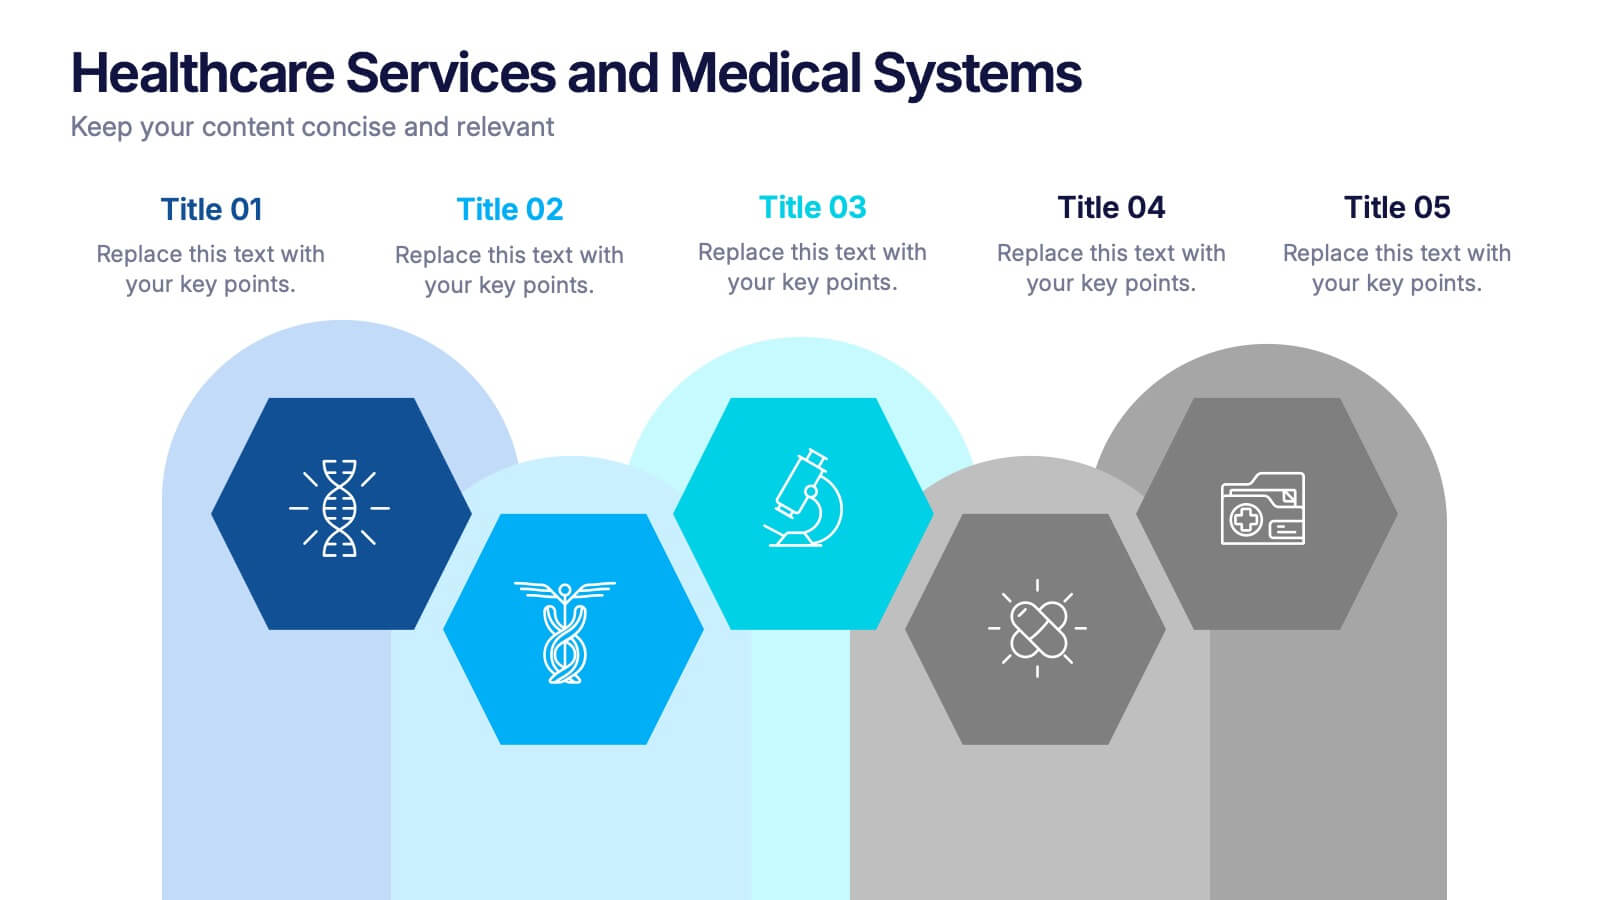
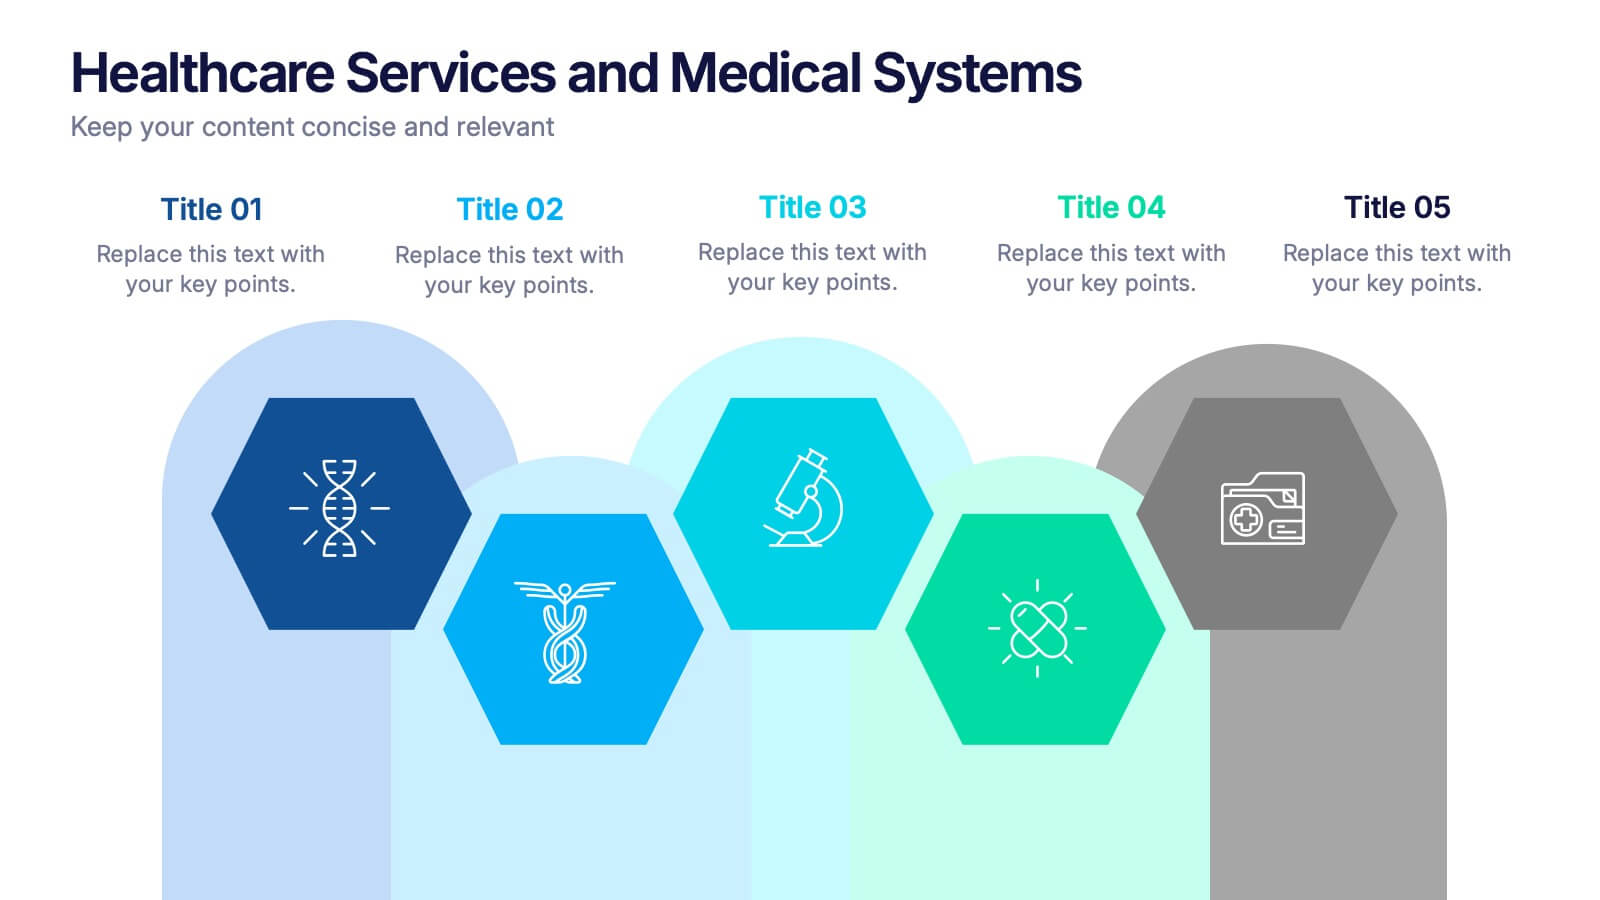
Healthcare Services and Medical Systems Presentation
Visualize your healthcare processes with this hexagonal layout designed for medical topics. Each section highlights key service areas, ideal for presenting hospital systems, diagnostics, or treatment paths. With five editable steps, it's perfect for health professionals, researchers, or medical trainers using PowerPoint, Keynote, or Google Slides.
- Eliminar de favoritos
Plantilla de PowerPoint
1 MB
Plantilla de Google Slides
Enlace externo
Plantilla de Keynote
1 MB
7 diapositivas
Break Even Point Infographic Presentation
A Break Even Analysis Infographic is a visual tool that helps businesses and organizations understand the point at which they will begin to make a profit. This template uses a graph to show the relationship between fixed costs, revenue, and profits at different levels of production or sales. This Infographic also includes a graph with two lines: one representing fixed costs and the other representing total revenue. The point at which these lines intersect represents the break-even point, which is the level of sales or production at which the business will neither make a profit nor incur a loss.


