


Características


¿Tienes alguna pregunta?
Recomendar


20 diapositivas
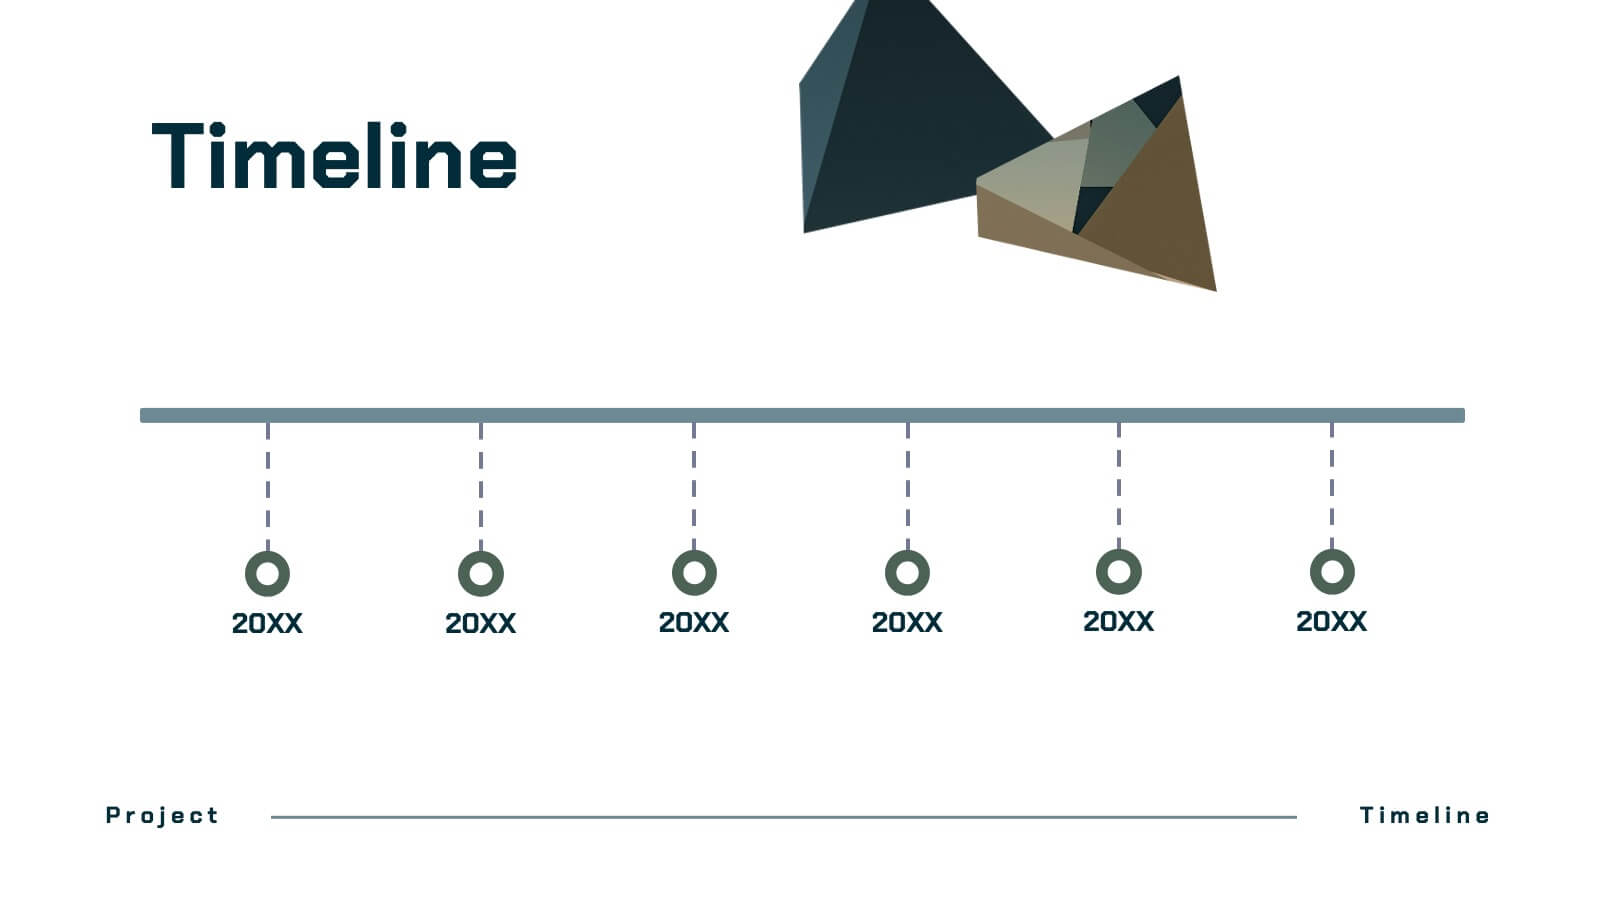
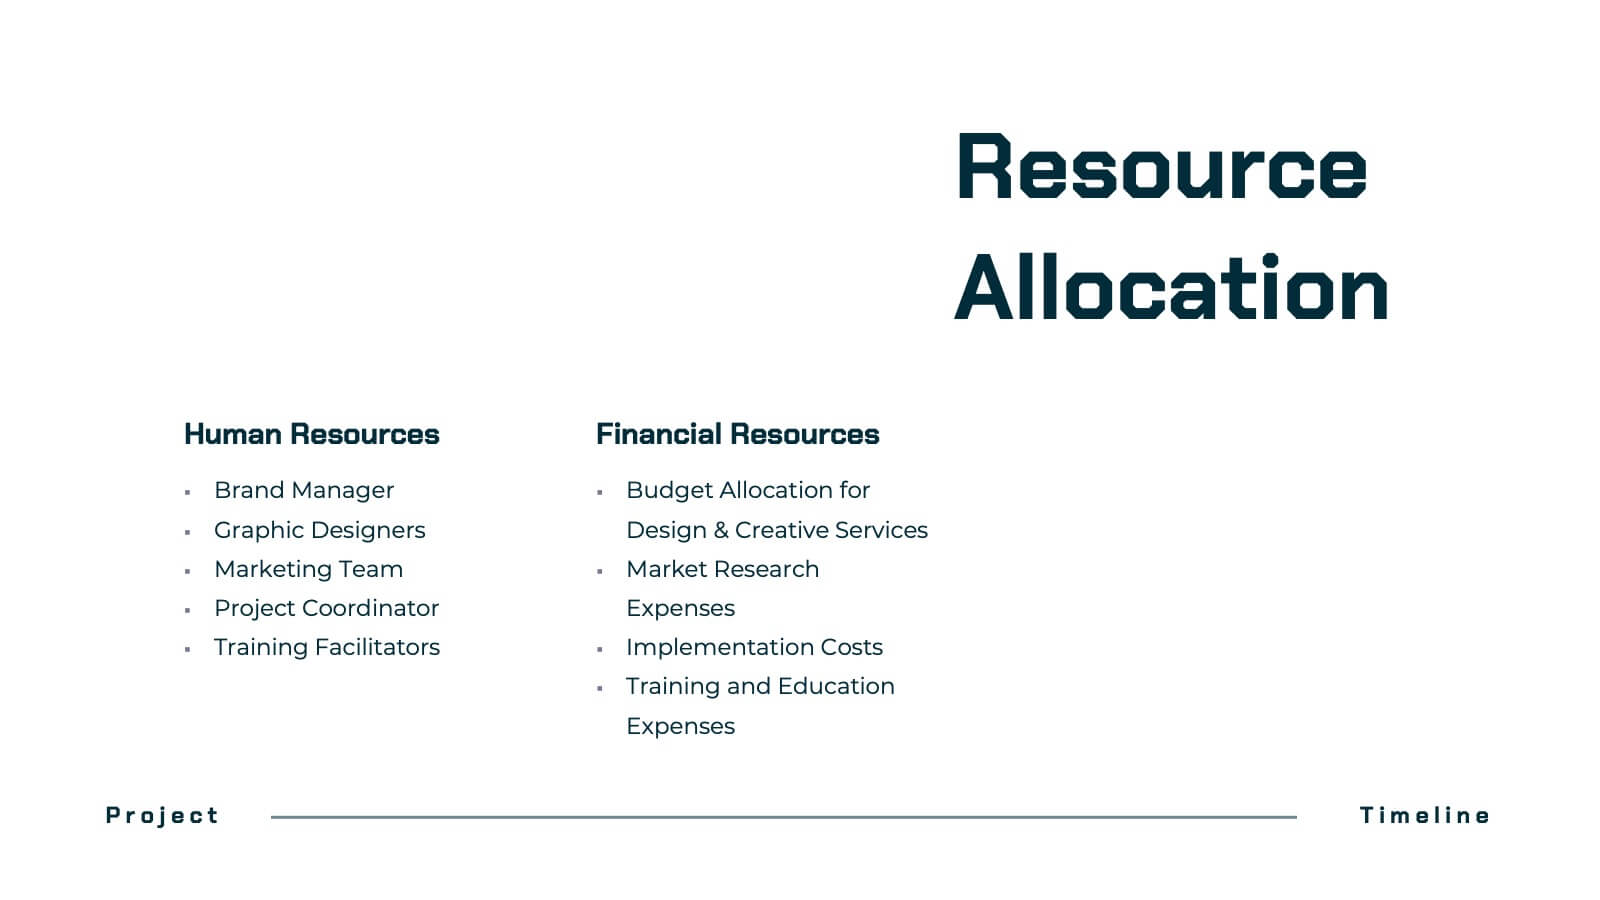
Dynastream Project Timeline Presentation
Stay on track with this detailed and well-organized project plan presentation designed for success! Covering essential areas like scope, objectives, timeline, budget breakdown, and risk management, it ensures every aspect of your project is clear and actionable. Perfect for team meetings or stakeholder updates, this template is fully compatible with PowerPoint, Keynote, and Google Slides.


6 diapositivas
Growth Chart Infographic
A growth chart is a visual representation that shows the progress of an individual's growth over time. This infographic template is a visual representation that illustrates the growth and progress of various elements over time. These infographic charts are important tools to monitor growth patterns and help detect any potential issues. This growth chart infographic helps convey trends and insights in a clear and engaging manner. This template is compatible with Powerpoint, Keynote, and Google Slides. Allowing you to keep the design clean, easy to understand, and aligned with the message you want to convey.


7 diapositivas
Veterinary Hospital Infographic
A veterinary hospital, is a medical facility that provides healthcare services to animals, primarily focusing on the diagnosis, treatment, and prevention of illnesses and injuries in pets and other animals. This vibrant and heartwarming infographic template brings to life the journey of our beloved pets through the lens of a caring veterinary hospital. Compatible with Powerpoint, Keynote, and Google Slides. This template celebrates the love, care, and healing that happens every day at veterinary hospitals. This infographic is a haven where wagging tails and purring hearts find comfort and a reason to smile.


6 diapositivas
Table of Content Layout Presentation
Kick off your presentation with a clean, modern layout that instantly guides your audience through each section with clarity and style. This design highlights key topics in a structured, easy-to-follow sequence, making navigation simple and intuitive. Fully compatible with PowerPoint, Keynote, and Google Slides for seamless use.


5 diapositivas
Artificial Intelligence Categories Infographics
Artificial Intelligence has the potential to revolutionize industries and create new opportunities for businesses and individuals. These infographic templates provide an overview of the different categories of artificial intelligence based on their functionality and applications. These infographics feature futuristic designs with icons and illustrations to represent each category of AI. The categories in this template are described with a short summary and corresponding icon or illustration. The infographic is designed with a vertical layout and uses a blue color scheme throughout. This template is perfect to introduce the basics of AI to an audience.


4 diapositivas
Startup Investor Pitch Deck
Command investor attention with this dynamic Startup Pitch Deck slide. Featuring bold metrics, sleek data visualizations, and clean typography, it's designed to highlight growth and business potential. Fully editable in PowerPoint, Keynote, and Google Slides—ideal for tech, finance, and innovation-driven startups.


6 diapositivas
Anatomy of the Body Infographics
Explore the Anatomy of the Body with our customizable infographic template. This template is fully compatible with popular presentation software like PowerPoint, Keynote, and Google Slides, allowing you to easily customize it to illustrate and communicate various aspects of human anatomy. The Anatomy of the Body infographic template offers a visually engaging platform to outline the major systems, organs, and structures within the human body. Whether you're a student, healthcare professional, or simply interested in understanding the human body, this template provides a user-friendly canvas to create informative presentations and educational materials. Deepen your knowledge of human anatomy with this SEO-optimized infographic template, thoughtfully designed for clarity and ease of use. Customize it to showcase the circulatory system, respiratory system, digestive system, skeletal system, and more, ensuring that your audience gains a comprehensive understanding of the complex and fascinating world of human anatomy. Start crafting your personalized infographic today to explore the Anatomy of the Body in greater detail.


4 diapositivas
Step-by-Step 30-60-90 Milestones Presentation
Present clear onboarding or strategic progressions with the Step-by-Step 30-60-90 Milestones Presentation. This layout is ideal for showcasing phased plans, goal tracking, and employee integration milestones over time. Each segment highlights a distinct 30-, 60-, and 90-day focus, helping visualize stepwise achievement clearly. Fully editable in PowerPoint, Keynote, and Google Slides.


6 diapositivas
Credit Card Comparison and Features Presentation
Make your decision-making effortless with this bright and visual template that helps you break down features, perks, and details of different cards in one glance. Perfect for financial presentations or product comparisons, it clearly illustrates credit card benefits side by side. Fully compatible with PowerPoint, Keynote, and Google Slides.


5 diapositivas
Contracts and Law Capacity Infographics
In the context of contracts and law, "capacity" refers to a person's legal ability to enter into a contract and be bound by its terms. These colorful infographics are designed to simplify the complex concepts of contracts and law capacity for the audience. This infographic template aims to provide essential information about the legal aspects of contracts and the concept of capacity in a visually appealing manner. This section provides a clear definition of contracts and highlights the essential elements. The template incorporates engaging infographics, icons, and illustrations to visualize key concepts and make the information more memorable.


5 diapositivas
Financial Growth and Spending Overview Presentation
Visualize financial progress with this clean, step-based diagram. Each stage highlights growth or spending insights using stacked icons and upward arrows for easy interpretation. Perfect for reports, planning, or forecasts. Fully editable in Canva, PowerPoint, and Google Slides, it brings structure and clarity to your financial storytelling.


5 diapositivas
Scrum Methodology for Project Management Presentation
Visualize your team’s process with this Scrum Methodology for Project Management Template. Featuring dynamic arrow and gear illustrations, this slide helps convey product development cycles, sprint planning, reviews, and retrospectives in a clean, engaging format. Fully editable and ready for PowerPoint, Keynote, and Google Slides.


4 diapositivas
Personalized Learning Experience Presentation
Present tailored learning paths with this vibrant personalized education slide. Designed with sticky-note and pin graphics, it's ideal for breaking down individual goals, curriculum customization, or adaptive learning models. Fully editable in PowerPoint, Keynote, and Google Slides—perfect for educators, trainers, and instructional designers seeking clarity and engagement in learning presentations.


6 diapositivas
Strategy Wheel Stocks Infographic
A strategy wheel, also known as a strategic wheel or strategy clock, is a visual tool used in strategic management and marketing to analyze and compare different business strategies based on their market positioning and competitive advantage. This Infographic template visually presents different investment strategies in the stock market, helping investors understand and choose the best approach based on their goals and risk tolerance. Use this template to present various strategic options on a circular diagram, allowing for easy comparison and analysis. In each strategy segment provide a brief description of the key features, goals, and risk level.


4 diapositivas
Corporate Governance Structure Presentation
Build transparency and leadership clarity with this clean, layered presentation layout that visualizes company hierarchies and decision-making systems. Ideal for explaining organizational roles, responsibilities, and reporting flows, it simplifies complex structures into easy visuals. Fully editable and compatible with PowerPoint, Keynote, and Google Slides for professional, flexible use.


5 diapositivas
Key Business Question Breakdown Presentation
Present critical insights with this keyhole-themed layout, perfect for outlining strategic business questions or core decision points. The six-segment format allows you to break down complex topics into clear, actionable areas. Fully customizable in Canva, PowerPoint, or Google Slides—ideal for planning, workshops, or stakeholder presentations.


6 diapositivas
Agenda on Education Infographic
Our Agenda Slide Templates are thoughtfully designed to facilitate clear and structured presentations for any educational context. Each template features a clean, professional design, making them ideal for delivering complex information in a digestible format. The collection includes various layouts from simple and focused to more detailed and infographic-rich, ensuring that every meeting's purpose is supported visually and functionally. These slides are customizable, allowing users to easily adapt them by changing colors, text, and graphics to suit specific branding needs. They are perfect for enhancing communication in settings that demand clarity and precision, providing all the necessary tools to organize content effectively and engage audiences. They are perfect for enhancing communication in settings that demand clarity and precision, providing all the necessary tools to organize content effectively and engage audiences.