


Características


¿Tienes alguna pregunta?
Recomendar


5 diapositivas
Actionable Steps for Team Execution Presentation
Highlight progress and key insights with the Actionable Steps for Team Execution Presentation. This vertically stacked arrow slide uses five colorful blocks ascending upward to represent steps, milestones, or growth metrics. Each step includes space for a title and description to clearly outline tasks or performance trends. Ideal for showcasing team roadmaps, strategic plans, or KPIs. Compatible with PowerPoint, Keynote, and Google Slides.


8 diapositivas
Business Funding Pitch Deck
Present your growth story with confidence using this bold and engaging Funding Pitch Deck slide. Designed with vibrant visuals, key funding milestones, and clean icons, it's perfect for showcasing your business’s financial traction. Fully editable in PowerPoint, Keynote, and Google Slides for versatile startup presentations.


6 diapositivas
Breast Cancer Effects Infographic
Breast Cancer Awareness Month, is an annual international health campaign organized by various organizations to raise awareness about breast cancer, highlight the importance of early detection and treatment, and provide support for those affected by the disease. This infographic template is a visual representation that provides information about the various effects and impacts of breast cancer on individuals' health, well-being, and daily lives. This infographic can be used to raise awareness, educate, and support individuals who are affected by breast cancer, as well as their families and communities.
7 diapositivas
Arrow Functions Infographic
Illuminate the nuances of arrow functions with our arrow functions infographic. Displayed on a sleek white backdrop, enhanced with purposeful green, analytical blue, and definitive black, our template articulates the mechanics and applications of arrow functions with utmost clarity. Fitted with lucid infographics, representative icons, and flexible image placeholders, it breaks down the technicalities into digestible insights. Immaculately adapted for Powerpoint, Keynote, or Google Slides. A quintessential tool for software developers, coding instructors, students, or any tech-savvy individual keen on deepening their understanding.


5 diapositivas
Brainstorming Spider Chart Presentation
Turn your ideas into action with a clean, modern design that keeps every thought connected and easy to follow. This presentation helps teams brainstorm, organize concepts, and refine strategies with clarity and flow. Fully editable and compatible with PowerPoint, Keynote, and Google Slides for seamless collaboration.


7 diapositivas
Rotational Process Flow in Wheel Layout Presentation
Showcase continuous workflows, lifecycle stages, or strategic loops with the Rotational Process Flow in Wheel Layout Presentation. This visually engaging circular diagram breaks down processes into six distinct segments, each with editable icons, colors, and titles—ideal for marketing funnels, product development stages, or team cycles. Fully compatible with PowerPoint, Keynote, and Google Slides.


5 diapositivas
Real-Life Case Study Analysis Presentation
Turn data and insights into compelling stories that capture real business impact. This clean, professional layout is perfect for analyzing real-world examples, comparing strategies, and presenting key takeaways. Easy to customize and visually balanced, it’s fully compatible with PowerPoint, Keynote, and Google Slides for seamless use across platforms.


5 diapositivas
5-Year Strategic Roadmap Slide Presentation
Take your audience on a dynamic journey with a flowing, milestone-based layout that makes long-term planning feel clear and engaging. This presentation helps you map out goals, priorities, and key initiatives across five years with structure and clarity. Ideal for strategy meetings and planning sessions. Fully compatible with PowerPoint, Keynote, and Google Slides.


6 diapositivas
Managing Transition in Business Presentation
Make your next strategy session visually unforgettable with this clean, step-by-step layout. Designed to help explain transitional phases in business, this infographic template simplifies complex change processes into digestible segments. Ideal for professionals presenting transformation strategies. Fully editable and compatible with PowerPoint, Keynote, and Google Slides for easy use.


7 diapositivas
Project Proposal Infographic
Enhance your project presentations with our Project Proposal Templates, designed to outline your project comprehensively and engage stakeholders effectively. These templates provide a structured way to present every aspect of the project, from the scope and objectives to the resources and timelines, ensuring all key elements are covered. Each slide is crafted with a professional design, featuring a cohesive green color scheme that not only adds visual appeal but also aids in the organization of information. The templates include various sections such as project background, key objectives, project scope, implementation steps, and projected benefits, which are essential for outlining a clear and detailed project plan. Ideal for project managers, business analysts, and team leaders, these templates can be fully customized to match the specifics of your project, allowing for the addition of text, charts, and graphics as needed. Whether for internal reviews or external pitches, these slides will help you articulate your vision and strategy effectively, fostering clarity and facilitating decision-making.


5 diapositivas
Signs of Diabetes Infographics
There are several common signs and symptoms of diabetes that may indicate the presence of the condition. It's important to note that the symptoms can vary depending on the type of diabetes (Type 1 or Type 2) and individual differences. These infographic templates are informative tools made to help educate individuals about the signs and symptoms of diabetes. These are designed to raise awareness about diabetes, its early warning signs, and the importance of early detection and management. These infographic templates can be effective tools for health professionals, educators, and individuals seeking to understand the signs and symptoms of diabetes.


20 diapositivas
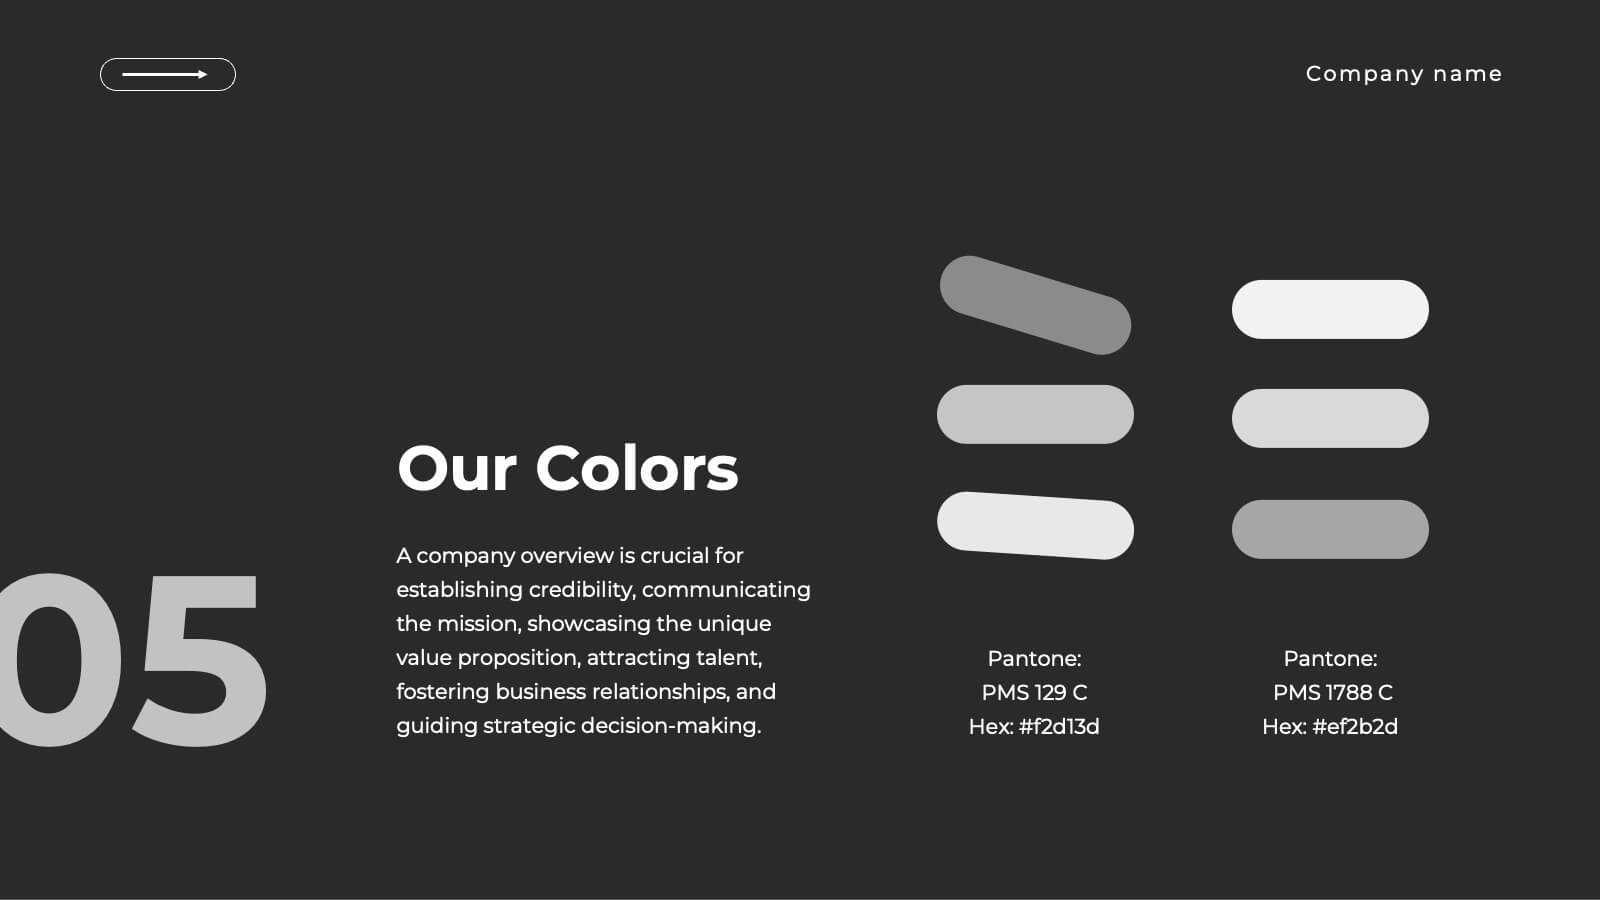
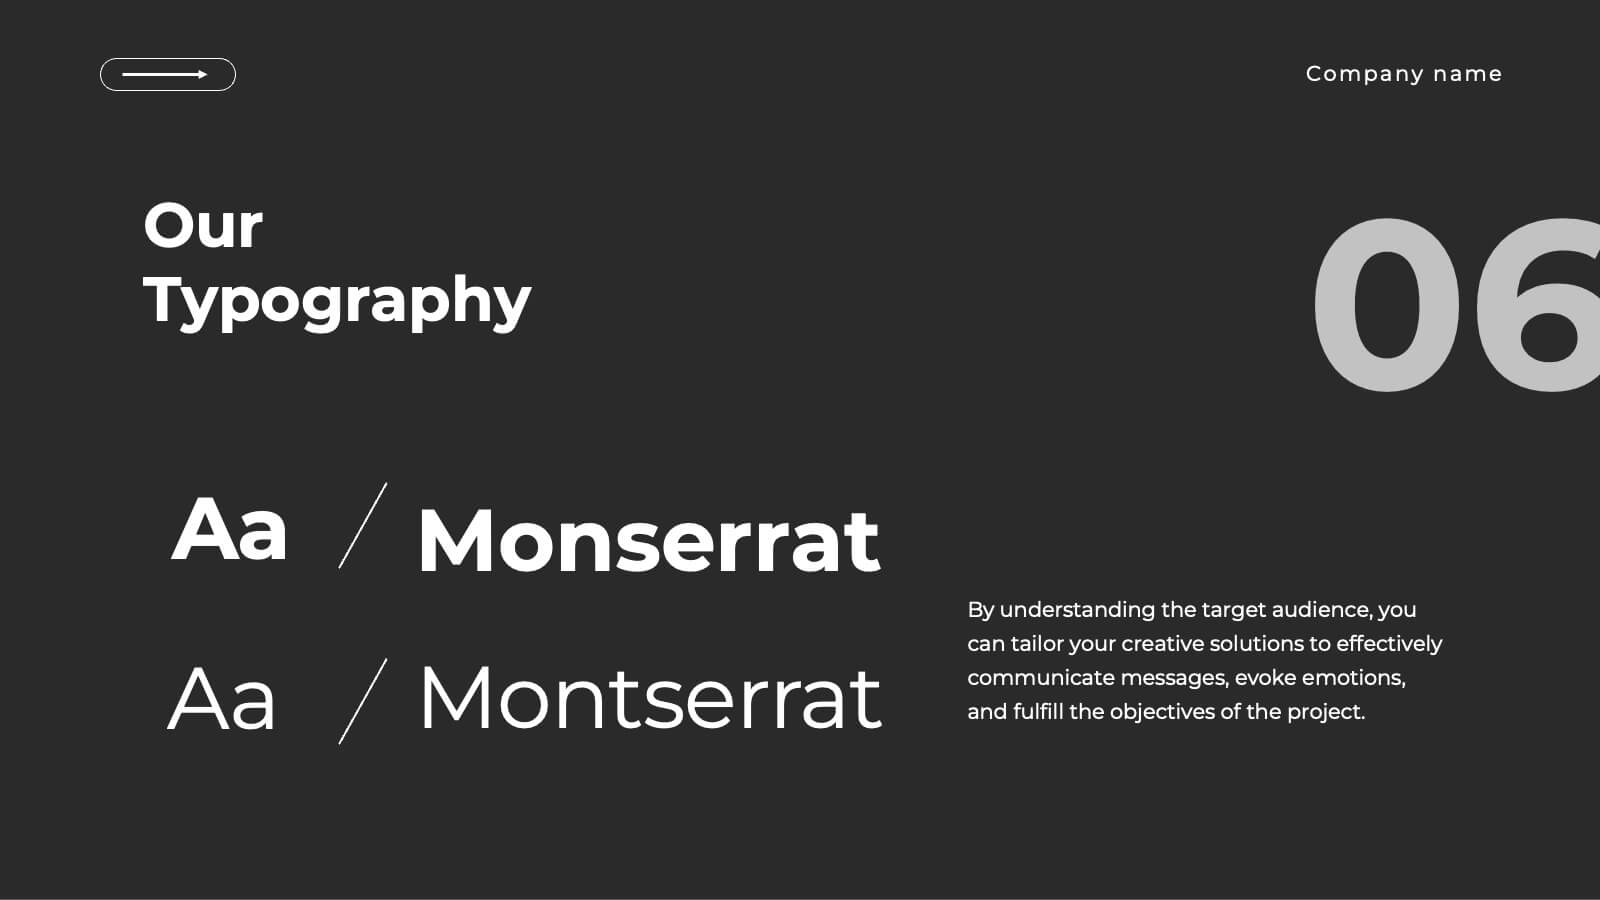
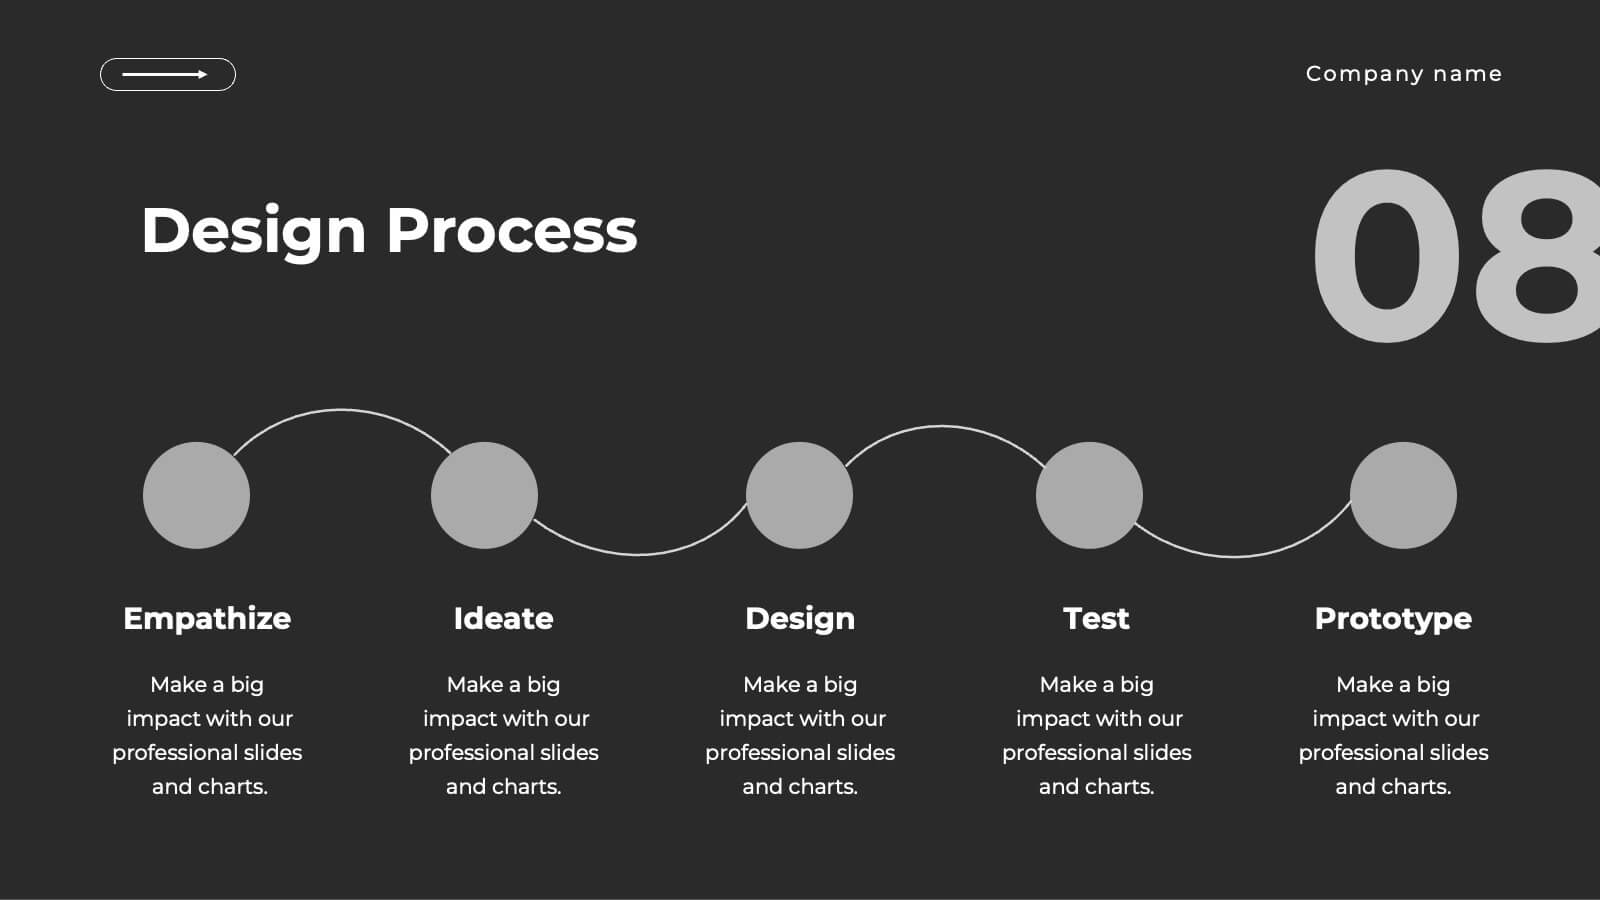
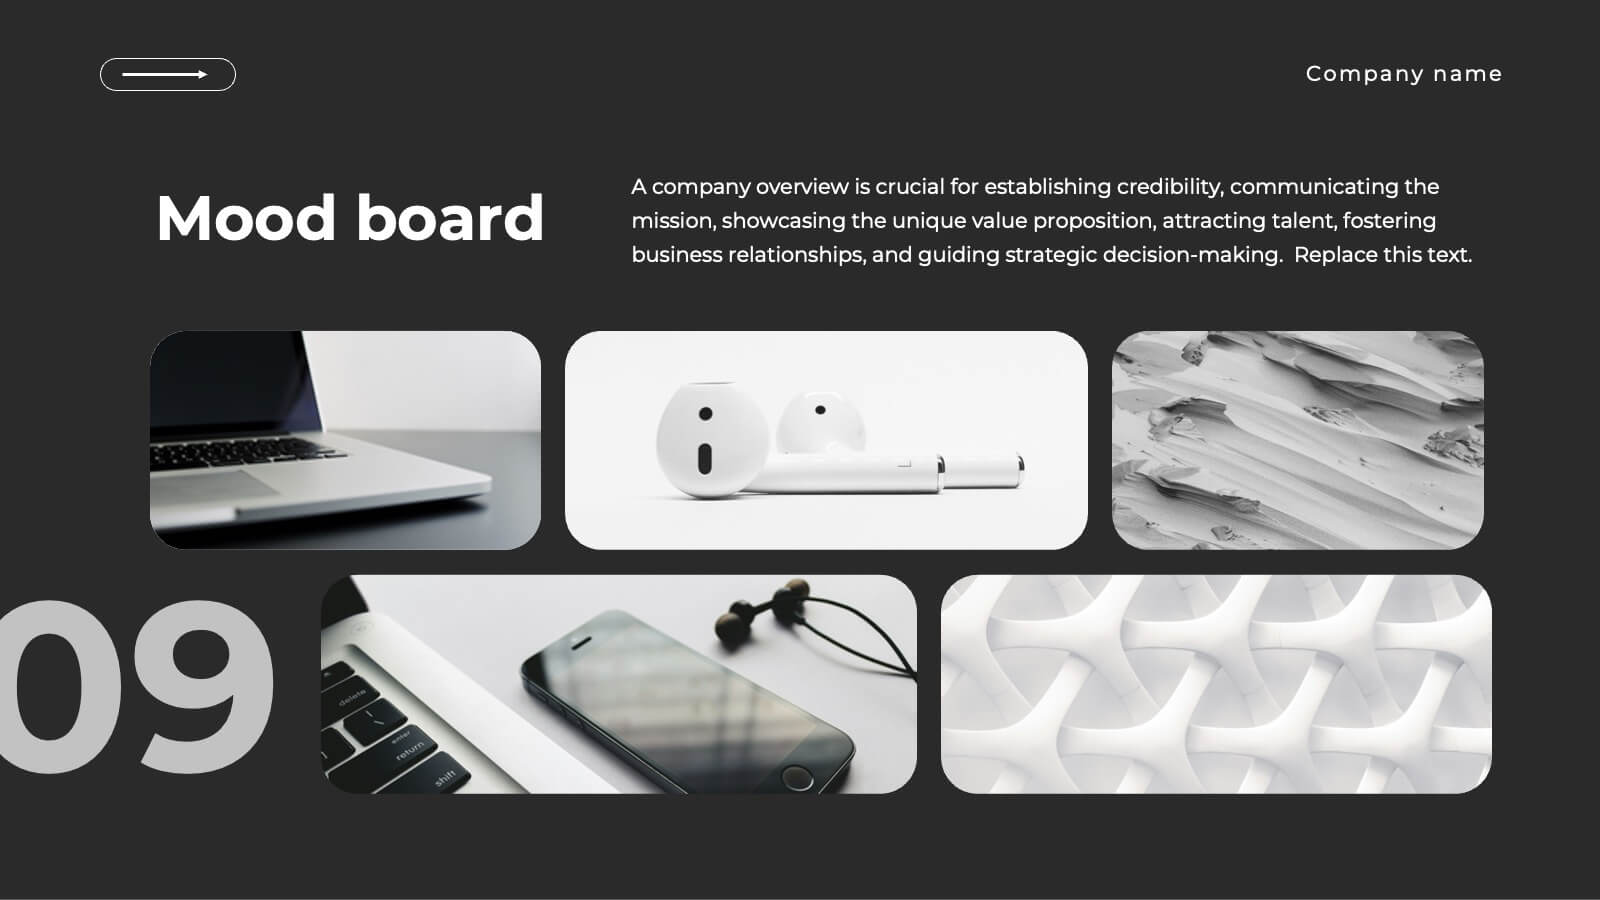
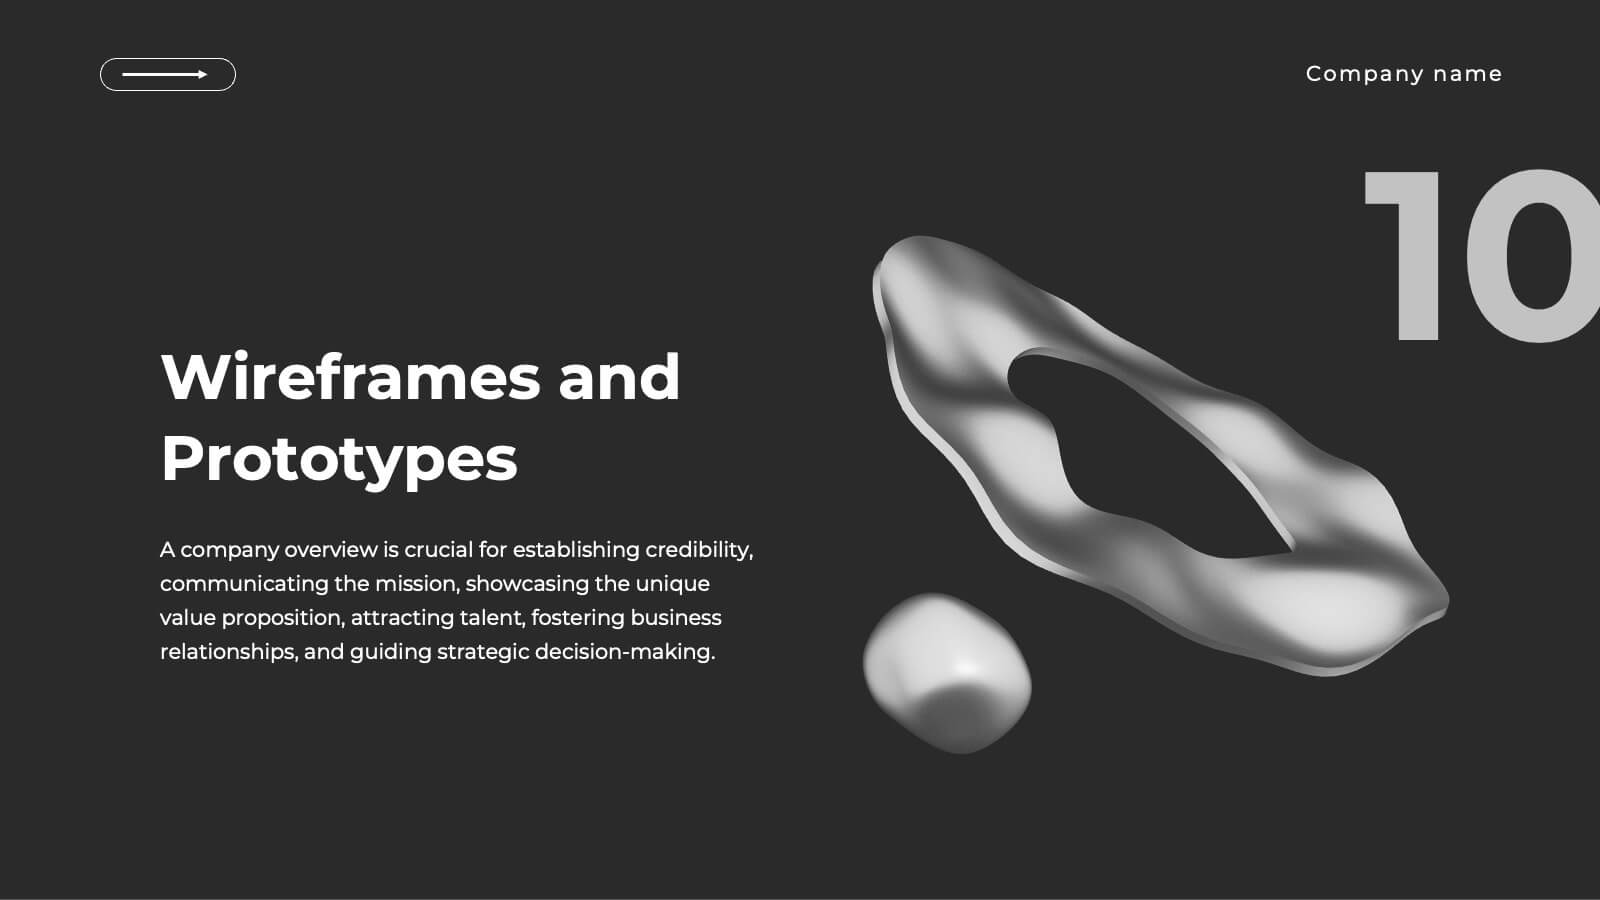
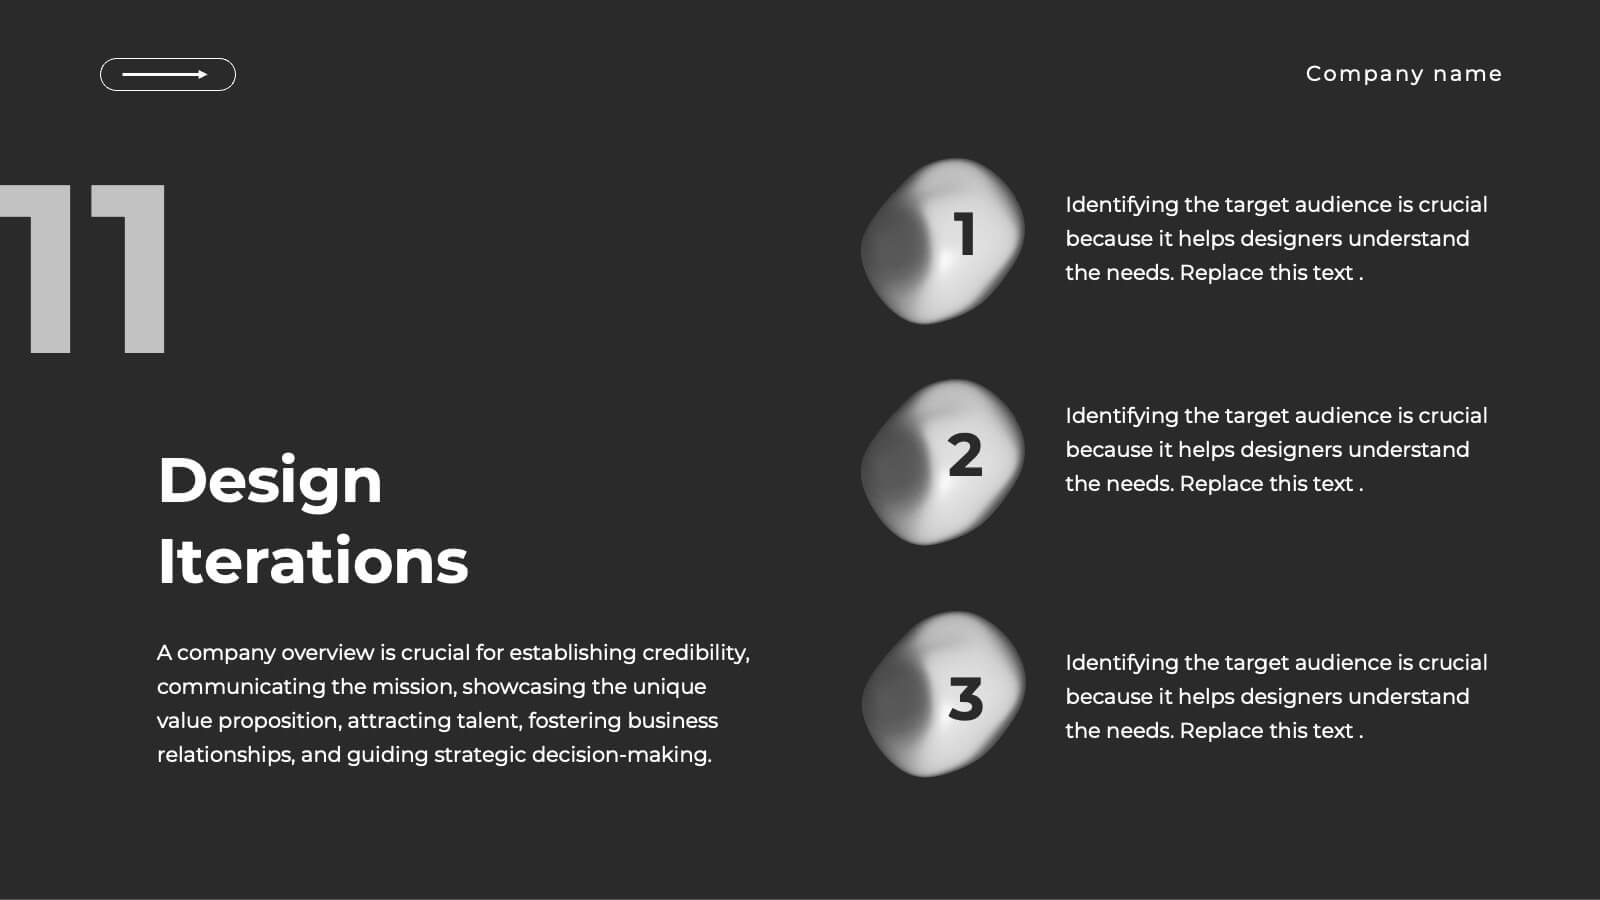
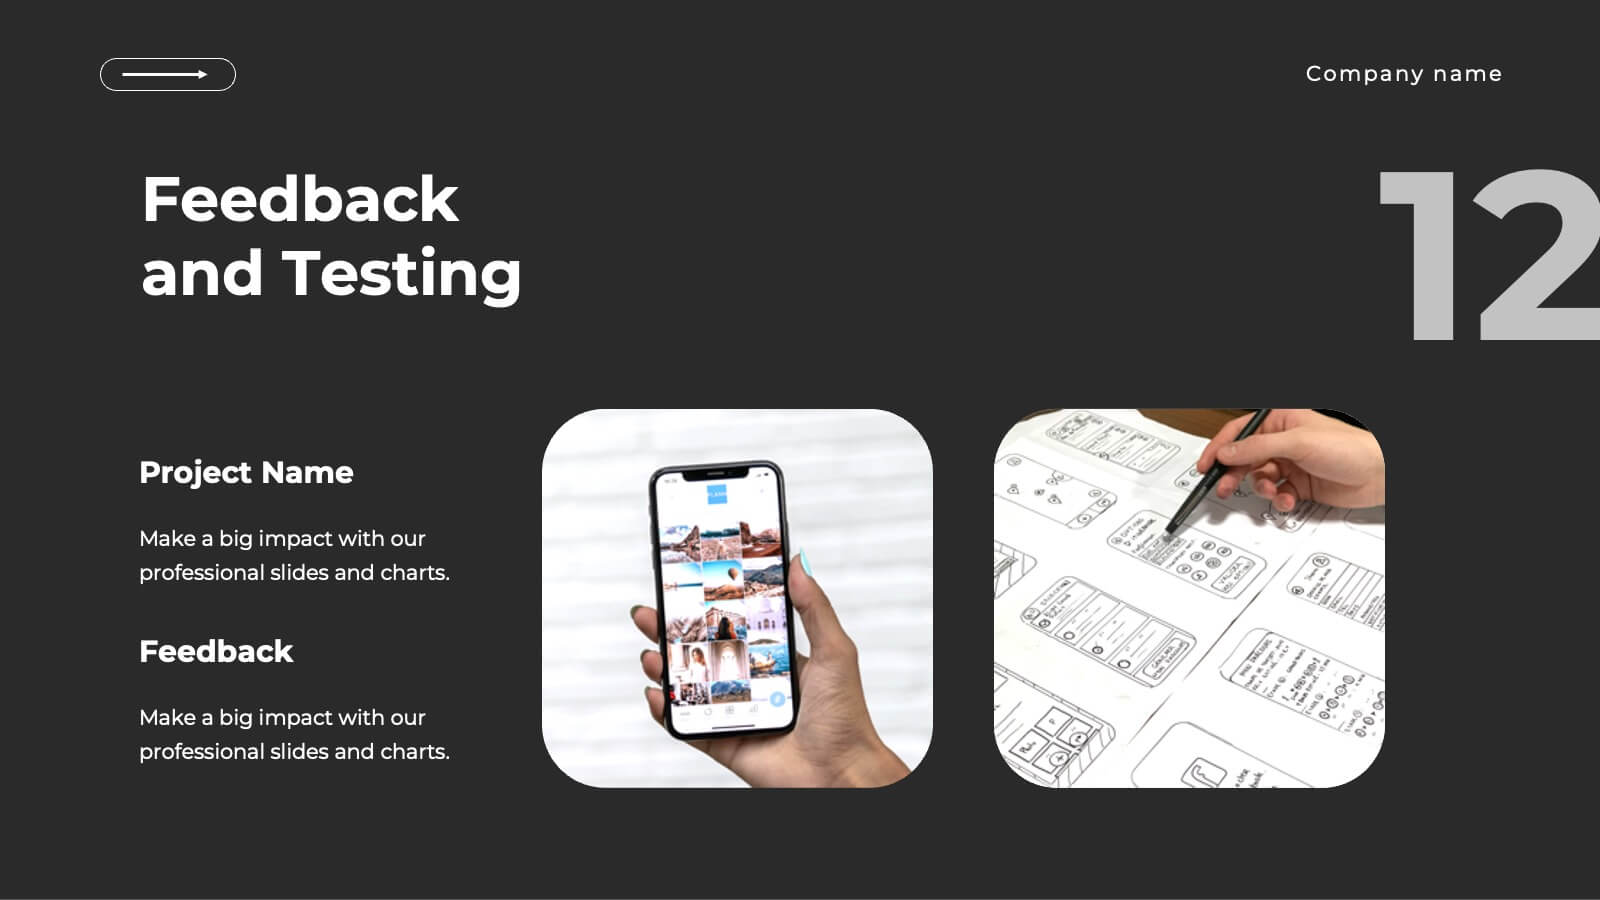
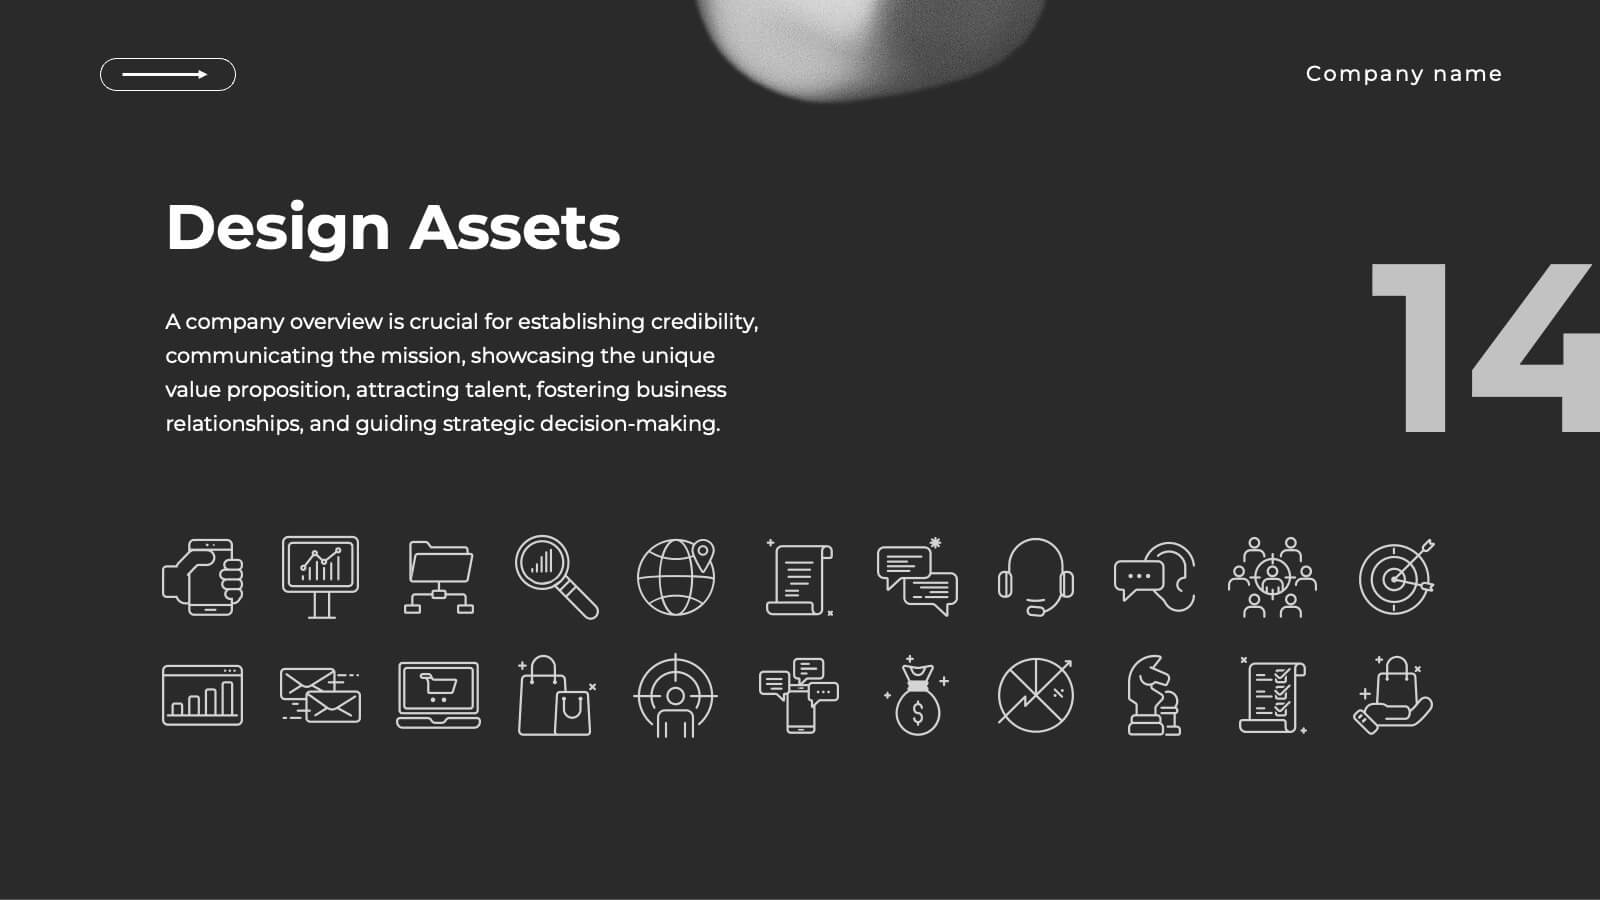
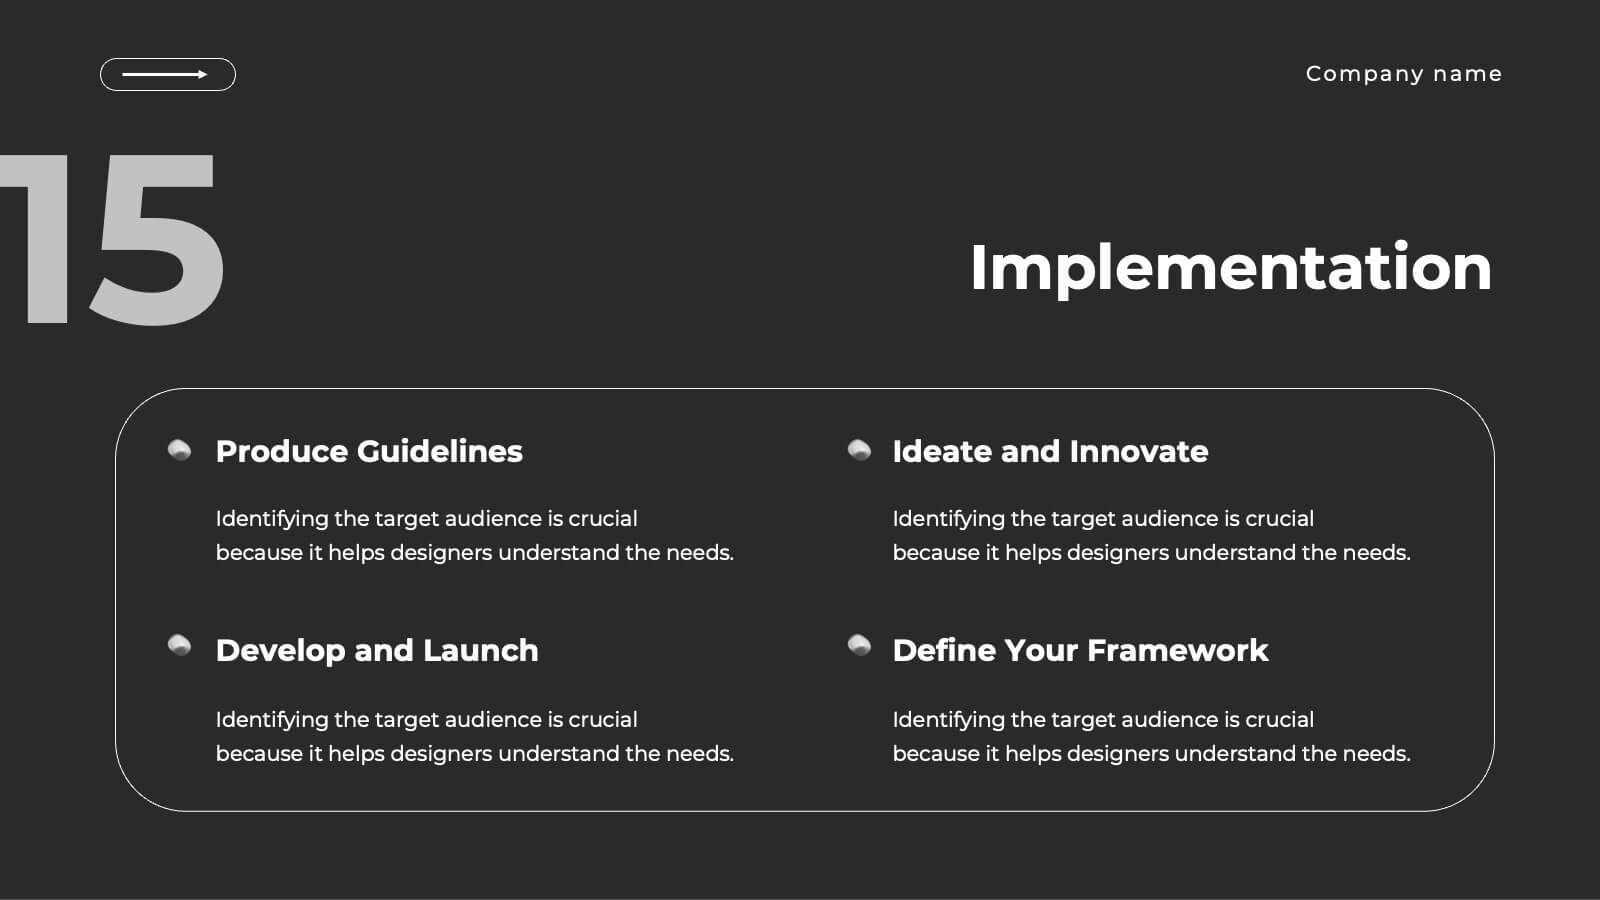
Realm UX UI Design Pitch Deck Presentation
Present your UX/UI design process with this sleek and modern design template! It covers everything from concept development to wireframes, prototypes, design iterations, and final design presentation. Fully customizable and compatible with PowerPoint, Keynote, and Google Slides, it’s perfect for design teams and professionals looking to showcase their creative process effectively.


4 diapositivas
Social Campaign Planning Presentation
Bring clarity to your outreach goals with a bold, funnel-style layout that makes every campaign step easy to visualize. This presentation helps you outline stages, objectives, and audience actions in a clean, structured format ideal for marketing teams. Fully editable and compatible with PowerPoint, Keynote, and Google Slides.


5 diapositivas
Strategic Planning with Concentric Circles
Draw your audience in with a visual that’s as focused as your message! This strategic concentric circles template helps you map out layered priorities, interconnected goals, or phased strategies in a clean, compelling way. Fully customizable and compatible with PowerPoint, Keynote, and Google Slides for seamless presentation design.


4 diapositivas
Aviation Logistics and Scheduling Presentation
Coordinate timelines and optimize operations with the Aviation Logistics and Scheduling presentation. This layout uses a control tower illustration to visualize four key scheduling points—ideal for showcasing flight operations, airport coordination, or air traffic planning. Great for logistics teams, airline operations managers, or aviation consultants. Fully editable in PowerPoint, Keynote, and Google Slides.


8 diapositivas
End of Presentation Thank You Slide
Wrap up your presentation with a bold, memorable finish using a vibrant layout that instantly grabs attention. This slide gives you space to share final notes, highlight next steps, or leave a lasting impression with clean, modern design. Fully editable and compatible with PowerPoint, Keynote, and Google Slides.


7 diapositivas
McKinsey 7S Model Infographic Presentation Template
The McKinsey 7S model is a management framework developed by the consulting firm McKinsey & Company. The model consists of seven interdependent factors that are important for an organization's success: strategy, structure, systems, shared values, skills, staff, and style. The template can be used to visualize the 7S model hierarchy and the importance of each component to your business. This inventive presentation is designed to take an economic approach, If you’re interested in taking this strategic step to evaluating your processes and measuring performance, this presentation is for you.