


Características


¿Tienes alguna pregunta?
Recomendar


5 diapositivas
Wedding Reception Program Infographics
Embrace the romance with our wedding reception program infographics, the quintessential guide for couples, wedding planners, and event organizers. This template, bathed in soothing light blue and light pink hues, provides an elegant backdrop for your wedding reception's flow of events. With a creative, vertical design, it offers an aesthetically pleasing layout that outlines the festivities, from heartfelt toasts to the final dance. It includes whimsical graphics, versatile icons, and customizable image placeholders, ensuring each moment is beautifully represented. Infuse personality and seamless organization into your special day, making it memorable for everyone involved.


6 diapositivas
Cyber Security Jobs Infographics
The "Cyber Security Jobs" infographic template, designed for PowerPoint, Keynote, and Google Slides, is a vital tool for career counselors, educational institutions, and cyber security professionals. This modern and informative template is specifically crafted to highlight career opportunities and pathways in the field of cyber security. Featuring key elements such as various job roles in cyber security, skill requirements, and career growth opportunities, the template is structured to provide a comprehensive overview of the industry. Its layout is ideal for presenting the diverse range of careers available in cyber security, making it an invaluable resource for career guidance and professional development presentations. The design is tech-themed with a color scheme that includes shades of blue, black, and gray. This not only gives the template a professional and engaging look but also reflects the technological and security aspects of the field. Whether it's used in job fairs, educational seminars, or corporate training sessions, this template ensures that information about cyber security jobs is presented clearly, effectively, and attractively.


7 diapositivas
Project Status Report Infographic Presentation
The importance of project status is related to the ability to monitor and control a project effectively. Project status is essential for effective project management. This template has been designed to help professionals gain more control over their projects. Use this template to enable project stakeholders to communicate, monitor progress, manage risks, make informed decisions, and promote accountability and continuous improvement. You can use this to manage all your projects, tasks and team members effortlessly. This template is available in PowerPoint, Keynote and Google Slides.


6 diapositivas
SEO Ads and Social Media Planning Presentation
Boost your online presence with the SEO, Ads, and Social Media Planning Presentation. This layout features engaging iconography and a central post mockup to highlight content strategy, paid advertising, engagement metrics, and platform-specific insights. Ideal for marketing teams and campaign proposals. Fully editable in PowerPoint, Keynote, and Google Slides.


20 diapositivas
Oscillation Project Proposal Presentation
This project proposal template is designed to captivate your audience with a bold purple and yellow color scheme, adding a modern flair to your presentation. It includes comprehensive sections like company overview, objectives and goals, methodology, deliverables, and budget breakdown. Perfect for clearly communicating your project vision and strategy, this template streamlines your content while highlighting your professional approach. Compatible with PowerPoint, Keynote, and Google Slides, it provides versatility for seamless delivery across platforms.


5 diapositivas
5-Level Risk Management Plan Presentation
Turn complex strategies into clear, visual steps with this sleek layered layout designed for analyzing and mitigating potential risks. Each level helps you outline priorities, assess impact, and communicate safety measures effectively. Fully compatible with PowerPoint, Keynote, and Google Slides, making customization fast, professional, and presentation-ready.


4 diapositivas
Annual Calendar Layout for Projects
Plan your year like a pro with this clean and colorful visual layout—it’s designed to help you stay focused, organized, and on track month by month. Whether you're mapping out team projects, campaign milestones, or business goals, this annual calendar format makes it easy to see everything at a glance. Fully compatible with PowerPoint, Keynote, and Google Slides.


6 diapositivas
Meeting Overview Infographic
A meeting overview is a concise summary of the key points, goals, and agenda items that will be discussed during a meeting. This informative infographic provides a quick reference guide for your audience to understand the purpose of the meeting and what topics will be covered. This template provides a concise summary that helps participants and viewers quickly understand the main highlights. Summarize the purpose of the meeting overview infographic and encourage viewers to refer to it for a quick understanding of the meeting's main points. Compatible with Powerpoint, Keynote, and Google Slides.


7 diapositivas
Job Title Infographic
The slides displayed offer a range of stylish and clear title designs for various business and creative presentations, ideal for introducing key concepts and sections within a professional document or presentation. Each slide is crafted to represent themes such as annual reports, digital strategies, and project retrospectives, as well as specialized areas like web design, strategic planning, and SEO. The designs incorporate modern aesthetics with clean lines, bold color palettes, and minimalist graphic elements, ensuring that the titles are not only eye-catching but also effectively convey the subject matter. This variety allows presenters to choose a slide that best fits the tone and topic of their presentation, making each section distinct and engaging for the audience. These slides are perfect for professionals looking to present complex information in an accessible and visually appealing format.


7 diapositivas
SEO Strategy and Keyword Plan Presentation
Spark your marketing roadmap with a bold, idea-driven layout that makes every action step clear and memorable. This presentation helps you outline search goals, explore keyword opportunities, and map out strategic priorities in a simple, visual flow. Fully compatible with PowerPoint, Keynote, and Google Slides.


4 diapositivas
IT Operations Management Presentation
Enhance your IT strategy with the IT Operations Management Presentation template. This clean, modern slide layout helps illustrate key operational processes, performance metrics, and strategic improvements with an easy-to-follow, upward trajectory design. Ideal for IT managers and business leaders looking to showcase efficiency, scalability, and innovation. Fully editable in PowerPoint, Keynote, and Google Slides for seamless customization.


6 diapositivas
KPI Metric Infographic
KPI stands for Key Performance Indicator, and it is a measurable value that helps organizations track their progress and performance towards achieving specific business goals and objectives. This infographic template is designed to display key performance indicators and metrics in a concise and easy-to-understand manner. KPIs are quantifiable measurements used to evaluate the success of an organization, project, or specific business activities. The infographic provides a visual representation of these KPIs, making it easier for stakeholders and decision-makers to interpret the data and track progress.


7 diapositivas
Professional Goals Infographic
Unfold the pathway to success with our professional goals infographic. Designed to help individuals and organizations visualize and track their aspirations, this infographic offers a comprehensive look at professional milestones and strategies to achieve them. The primary palette revolves around a pristine white backdrop, enhanced by accents of vibrant orange and a mix of complementary colors to distinguish different areas. Its design ensures seamless integration into PowerPoint, Keynote, or Google Slides presentations, transforming your professional goals discourse into a visually engaging experience.


23 diapositivas
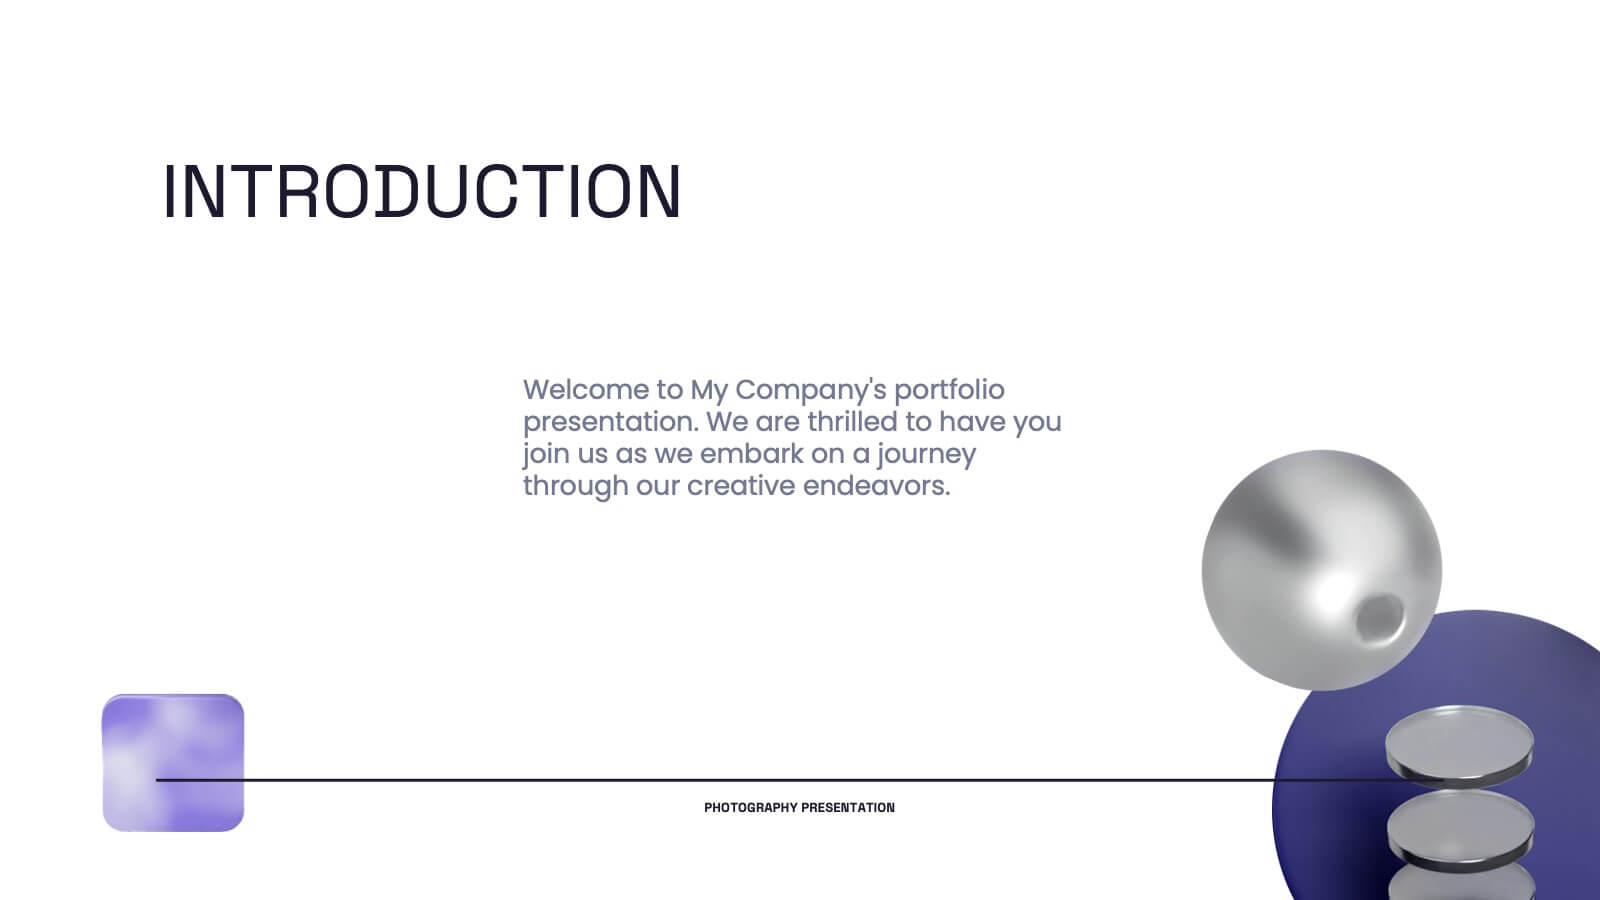
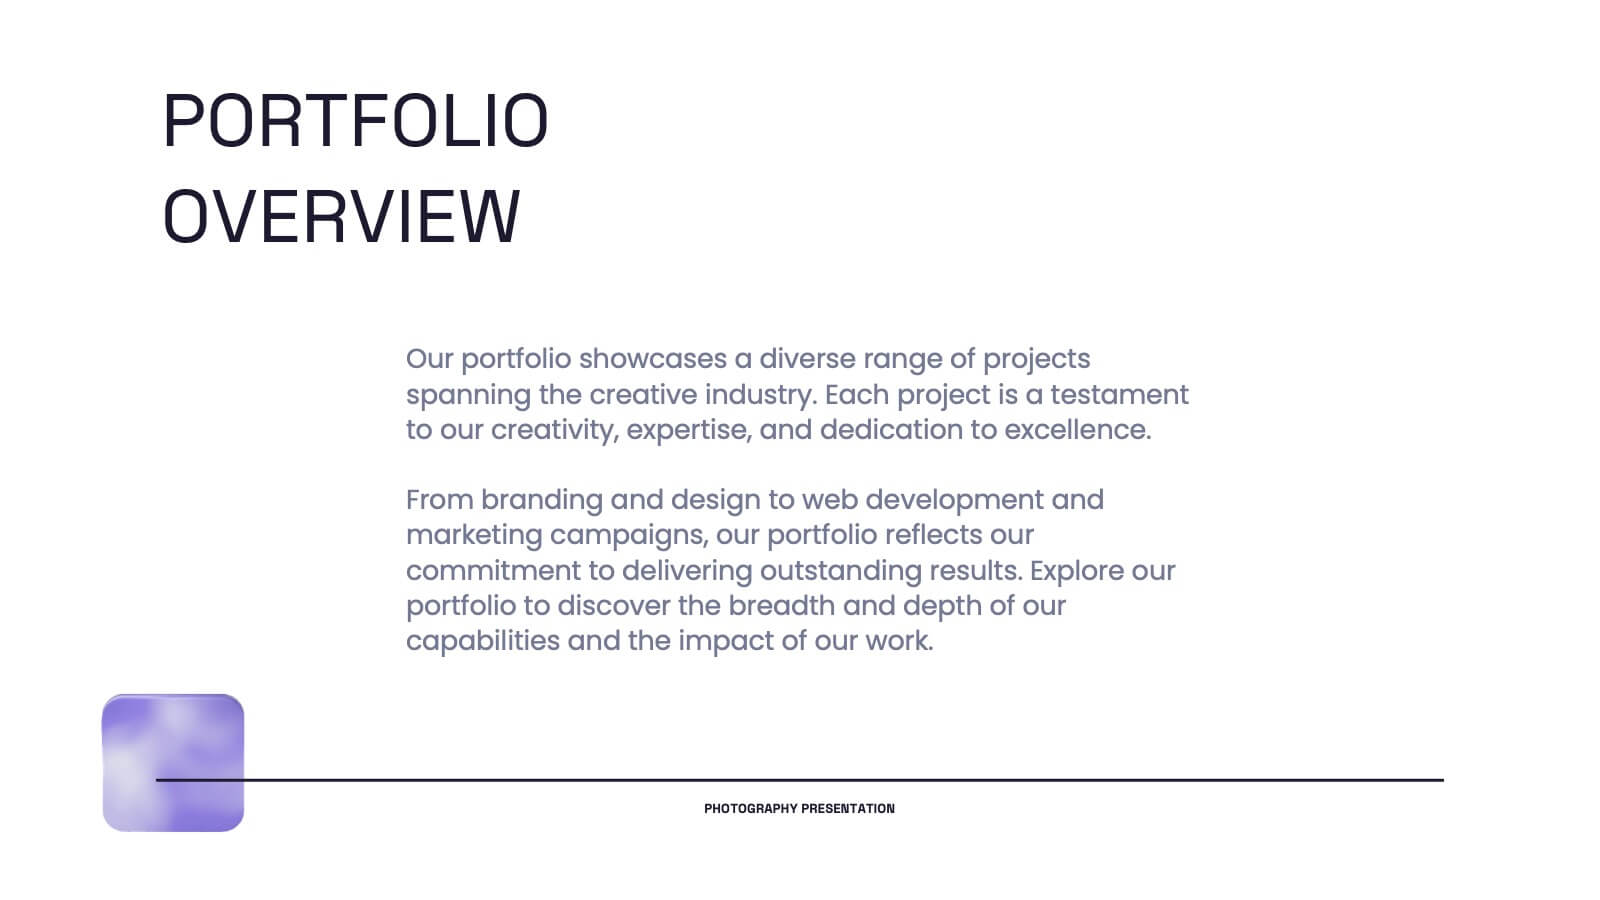
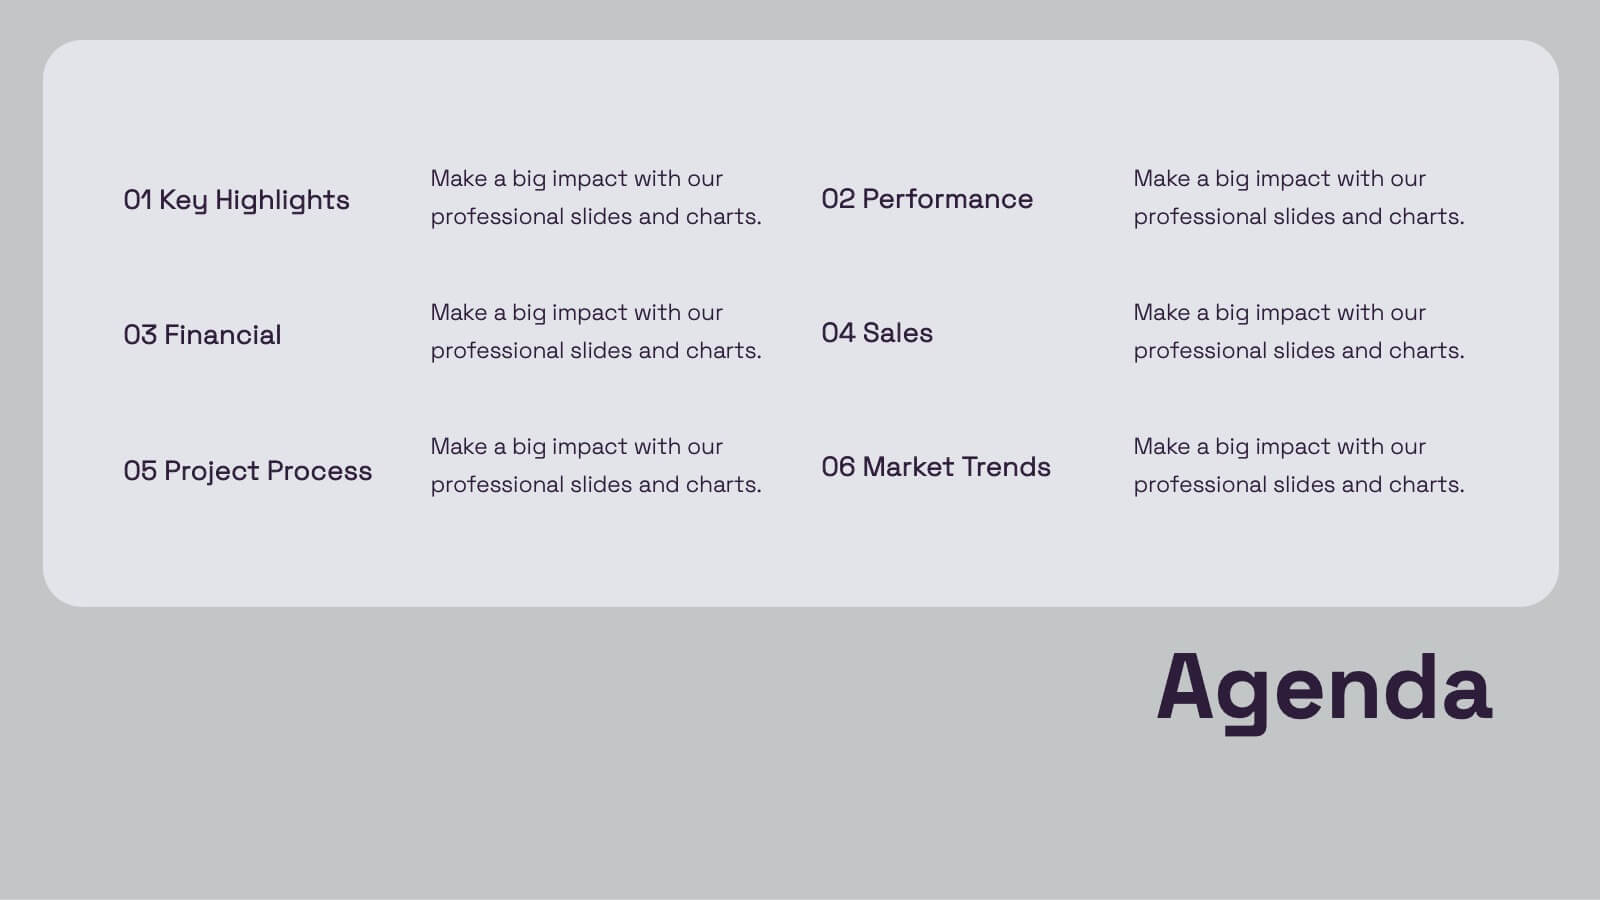
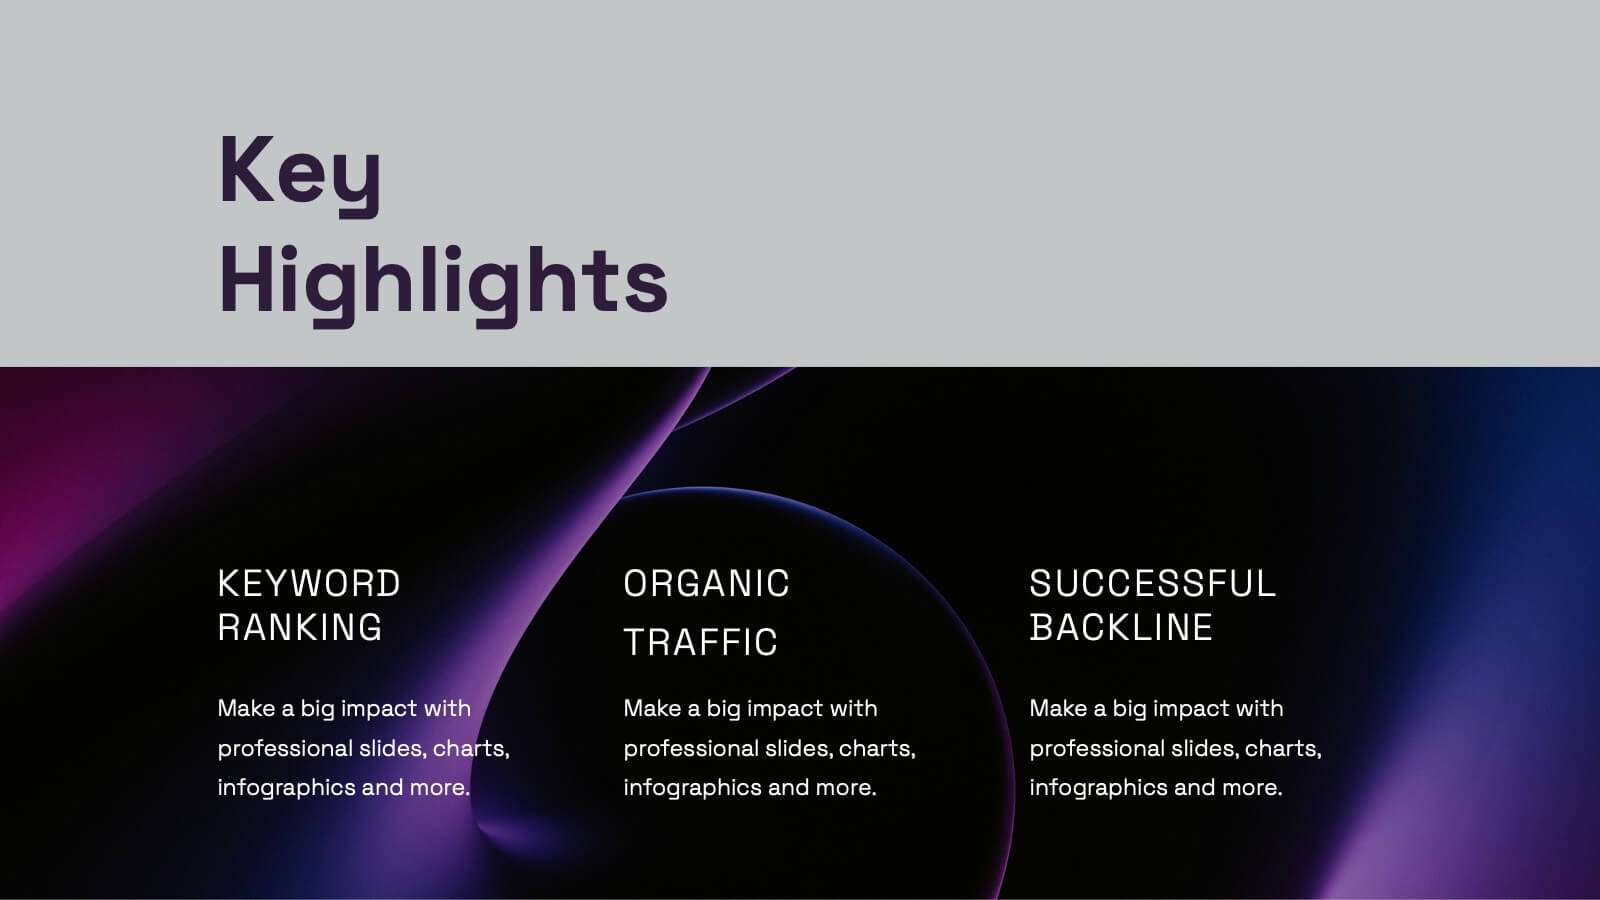
Pyroverse Photography Portfolio Presentation
Showcase your creative work effortlessly with this meticulously designed photography portfolio template. Tailored for photographers, this presentation highlights your style, achievements, and projects in a visually compelling format that speaks to your audience. This portfolio template includes dedicated slides for introducing your philosophy, showcasing your creative process, and presenting your best projects with high-impact layouts. Highlight client testimonials, collaborations, and awards to establish credibility and attract new clients. Additional slides for services, contact information, and social media links make it easier to connect with your audience. Compatible with PowerPoint, Google Slides, and Keynote, this template is fully customizable, allowing you to tailor it to your branding needs. Perfect for professional photographers, freelancers, and studios, this template ensures your portfolio stands out in a competitive market. Present your work with confidence and make a lasting impression with this professional design.


26 diapositivas
Real Estate Company Profile Presentation
Step into the world of real estate, where every brick tells a story and every home harbors a dream. Our warm and bold template, draped in varying shades of brown, encapsulates the essence of properties, from cozy homes to towering skyscrapers. Boasting tailored graphics, detailed icons, and versatile image placeholders, it's more than just a visual aid; it's an experience. Seamless compatibility ensures it's ready for Powerpoint, Keynote, or Google Slides. An invaluable asset for realtors, property managers, housing agencies, or anyone looking to make an impact in the real estate market. Present with confidence; let every property shine.


19 diapositivas
Fableia Marketing Research Report Presentation
Deliver data-driven insights with a professional and visually engaging marketing research report presentation. This template is tailored for marketing professionals, agencies, and businesses looking to showcase research findings with precision and clarity. Highlight key sections such as market trends, consumer behavior analysis, and campaign performance using dynamic visuals and well-structured layouts. Share your insights on emerging technologies, social media strategies, and customer targeting with easy-to-edit graphs, charts, and infographics. Use dedicated slides for SEO analytics, value propositions, and recommendations to present actionable strategies that resonate with your audience. This template is fully customizable and works seamlessly with PowerPoint, Google Slides, and Keynote, ensuring you can adapt it to your unique needs. Present your research with confidence and leave a lasting impact on stakeholders and decision-makers.


21 diapositivas
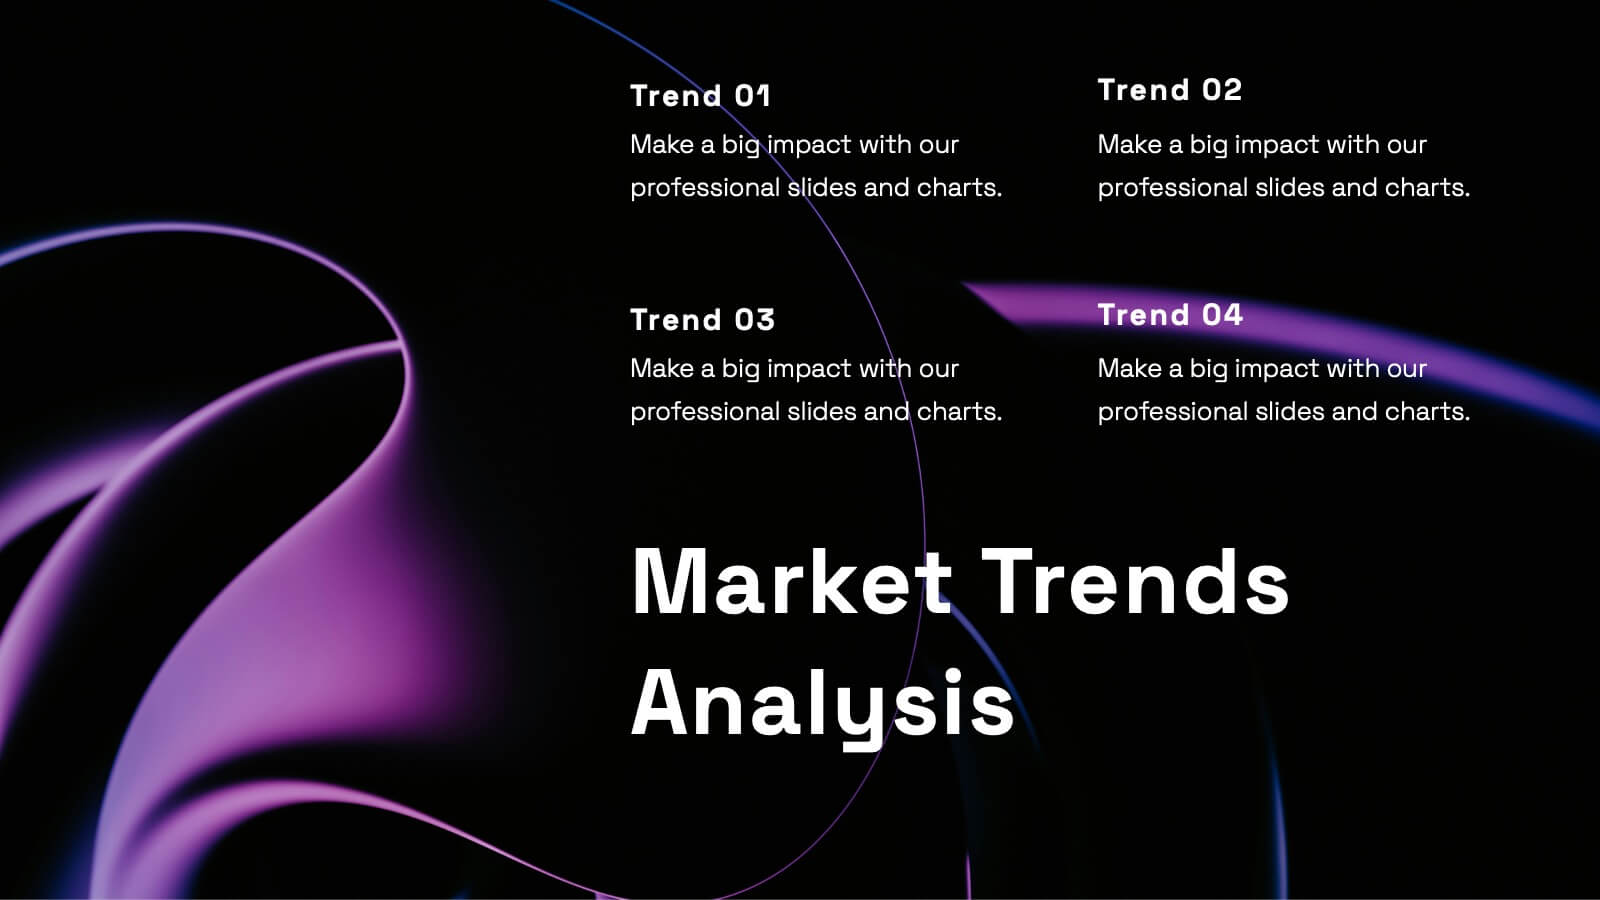
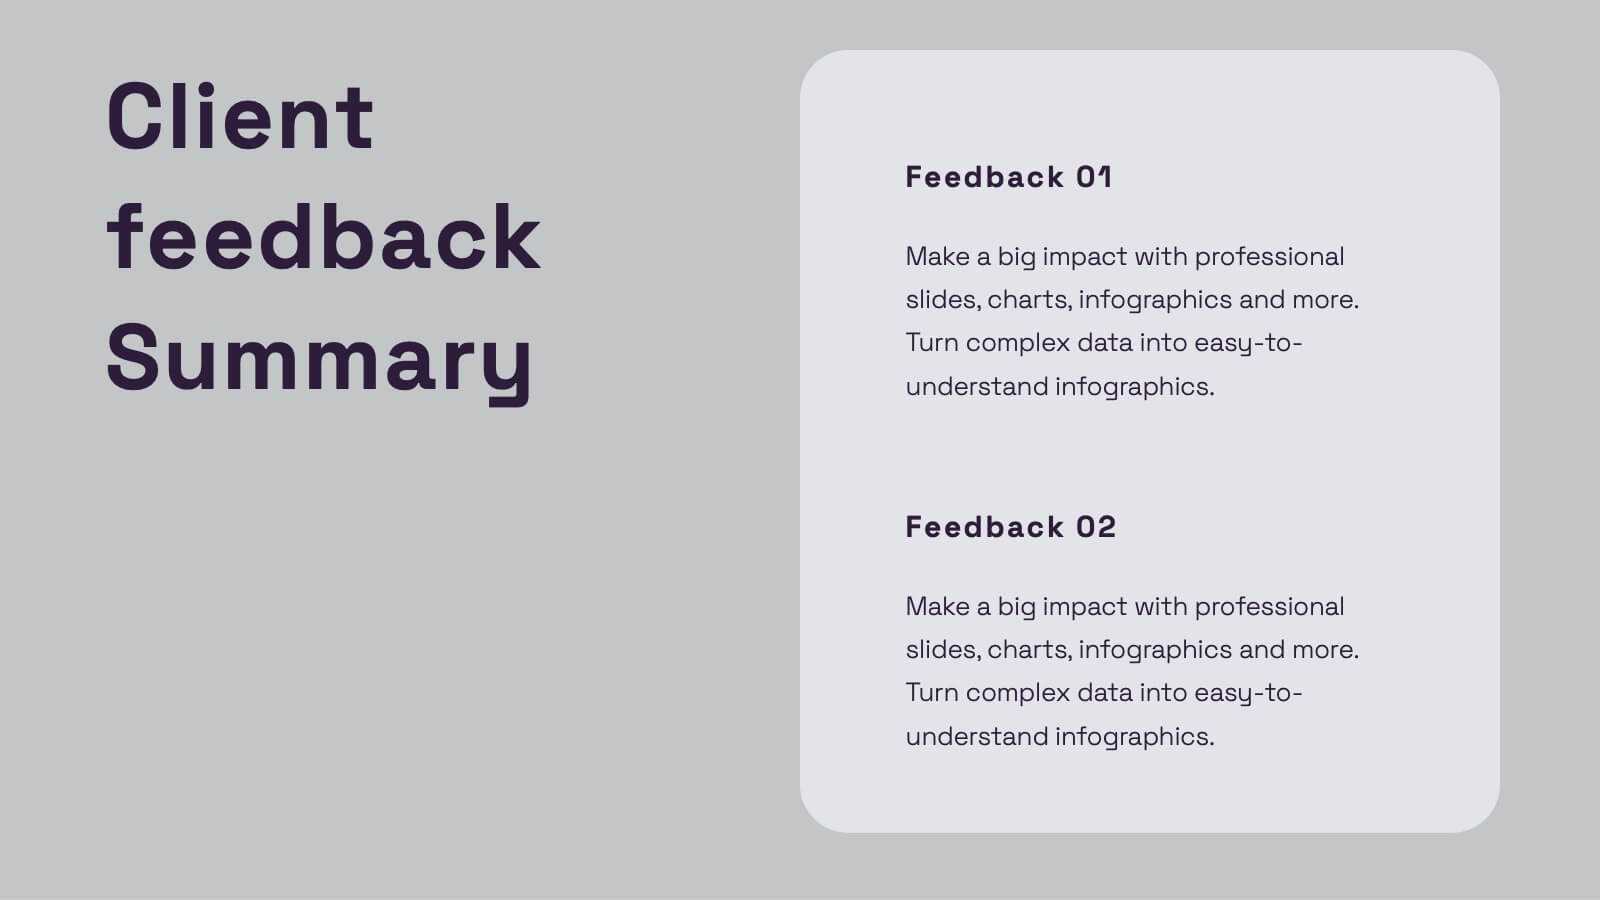
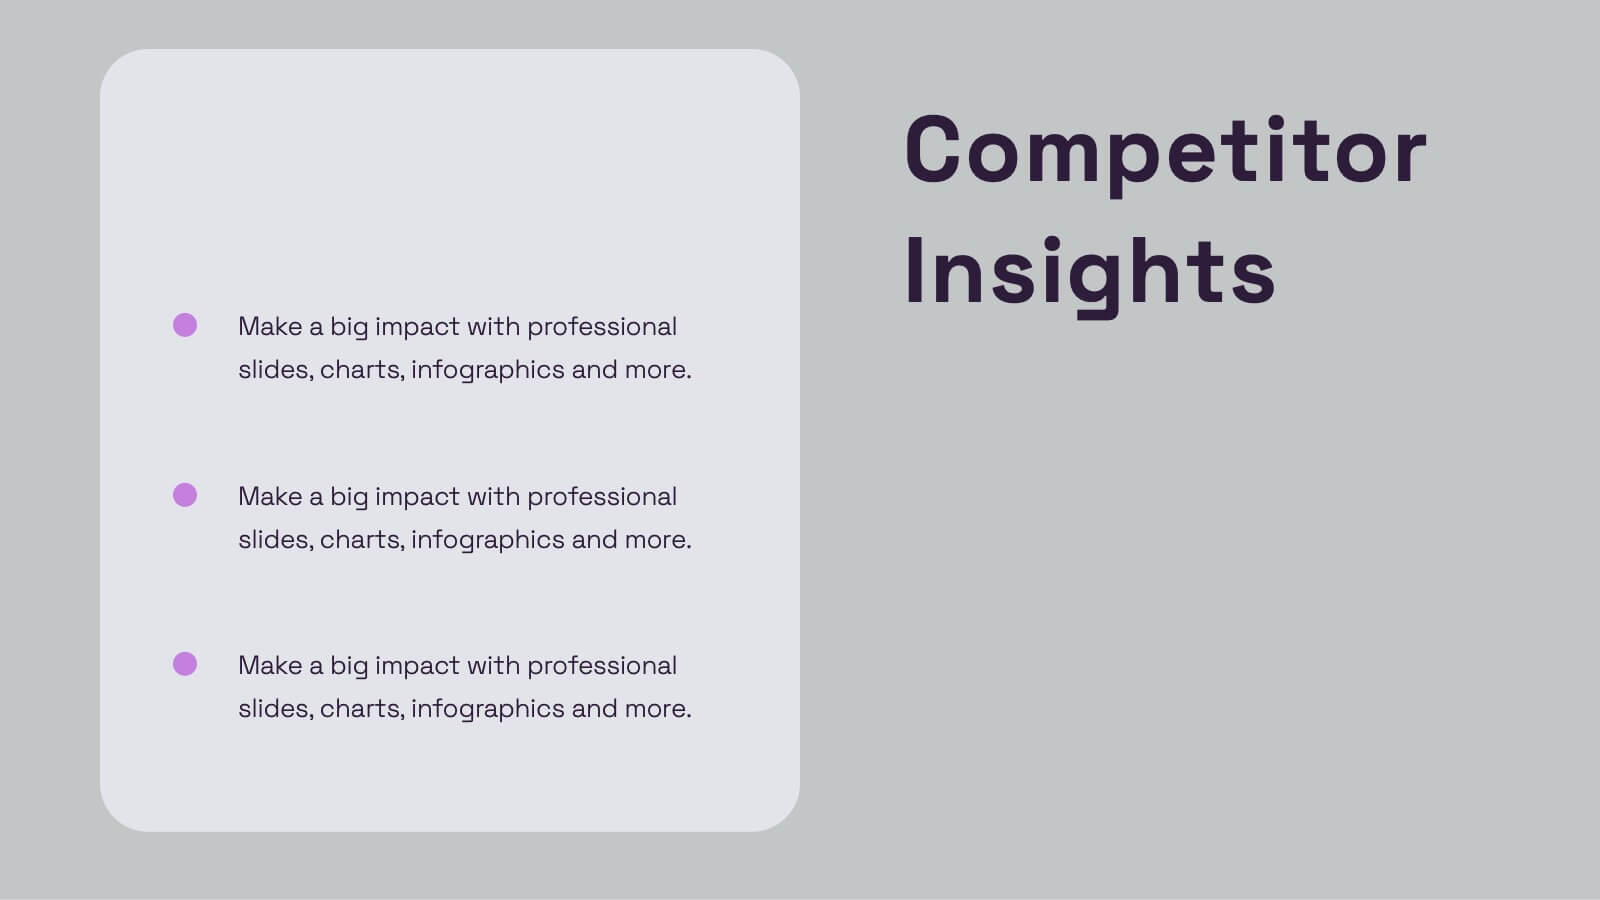
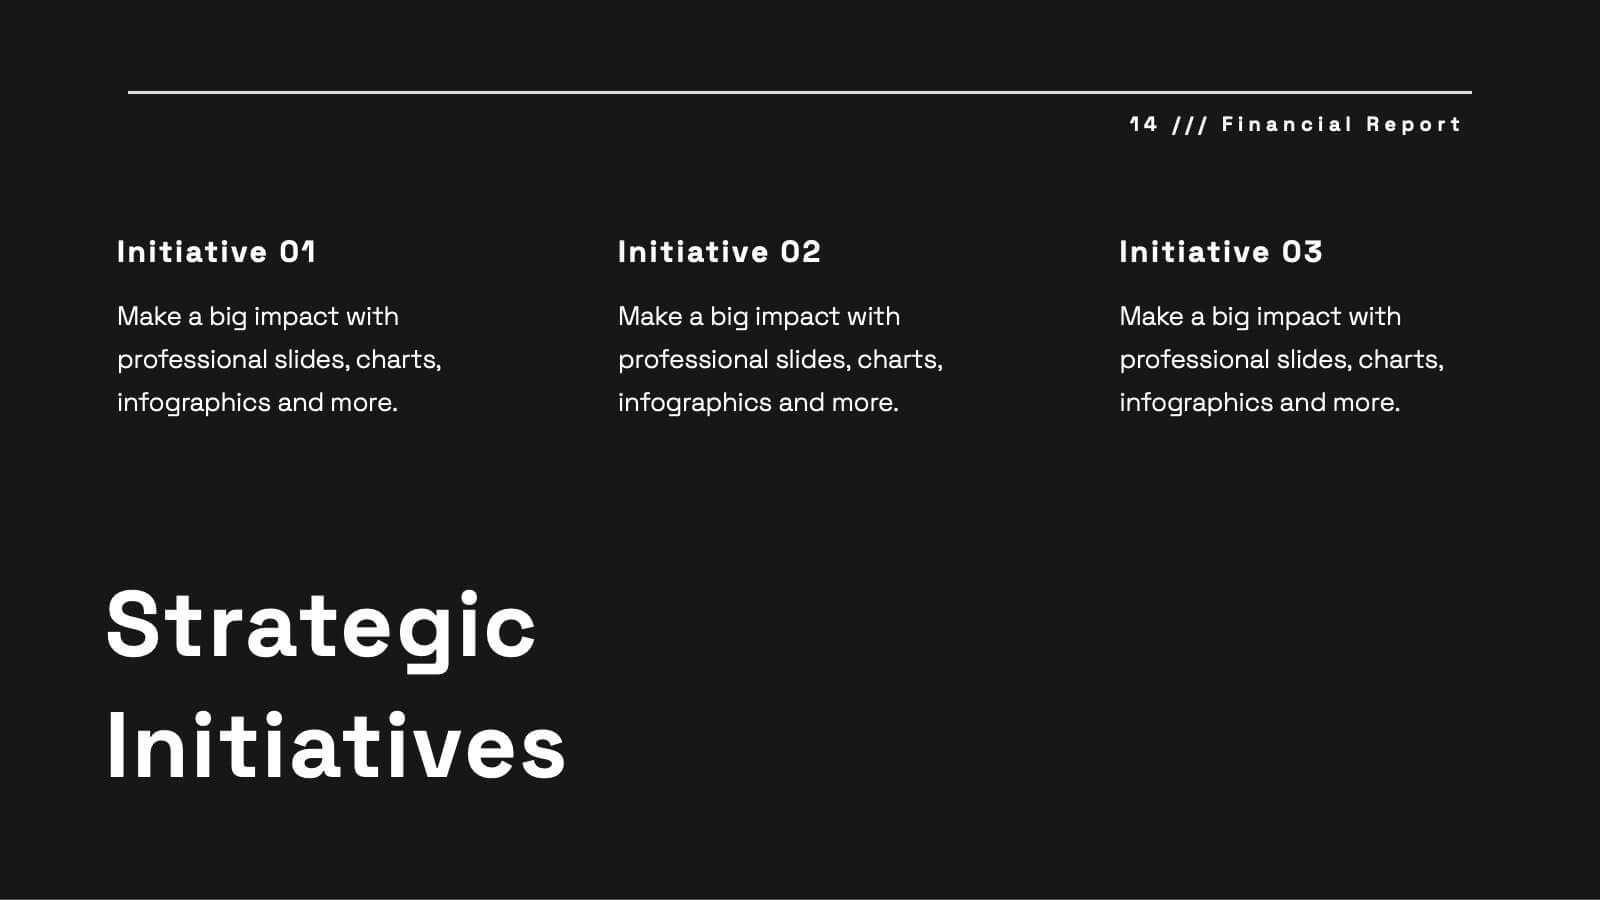
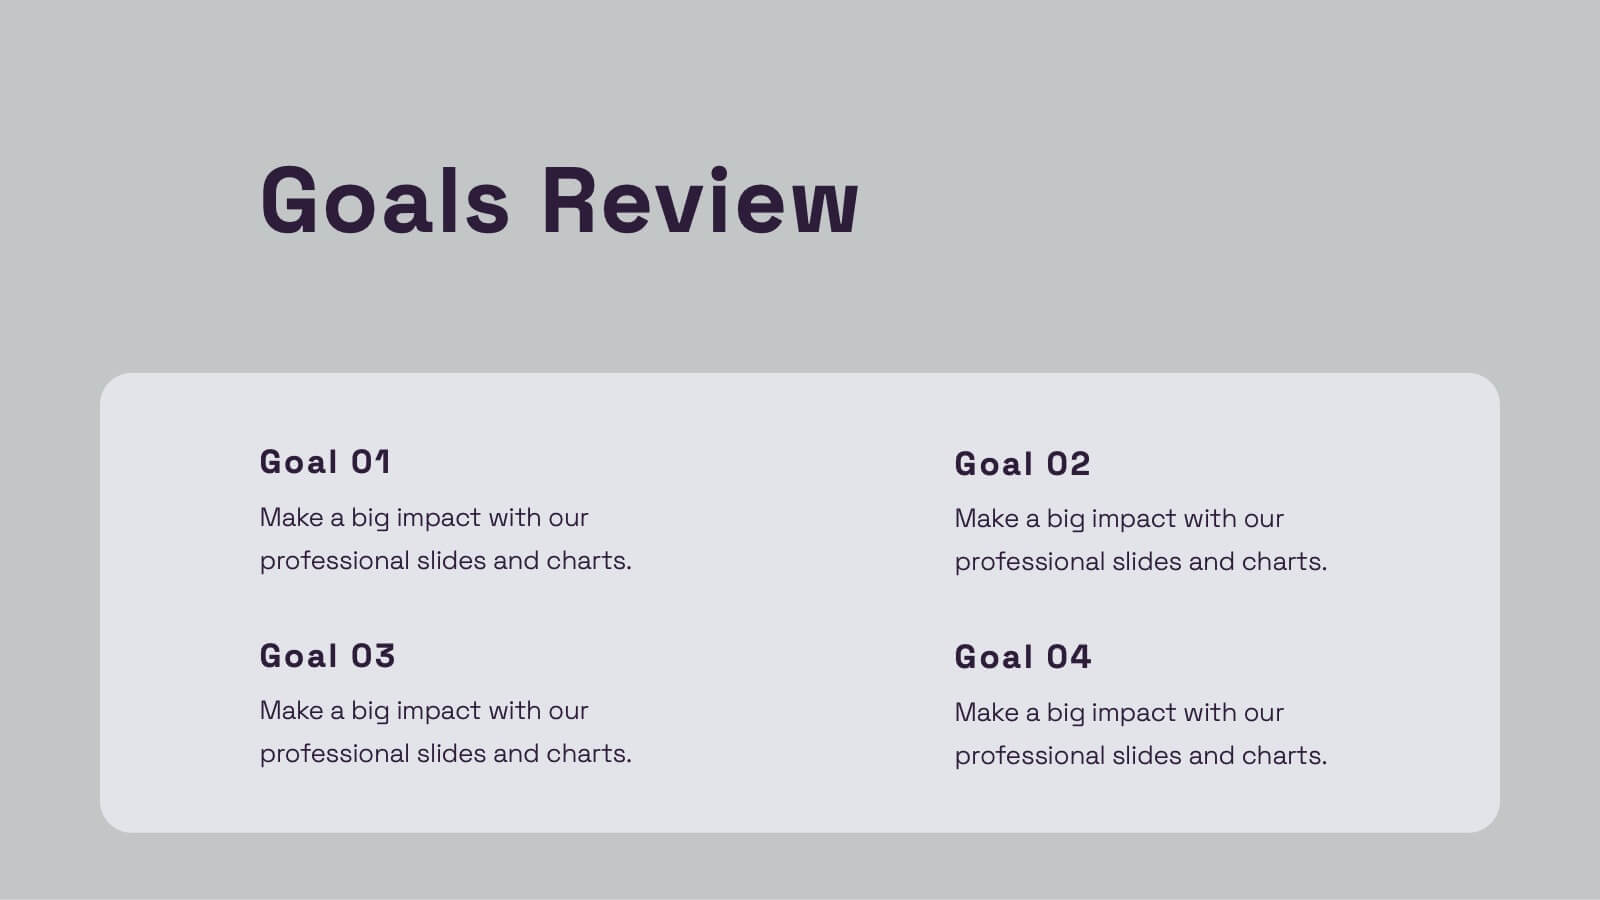
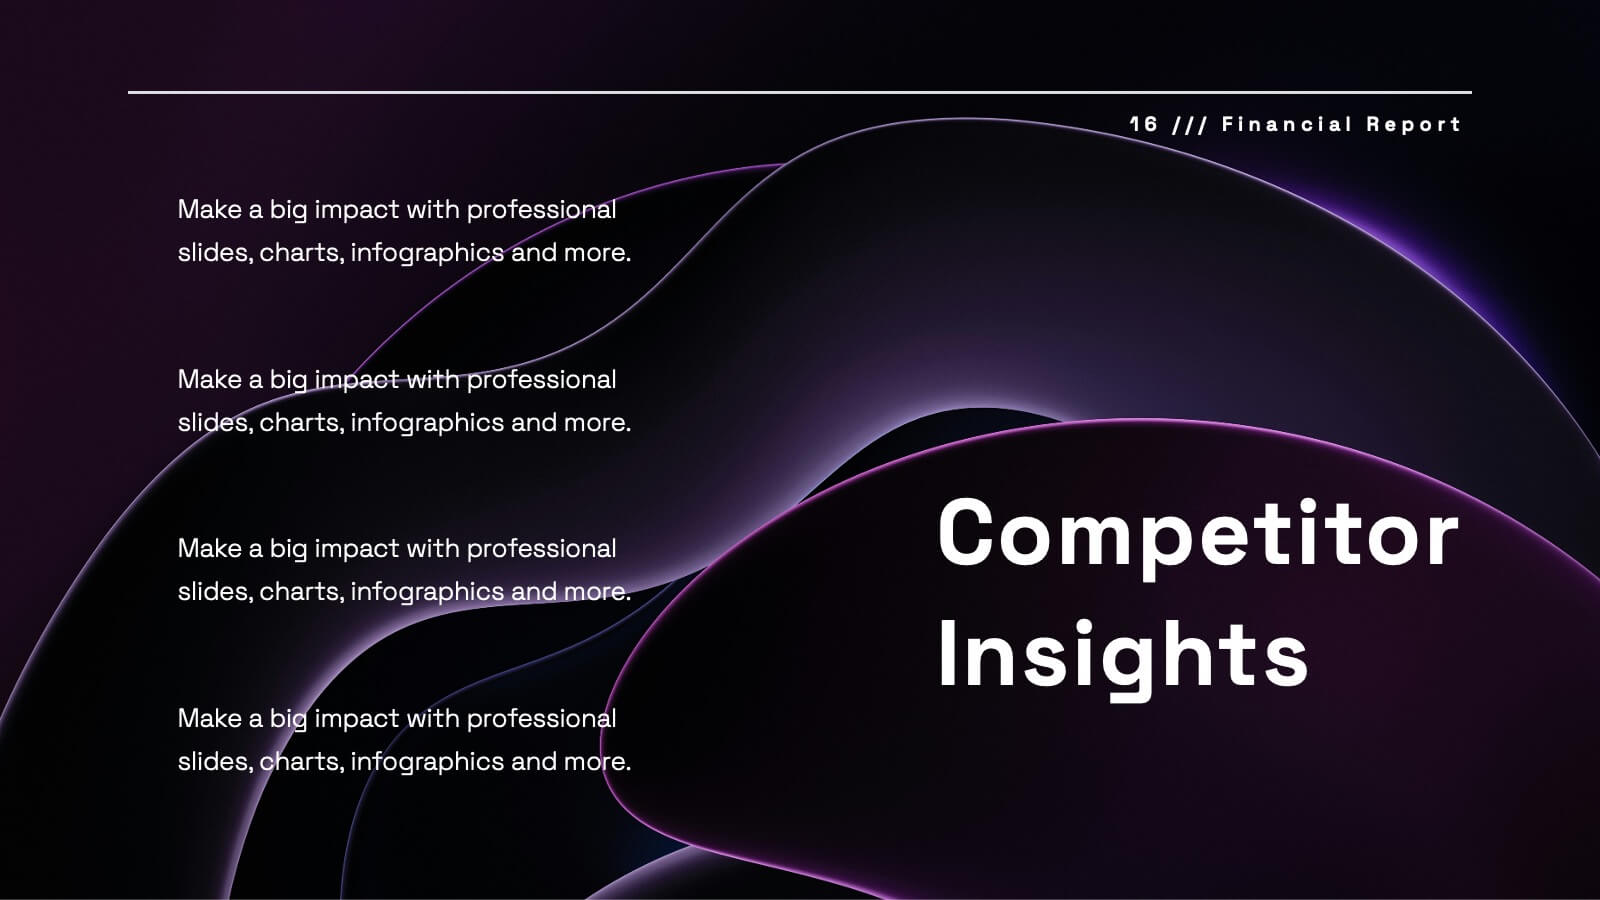
Uplift Financial Report Presentation
Present your financial or business report with this sleek and modern presentation template! It includes essential sections such as performance metrics, financial summaries, project progress, and market trends analysis, ensuring a comprehensive overview. Whether you're discussing key achievements or competitor insights, this template is perfect for delivering a professional and polished report. Compatible with PowerPoint, Keynote, and Google Slides for easy use and customization.