


Características


¿Tienes alguna pregunta?
Recomendar


4 diapositivas
Business Gap Analysis Framework
Visually bridge the gap between current and desired performance with this impactful Business Gap Analysis slide. Featuring a creative cliff and bridge design with editable text sections, it's ideal for strategic planning, performance improvement, and operational reviews. Fully compatible with PowerPoint, Keynote, and Google Slides.


5 diapositivas
USA Economic Map Infographic
Navigate the complexities of the American economy with our USA economic map infographic. Crafted in shades of blue and diverse colors, this creative, vertical infographic is a boon for economists, researchers, and educators. It's designed to dissect financial data across states, highlighting economic indicators vividly. From GDP growth, employment rates to industry-specific insights, make economic trends accessible. This template, beneficial for anyone addressing economic audiences, features intuitive graphics, state icons, and designated areas for relevant imagery, ensuring each economic facet is visually compelling and information-rich.


5 diapositivas
Effects of Cyberbullying Infographics
Cyberbullying refers to the use of electronic communication platforms, such as social media, text messages, or online forums, to harass, intimidate, or target individuals. With these infographics, you can effectively communicate the seriousness of cyberbullying and its detrimental effects on individuals. Whether you're delivering a presentation, creating educational materials, or sharing information online, this template provides a visually impactful way to raise awareness and promote conversations about cyberbullying prevention and support for victims. They incorporate eye-catching visuals, icons, and color schemes to effectively convey information and engage your audience.


23 diapositivas
Aegean UX Strategy Plan Presentation
The Aegean UX Strategy template is a vibrant and modern presentation tool designed for UX/UI designers, project managers, and creative teams. Its gradient pink and orange color scheme creates a visually appealing backdrop for discussing complex design strategies. This template includes slides for every step of the UX process, from defining user personas and journey maps to detailing wireframes, prototyping, and user testing. It also covers critical aspects like branding guidelines, accessibility, and usability, ensuring that your design considerations are comprehensive. Ideal for presenting design projects, strategies, or user experience audits, this template is fully compatible with PowerPoint, Keynote, and Google Slides, allowing for easy customization and seamless presentations across platforms. Use the Aegean UX Strategy template to convey your design vision clearly and compellingly, engaging your audience with a blend of style and substance.


4 diapositivas
Team Relationship Structure Presentation
Show your organization’s hierarchy with clarity and style using this modern visual layout. Ideal for illustrating team dynamics, reporting lines, or company roles, it helps simplify complex structures into easy-to-follow visuals. Fully customizable and compatible with PowerPoint, Keynote, and Google Slides for seamless editing and professional presentation design.


12 diapositivas
Investment Strategy Presentation
The "Investment Strategy Presentation" template is designed for effectively mapping out and displaying various investment strategies. It uses a multi-colored light bulb graphic, which symbolizes ideas and innovation in investment planning, making it visually appealing and easy to understand. Each segment of the light bulb is labeled with letters A through F, representing different aspects or phases of an investment strategy that can be tailored to specific objectives or points of discussion. This format helps in presenting complex financial data or strategies in a straightforward manner that can be easily grasped by audiences, making it an ideal choice for financial analysts, investors, or corporate strategy meetings.


20 diapositivas
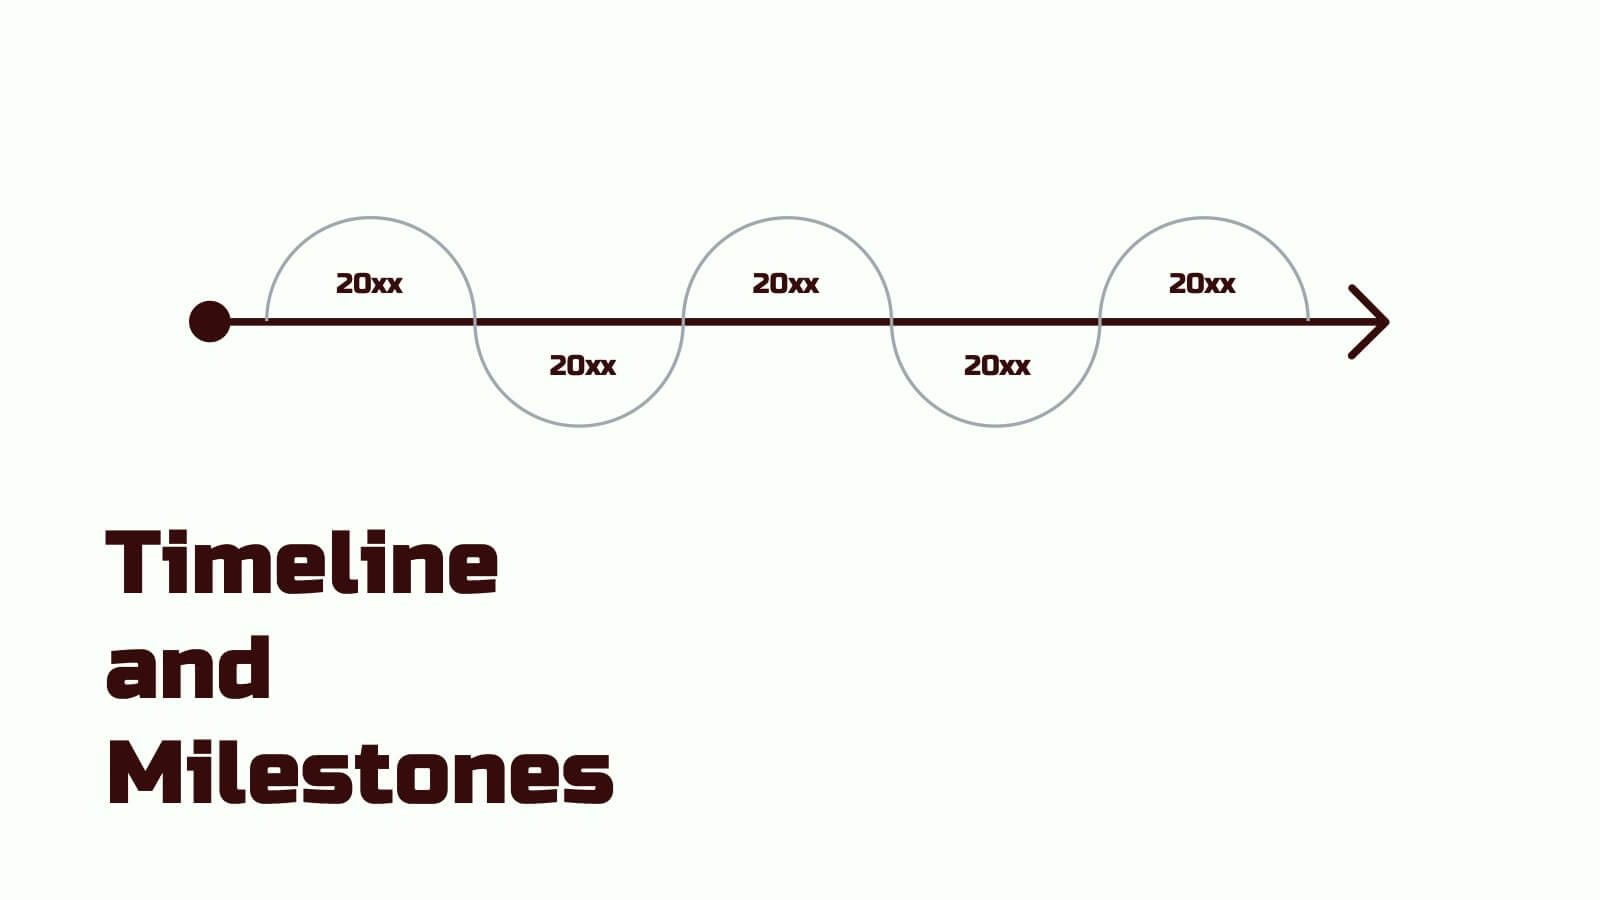
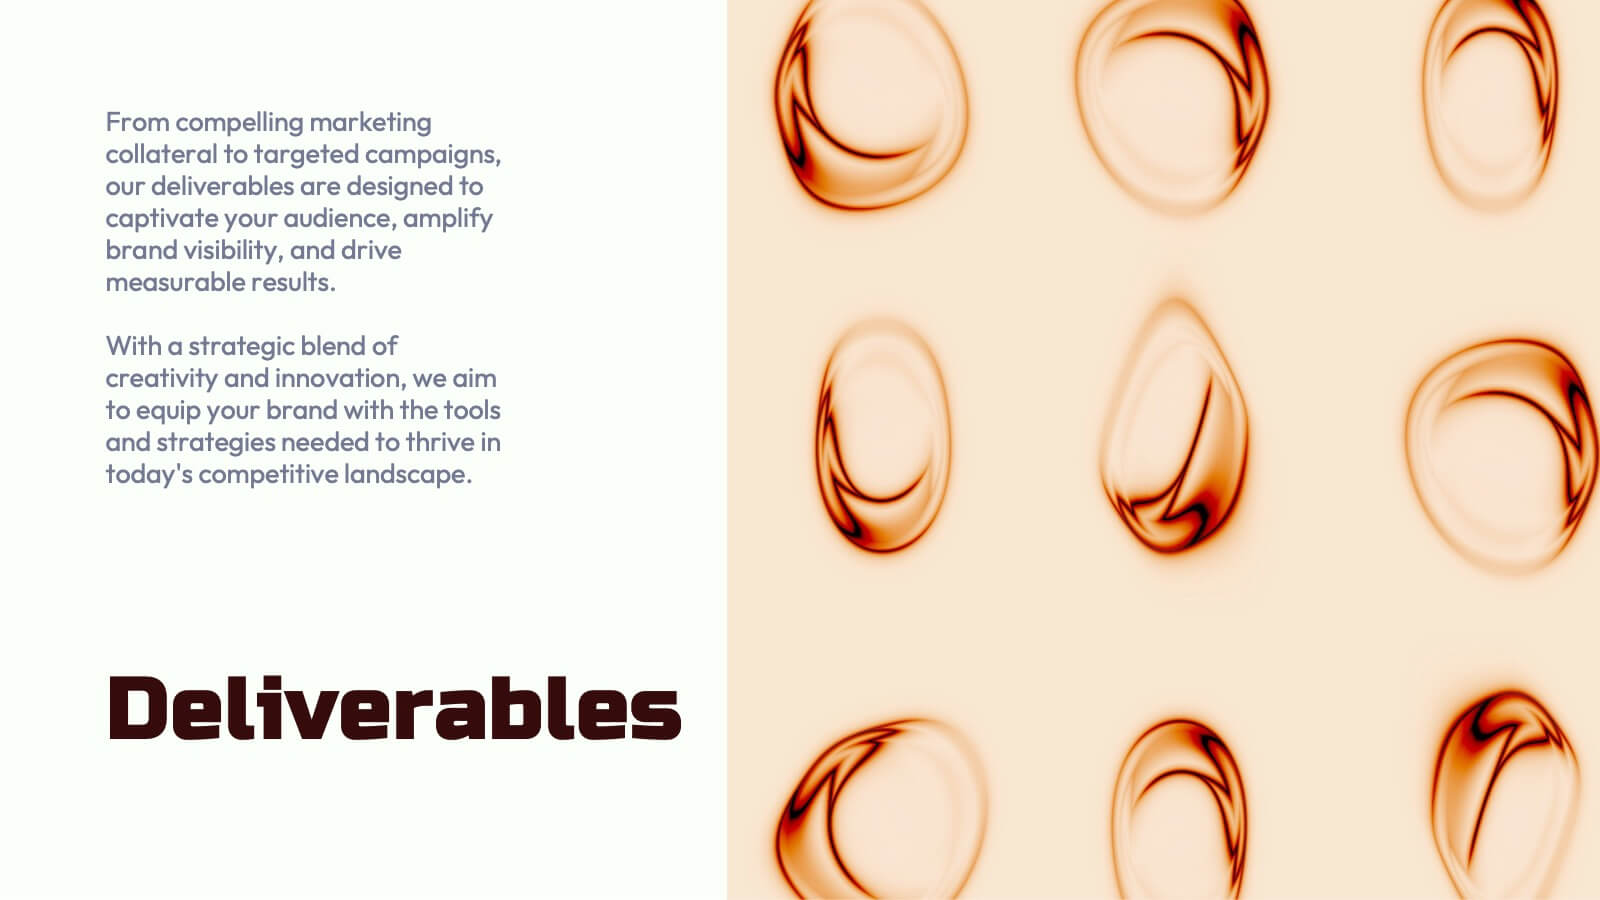
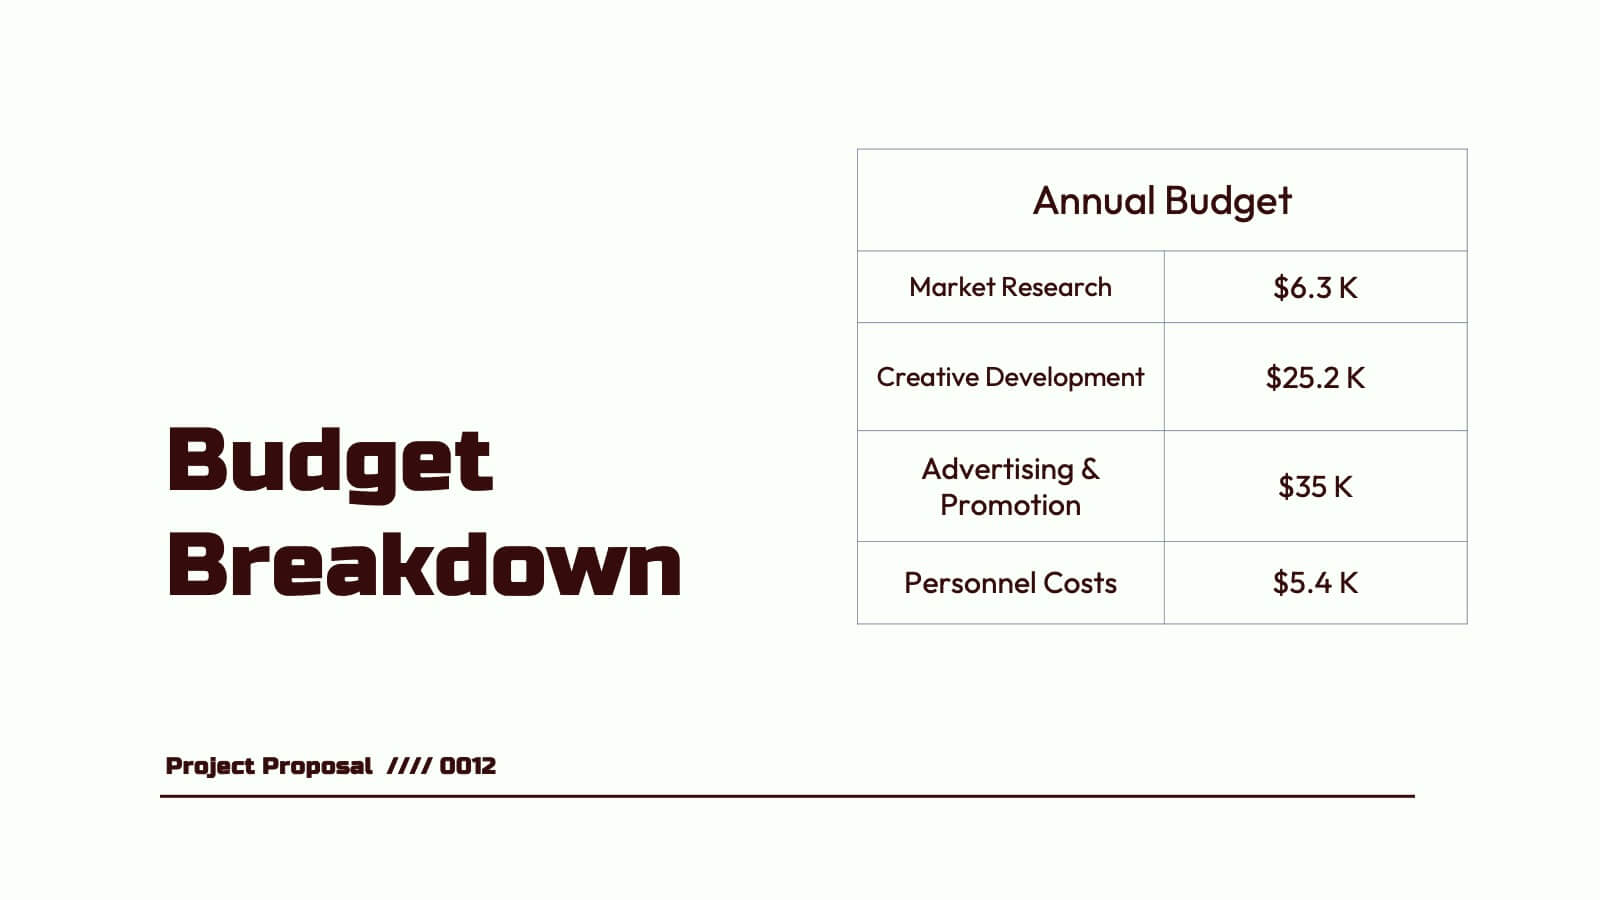
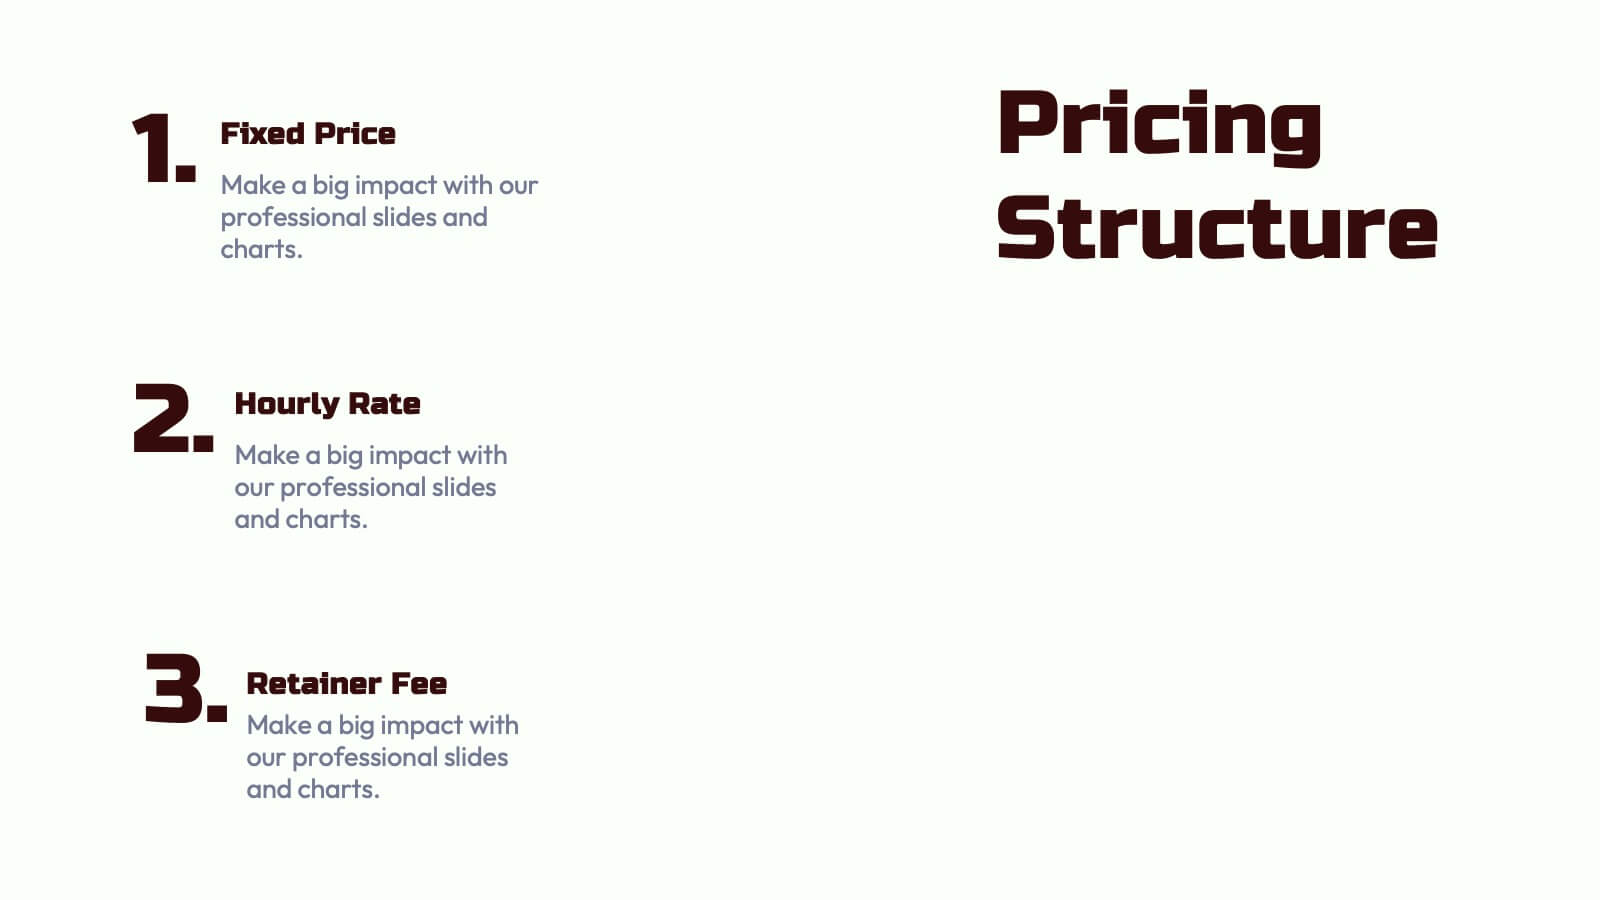
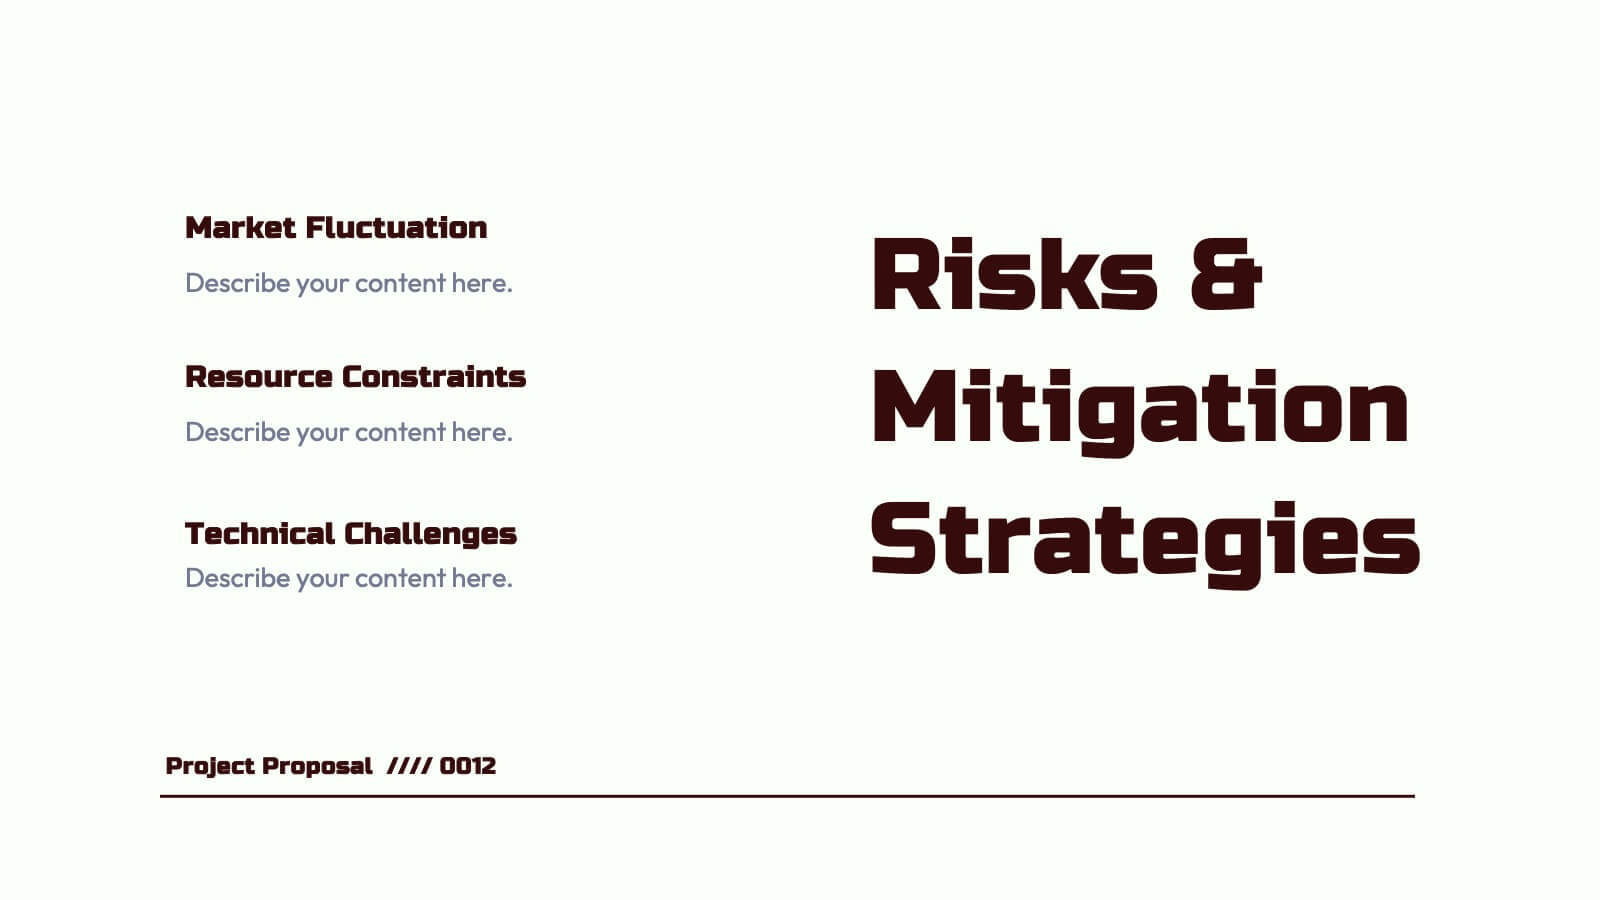
Nebula Project Proposal Presentation
Create a compelling project proposal with this structured, professional template! It includes sections for problem statements, proposed solutions, goals, timelines, and pricing. Perfect for organizing your ideas clearly and professionally, it's fully customizable and compatible with PowerPoint, Keynote, and Google Slides. This template makes it easy to present your proposals effectively and win clients.


6 diapositivas
Business Success Case Study
Showcase your brand's impact with this clean, image-forward case study slide. Designed for storytelling, it outlines the Problem, Solution, and Approach alongside a product image—perfect for client wins, pitch decks, and brand storytelling. Fully customizable in PowerPoint, Keynote, and Google Slides.


7 diapositivas
Demographic Traits Infographic
Dive deep into the world of demographics with our demographic traits infographic. Painted in hues of white, yellow, and blue, this infographic expertly visualizes population data within a map layout, ensuring a cohesive understanding of varied traits across regions. Tailored for market researchers, sociologists, business analysts, and educators, this tool is designed to make complex demographic data comprehensible and engaging. Whether you're using PowerPoint, Keynote, or Google Slides, our infographic will seamlessly fit, elevating the quality and clarity of your presentation.


7 diapositivas
Credit Card Services Infographic Presentation
Credit Cards help build your credit, they can be extremely convenient, and they can even earn awesome rewards. This Template can be used to highlight the various benefits of owning a credit card to the public. You can also use this to represent the different types of cards, product descriptions, and facts about credit cards. You can present your information through customizable icons, charts and graphs. This template is designed to illustrate Information about credit cards in an attractive way. Use this to develop creative presentations that will be interesting and promising for your audience.


2 diapositivas
Professional Proposal for Project Approval Presentation
Impress stakeholders and decision-makers with the Professional Proposal for Project Approval Presentation. Designed to guide your audience through key objectives and visual justifications, this clean, image-rich layout is ideal for startups, teams, and consultants. Fully customizable in PowerPoint, Keynote, and Google Slides.


26 diapositivas
Financial Literacy Simple Presentation
Our "Financial Literacy" template is a must-have for anyone teaching money management, savings, and investment strategies. Compatible with PowerPoint, Keynote, and Google Slides, it makes financial education accessible and engaging. Introduce the basics with "Financial Literacy: Creating a Smarter Tomorrow" and outline your agenda with the "Table of Contents." The "Meet Our Team" slide can spotlight your financial experts, and the "Three Option Slide" breaks down key concepts like budgeting, saving, and investing. The "This is your big image slide" can visualize financial goals, while "Earn, Save, Invest, Protect." reinforces sound financial habits. Use "This is your Chart Slide" to present data on spending patterns and "Brain Infographic" to explore the psychology of spending. The template's clean design and customizable features make it easy to tailor your financial literacy presentation to any audience, ensuring that your message on smart money management is clear and impactful.


6 diapositivas
Consumer Psychology in Marketing Presentation
Unlock the secrets of customer behavior with our 'Consumer Psychology in Marketing' presentation template. Tailored for marketing professionals, this template allows you to visually dissect and present consumer insights and behaviors. Engage your audience with compelling content that's perfect for workshops or client presentations, compatible with PowerPoint, Keynote, and Google Slides.


6 diapositivas
Construction Project Management Infographic
Construction project management is the process of planning, organizing, and overseeing construction projects from inception to completion. This infographic template is designed to showcase the essential elements and processes involved in managing a construction project. It is a concise and easy-to-understand visual representation of key aspects that play a vital role in successful project execution. This provides an overview of the project's key elements, progress, and success factors. This visually appealing infographic helps in effective communication, decision-making, and project monitoring throughout the construction process.


5 diapositivas
Breast Cancer Awareness Day
Raise awareness and educate with this visually impactful Breast Cancer Awareness Day template. Featuring circular infographic elements styled in a breast tissue-inspired layout, this slide design is ideal for campaigns, health education, corporate wellness events, and social initiatives. Each section can be customized with key data, statistics, or actionable messages. Fully editable in PowerPoint, Keynote, and Google Slides.


4 diapositivas
Sales Funnel Data Presentation
Turn your data into a clear story with a visual flow that shows exactly how leads move from one stage to the next. This presentation helps explain conversion steps, highlight drop-off points, and simplify complex marketing insights. It’s easy to customize and fully compatible with PowerPoint, Keynote, and Google Slides.


6 diapositivas
Workplace Safety and Compliance
Simplify safety protocols with this visual workplace compliance slide. Featuring a clear cone-style graphic and three editable sections, it's ideal for outlining procedures, regulations, and training checkpoints. Perfect for HR teams, safety briefings, and internal audits. Editable in PowerPoint, Keynote, and Google Slides.